1. Introduction
Tabernaemontana is a large, widespread Apocynaceae genus with more than 100 accepted species [
1].
Tabernaemontana pandacaqui is an indigenous species found in understory habitats in the wet tropics [
2]. The riparian and littoral forests in the Philippines frequently contain
T. pandacaqui trees [
3,
4]. Mariana Island
Tabernaemontana plants were lumped with
T. pandacaqui in the past, but
T. rotensis is now recognized as an endemic species from Guam and Rota [
5,
6].
A considerable body of literature exists on phytochemical screening and pharmacological activity of
Tabernaemontana species [
7,
8], and
T. pandacaqui is among the species that have been studied. However, research on
T. pandacaqui horticulture and ecology is lacking. One study indicated greater than 90% germination is achievable by removing all fruit tissue from seed surfaces and scarifying with sand paper [
9]. Applied research is also minimal for
T. rotensis. Full sun conditions generated better germination of
T. rotensis seeds than shaded conditions, but seedling growth resulted in similar plant height for light levels from 25% to 100% of incident light [
10]. The leaves of this small tree contained greater concentrations of manganese, nickel, and chromium than leaves of 24 sympatric plant species from northern Guam [
11], including two other Apocynaceae species. Defoliation of
T. rotensis trees generated mast flower production about one month and mast fruit production about four months after the defoliation event [
12]. Stem carbon dioxide efflux of
T. rotensis exhibited a diel pattern with greater efflux during the photoperiod than night hours [
13]. Clearly, applied research opportunities have not been pursued adequately for these two closely related
Tabernaemontana species.
The plant diversity of mixed tropical forests is mediated by competition for resources, and light has been one of the most heavily studied resources in this research agenda. Inter-species differences in responding to the resource limitations in shaded habitats and the excessive light in full sun habitats are factors that contribute to forest regeneration, recruitment, coexistence, and succession [
14,
15,
16,
17,
18,
19]. Collective outcomes of this research agenda confirm that working knowledge of phenotypic plasticity in biomass allocation and leaf functional traits is needed to understand strategies for performing in a given environment. Shade tolerance is achieved by functional traits such as maximizing light interception, light use efficiency, and reduced respiration, whereas sun tolerance is achieved by maximizing photosynthesis per unit leaf area and developing approaches to mediate the excessive energy [
20,
21,
22,
23,
24].
Tabernaemontana species have not been included in research addressing the light-dependent plasticity of functional traits. My objectives were to compare
T. pandacaqui and
T. rotensis trait plasticity to sun and shade conditions in order to begin gaining a mechanistic understanding of how these species compete in a mixed forest. Since
T. pandacaqui is typically found in shaded habitats [
2,
25] and
T. rotensis grows in open and shaded habitats [
6], I hypothesized that
T. rotensis would exhibit biomass allocation and leaf physiology traits that enable better performance in sun and inferior performance in shade when compared with
T. pandacaqui. I also hypothesized that these dynamics would reveal greater phenotypic plasticity in
T. rotensis than in
P. pandacaqui. The results provide insights into how resource managers may best use these two species in mixed forest settings such as afforestation and conservation restoration.
2. Materials and Methods
The research site was a conservation nursery and germplasm garden in Barangay Sapang Bato, Angeles City, Philippines located at 15.165° N, 120.505° E at 234 masl. Climate is classified as Köppen Am, with a mean temperature of 29.7 °C, monthly rainfall of 9.4 cm, and mean relative humidity of 82.7%. Saplings in a container nursery were used to determine light response curves to characterize the dependence of leaf net carbon dioxide assimilation (Pn) on incident photosynthetic photon flux density (PPF). Juvenile trees in an ex situ germplasm field site were used to characterize diurnal patterns of gas exchange and chlorophyll fluorescence traits. Seedlings in a container nursery were used to determine biomass allocation under sun and shaded conditions.
2.1. Nursery Bench Construction and Plant Material
Twelve Quonset-style structures with a height of 1 m were constructed in February 2018 on top of raised nursery benches to provide 24% or 100% ambient light conditions. Each structure was first covered with clear plastic film to exclude rainfall; then, shading was achieved by covering six of the structures with neutral-woven polyethylene fabric. The amount of PPF within each structure was measured using a quantum sensor (SKP200 quantum sensor, Skye Instruments, Llandrindod Wells, Powys, UK) oriented perpendicular to the solar beam, and the two shade treatments were 24% or 100% of ambient sunlight. Typical midday PPF was 2100–2200 μmol·m−2·s−1 for the 100% and 500–530 μmol·m−2·s−1 for the 24% treatment structures. The shade fabric on shaded structures extended to the bench top on the east and west sides of each structure. There were six replications of each light intensity arranged in a completely randomized design.
One seedling of T. rotensis and one seedling of T. pandacaqui were placed under each of the structures on 14 February 2018. The T. rotensis plants were derived from open-pollinated fruits on mature trees in the germplasm garden, and the source trees originated from the northeast coast of Guam. The T. pandacaqui plants were produced from seeds that were harvested in Castillejos, Zambales, Philippines. The plants grew in 2.6 L containers and were 25–33 cm in height. The container medium consisted of locally sourced washed river sand. The plants were irrigated every other day. Plant nutrition was provided by weekly drenches of 100 mL per container of a complete nutrient solution (Excel, Everris, North Charleston, SC, USA) with a concentration to provide 7.5 mM nitrogen.
2.2. Light Response Curves
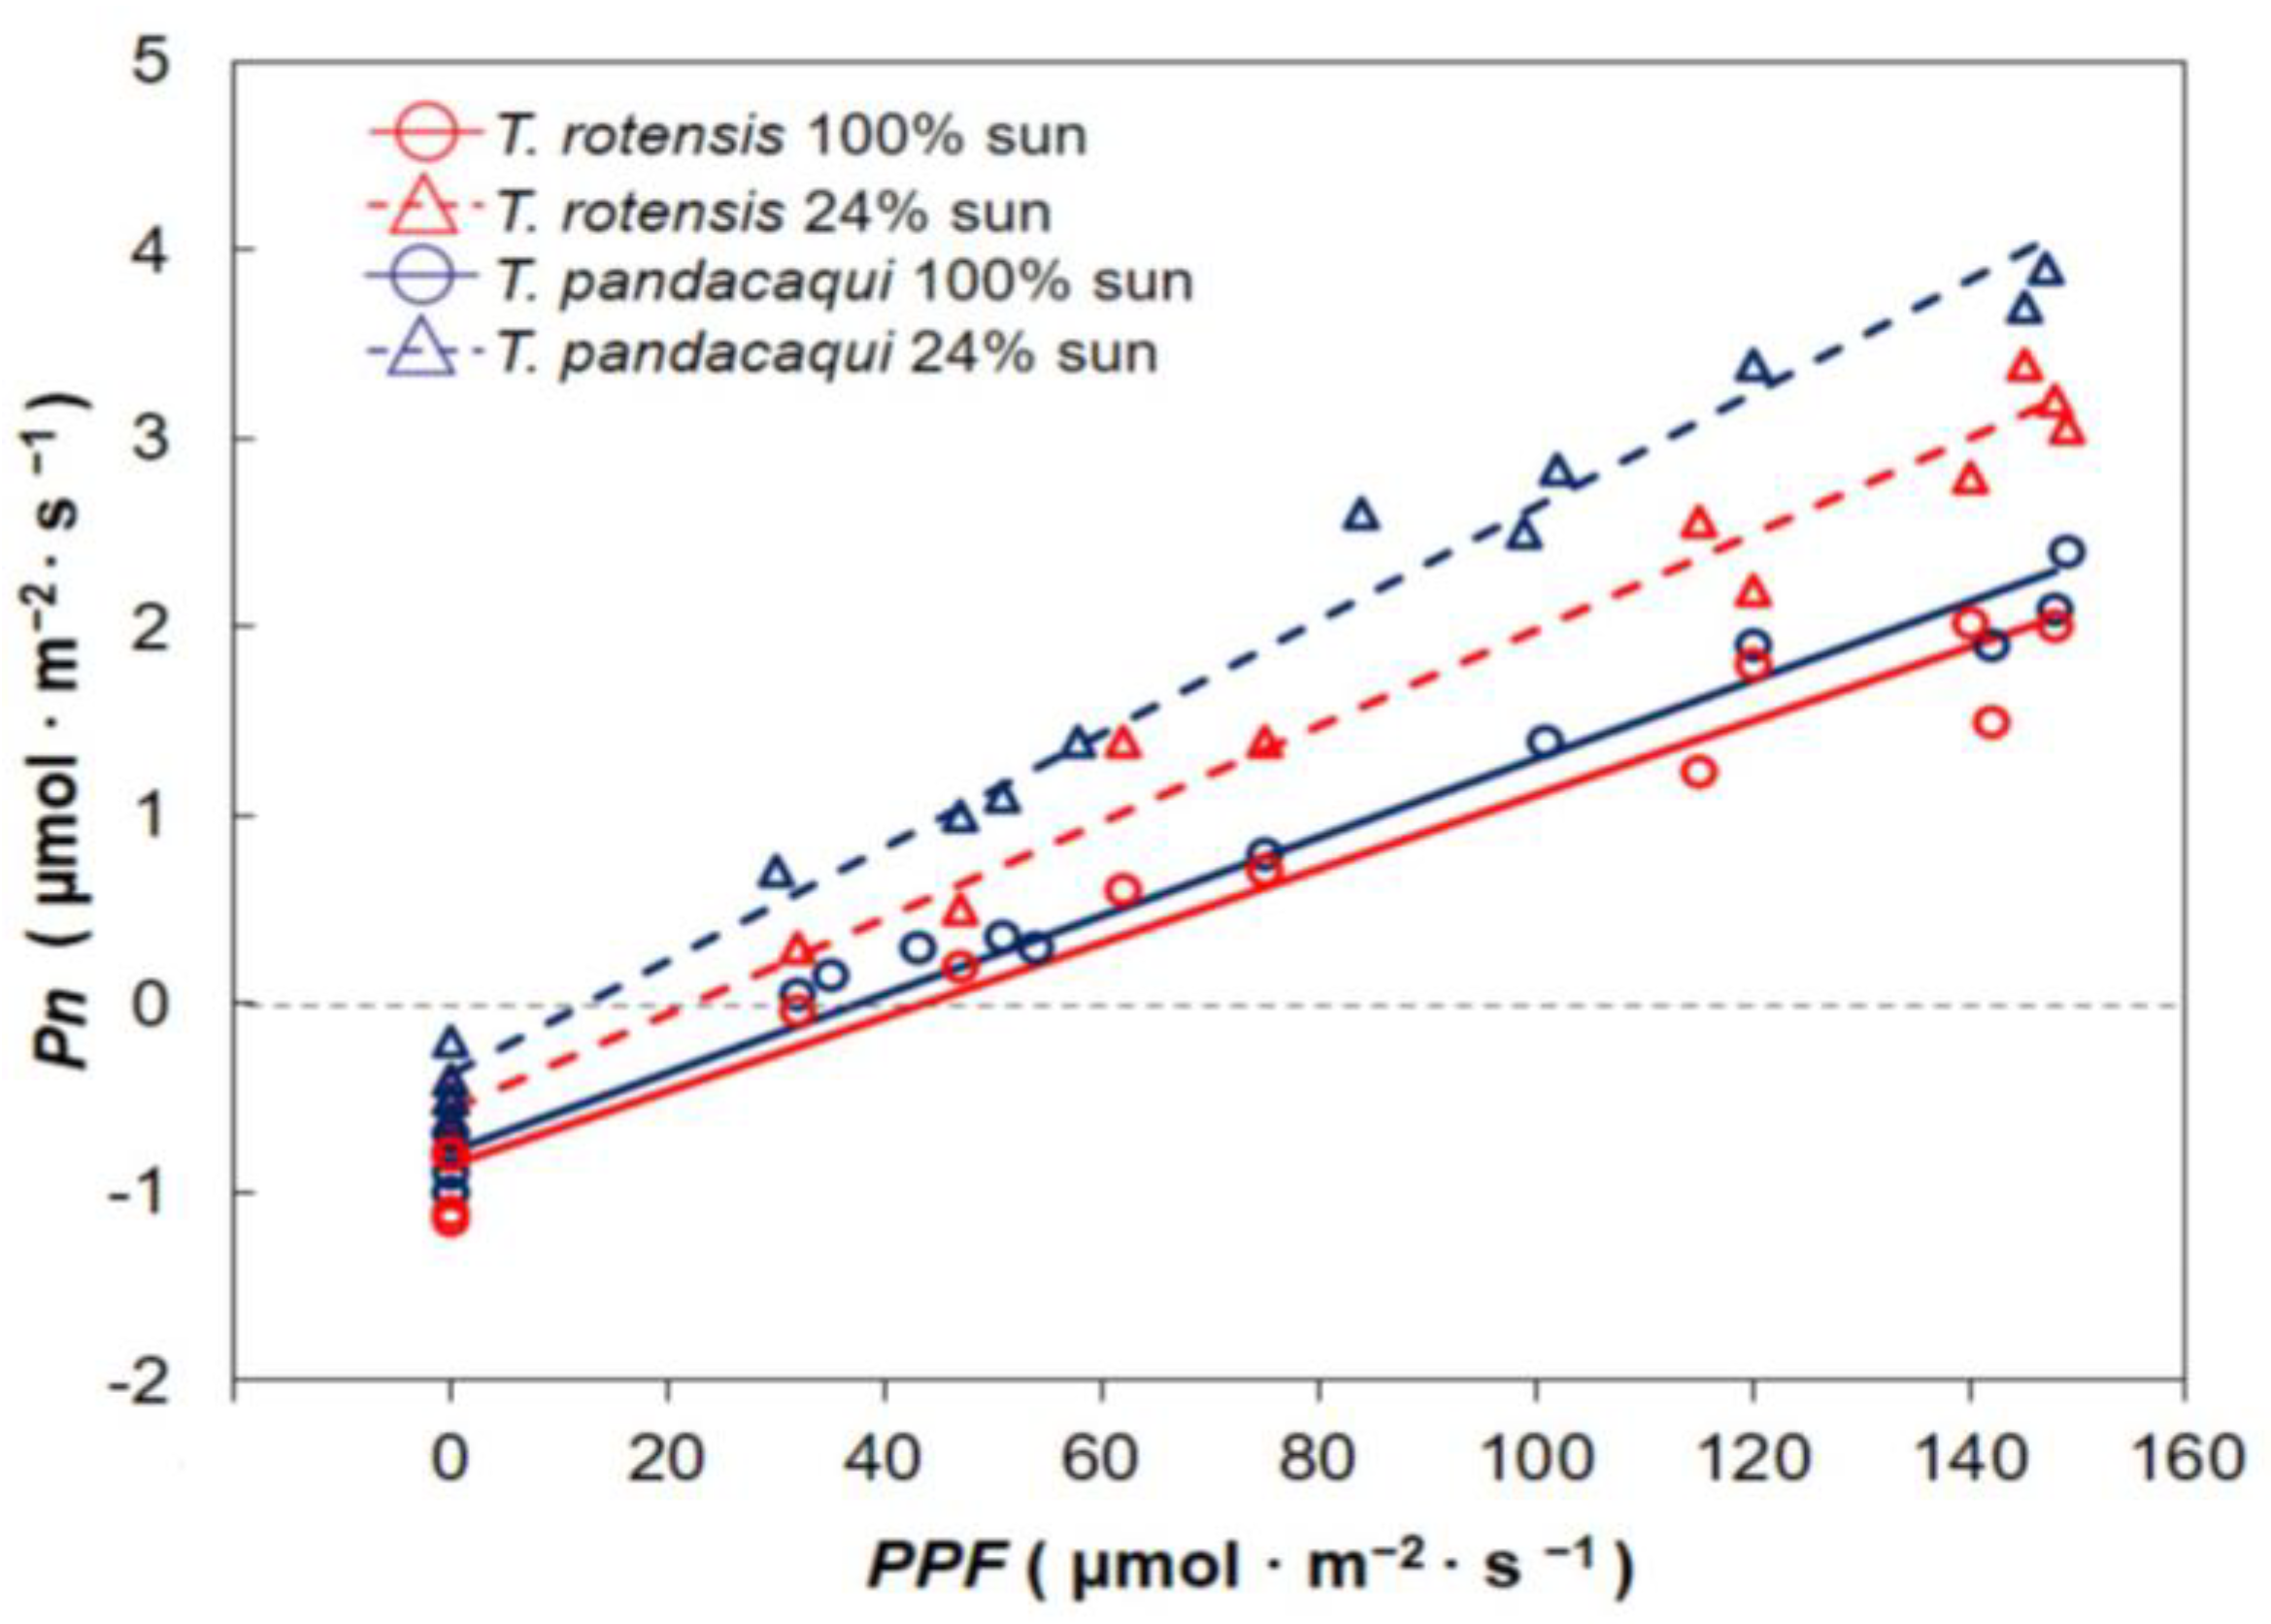
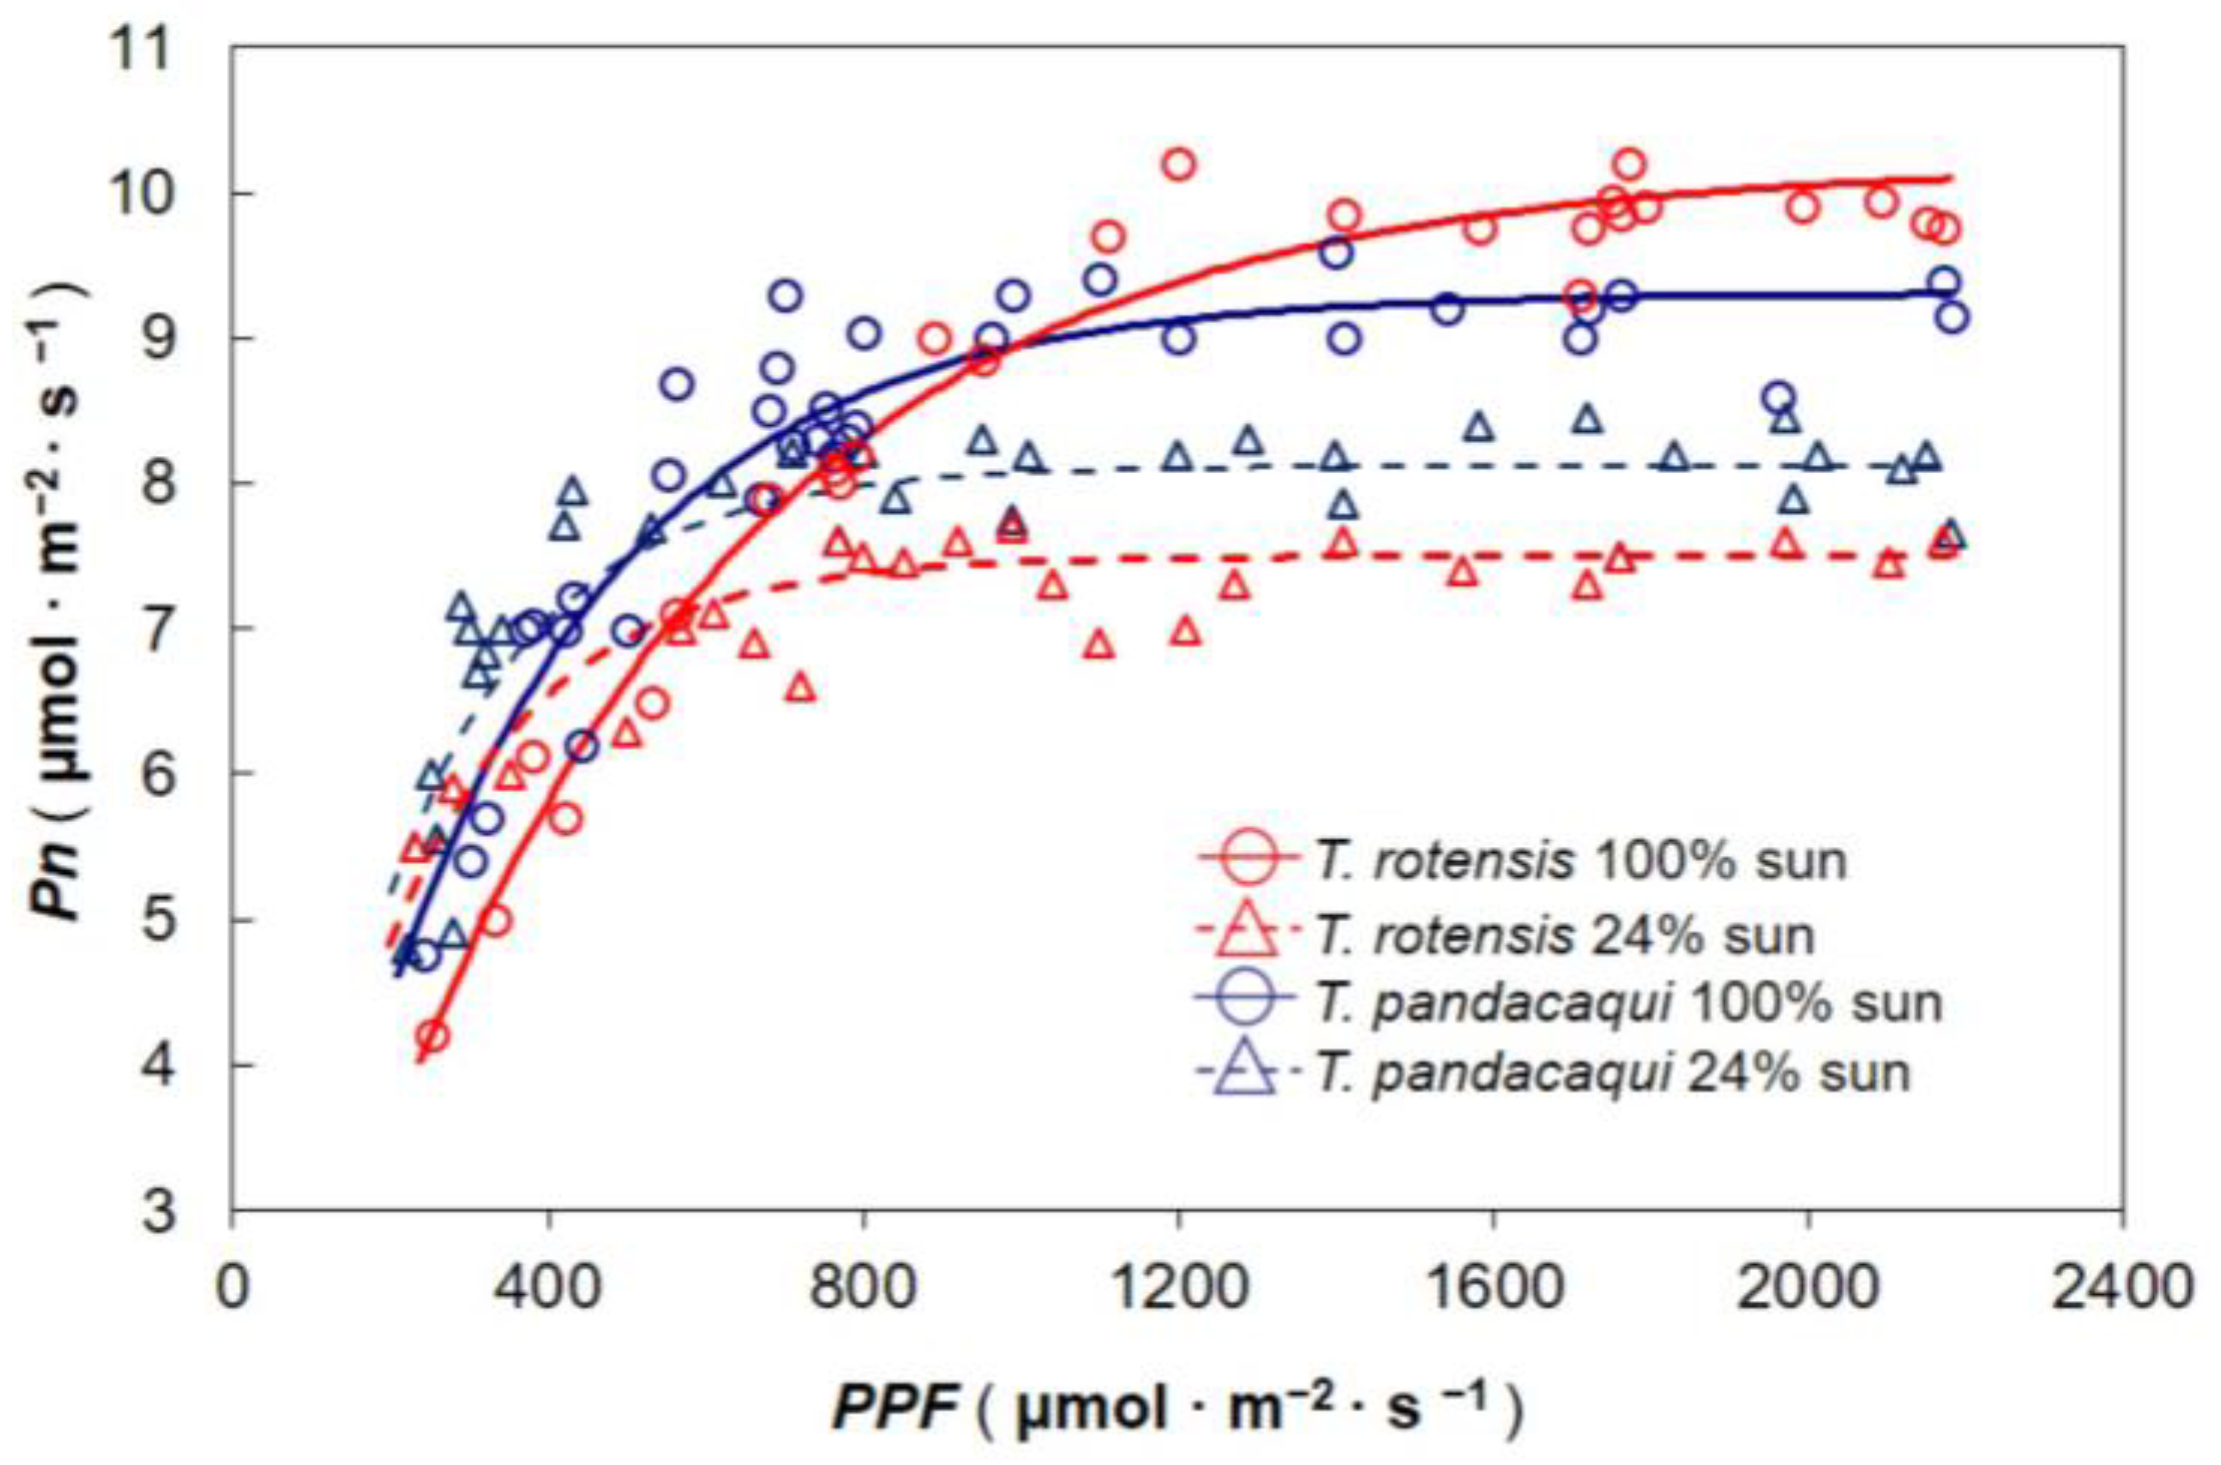
The influence of developmental light level on response of Pn to incident PPF was determined during mid-morning hours of 17–20 April 2018. Most seedlings had at least three fully expanded leaves that had developed under the experimental light treatments. The youngest fully expanded leaf on each seedling was exploited for gas exchange measurements. Whole plants were exposed to a range of PPF conditions by placing them under various shade levels using shade fabric, generating measurements of Pn across a PPF range of 175 to 2180 μmol·m−2·s−1. A 10 min period of adjustment was allowed for each seedling at each new PPF before recording A. A CIRAS-2 portable open-flow system fitted with a PLC6(U) cuvette was used for the gas exchange measurements (PP Systems, Amesbury, MA, USA). The reference carbon dioxide was 400 µmol·mol−1, the air flow rate was 250 mL·min−1, and the temperature was 28–31 °C. The response curves were fitted with the PROC NLIN procedure of SAS (SAS Institute, Cary, NC, USA) with the model A = a × (1 − e−b×PPF). In this model, a represents maximum Pn and b represents the speed of curvature. The data from each replication were fitted separately.
Three containers of each species were transferred to an open-air laboratory at 0700 HR on 21 and 22 April 2018 to determine the response of Pn to PPF under controlled conditions of 0 to 175 μmol·m−2·s−1. Light was supplied by a panel of 50 W LED lamps suspended above a thermal-filtering water bath, and the desired PPF was achieved by varying the distance of the leaf cuvette from the lamps and shading with layers of shade fabric. Dark respiration was determined by inserting a leaflet into the chamber and enclosing the entire chamber in several layers of black plastic for 15 min. Preliminary data indicated there were no changes in Rd for longer periods of darkness for these two species. Gas exchange was measured as previously described. The reference carbon dioxide was 400 µmol·mol−1, the air flow rate was 250 mL·min−1, and the temperature was 28–29 °C. The linear response models were fitted for each replication with the PROC GLM procedure of SAS.
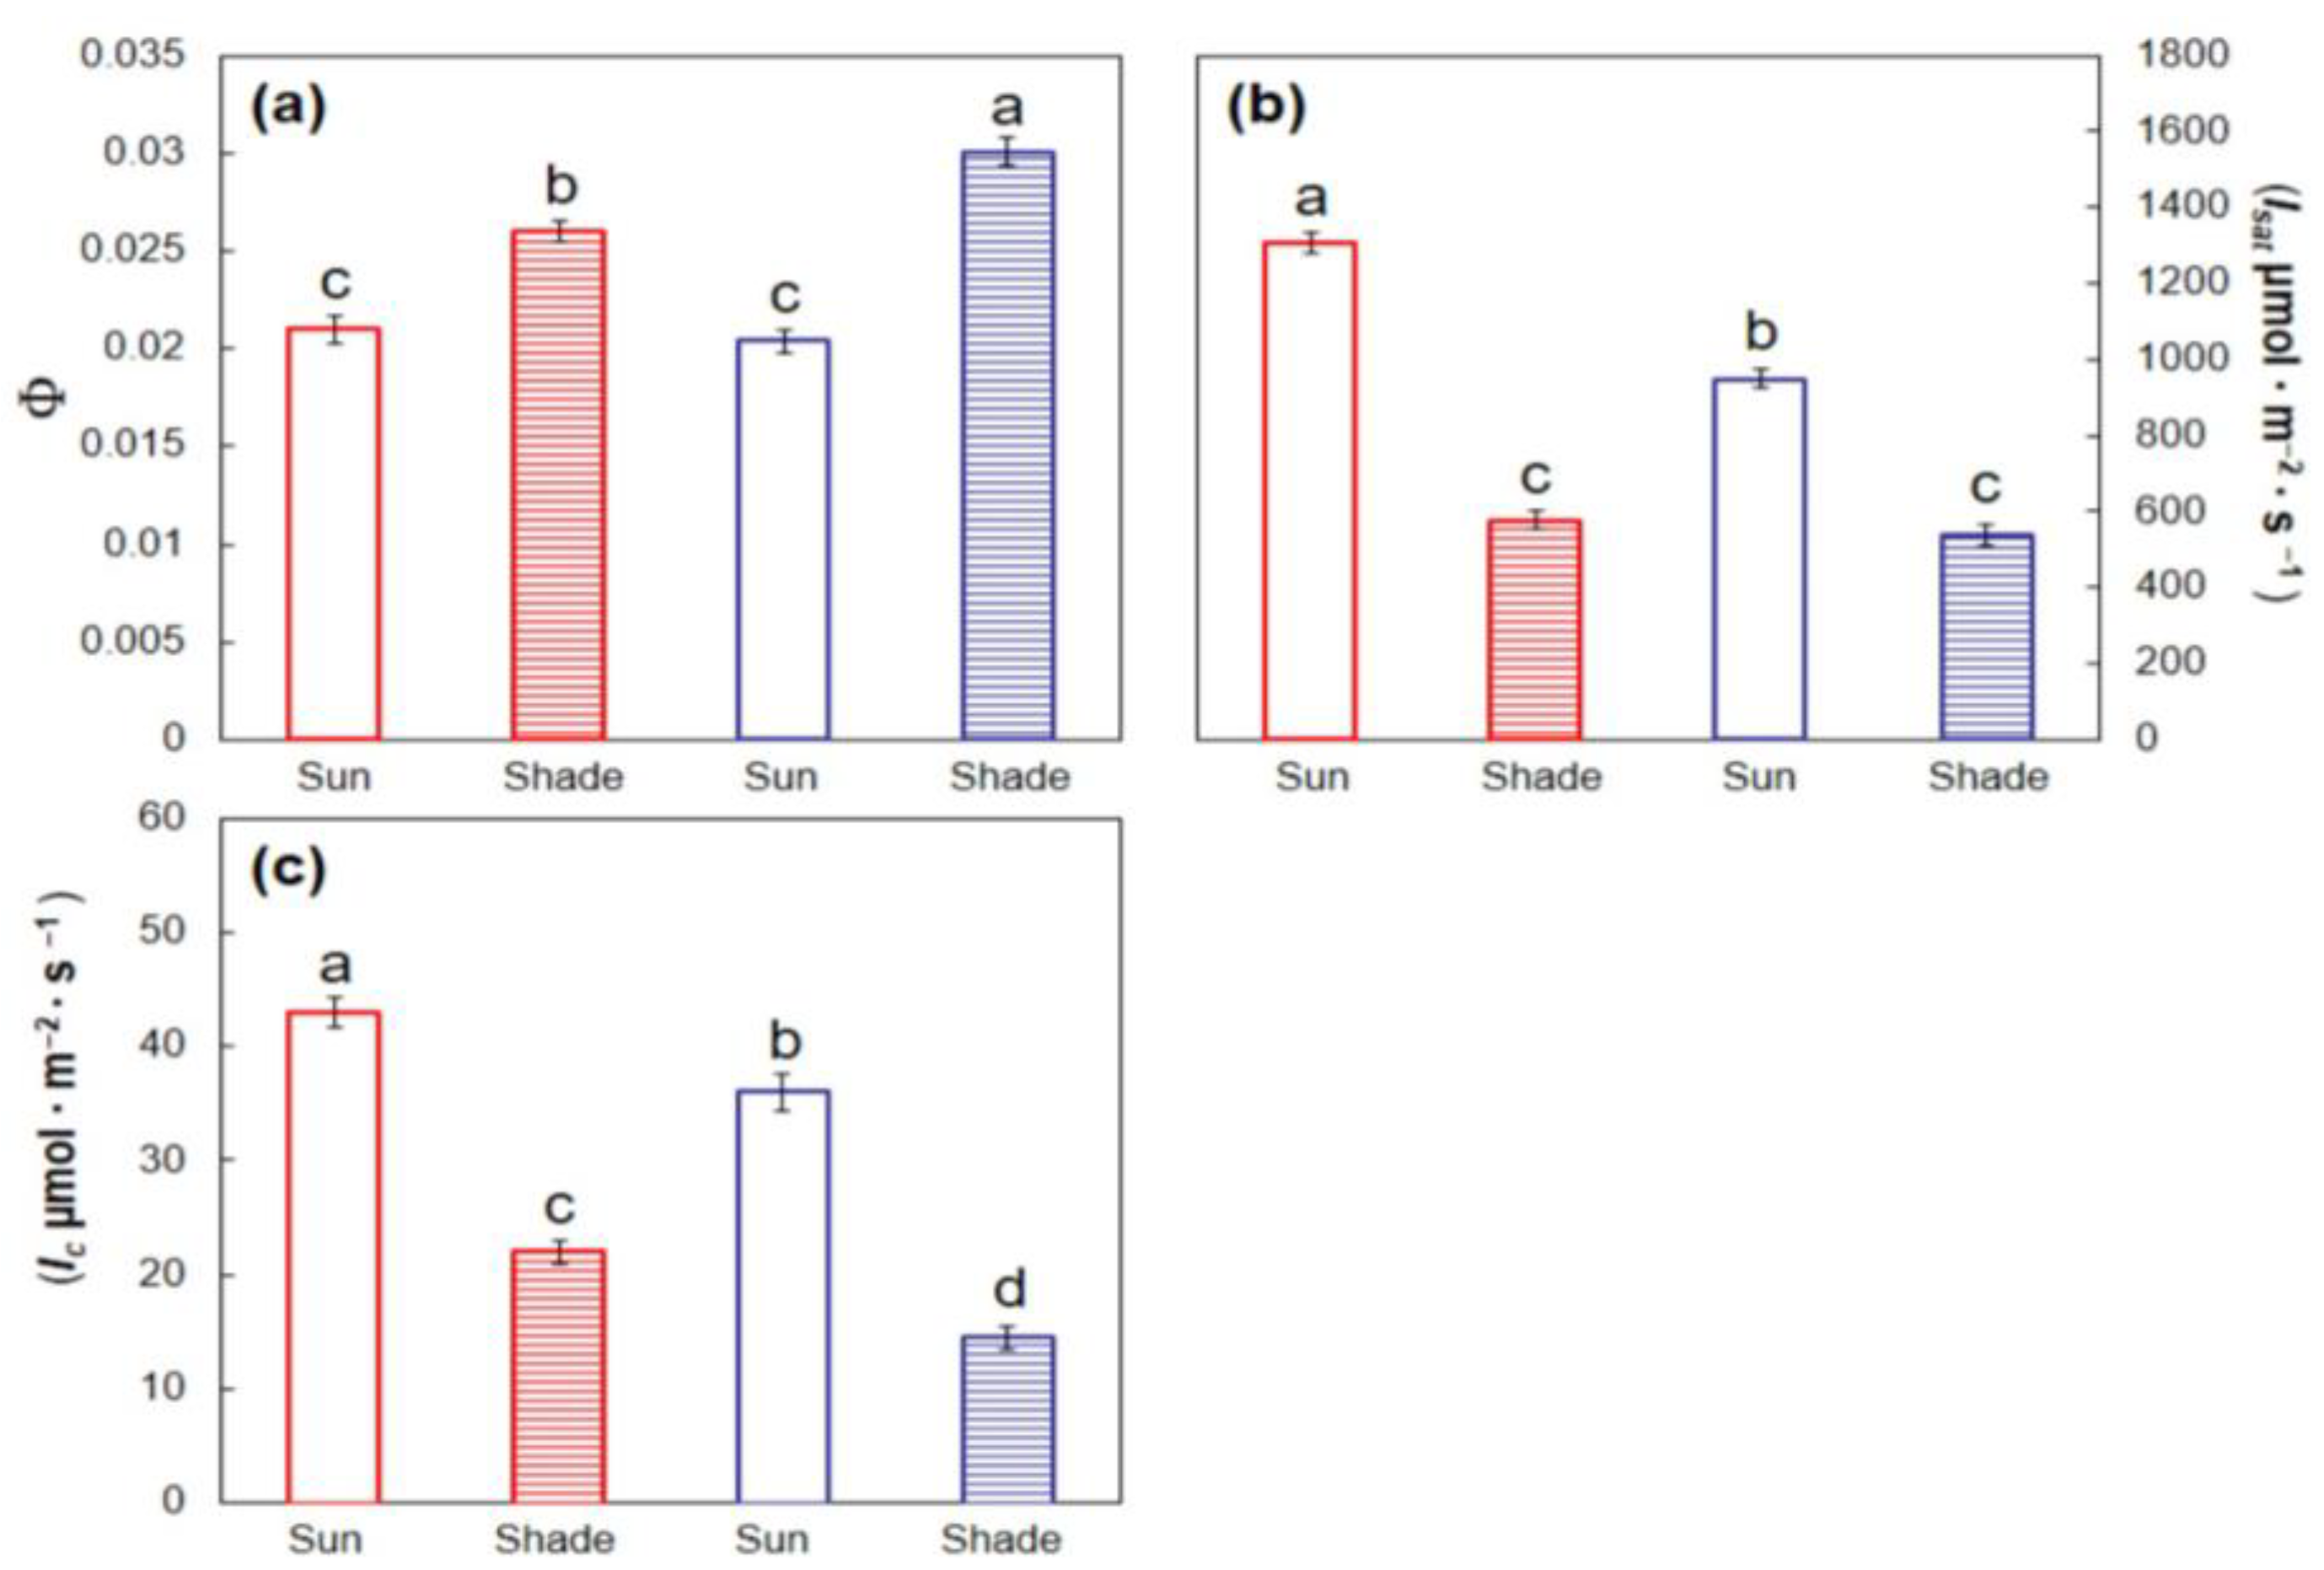
Each replication’s light response models were used to individually calculate several leaf traits. The slope of the lines from the 0 to 175 μmol·m−2·s−1 data was considered as the apparent quantum yield (Φ), and the PPF at which each line crossed the horizontal axis was considered as the light compensation intensity (Ic). Light saturation intensity (Isat) was estimated from the models generated from the 175 to 2180 μmol·m−2·s−1 data as 95% of maximum Pn. These response variables were subjected to two-way analysis of variance (SAS) to determine differences among the two species, two developmental light treatments, and the interaction between these two factors. Pairwise comparisons for significant response variables were conducted with Tukey’s honest significant difference.
2.3. Diurnal Patterns
Juvenile trees of
T. rotensis and
T. pandacaqui were used as experimental units to study diurnal patterns in leaf traits. The soils were coarse loamy, isohyperthermic, Typic Untipsamment. The
T. rotensis trees were 2.4–2.9 m in height, and the
T. pandacaqui trees were 1.6–2.3 m in height. The
T. rotensis trees were from the same source as described in
Section 2.1, and the
T. pandacaqui trees were produced from seeds that were harvested in Orion, Bataan, Philippines. The shade treatments were enabled by construction of cube-shaped framing suspended on supports that were inserted into the soil. All of the framing was constructed from bamboo stakes on 14 December 2018, and each structure was positioned to cover two stem apices in the south perimeter of each canopy. Cubicle frames with 70 cm dimensions were covered by shade fabric to provide 24% sunlight transmission treatment. There were six trees of each species, and the leaves used for 100% sunlight transmission leaf physiology measurements were selected from apices adjacent to the shaded structures.
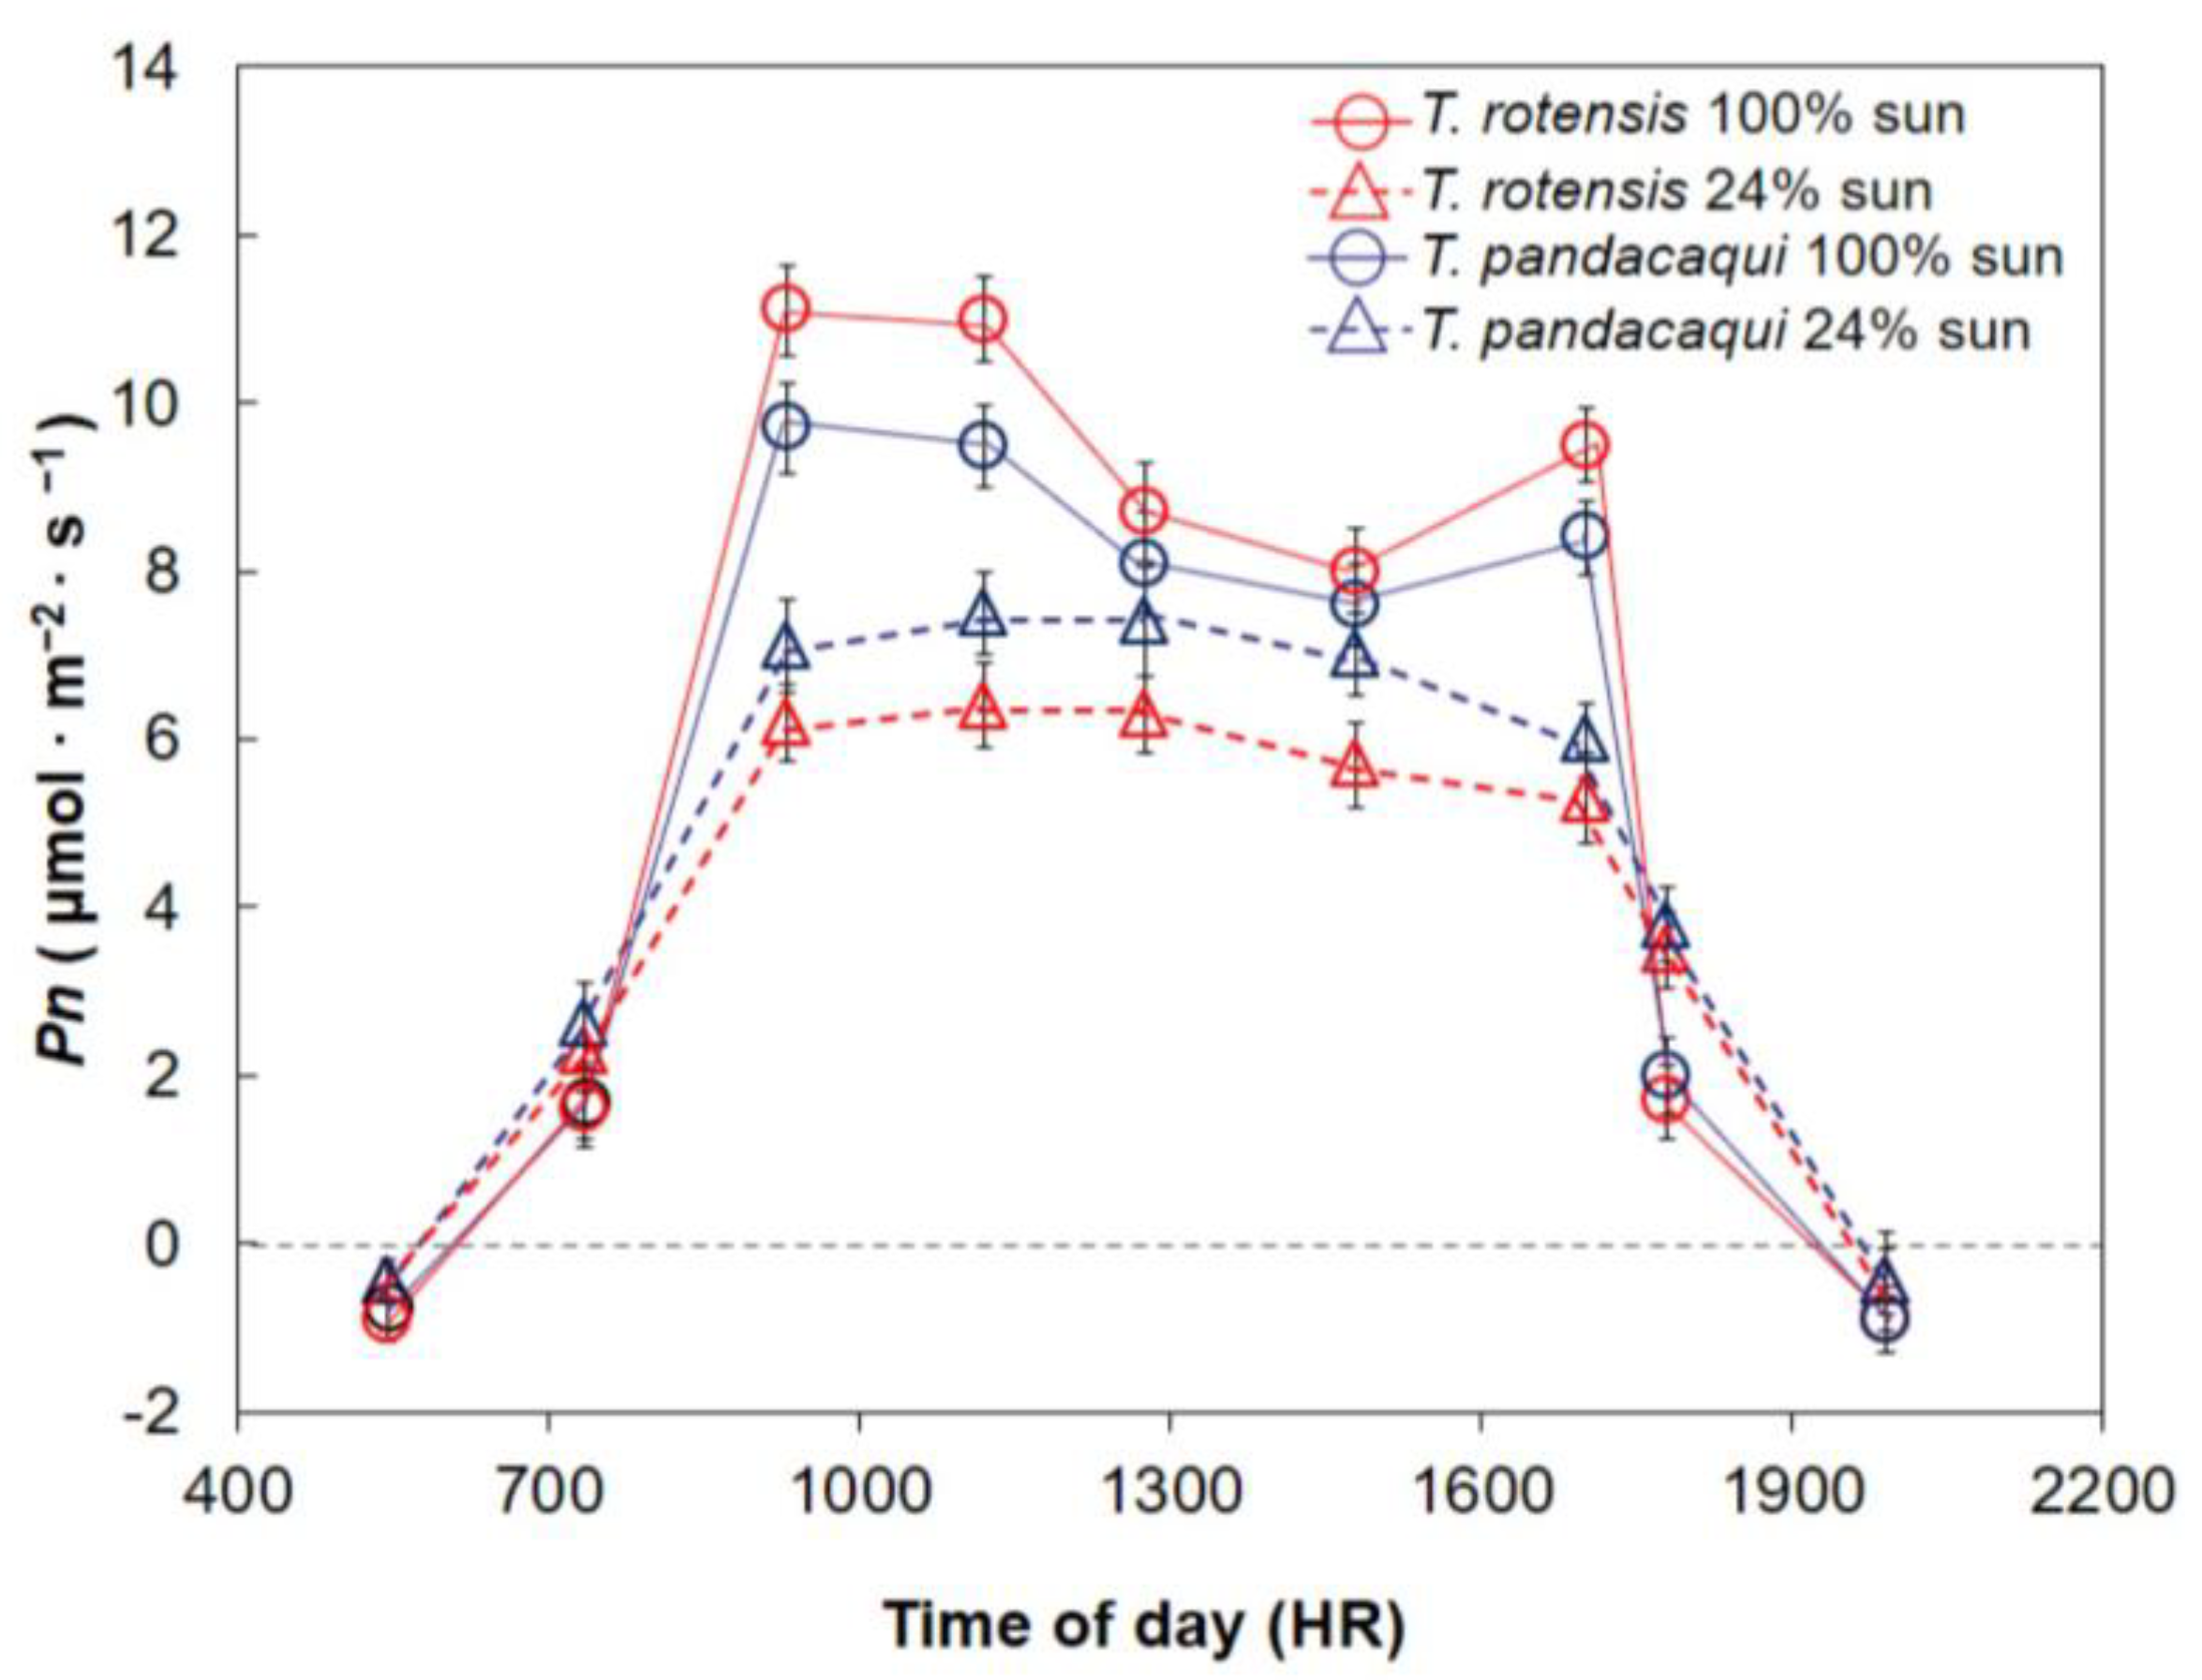
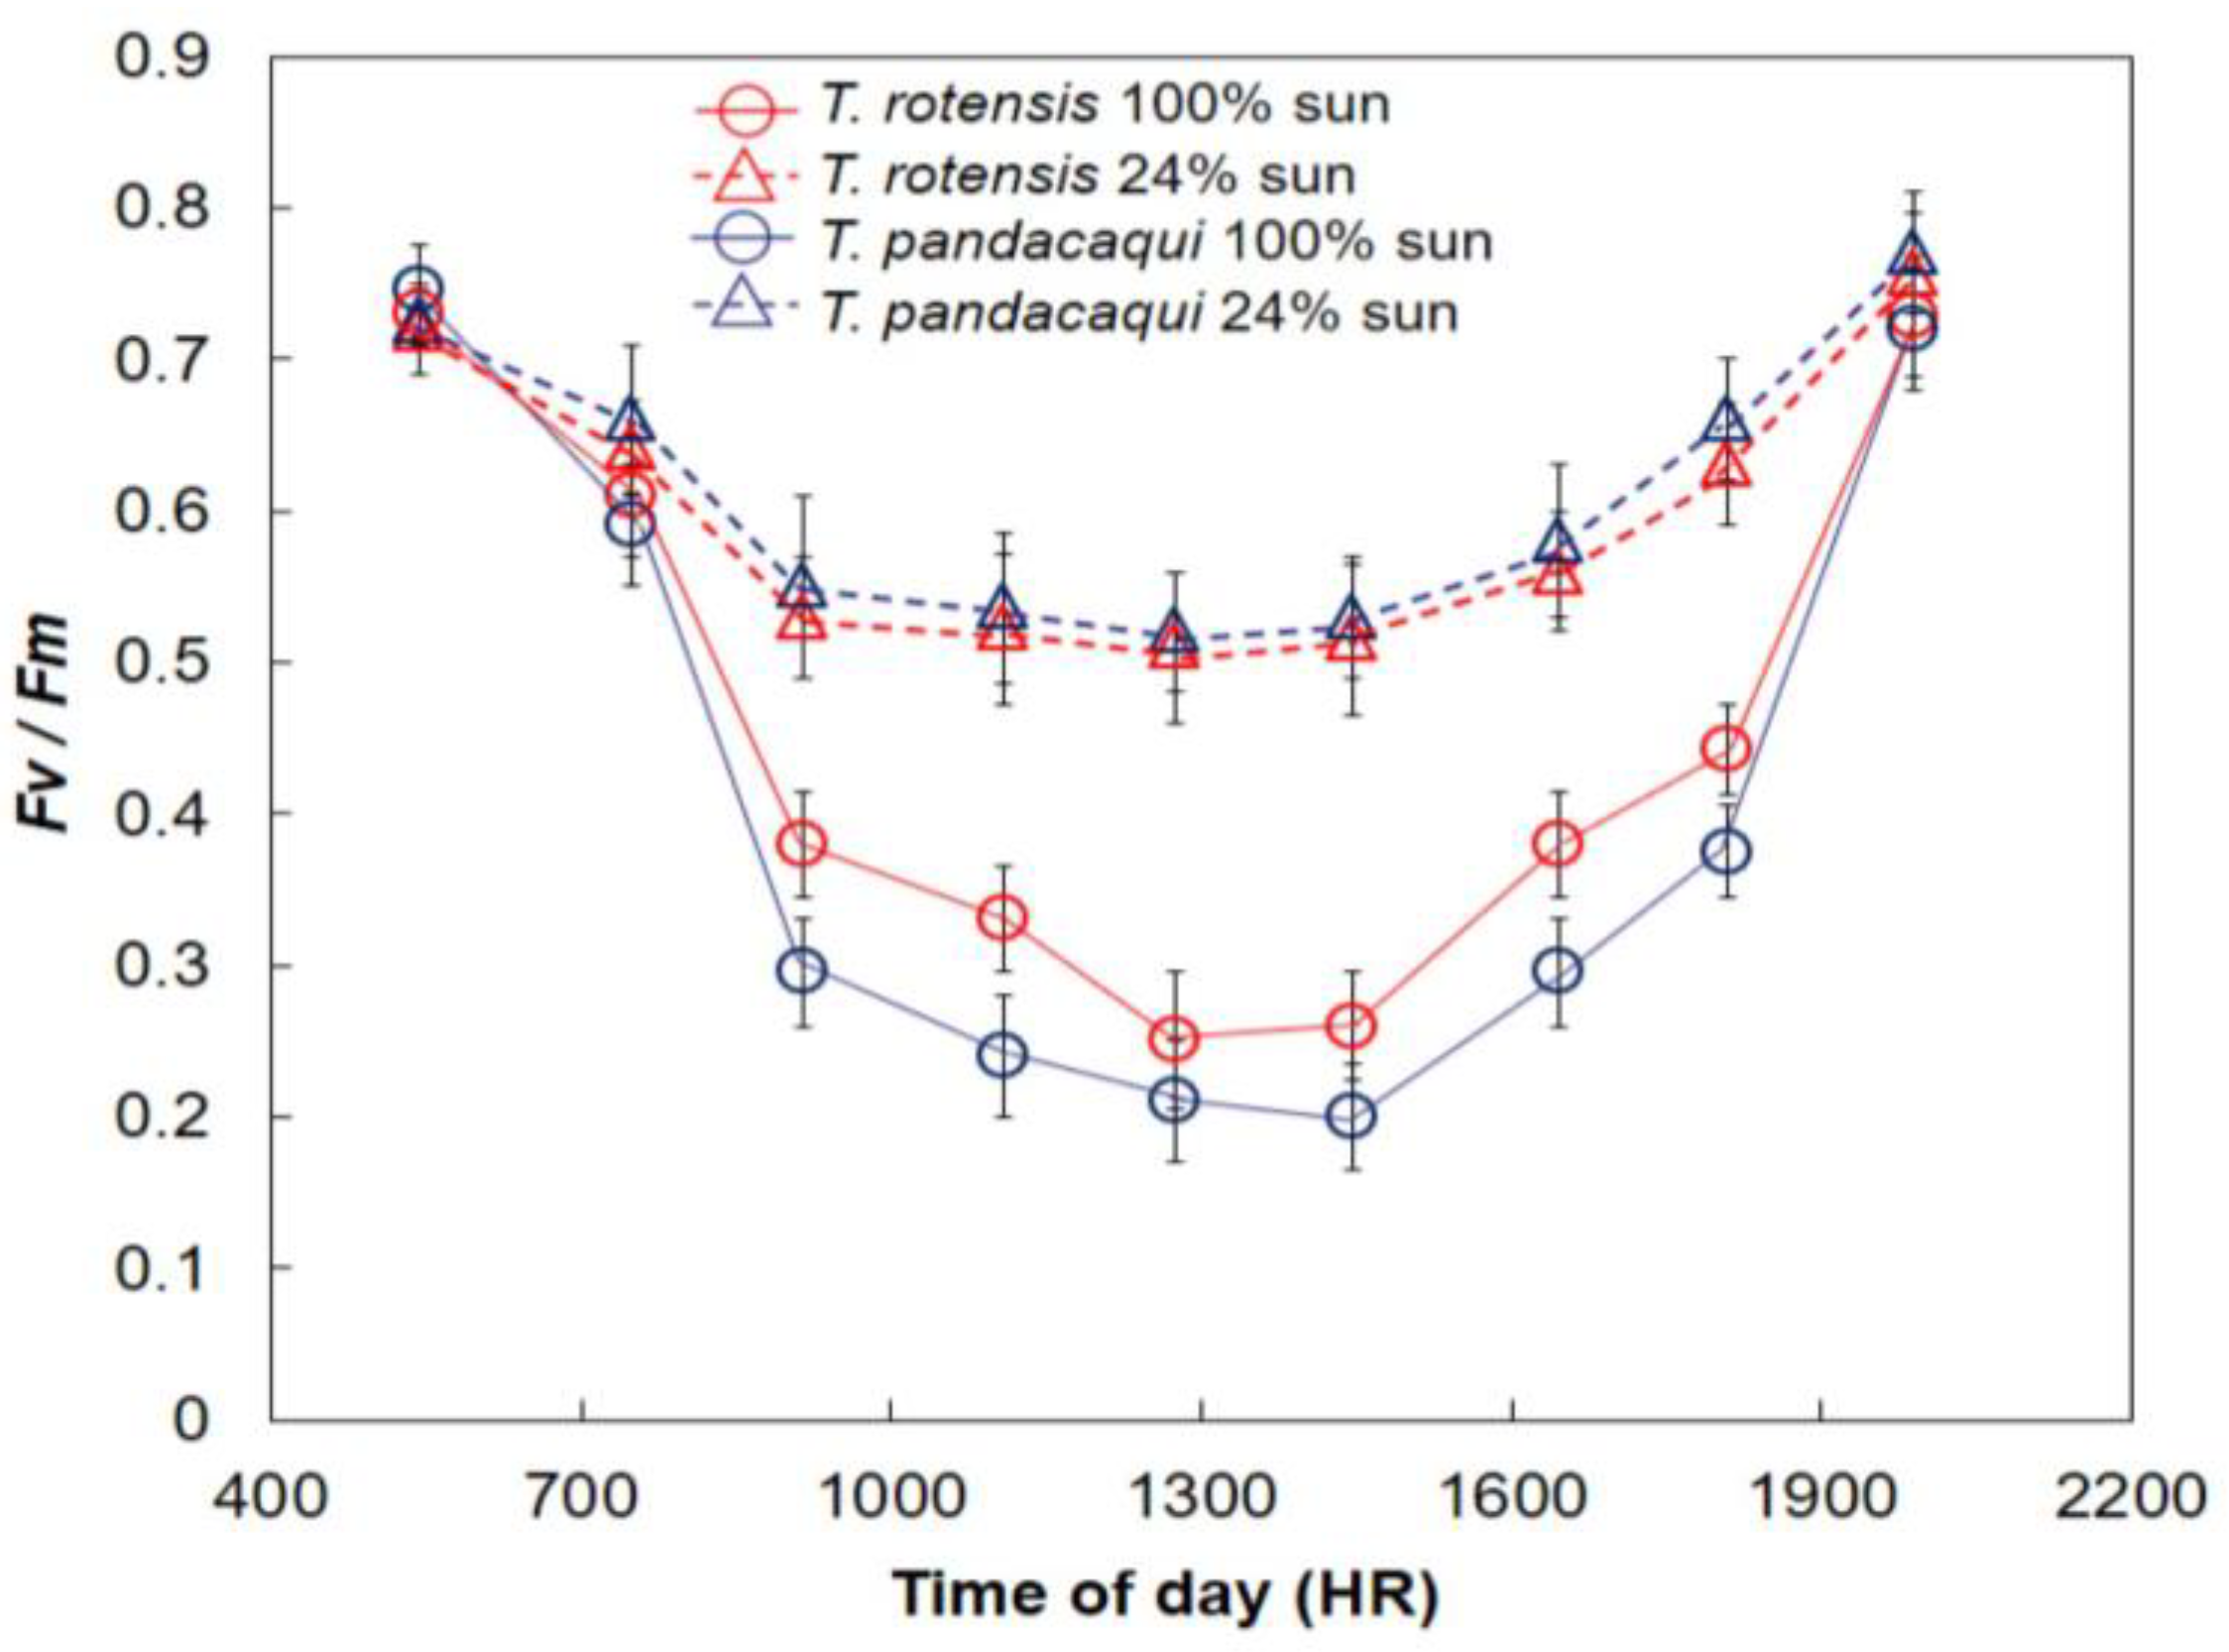
The gas exchange (CIRAS-2) and chlorophyll fluorescence (FMS-2 pulse-modulated fluorometer; Hansatech, Norfolk, United Kingdom) of Tabernaemontana leaves were quantified beginning pre-dawn and continuing at ≈2 h intervals until after sunset. The gas exchange measurements were conducted as previously described. The fluorescence measurements were made at ambient temperature on the adaxial surface of recently matured leaves. A 30 min period of darkness was provided by the system cuvettes before each measurement; then, the maximum photochemical quantum yield of PSII (Fv/Fm) was calculated using the system’s software. The first date was 13 February 2019, but the measurements were stopped due to late morning rainfall. Diurnal measurements began again on 14 and 15 February 2019, but these dates were also not usable due to heterogeneous cloud conditions that occurred at midday. The diurnal measurements were successfully carried out on 16 February 2019 with mostly sunny conditions throughout the entire photoperiod. The relative humidity on this day was 82% during pre-dawn hours, 49% during midday hours, and 68% after sunset, as quantified by a sling psychrometer. Air temperature as recorded by the CIRAS-2 ranged from 21 °C during pre-dawn hours, 31 °C during midday hours, and 24 °C during the final post-sunset measurements. The trees were located in various locations within the footprint of the ex situ germplasm garden, but the measurements were made alternating between trees of each species to ensure that minor influences of time within each measurement period were homogeneous for the two species.
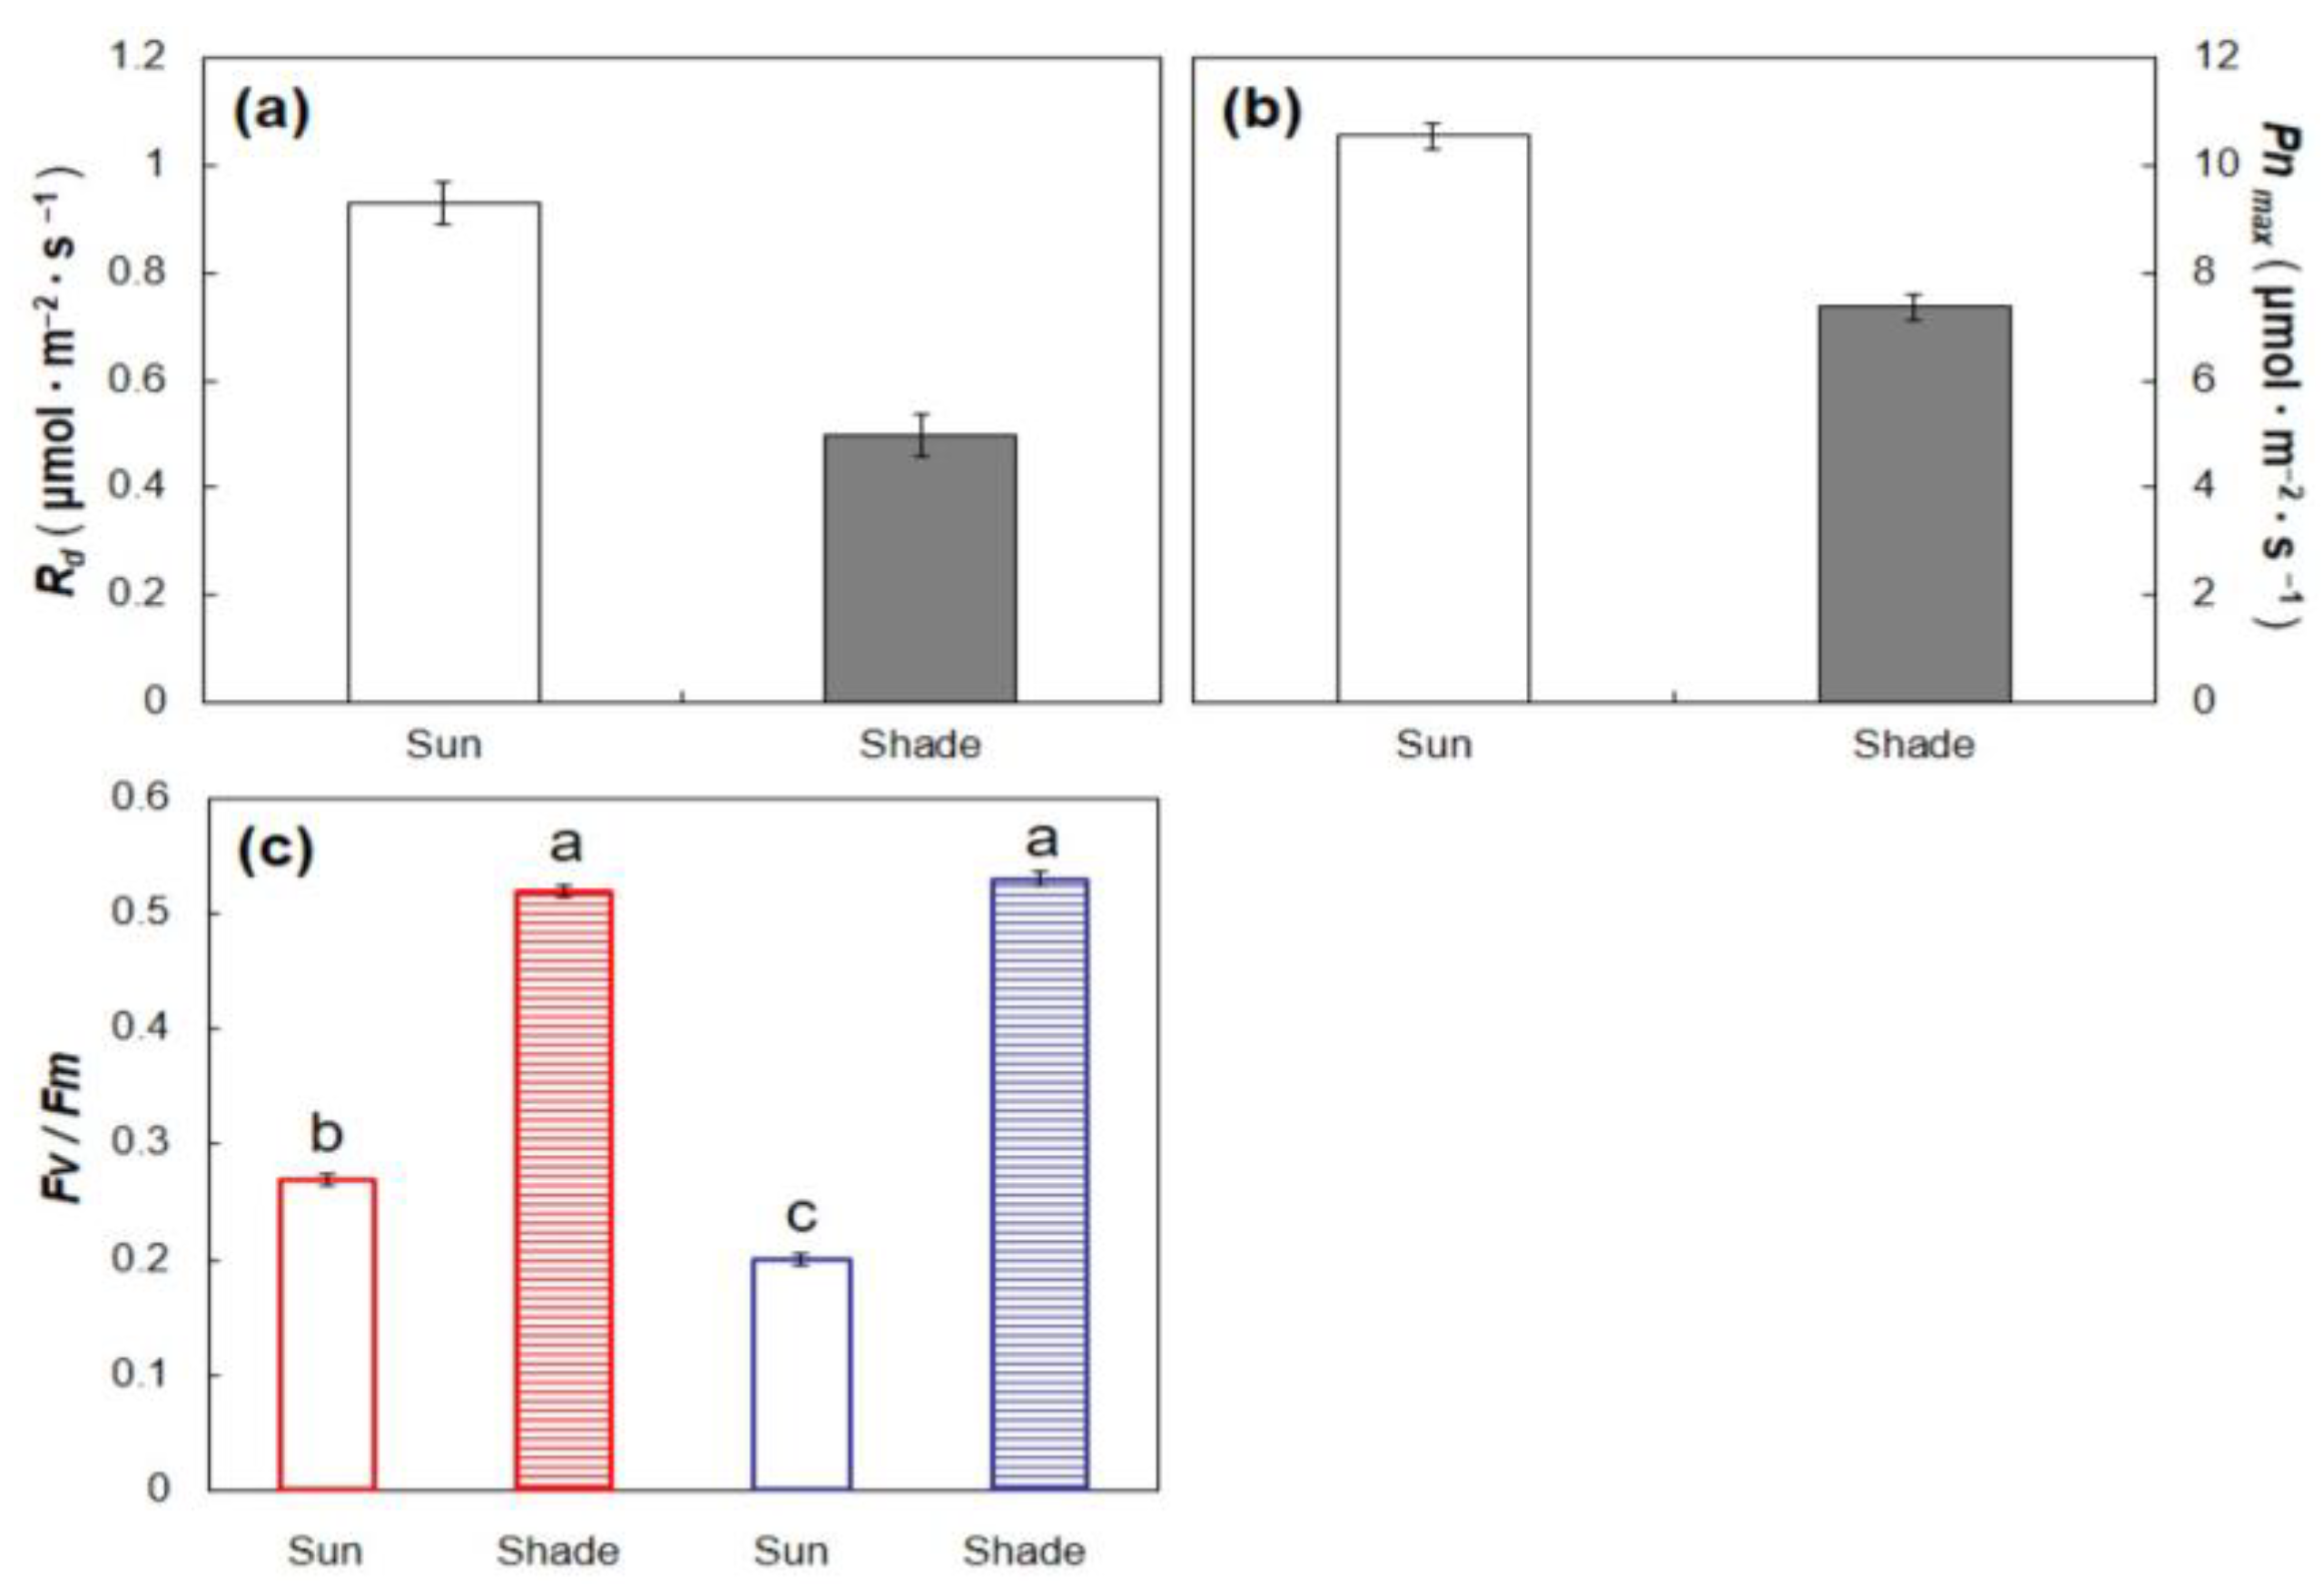
The data were plotted as means ± standard error to reveal the daily patterns of the leaf traits. Dark respiration (Rd) was considered as the mean from pre-dawn and post-sunset dark carbon dioxide exchange. Maximum Pn was defined from each replication as the greatest value of Pn obtained throughout the photoperiod. Minimum midday Fv/Fm was obtained from each replication. These three response variables were subjected to two-way analysis of variance (SAS) to determine differences among the two species, two developmental light treatments, and the interaction between these two factors. Pairwise comparisons for significant response variables were conducted with Tukey’s honest significant difference.
2.4. Biomass Allocation
The influence of developmental light conditions on biomass accumulation and allocation were determined for the two
Tabernaemontana species in separate studies. For both studies, the light treatments and growing conditions were as described in
Section 2.1. Seeds were germinated in 75% sunlight in beds filled with washed river sand. When the seedlings had two true leaves, they were transferred to individual 2.6 L containers and placed on raised benches within the shade structures. The shaded seedlings grew more rapidly in height, and when the 24% shade treatment plants reached about 30 cm in height, each study was terminated. This growth stage, encompassing the first few months after germination but prior to the sapling stage, is a critical stage in population recruitment.
The
T. rotensis seeds were from the same source as described in
Section 2.1. The seeds were sown on 2 December 2018 and the study was terminated on 24 June 2019. The mean minimum temperature was 22.2 °C, and the mean maximum temperature was 30.9 °C. The
T. pandacaqui seedlings were produced from seeds that were harvested in Angeles City, Pampanga, Philippines. The seeds were sown on 20 November 2023, and the study was terminated on 10 August 2024. The mean minimum temperature was 22.6 °C, and the mean maximum temperature was 30.7 °C.
Final measurements consisted of gently washing the sand from the roots, then separating each seedling into leaves, stems, and roots. The tissue from the three organs was dried to a constant weight for 48 h at 75 °C in a forced draft oven then weighed. Derived variables were generated by adding weight of the three organs to determine total plant dry weight and calculating root/shoot ratio with the formula root weight/(leaf weight + stem weight). Additionally, leaf mass fraction was calculated by leaf weight/total weight; stem mass fraction was calculated by stem weight/total weight; and root mass fraction was calculated by root weight/total weight. Each experiment was analyzed separately. The response variables were subjected to t-test to determine significance between the two light treatments.
4. Discussion
Biomass allocation and leaf physiological plasticity in response to sun versus shade growing conditions was considerable for both
Tabernaemontana species in this study, confirming the capacity to produce different phenotypes in response to available light during leaf development. Habitat observations indicate that in situ
T. pandacaqui typically grows in shaded habitats [
2,
25] and in situ
T. rotensis grows in open and shaded habitats [
6]. These niche field observations were the foundation of the hypotheses that were addressed herein. I hypothesized that
T. rotensis would exhibit biomass allocation and leaf physiology traits that enable better performance in sun when compared with
T. pandacaqui, and the results corroborated the hypothesis. For example, the
T. rotensis full sun plants allocated more biomass to the root fraction than
T. rotensis shaded plants, but biomass allocation did not differ between the sun and shade
T. pandacaqui plants. This enabled similar growth of
T. rotensis plants in the contrasting light treatments, but
T. pandacaqui sun plants grew less than
T. pandacaqui shade plants. The findings conformed to the tenets of the optimal partitioning theory [
21], with
T. rotensis plants more equipped to modify biomass allocation under contrasting light conditions. Similarly, the
T. pandacaqui sun leaves reached saturation of
Pn at a lower
PPF than
T. rotensis sun leaves, and diurnal
Pn of
T. rotensis sun leaves exceeded that of
T. pandacaqui sun leaves. Interestingly, the light response curve model for
T. rotensis intersected with that for
T. pandacaqui sun leaves at a
PPF of 990 μmol·m
−2·s
−1 (
Figure 2), a
PPF very similar to
Isat for
T. pandacaqui sun leaves (
Figure 3b). This observation indicates that the greater
Pn under high light conditions may have been due to the relative ability of
T. rotensis sun leaves to exploit light energy in a
PPF range greater than
Isat for
T. pandacaqui. Moreover, the midday
Fv/
Fm, a measure of the relative amount of absorbed light energy that is used to drive photosynthetic processes, was greater for
T. rotensis sun leaves than
T. pandacaqui leaves. These facultative functional traits in
T. rotensis enabled similar seedling growth under sun and shaded conditions, a behavior that has been previously reported [
10].
I hypothesized that T. rotensis would exhibit functional traits that indicate inferior performance in shade when compared with T. pandacaqui, and the results also confirmed this hypothesis. For example, growth of leaf and stem did not differ between the light treatments for T. rotensis, but the leaf and stem growth of shaded T. pandacaqui plants exceeded that of sun T. pandacaqui plants. Likewise, the Φ of T. pandacaqui shade leaves exceeded that of T. rotensis shade leaves, and the Ic of T. pandacaqui shade leaves was less than that of T. rotensis shade leaves. These findings indicate the exploitation of limited light was less efficient for T. rotensis shade leaves than for T. pandacaqui shade leaves. Moreover, under the 24% light transmission growing conditions, the diurnal Pn of T. pandacaqui leaves exceeded that of T. rotensis leaves.
Although T. rotensis plants produced leaves in shaded conditions that performed better than T. rotensis sun leaves in shaded conditions, the performance was inferior to a shade-grown T. pandacaqui leaf. Although T. pandacaqui produced sun-grown leaves that performed better in the sun than shade-grown T. pandacaqui leaves, the performance was inferior to that of sun-grown T. rotensis leaves. I hypothesized that these types of relationships would reveal greater phenotypic plasticity in T. rotensis than in T. pandacaqui, and the collective results can be viewed through the lens of a variability index (((maximum − minimum)/maximum) × 100) for each trait. This exercise confirmed the hypothesis, but only for the traits associated with improved performance in full sun conditions. For example, the variability index of maximum Pn was 39% for T. rotensis and 19% for T. pandacaqui. Similarly, the variability index of Isat was 56% for T. rotensis and 42% for T. pandacaqui. In contrast, variability of traits associated with improved performance in limited light conditions rejected the hypothesis. For example, the variability index for shoot biomass (leaf + stem) was 8% for T. rotensis and 15% for T. pandacaqui. Similarly, the variability index for Φ was 19% for T. rotensis and 32% for T. pandacaqui, the variability index for Ic was 49% for T. rotensis and 60% for T. pandacaqui, and the variability index for Rd was 40% for T. rotensis and 56% for T. pandacaqui. These functional traits enable an ability to optimize carbon gain and minimize carbon loss in shaded habitat conditions. Therefore, a one-size-fits-all outcome was not revealed in relation to this hypothesis, and the influence of species on relative variation between high light and low light plants depended on the trait.
Defining various ecophysiology traits of tree species provides a mechanistic understanding of canopy interactions and differences in light capture and utilization, and this study provides the first steps toward beginning to understand niche preferences of two closely related
Tabernaemontana species. The inferior relative performance of
T. pandacaqui in full sun may enable environmental filtering of saplings whereby co-occurring trees with greater ability to exploit high light resources may outcompete these
T. pandacaqui saplings. Contrarily, the facultative responses of
T. rotensis leaves to full sun may allow for the saplings to compete with co-occurring tree species and retain occupancy of canopy space in high light conditions. These findings may extend to how these two species contrast in exploitation of water resources. Indeed,
T. pandacaqui often occurs in riparian and littoral forests [
3,
4], but the areas of occupancy in which
T. rotensis thrives are primarily highly drained calcareous substrates [
6,
26]. Ecophysiology studies designed to understand phenotypic plasticity to wet versus dry habitats are needed for these two species.
4.1. Diurnal Patterns
The midday depression of
Pn in full sun conditions reported herein for both
Tabernaemontana species is commonly reported among tree species and is a response to the challenges of operating under conditions where more light energy is available than what is needed to drive the photochemical pathway [
27,
28]. Mechanisms for non-photochemical dissipation of excitation energy allow for the tree leaf to avoid high light damage during these daily hours of excessive energy [
28,
29,
30]. The midday depression of
Fv/
Fm as reported here is a measure of the incipient quantum efficiency of the photosynthetic apparatus [
31,
32]. The effectiveness of the non-photochemical dissipation of excessive energy as a protective mechanism during midday is evidenced by the recovery of
Pn and
Fv/
Fm during afternoon hours, and the full recovery of
Fv/
Fm to pre-dawn levels after sunset. The
T. pandacaqui sun leaves clearly experienced greater midday stress than
T. rotensis sun leaves despite the homogeneous
PPF.
The
Fv/
Fm values were relatively low in this study. The low values during the photoperiod were accompanied by concurrent
Pn flux values that were not similarly depressed. The available light in this tropical climate may greatly exceed what is needed to drive photosynthetic dark reactions by members of this genus, and as a result, the low efficiency of utilizing that available light did not translate to substantial declines in
Pn. The relatively low values of about 0.75 during pre-dawn and post-sunset were lower than typical values, which exceed 0.80 [
32]. More research is needed to determine if these are typical values for
Tabernaemontana leaves in general, or if this ex situ setting imposed unknown stressors on plant growth.
4.2. Conservation and Restoration
The Guam and Rota populations of
T. rotensis were added to the United States Endangered Species Act (ESA) in 2015 [
33] at a time when the global population was estimated at 21,000 individuals. The five-year assessment of species recovery efforts in 2020 indicated that improving natural regeneration and recruitment to the sapling stage were required components of population recovery goals [
6]. My choice to focus on seedling biomass allocation and sapling leaf physiology herein contributed toward those goals. Moreover, the differences among tree species concerning shade tolerance may be more clearly expressed during early life stages of trees [
34,
35]. The greatest threat to the species is anthropogenic activities such as land degradation and conversion. Indeed, more than 2000 ha of land is estimated to be permanently modified during the ongoing military buildup of Guam [
6], most of this land occurring within areas where
T. rotensis grows or would be able to become permanently established. Working knowledge of the niche needs of these plants, such as the results herein, may improve conservation outcomes.
Species recovery goals included managed propagation, plant translocation, climate change planning, and partnership development to maximize restoration and management of habitats that benefit
T. rotensis [
6]. Active management of threatened plant species should be based on verifiable scientific data concerning ecological requirements, and conservation protocols based on anecdotal, untested observations can lead to mistakes [
36]. In this light, the results of this study are germane to all of these endeavors. First, conservation nursery managers may improve early
T. rotensis plant growth by providing high light conditions for the seedlings and saplings. When selecting translocation recipient sites, the transplants may not be able to compete if they are placed under deep shade canopy conditions in the restoration sites. Second, one facet of climate change predictions is that tropical cyclones will not necessarily become more frequent, but the tropical cyclones that do develop will become more intense [
37]. These predictions indicate that each tropical cyclone influencing Guam and Rota will carry greater potential for forest defoliation and canopy damage than historical tropical cyclones. Tropical cyclones directly benefit some consequential behaviors of
T. rotensis, such as increasing light penetration to the forest floor to generate a pulse of seedling emergence [
6]; therefore, climate change carries the potential to modify
T. rotensis population behaviors more than other sympatric native tree species. More plant response research following each future tropical cyclone is warranted for Guam and Rota. Third, the enumerated goal of embracing partnerships for the benefit of species recovery is a social science endeavor and will require the inclusion of qualified scientists in adaptive management research to avoid future conservation failures. The number of publications in peer-reviewed journals that address
T. rotensis growth and physiology [
10,
11,
12,
13] is inadequate, indicating that it is incumbent on decision-makers to respect the need for funding qualified scientists to develop new knowledge that is filtered through peer review processes in order to adequately conserve the species.
Restoration of degraded habitats following mining operations is a widespread goal in the Philippines, and
T. pandacaqui has been evaluated for use in mine restoration because it is a prominent understory species in
Acacia auriculiformis Benth. mine restoration forests [
38]. The findings indicated
A. auriculiformis may be exploited as a nurse plant for establishment of
T. pandacaqui in these degraded habitats. My results revealed that provision of canopy shade may be one of the means by which
A. auriculiformis can improve
T. pandacaqui growth in these degraded, open abandoned mine sites.


