Article

Genome-Wide Association Analyses Defined the Interplay between Two Major Loci Controlling the Fruit Texture Performance in a Norwegian Apple Collection (Malus × domestica Borkh.)

1
Department of Plant Sciences, Norwegian University of Life Sciences, 1433 Ås, Norway
2
Center of Agriculture Food Environment (C3A), University of Trento, Via Mach 1, 38098 San Michele all’Adige, TN, Italy
3
Njøs Fruit and Berry Centre, 6863 Leikanger, Norway
4
Graminor Breeding Ltd., 2322 Ridabu, Norway
*
Author to whom correspondence should be addressed.
Horticulturae 2024, 10(10), 1049; https://doi.org/10.3390/horticulturae10101049
Submission received: 28 August 2024 / Revised: 20 September 2024 / Accepted: 28 September 2024 / Published: 1 October 2024
(This article belongs to the Special Issue Advanced Postharvest Technology in Processed Horticultural Products)

Abstract

:
Increasing consumption of apples (Malus domestica Borkh.) produced in Norway requires the availability of superior cultivars and extended marketability. Favorable texture and slow softening are important traits for consumer appreciation and postharvest performance. Apple texture has been well characterized using both sensory evaluation and instrumental assessments, and major quantitative trait loci (QTL) have been detected. With texture being targeted as an important trait and markers being publicly available, marker-assisted selection has already been implemented into several breeding programs. When focusing solely on a limited set of markers linked to well-investigated major QTLs, most minor-effect QTLs are normally excluded. To find novel potential SNP markers suitable to assist in selection processes, we selected a subset of accessions from a larger apple collection established in Norway based on the favorable alleles of two markers previously associated with texture, enabling the investigation of a minor part of the variance initially masked by the effect of major loci. The subset was employed to conduct a genome-wide association study aiming to search for associations with texture dynamics and retainability. QTL regions related to texture at harvest, postharvest, and for the storage index were identified on chromosomes 3, 12, and 16. Specifically, the SNPs located on chromosome 12 were shown to be potential novel markers for selection of crispness retention during storage, a valuable storability trait. These newly detected QTLs and underlying SNPs will represent a potential set of markers for the selection of the most favorable accessions characterized by superior fruit texture properties in ongoing breeding programs.

1. Introduction

Strengthening food security and decreasing import of food, especially fruit, is an important goal in Norway [1], particularly considering that 83.5% of the apples (Malus domestica Borkh.) consumed are currently imported [2]. Apple is one of the most widely produced and economically important fruits in the temperate regions of the world [3], and is currently the most important fruit in Norway by volume. To achieve higher consumption of Norwegian-produced fruit, key aspects are providing consumers with high-quality fruit through the availability of superior cultivars meeting consumer demands and an extended apple sales season. A favorable texture and a slow softening are important traits for consumer appreciation and for preventing fruit decay and postharvest disorders/diseases, thus strengthening food security. Besides fruit quality appreciation, fruit texture is also critical for the maintenance of fruit quality and nutritional content along the postharvest chain. For this purpose, fruit storability is an important trait for marketability [4,5] and largely depends on the types of texture, which rely on the dismantling process occurring within the cell wall and middle lamella polysaccharide structure operated by a genetically coordinated action of several cell-wall-degrading enzymes. Storability is therefore a dynamic aspect related to the loss of textural properties over time rather than a static assessment conducted at a specific physiological time point. In apples, there exists a great variability of polysaccharidic architecture modification, leading to different types of textures ranging from mealy to crispy [6], with the latter representing one of the most important traits rated by consumers as well as for storability.
The Norwegian climate limits the number of days suitable for plant growing, along with the suitability of apple cultivars from breeding programs abroad. The Norwegian Apple Breeding Program (NABP) was established in 1984 to develop cultivars more adapted to Nordic climatic conditions. As the seedlings progress through the NABP, firmness, crispness and improved storability are key traits routinely selected for, necessary for the release of superior accessions. Apple texture is well characterized and is considered a sensory property consisting of several parameters, distinguished into mechanical and acoustic components, which can be used to comprehensively describe and characterize firm and/or crispy apples, respectively [7]. Complex traits, such as fruit quality-related phenotypes, can nowadays also be selected with the employment of specific molecular markers associated with the trait of interest. To this end, the understanding of the genetic control of phenotypic traits can enable the development of genetic markers useful for genomics-assisted breeding (MAS) of new apple cultivars. Major quantitative trait loci (QTL) associated with mechanical and acoustic components of apple texture have already been detected on chromosomes 10, 15, and 1, collocating with MdPG1, MdACO1, MdACS1, and Md-Exp7, respectively, which are important genes controlling fruit ripening and texture [8,9,10]. Recently, another gene, NAC18.1, was located within a QTL region on chromosome 3 [11] and associated with the control of harvest date and fruit firmness at harvest [12,13,14]. These studies allowed the deciphering of the genetic control of fruit texture at harvest [15] or after a period of storage; however, storability was not considered.
With texture in apples being targeted as an important trait for genomics-assisted breeding [16], and molecular markers for the desirable alleles of MdACS1, MdACO1, and MdPG1 being widely available [10], these markers have been implemented as routine selection tools into the pipeline of several breeding programs. Due to the role of the main known texture genes (MdPG1 and MdACO1), when breeding for selection of firm and crisp apples, most programs no longer consider cultivars with unfavorable alleles or low performing phenotypes as parents. When selection based on markers is superior to selection based on phenotypes, the markers become fixed after a few rounds of selection [17]. In the NABP, the MdACO1-marker particularly has been often used in the last two decades, resulting in little to no segregation for this marker among seedling families.
With the increased complexity of plant breeding programs, in terms of the genetic and phenotypic information acquired to make selection decisions, the genetic gain equation [18,19] is frequently used as a guide by breeding teams to make informed decisions, articulating the breeding parameters that can regulate the crop improvement process, like the additive genetic variation within the population. In apple, genetic parameters like the estimates of heritability are not widely used by breeders on a practical basis, mainly because such parameters require complex calculations and large amount of data collected from multiple locations [20,21]. To improve the detection of QTLs, large germplasm collections are normally considered to enhance statistical power. Breeders, instead, are more oriented to exploiting a certain part of the variability only controlled by the effect of favorable alleles, although this will reduce the total phenotypic variance. In this work, we examine the role of minor genomic regions controlling variation in texture quality and storability, including both firmness and crispness, among Norwegian cultivars. We identify potential SNP markers suitable to assist the selection strategies in the NABP and relevant for applied breeding efforts worldwide, aimed at improving postharvest fruit quality. Specifically, we defined a subset of apple accessions selected for major loci involved in fruit texture control to identify minor loci associated with fruit quality traits sought by breeders in modern breeding programs that are not considered when major loci are segregated. Finally, we discuss putative candidate genes controlling texture retention during storage, a phenotypic trait playing a vital role in strengthening food security and providing sustainable storage solutions.

2. Materials and Methods

2.1. Plant Material

The plant material employed in this survey was represented by a collection composed by 197 accessions, initially described in [22]. This collection, named NAAC1 (Table S1), is represented by a mixture of diploid Norwegian heritage cultivars, recent international releases, and NABP cultivars and selections, all available at Njøs Fruit and Berry Centre (NJØS) (at latitude 61°10′43.2″ N, longitude 6°51′34.3″ E), located at the Sognefjord, western Norway. A minimum of two trees per accession were planted in a nonreplicated design across two years from 2014 to 2016. Trees in NAAC1 were cultivated following standard agronomic practices for fruit thinning, pruning, and pest/disease control.
Out of the NAAC1 collection, a subset of accessions was furthermore selected on the basis of the favorable alleles of two SNP markers already associated with texture performance. This subselected group represented by 60 accessions was defined as NAAC2 (Table S2). The SNP markers chosen for the selection of the NAAC2 collection were both located on chromosome 10, and represented by the MdACO1 SNP marker and the SNP marker “SNP_FB_0003490” from the Illumina Infinium 20K apple single nucleotide polymorphism (SNP) array [23]. The SNP_FB_0003490 marker was employed in this phase since it showed a significant association with Dim1 for the storage index, assessed in the NAAC1 collection in an earlier work (Figure 1). The NAAC2 collection being homozygous for major loci involved in the control of the texture performance represents a minor phenotypic and genetic variability compared to NAAC1, since it does not contain mealy and soft apple accessions.

2.2. Phenotypic Assessment

Phenotypic data were collected in two consecutive years: 2022 and 2023. Apples were harvested at a defined ripening stage determined by the degradation of chlorophyll content nondestructively assessed with a DA meter (TR turoni, Forli, Italy), using the methodology reported in Farneti et al. [24]. Ten apples per accession were regularly assessed with this instrument at two opposite sides of the equatorial area for the establishment of the most appropriate harvest date, defined with threshold means between 0.8 and 1. For each apple accession, a minimum of 24 homogeneous fruit were collected and cold-stored for two months at room atmosphere (3 iwith ~95% relative humidity). Ten apples were evaluated at each time point (harvest and postharvest) and four additional fruits were collected as backup in case of storage rot. Apples were carefully harvested from well-exposed areas of the tree, avoiding the top and the bottom of the canopy. Cracked, rotten, or otherwise quality-degraded fruit was avoided whenever possible. For texture analysis, fruit samples were prepared into discs following the method described by Costa et al. [7]. Fruit crispness and firmness were estimated both at harvest and after postharvest storage by a TAXT plus computer-controlled texture analyzer (Stable Micro System, Godalming, UK) equipped with an acoustic envelope detector [16].
Instrumental measurements followed the protocol described in Costa et al. [7]. Briefly, for each genotype, 25 measurements (5 technical per 5 biological replicates) were carried out. Mechanical and acoustic profiles were further processed with an ad hoc macro developed by Costa et al. [7] for the digital acquisition of twelve parameters. Of these (Table S3), eight were related to the mechanical signature of texture (“yield force” (YF), “maximum force” (MF), “final force” (FF), “force linear distance” (FLD), “Young’s Modulus” (YM), “mean force” (MEF), “force strain area” (FSA), and “number of force peaks” (NFP)) and four were related to the acoustic response (“maximum acoustic pressure” (MXA), “mean acoustic pressure” (MEA), “acoustic linear distance” (ALD), and “number of acoustic peaks” (NAP)), as described in Costa et al. [7]. Data obtained at harvest and postharvest together with the storage index, defined according to Costa, et al. [25], were used to plot the distribution of the 60 accessions included in the NAAC2 collection over a plot defined by the first two dimensions, computed through the multivariate statistic approach of a principal component analysis (PCA), performed and visualized with statistical software R version 4.3.0 [26] and package FactoExtra [27]. Both mechanic and acoustic signatures of fruit texture were assessed at harvest, after two months of postharvest storage, and via a storage index parameter (described below) to examine the behaviors of each texture property during storage. Data related to the texture parameters computed here were standardized by means. Variance in texture attributes among the accessions were investigated using PCA, illustrated in a single bidimensional plot. To investigate dependence between multiple variables simultaneously, a correlation matrix was computed with R package Hmisc [28] using the Pearson correlation coefficient and significance level 0.01.
For each trait, we used a mixed linear model to obtain the best linear unbiased prediction (BLUP) of across-year phenotypic values for each genotype. Variation in each of the twelve mechanical or acoustic subtraits, considered as ‘Y’, was modeled using the genotype and year as random effects, in addition to an error component:
Y i ,   j = μ + g e n o t y p e i + y e a r j + e i ,   j
This model was fitted separately for all traits with the ‘lme4’ R-package [29].

2.3. Dynamic Aspects of Fruit Texture

To evaluate the storage potential, regarded as the change of each dissected texture parameter measured in this study, the storage index presented in Costa et al. [25] was computed for each accession. The storage index (SI) was calculated as follows:
S I = log 2 T i P T i H
where TiH is the mean value of “i” texture (T) parameter measured at harvest (H), and TiP is the mean value of the same texture parameter measured after two months of storage (P). Positive storage index values showed a texture enhancement for the respective texture parameter, while negative values pointed to a loss of textural performance during storage. A value equal to zero meant stable maintenance of respective textural traits during storage. The storage index was calculated for each of the twelve texture parameters across the 60 accessions included in the NAAC2 collection, and a PCA was performed to estimate an overall measurement of storage potential.

2.4. Genotyping

SNP genotyping was conducted using the 20 K Infinium® apple SNP array (Illumina Inc., San Diego, CA, USA) [23], and SNP data were curated as described in Vanderzande et al. [30]. Only SNPs included in the set of robust SNPs presented in Howard et al. [31] were kept, resulting in 10,321 SNPs remaining for downstream analysis. Population structure was used as a cofactor in GWAS, using the findings from the structural analyses reported in Gilpin et al. [22]. For SNP data curation, as well as subsequent QTL mapping, genetic positions were taken from an updated version of the integrated genetic linkage map [32] as described in Howard et al. [33].

2.5. Statistical Analyses and Phenotype–Genotype Associations

As a first step to identify major texture-related loci in the large collection (NAAC1), a GWAS was performed for each recorded trait on 197 accessions (Table S1) for which instrumental quantitative texture data were fully available. A QTL for the Dim1 storage index was found using the mixed linear model MLMM with a minor allele frequency ≥5% and false discovery rate (FDR) corrected significance thresholds of 0.1, and the SNP marker “SNP_FB_0003490” was shown to be the most significant in terms of association. This marker, together with the MdACO1 marker, was used to select from the NAAC1 only the accessions with the homozygous favorable allelic state, which, in the end, constituted the selected NAAC2 sub-collection.
Next, a second round of GWAS for each phenotypically dissected texture trait for the 60 accessions (Table S2) of the NAAC2 was conducted using estimated BLUP values across years. Each texture parameter, together with the two principal components (Dim1 and Dim2, used to resolve redundant variables) defined for the NAAC2, were employed as phenotypic data in the association study to find QTL associated with apple fruit texture. GWAS was carried out by implementing two specific models: MLMM and FarmCPU, integrated in the GAPIT software version 3 [34]. Furthermore, different covariates to account for population structure and a given number of principal components depending on trait were assessed. P-values were further corrected for multiple testing using FDR [35] with a 10% threshold. Significant differences among allelic configurations for each important QTL for the associated phenotypic trait were assessed through the analysis of variance using a type 2 ANOVA. In silico gene mining in the QTL-intervals was conducted using the “JBrowser” tool available at the Genome Database for Rosaceae (GDR) website [36].

3. Results

3.1. Subselection of Individuals

The initial GWAS analysis carried out on the NAAC1 large apple collection identified a major locus located on chromosome 10 and co-located with the SNP marker SNP_FB_0003490, as illustrated in Figure 1. This marker, associated with texture performance, together with MdACO1, was used to select a subset of individuals with the presence of favorable alleles in a homozygous state, finally representing the NAAC2 collection.
Figure 1. Map of identified texture-related SNP markers across the 60 accessions in NAAC2 (green) and previously reported texture-related genetic markers [25,37,38,39,40,41,42] in apple (black). The two markers (SNP_FB_0003490 and the MdACO1 SNP marker) used for preselecting the subset defined as the NAAC2 in the NAAC1 are marked on chromosome 10, and the identification of the SNP_FB_0003490 marker in the NAAC1 is depicted in the Manhattan plot, using the MLMM GWAS model and FDR correction. Created with BioRender.com, accessed on 30 September 2024.
Horticulturae 10 01049 g001

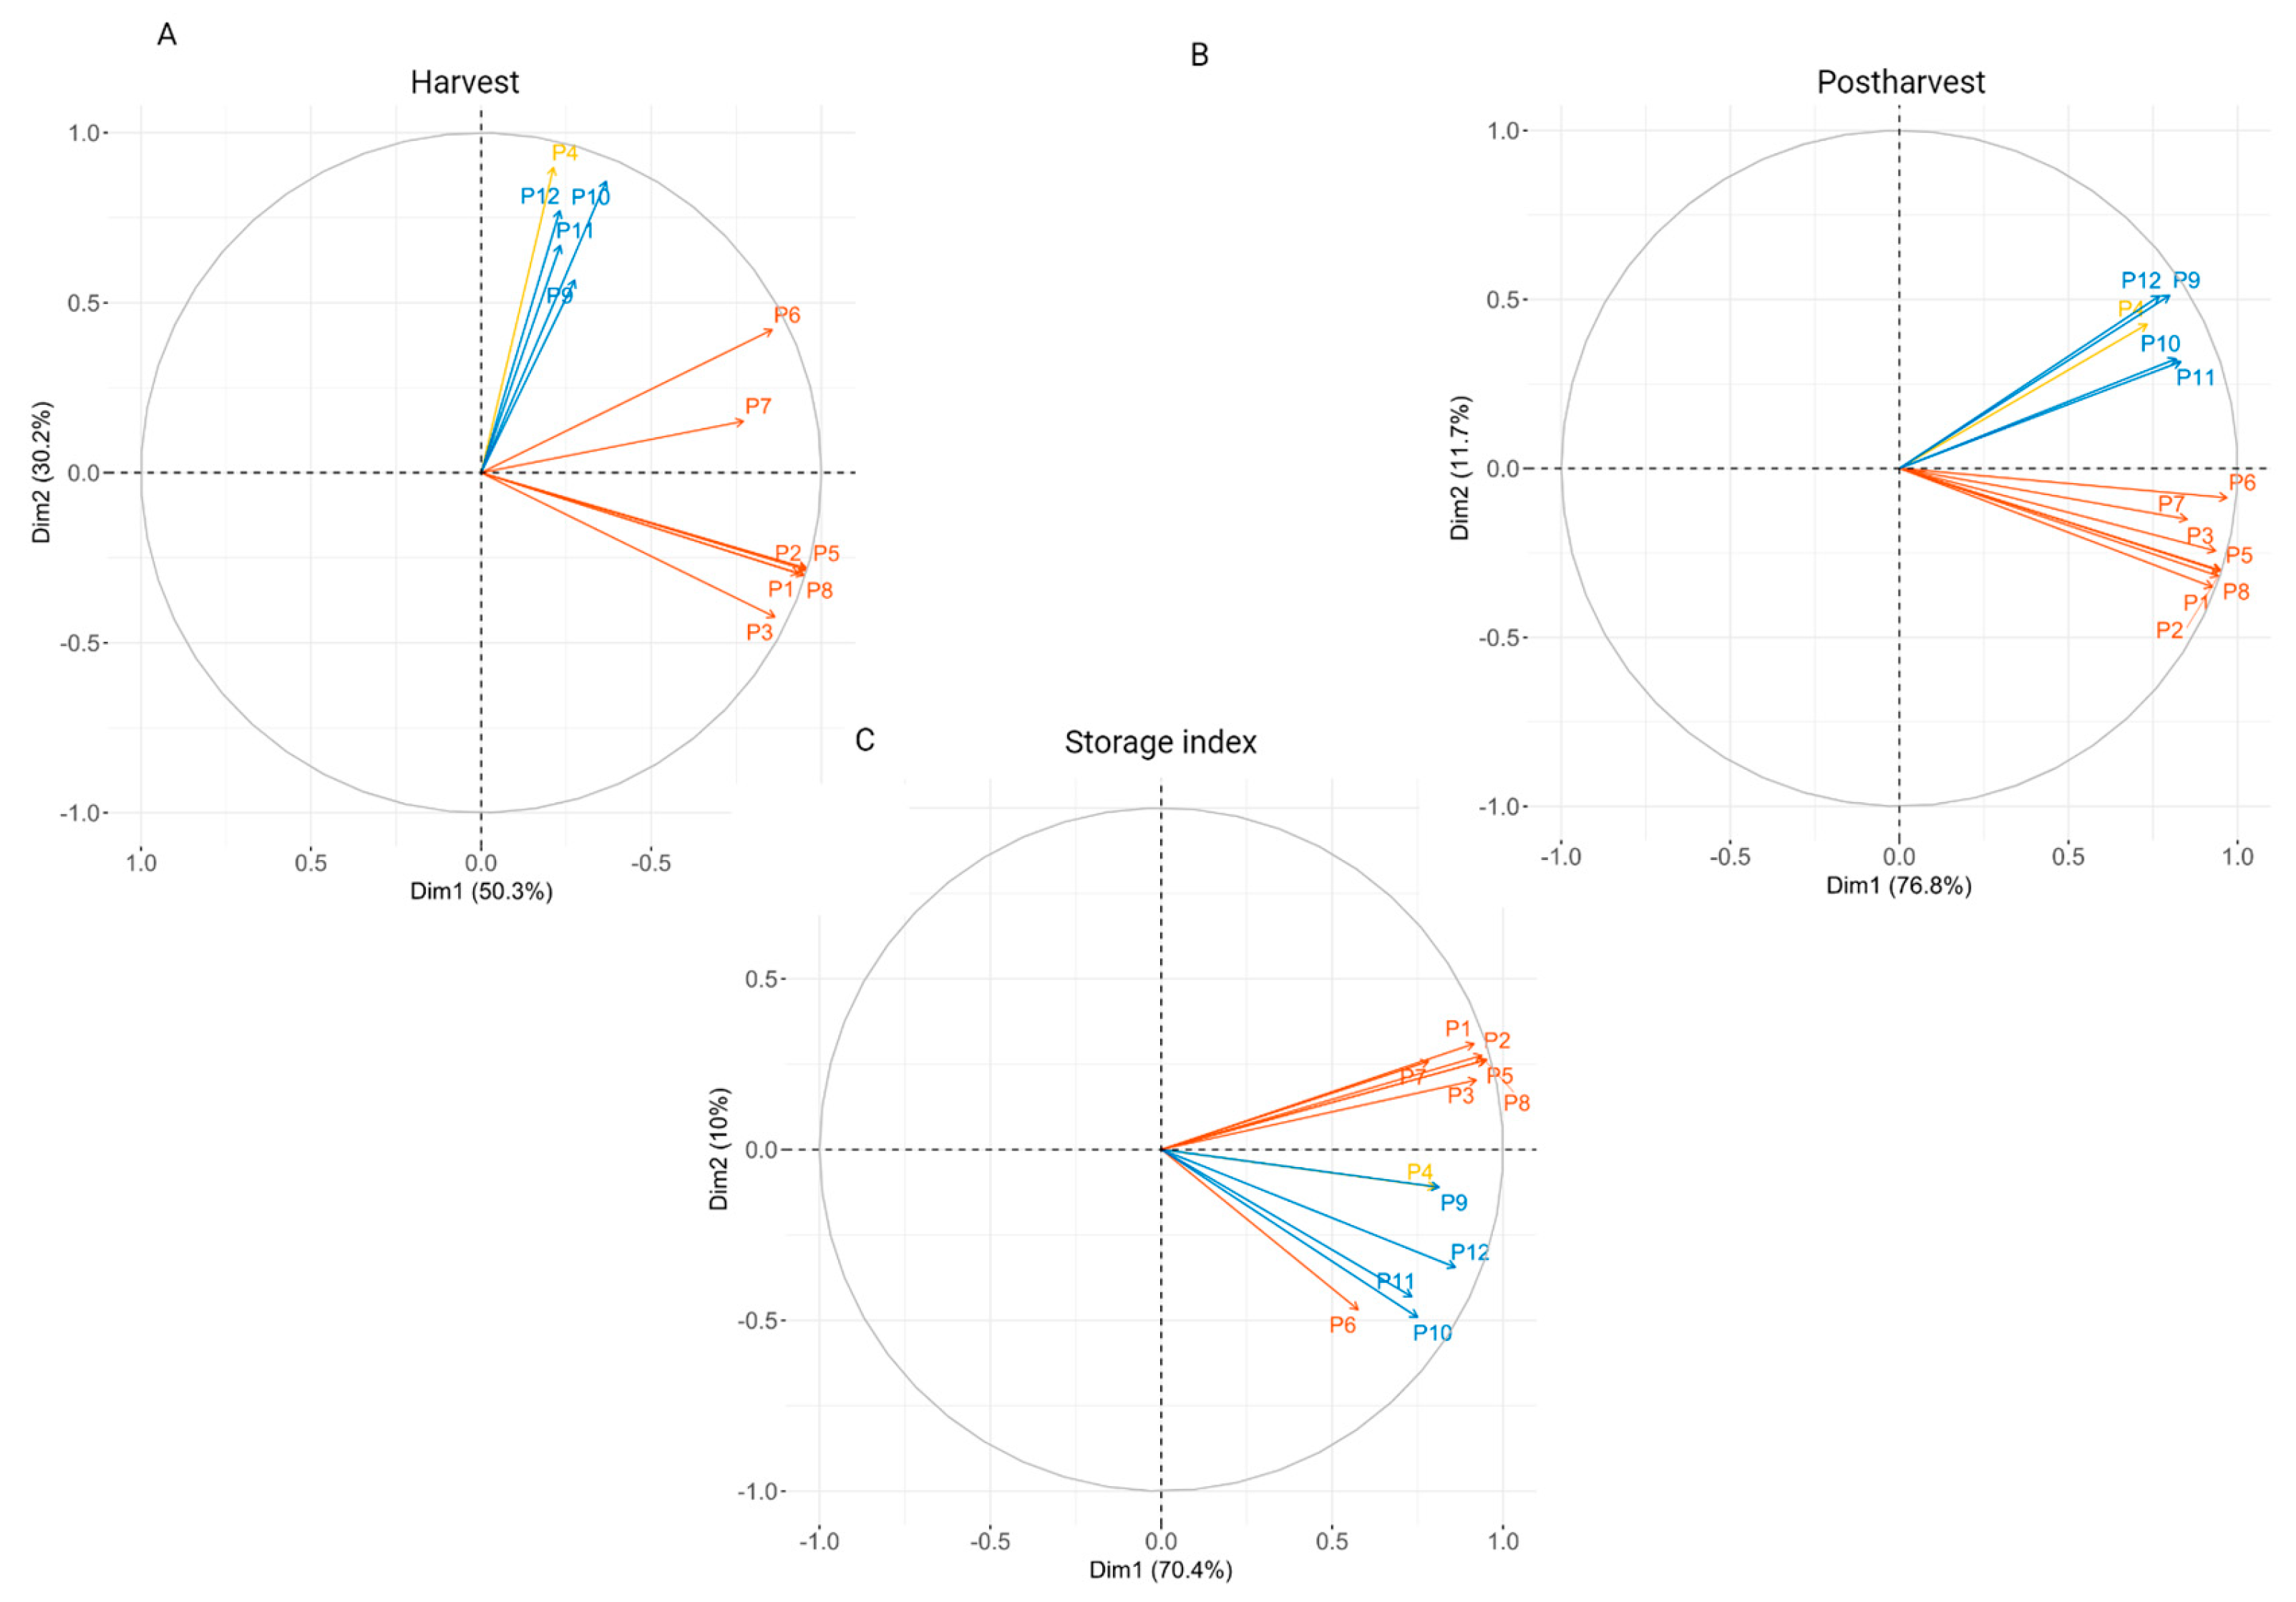
3.2. Fruit Texture Assessment and Principal Component Analysis

Two distinct groups of phenotypic variables were identified in the PCA for texture data assessed both at harvest and postharvest (including the derived parameter storage index) across the individuals included in the NAAC2 collection (Table S2). The first group was represented by eight mechanical parameters, while the second group was defined by four acoustic parameters (Figure 1). In all the three PCA 2D plots, the two groups of variables were distinctively projected in different quadrants. At harvest, the acoustic variables were projected in the first quadrant while the mechanical parameters were more oriented towards the second quadrant, except for the force linear distance and the Young’s module, which were oriented in the same quadrant as the acoustic group. More specifically, at the top of quadrant I, all parameters (Table S3) defined over the acoustic profile were included, such as MXA, MEA, ALD, and NAP, together with the mechanical parameter NFP. The bottom of PCA Quadrant I and Quadrant II included instead two clusters of texture components, all from the mechanical profile, with the first including YM and FLD and the second FF, MF, MEF, FSA, and YF (Figure 2A). The distinction between the two components of the fruit texture was more evident with the texture data assessed after storage (postharvest), where the two components were clearly oriented in different quadrants. In both cases, as well as in the PCA computed with the storage index data, the mechanical parameter “number of force peaks” was always clustered together with the acoustic variables (Figure 2B,C). The more defined separation between the two components could also be assigned to the different texture variability assessed between the two time points, harvest and postharvest. In fact, while, at harvest, the contribution of the PC1 was 50.3% (over a total variability of 80.5%, similar to what was reported for the storage index: 80.4%), at postharvest, the PC1 accounted for 76.8% (over a total variability of 88.5%). Over the three PCA plots, the accessions were evenly spread, without showing any specific clustering among the individuals (Figure S1).
In all the three PCA plots, although Dim1 explains the highest variability, defining the general fruit texture behavior, the contribution of Dim2, explaining a smaller part of the texture variation (30.2%, 11.7% and 10% at harvest, postharvest and for the storage index, respectively), specifically described the projection of the two groups of variables, distinguishing acoustic and mechanical parameters. These different behaviors were also confirmed by a correlation matrix (Figure S2), revealing that the mechanical and acoustic groups were only partially correlated (0.50–0.76) when assessed after storage, yet not correlated (−0.08–0.05) at harvest. The main mechanical parameters YF, FF, MF, FSA, and MEF were significantly correlated (0.95–0.99) at all stages, yet FLD, and YM were less correlated with the other mechanical parameters (0.41–0.94). The set of acoustic parameters, MXA, ALD, MEA, and NAP, together with the mechanical parameter NFP, instead showed lower correlation values, ranging between 0.44 and 0.77.

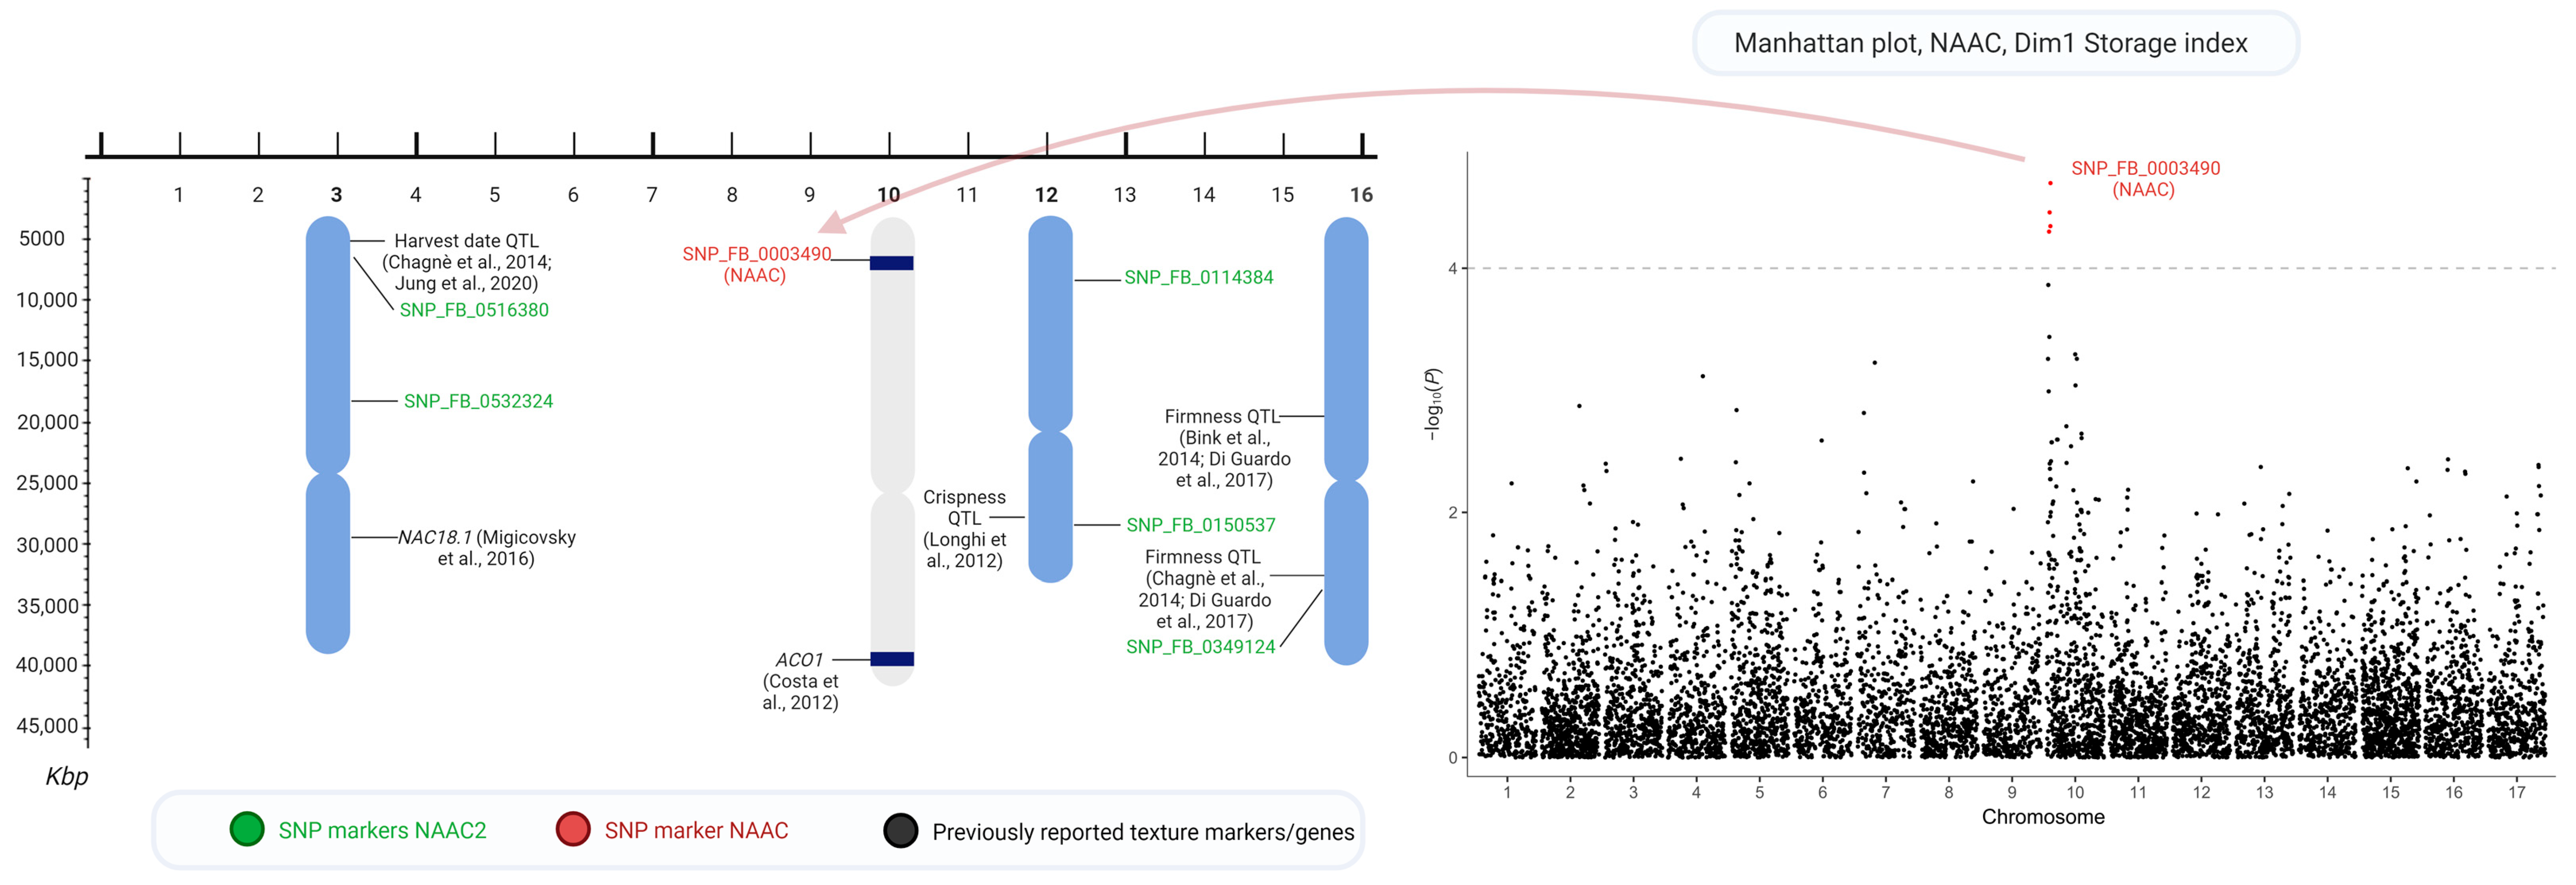
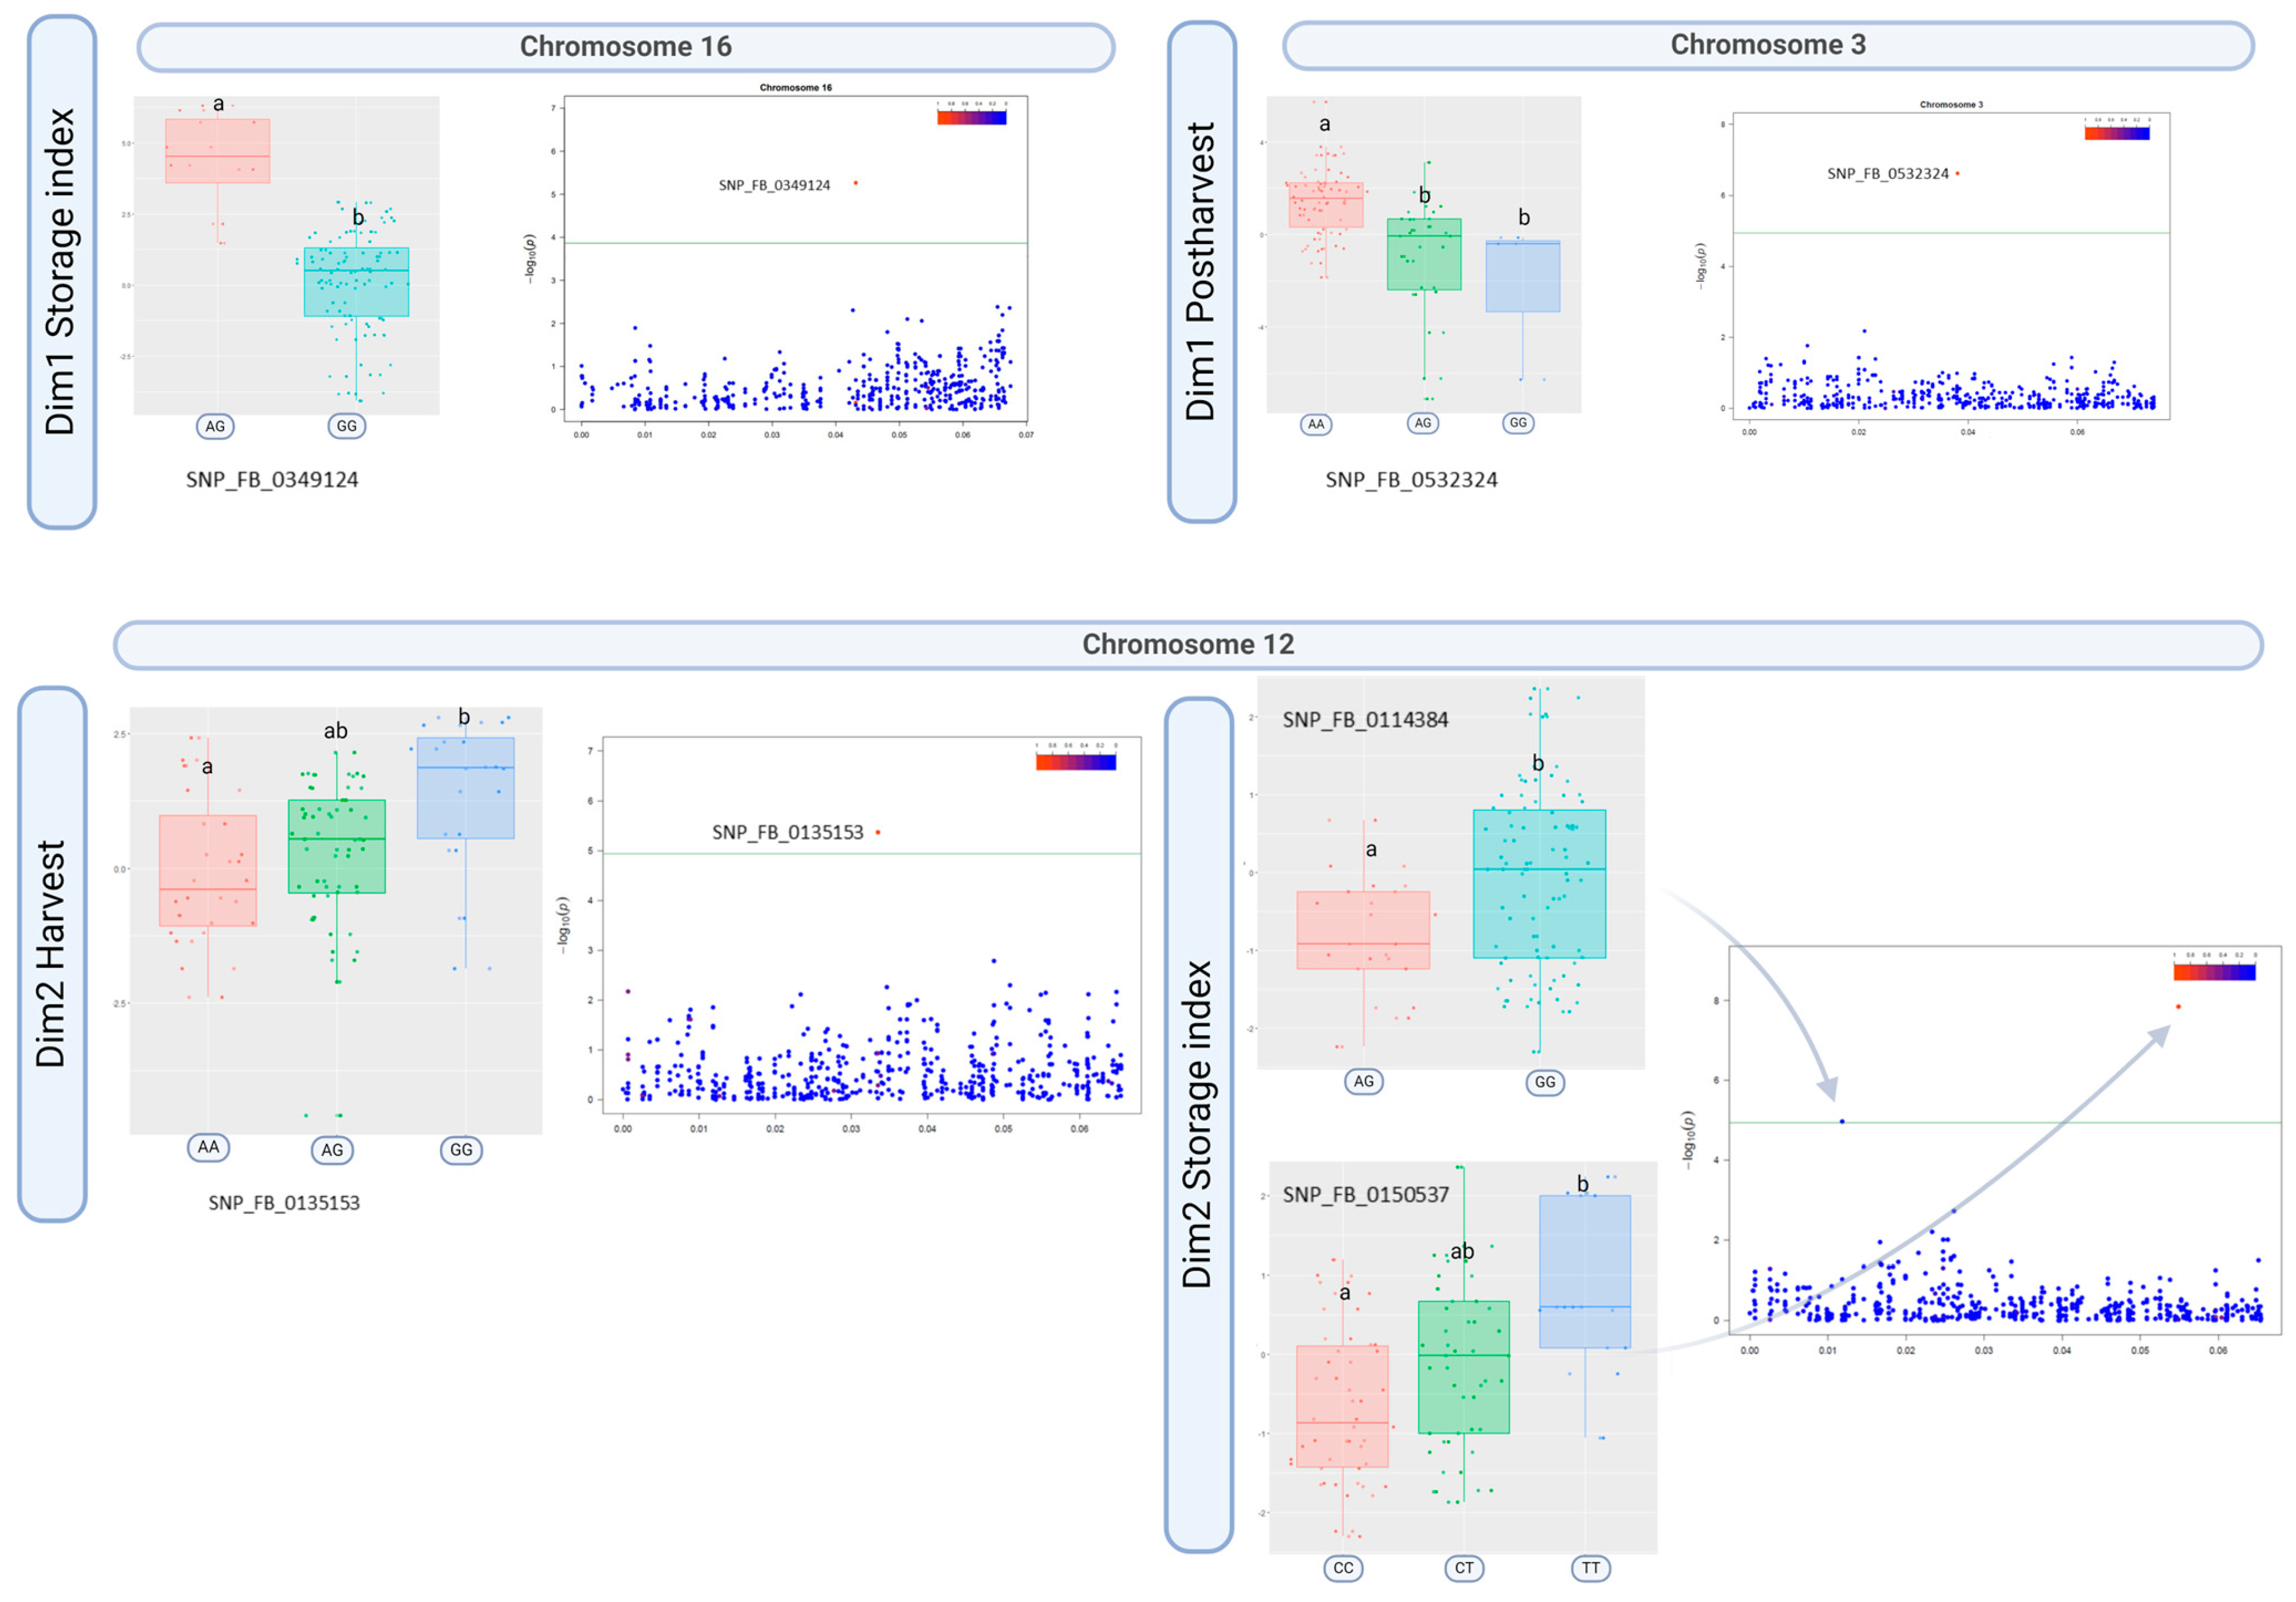
3.3. Phenotype–Genotype Associations

The second round of GWAS analysis using the phenotypic data collected on the NAAC2 collection found a series of SNPs associated with six mechanical parameters (NFP, YF, MF, FF, FLD, and YM) and three acoustic parameters (NAP, MXA, and MEA). In addition to these traits, the GWAS also reported SNPs associated with Dim1, which is a derived variable from the PCA and used as phenotypic entity implemented in the association analysis. The associated SNPs were distributed over chromosomes 2, 3, 4, 5, 6, 7, 8, 12, 15, 16, and 17 (Table S4). Among the mechanical and acoustic traits, YM and NAP had the highest number of SNP–trait associations, respectively.
On chromosome 3, significant associations were found for five sub-traits (YF, MF, FF, NAP, and YM) and Dim1 in two regions, at positions 7,022,668 and 18,768,688 on the GDDH13v1.1 [43] genome with association values from 6.0 to 11.0 −log10 (P), respectively (Table S4). The most significant SNP (“SNP_FB_0532324”) was associated with the Dim 1 component computed at the postharvest time point (Figure 3). The variability of the “SNP_FB_0532324” marker was used to differentiate the distribution of Dim1 postharvest according to its allelotype configuration (Figure 3). Based on statistical analysis conducted among the three possible diplotype categories, only the double dose of the favorable “A” allele showed a significant difference with respect to the other two (“GG” and “AG”). The two genomic regions detected on chromosome 3 were furthermore validated in the second year for the Dim1 storage index (Figure S3).
The GWAS analysis identified significant regions located on chromosome 12, associated with the mechanical traits YM and NFP in the genomic region between 21,529,154 and 29,611,105 bp with values ranging between 5.0 and 6.0 –log−10 (P). Dim2 harvest/storage index instead showed significant associations with two other genomic regions on chromosome 12, with the first located at the position 4,974,563 (5.0 −log10 (P)) and the second region at 21,529,154–29,611,105 (5.0 to 8.0 −log10 (P)). The most significant SNPs identified for the Dim2 storage index were “SNP_FB_0114384” and “SNP_FB_0150537” (Figure 3). The allelic variability of the “SNP_FB_0114384” and “SNP_FB_0150537” markers was used to differentiate the distribution of the Dim2 storage index phenotypic variability (Figure 4). Based on the statistical analysis conducted among the possible diplotype categories in both SNP markers, only a double dose of the favorable allele showed a significant difference with respect to the other diplotype categories. The variability of the most significant SNP marker identified for Dim2 at harvest, “SNP_FB_0135153”, was used to differentiate the phenotypic distribution according to its diplotype configuration (Figure 4). Based on the statistical analysis conducted among the possible diplotype categories for this SNP marker, only the “GG” allelic combination showed a significant difference with respect to the other categories. The genomic region detected at the beginning of chromosome 12 was furthermore validated in the second year associated with the Dim1 storage index (Figure S3).
On chromosome 16, we found significant associations with the mechanical sub-traits (NFP, FF, and YM) and Dim1 in one single genomic region, with association values ranging from 6.0 to 15.0 –log−10 (P) (Table S4). The most significant SNP (“SNP_FB_0349124”) identified was associated with Dim 1 at storage index (Figure 3), and the variability of this marker was used to differentiate the distribution of the Dim1 storage index (Figure 4). Based on the statistical analysis conducted among the three possible diplotype categories, “A” was the favorable allele. The associations for texture traits detected on chromosome 16 were, however, not confirmed in the second year (Figure S3).

4. Discussion

Large germplasm collections are essential for capturing the overall phenotypic and genetic variability existing for a trait of interest and for detecting marker–trait associations. These types of analyses have a twofold goal. The first is the deciphering of the genetic control of a specific trait, while the second is the identification of potential markers to be implemented in marker-assisted breeding programs. To this end, increasing both types of variability (phenotypic and genetic) is essential for facilitating the identification of major loci. Large apple collections and genome-wide association studies have already been carried out to identify important loci and candidate genes controlling relevant traits for apple fruit quality [13,14,44,45]. In ongoing breeding programs, however, part of the variability available might act counterproductively for achieving specific breeding goals. Fruit texture and storability are, for instance, key traits in breeding programs world-wide. In crossing schemes, breeders nowadays consider only accessions with superior texture attributes or valuable phenotypes as parents because mealy and soft seedlings are discarded at an early stage. As a result, major texture-related loci may already be fixed in most breeding programs that are currently ongoing and oriented to select superior quality cultivars.
In this work, we present a GWAS carried out on a preselected collection (NAAC2) derived from a larger apple germplasm (NAAC1 [22]), for which two major loci on chromosome 10 (Figure 2) were fixed for the favorable alleles associated with fruit texture and storability. The NAAC2 subset, although showing a reduced variability, harbored the alleles and the phenotypic variation today exploited by breeders to select superior and crispy types of apples.
QTL for multiple texture components at harvest, postharvest, and for the storage index were found and distributed over eleven chromosomes. Evidence of loci on multiple chromosomes affecting texture and texture retainability was consistent with the hypothesis that fruit firmness is multigenic [37,46]. Amongst the marker–trait associations detected in the present study, the ones detected on chromosomes 3 and 12 were the most relevant and showed a consistent pattern across the two years of phenotypic assessment. However, we also found SNP-trait associations on chromosome 16 (Table S4), but only for the first year of texture assessment. On this chromosome, a SNP showed a significant association with three mechanical traits (NFP, FF, and YM) for the storage index and for the Dim1 storage index (Figure 4). In particular, the parameter depending on the elasticity of the sample, the YM, and the parameter correlated with the acoustic parameters, the NFP, showed high significance levels, with −log10 (P) values of 15.0 and 9.0, respectively. Furthermore, the identification of genomic regions located on chromosome 16 associated with the mechanical signature was consistent with the results of previous reports on texture [37,38,47,48] but had not previously been associated with texture retainability. On that premise, several QTLs have been discovered on chromosome 16 and associated with storability and postharvest disorders such as bitter pit, soft scald, and soggy breakdown [49,50]. The detection of a candidate region on chromosome 16 for this trait was also consistent with the results obtained in the QTL mapping study presented by Longhi, et al. [51], where two biparental populations with a different genetic control were considered. When the population segregated for MdPG1, a functional marker designed on a polygalacturonase gene known for its control on the cell wall degradation process, a major significant QTL was found. In the population not segregated for the MdPG1 marker, most of the QTLs were instead mapped on chromosome 16 and associated with all the mechanical parameters and only two acoustic parameters, namely MXA and MEA [51]. Further work is needed to confirm the role of chromosome 16 in relation to texture attributes and storability; however, the reported results suggest a genetic interaction between loci, with the locus on chromosome 10 playing a major role. When this locus is not segregated (i.e., is fixed), other minor loci can be detected. These regions might be interesting for their role in the control of minor phenotypic variance, essential to achieving important goals in modern breeding programs.

4.1. Novel SNPs Associated with Texture Properties Mapped on Chromosome 12

For the assessments carried out at harvest and for storage index, the Dim2 assigned to the acoustic signature allowed the identification of SNPs associated with chromosome 12 (Figure 3 and Figure 4). Except for a study on apple firmness at harvest [52] assessed with a standard penetrometer, chromosome 12 has not previously been associated with postharvest or texture retainability. The detection of candidate regions on chromosome 12 for these traits is consistent with the results obtained in the PBA study by Longhi et al. [51]. In the population where the QTL on chromosome 10 and related to MdPG1 was fixed, other QTLs were mapped on other genomic regions, including chromosome 12. These results provide evidence about the distinct genetic control for the two texture properties in apple and suggest the role of chromosome 12 in the determination of the acoustic properties. After exploring the window region of the most significant marker, a putative candidate gene, ARF4, was found, a member of the auxin response gene family (auxin response factors). The SNP marker associated with the Dim2 storage index was in a region close to this gene. The ortholog in tomato, SLARF4, was reported to be an important regulator of fruit ripening by controlling the metabolism of auxin [53]. Diminished expression of this gene resulted in a deviated ripening pattern, with fruit showing improved firmness and enhanced shelf life, supporting the role of this element in the metabolism of the fruit cell wall [53].

4.2. Signals on Chromosome 3 Associated with the Storage Index

When the mechanical texture signature (Dim1) was considered, relevant QTLs were identified on chromosome 3 at the postharvest time point (Figure 3 and Figure 4). These reported associations provided more evidence for texture in apple being a quantitative trait determined by multiple loci and suggested the role of chromosome 3 in the determination of mechanical properties when the major loci on chromosome 10 are fixed. These results were further underlined by the results from the second year, yet the significant association was detected for the storage index in the second year and not at postharvest. The associations detected on chromosome 3 were in line with the results of previous studies [37]. Numerous GWAS have been conducted to map QTL related to ripening time in apple, and several studies have identified SNPs associated with ripening period on chromosome 3 [11,12,13,38,40,54]. Migicovsky et al. [42] reported an overlap between associations with harvest time and fruit firmness measured at harvest on chromosome 3 falling within the coding region of NAC18.1. The most significant SNP marker located on chromosome 3 in our study and associated with the Dim1 component at postharvest (“SNP_FB_0532324”) was found at ~11 Mb upstream from the NAC18.1 SNP marker.

4.3. Breeding for Texture in Norwegian Apples

In the context of breeding for texture in Norwegian apples through marker-assisted selection, our results proposed that apple texture and storability could be improved by selecting seedlings with the support of a novel set of molecular markers. The major loci reported in literature until now, while important, may already be fixed in advanced breeding programs, which deal with a narrow phenotypic variability. In this work, we assembled an apple collection not segregated for the effect of two important loci on chromosome 10. Although reduced compared to larger collections, the variability of the NAAC2 collection represents the amount of variance that breeders are exploiting for the creation of superior accessions. The NAAC2 in fact enabled the identification of four new molecular markers, SNP_FB_0532324 on chromosome 3 for firmness and SNP_FB_0114384, SNP_FB_0150537, and SNP_FB_0135153 on chromosome 12, associated with crispness (Dim2 at harvest) and crispness retention (the Dim2 storage index). Their additive effect will allow breeders to pyramid the homozygous allelotype configurations and select for enhanced fruit quality performance. This study also highlighted the need to assess fruit texture during postharvest, or to consider other specific parameters such as the storage index, rather than considering fruit texture assessed only at harvest. Due to the limited variability of this collection and the complexity of this type of trait that can be influenced by maturity stage [55], additional investigations with a larger, properly designed collection would provide additional knowledge on specific aspects of fruit texture.

5. Conclusions

In this study, a QTL analysis for texture performance was conducted on a sub-collection of apple accessions, composed of individuals with the homozygous state of the favorable alleles of two markers known to be associated with this trait. This collection (NAAC2), although showing reduced phenotypic variability, represents the actual variance currently exploited by breeders. For the selection of novel and superior accessions, only elite cultivars with valuable traits are typically used as parental lines. However, this reduced variability allowed the identification of a novel set of minor QTLs, which are not usually detected when other major QTLs are targeted in larger collections also containing low-performing accessions. The newly defined set of QTLs and associated markers reported here can be considered a new tool to assist in the selection of new accessions distinguished by superior fruit quality. Such molecular markers can now support in the selection processes of complex traits, such as fruit texture. Although fruit texture is a key trait for consumer preference and potential storability, it requires multiple assessments during storage and a specific phenotyping device to distinguish mechanical from acoustic components. Moreover, most available markers associated with major QTLs are already fixed in most modern elite cultivars. In this context, the new set of QTLs and markers reported in this study may represent a novel molecular tool for identifying new superior apple accessions characterized by improved crispness and storability. The results presented here strengthen the complex and polygenic control of fruit texture, and the effect of these loci with a minor effect can be further implemented in the NABP in the close future, enlarging the number of accessions to be included in the NAAC2, increasing the marker density, and enabling genomic selection strategies to increase breeding efficiency and genetic gain.

Supplementary Materials

The following supporting information can be downloaded at: https://www.mdpi.com/article/10.3390/horticulturae10101049/s1, Figure S1: PCA biplot of the 60 accessions in the NAAC2; Figure S2: The scree plot with eigenvalues for the NAAC2 at harvest, postharvest and for the storage index; Figure S3: Manhattan plots for NAAC2 using BLUP values; Table S1: List of the 197 apple accessions from the NAAC1 employed in this study; Table S2: List of the 60 apple accessions included in the NAAC2; Table S3: List of dissected apple fruit texture traits analyzed in the study; Table S4: NAAC2 GWAS results using the model MLMM and/or FarmCPU, showing significant p-values for eight texture traits.

Author Contributions

Conceptualization, L.G. and F.C.; writing—original draft, L.G. and F.C.; methodology, L.G. and F.C.; investigation, L.G.; data curation, L.G.; visualization, L.G.; Project administration, L.G. and M.A.; writing—review and editing, L.G., D.R., M.A. and F.C.; supervision, M.A., D.R. and F.C.; funding acquisition, M.A. All authors have read and agreed to the published version of the manuscript.

Funding

This research was funded by a Ph.D. scholarship from the Research Council of Norway (Project nr. 322,792) and a generous grant from Sparebankstiftinga Sogn og Fjordane.

Data Availability Statement

All relevant data generated or analyzed are included in the manuscript and the Supporting Materials.

Acknowledgments

We gratefully acknowledge and thank Michela Troggio at Fondazione Edmund Mach, for facilitating a research internship and for conducting expertise work at their genomics platform, both of which were instrumental for the accomplishments of this paper. We are grateful to our colleagues Susanne Windju and Espen Sørensen for fruitful discussions and valuable help during data curation and to our colleagues at Njøs Fruit and Berry Centre, Susann Herzog, Kurab Røen, Anete Busa, Anne Sigrid Skjerdal, Sigurd Molvik, and Sverre Moe, for skillful technical assistance in the laboratory and in the field.

Conflicts of Interest

The authors declare that they have no known competing commercial interests or personal relationships that could have appeared to influence the work reported in this paper.

References

  1. LMD. Meld. St. 11 Strategi for auka sjølvforsyning av jordbruksvarer og plan for opptrapping av inntektsmoglegheitene i jordbruket. In Ministry of Agriculture and Food; Tryggings- og serviceorganisasjonen til departementa: Oslo, Norway, 2023; p. 58. [Google Scholar]
  2. OFG. Frukt- og grøntstatistikk 2023. Available online: www.frukt.no (accessed on 30 September 2024).
  3. Velasco, R.; Zharkikh, A.; Affourtit, J.; Dhingra, A.; Cestaro, A.; Kalyanaraman, A.; Fontana, P.; Bhatnagar, S.K.; Troggio, M.; Pruss, D. The genome of the domesticated apple (Malus × domestica Borkh.). Nat. Genet. 2010, 42, 833–839. [Google Scholar] [CrossRef] [PubMed]
  4. Nybom, H.; Ahmadi-Afzadi, M.; Garkava-Gustavsson, L.; Sehic, J.; Tahir, I. Selection for improved fruit texture and storability in apple. In Proceedings of the XXVIII International Horticultural Congress on Science and Horticulture for People (IHC2010): International Symposium, Leuven, Belgium, 22–27 August 2010; pp. 849–854. [Google Scholar]
  5. El-Ramady, H.R.; Domokos-Szabolcsy, É.; Abdalla, N.A.; Taha, H.S.; Fári, M. Postharvest Management of Fruits and Vegetables Storage. In Sustainable Agriculture Reviews: Volume 15; Lichtfouse, E., Ed.; Springer International Publishing: Cham, Switzerland, 2015; pp. 65–152. [Google Scholar] [CrossRef]
  6. Galvez-Lopez, D.; Laurens, F.; Quéméner, B.; Lahaye, M. Variability of cell wall polysaccharides composition and hemicellulose enzymatic profile in an apple progeny. Int. J. Biol. Macromol. 2011, 49, 1104–1109. [Google Scholar] [CrossRef] [PubMed]
  7. Costa, F.; Cappellin, L.; Longhi, S.; Guerra, W.; Magnago, P.; Porro, D.; Soukoulis, C.; Salvi, S.; Velasco, R.; Biasioli, F.; et al. Assessment of apple (Malus × domestica Borkh.) fruit texture by a combined acoustic-mechanical profiling strategy. Postharvest Biol. Technol. 2011, 61, 21–28. [Google Scholar] [CrossRef]
  8. Costa, F.; Van de Weg, W.E.; Stella, S.; Dondini, L.; Pratesi, D.; Musacchi, S.; Sansavini, S. Map position and functional allelic diversity of Md-Exp7, a new putative expansin gene associated with fruit softening in apple (Malus × domestica Borkh.) and pear (Pyrus communis). Tree Genet. Genomes 2008, 4, 575–586. [Google Scholar] [CrossRef]
  9. Tadiello, A.; Longhi, S.; Moretto, M.; Ferrarini, A.; Tononi, P.; Farneti, B.; Busatto, N.; Vrhovsek, U.; Molin, A.D.; Avanzato, C.; et al. Interference with ethylene perception at receptor level sheds light on auxin and transcriptional circuits associated with the climacteric ripening of apple fruit (Malus × domestica Borkh.). Plant J. 2016, 88, 963–975. [Google Scholar] [CrossRef]
  10. Baumgartner, I.O.; Kellerhals, M.; Costa, F.; Dondini, L.; Pagliarani, G.; Gregori, R.; Tartarini, S.; Leumann, L.; Laurens, F.; Patocchi, A. Development of SNP-based assays for disease resistance and fruit quality traits in apple (Malus × domestica Borkh.) and validation in breeding pilot studies. Tree Genet. Genomes 2016, 12, 35. [Google Scholar] [CrossRef]
  11. Migicovsky, Z.; Yeats, T.H.; Watts, S.; Song, J.; Forney, C.F.; Burgher-MacLellan, K.; Somers, D.J.; Gong, Y.; Zhang, Z.; Vrebalov, J.; et al. Apple Ripening Is Controlled by a NAC Transcription Factor. Front. Genet. 2021, 12, 671300. [Google Scholar] [CrossRef]
  12. Jung, M.; Keller, B.; Roth, M.; Aranzana, M.J.; Auwerkerken, A.; Guerra, W.; Al-Rifaï, M.; Lewandowski, M.; Sanin, N.; Rymenants, M. Genetic architecture and genomic predictive ability of apple quantitative traits across environments. Hortic. Res. 2022, 9, uhac028. [Google Scholar] [CrossRef]
  13. Larsen, B.; Migicovsky, Z.; Jeppesen, A.A.; Gardner, K.M.; Toldam-Andersen, T.B.; Myles, S.; Ørgaard, M.; Petersen, M.A.; Pedersen, C. Genome-Wide Association Studies in Apple Reveal Loci for Aroma Volatiles, Sugar Composition, and Harvest Date. Plant Genome 2019, 12, 180104. [Google Scholar] [CrossRef]
  14. Watts, S.; Migicovsky, Z.; Myles, S. Large-scale apple GWAS reveals NAC18.1 as a master regulator of ripening traits. Fruit Res. 2023, 3, 32. [Google Scholar] [CrossRef]
  15. Nybom, H. Advances in understanding texture development in apples. In Improving the Quality of Apples; Costa, F., Ed.; Burleigh Dodds Science Publishing Limited: Cambridge, UK, 2023; Volume 142, p. 230. [Google Scholar]
  16. Laurens, F.; Aranzana, M.J.; Arus, P.; Bassi, D.; Bink, M.; Bonany, J.; Caprera, A.; Corelli-Grappadelli, L.; Costes, E.; Durel, C.-E.; et al. An integrated approach for increasing breeding efficiency in apple and peach in Europe. Hortic. Res. 2018, 5, 11. [Google Scholar] [CrossRef] [PubMed]
  17. Visscher, P.M.; Haley, C.S.; Thompson, R. Marker-Assisted Introgression in Backcross Breeding Programs. Genetics 1996, 144, 1923–1932. [Google Scholar] [CrossRef] [PubMed]
  18. Eberhart, S.A. Factors effecting efficiencies of breeding methods. Afr. Soils 1970, 15, 655–680. [Google Scholar]
  19. Lush, J.L. Animal Breeding Plans; Iowa State College Press: Ames, IA, USA, 1943; pp. viii + 437. [Google Scholar]
  20. Kostick, S.A.; Norelli, J.L.; Teh, S.L.; Evans, K.M. Quantitative variation and heritability estimates of fire blight resistance in a pedigree-connected apple germplasm set. J. Plant Pathol. 2021, 103, 65–75. [Google Scholar] [CrossRef]
  21. Kouassi, A.B.; Durel, C.-E.; Costa, F.; Tartarini, S.; van de Weg, E.; Evans, K.; Fernandez-Fernandez, F.; Govan, C.; Boudichevskaja, A.; Dunemann, F.; et al. Estimation of genetic parameters and prediction of breeding values for apple fruit-quality traits using pedigreed plant material in Europe. Tree Genet. Genomes 2009, 5, 659–672. [Google Scholar] [CrossRef]
  22. Gilpin, L.; Røen, D.; Schubert, M.; Davik, J.; Rumpunen, K.; Gardli, K.A.; Hjeltnes, S.H.; Alsheikh, M. Genetic Characterization of the Norwegian Apple Collection. Horticulturae 2023, 9, 575. [Google Scholar] [CrossRef]
  23. Bianco, L.; Cestaro, A.; Sargent, D.J.; Banchi, E.; Derdak, S.; Di Guardo, M.; Salvi, S.; Jansen, J.; Viola, R.; Gut, I. Development and validation of a 20K single nucleotide polymorphism (SNP) whole genome genotyping array for apple (Malus × domestica Borkh). PLoS ONE 2014, 9, e110377. [Google Scholar] [CrossRef]
  24. Farneti, B.; Di Guardo, M.; Khomenko, I.; Cappellin, L.; Biasioli, F.; Velasco, R.; Costa, F. Genome-wide association study unravels the genetic control of the apple volatilome and its interplay with fruit texture. J. Exp. Bot. 2017, 68, 1467–1478. [Google Scholar] [CrossRef]
  25. Costa, F.; Cappellin, L.; Fontanari, M.; Longhi, S.; Guerra, W.; Magnago, P.; Gasperi, F.; Biasioli, F. Texture dynamics during postharvest cold storage ripening in apple (Malus × domestica Borkh.). Postharvest Biol. Technol. 2012, 69, 54–63. [Google Scholar] [CrossRef]
  26. R Core Team. R: A Language and Environment for Statistical Computing, R Foundation for Statistical Computing: Vienna, Austria, 2023.
  27. Kassambara, A.; Mundt, F. Factoextra: Extract and Visualize the Results of Multivariate Data Analyses 2020, R Package Version 1.0.7. Available online: https://CRAN.R-project.org/package=factoextra (accessed on 20 August 2024).
  28. Harrell, F.E., Jr.; Harrell, M.F.E., Jr. Package ‘hmisc’. CRAN2018 2019, 2019, 235–236. [Google Scholar]
  29. Bates, D.; Mächler, M.; Bolker, B.; Walker, S. Fitting linear mixed-effects models using lme4. arXiv 2014, arXiv:1406.5823. [Google Scholar]
  30. Vanderzande, S.; Howard, N.P.; Cai, L.; Da Silva Linge, C.; Antanaviciute, L.; Bink, M.C.; Kruisselbrink, J.W.; Bassil, N.; Gasic, K.; Lezzoni, A. High-quality, genome-wide SNP genotypic data for pedigreed germplasm of the diploid outbreeding species apple, peach, and sweet cherry through a common workflow. PLoS ONE 2019, 14, e0210928. [Google Scholar] [CrossRef] [PubMed]
  31. Howard, N.P.; Troggio, M.; Durel, C.-E.; Muranty, H.; Denancé, C.; Bianco, L.; Tillman, J.; van de Weg, E. Integration of Infinium and Axiom SNP array data in the outcrossing species Malus × domestica and causes for seemingly incompatible calls. BMC Genom. 2021, 22, 246. [Google Scholar] [CrossRef] [PubMed]
  32. Di Pierro, E.A.; Gianfranceschi, L.; Di Guardo, M.; Koehorst-van Putten, H.J.J.; Kruisselbrink, J.W.; Longhi, S.; Troggio, M.; Bianco, L.; Muranty, H.; Pagliarani, G.; et al. A high-density, multi-parental SNP genetic map on apple validates a new mapping approach for outcrossing species. Hortic. Res. 2016, 3, 16057. [Google Scholar] [CrossRef] [PubMed]
  33. Howard, N.P.; van de Weg, E.; Bedford, D.S.; Peace, C.P.; Vanderzande, S.; Clark, M.D.; Teh, S.L.; Cai, L.; Luby, J.J. Elucidation of the ‘Honeycrisp’ pedigree through haplotype analysis with a multi-family integrated SNP linkage map and a large apple (Malus × domestica) pedigree-connected SNP data set. Hortic. Res. 2017, 4, 17003. [Google Scholar] [CrossRef]
  34. Wang, J.; Zhang, Z. GAPIT Version 3: Boosting Power and Accuracy for Genomic Association and Prediction. Genom. Proteom. Bioinform. 2021, 19, 629–640. [Google Scholar] [CrossRef]
  35. Benjamini, Y.; Hochberg, Y. Controlling the False Discovery Rate: A Practical and Powerful Approach to Multiple Testing. J. R. Stat. Soc. Ser. B (Methodol.) 1995, 57, 289–300. [Google Scholar] [CrossRef]
  36. Jung, S.; Lee, T.; Cheng, C.H.; Buble, K.; Zheng, P.; Yu, J.; Humann, J.; Ficklin, S.P.; Gasic, K.; Scott, K.; et al. 15 years of GDR: New data and functionality in the Genome Database for Rosaceae. Nucleic Acids Res. 2019, 47, D1137–D1145. [Google Scholar] [CrossRef]
  37. Bink, M.C.A.M.; Jansen, J.; Madduri, M.; Voorrips, R.E.; Durel, C.E.; Kouassi, A.B.; Laurens, F.; Mathis, F.; Gessler, C.; Gobbin, D.; et al. Bayesian QTL analyses using pedigreed families of an outcrossing species, with application to fruit firmness in apple. Theor. Appl. Genet. 2014, 127, 1073–1090. [Google Scholar] [CrossRef]
  38. Chagné, D.; Dayatilake, D.; Diack, R.; Oliver, M.; Ireland, H.; Watson, A.; Gardiner, S.E.; Johnston, J.W.; Schaffer, R.J.; Tustin, S. Genetic and environmental control of fruit maturation, dry matter and firmness in apple (Malus × domestica Borkh.). Hortic. Res. 2014, 1, 14046. [Google Scholar] [CrossRef]
  39. Di Guardo, M.; Bink, M.C.A.M.; Guerra, W.; Letschka, T.; Lozano, L.; Busatto, N.; Poles, L.; Tadiello, A.; Bianco, L.; Visser, R.G.F.; et al. Deciphering the genetic control of fruit texture in apple by multiple family-based analysis and genome-wide association. J. Experimental Botany 2017, 68, 1451–1466. [Google Scholar] [CrossRef] [PubMed]
  40. Jung, M.; Roth, M.; Aranzana, M.J.; Auwerkerken, A.; Bink, M.; Denancé, C.; Dujak, C.; Durel, C.-E.; Font i Forcada, C.; Cantin, C.M.; et al. The apple REFPOP—A reference population for genomics-assisted breeding in apple. Hortic. Res. 2020, 7, 189. [Google Scholar] [CrossRef] [PubMed]
  41. Longhi, S.; Hamblin, M.T.; Trainotti, L.; Peace, C.P.; Velasco, R.; Costa, F. A candidate gene based approach validates Md-PG1 as the main responsible for a QTL impacting fruit texture in apple (Malus x domesticaBorkh). BMC Plant Biology 2013, 13, 37. [Google Scholar] [CrossRef] [PubMed]
  42. Migicovsky, Z.; Gardner, K.M.; Money, D.; Sawler, J.; Bloom, J.S.; Moffett, P.; Chao, C.T.; Schwaninger, H.; Fazio, G.; Zhong, G.-Y.; et al. Genome to Phenome Mapping in Apple Using Historical Data. Plant Genome 2016, 9. [Google Scholar] [CrossRef]
  43. Daccord, N.; Celton, J.-M.; Linsmith, G.; Becker, C.; Choisne, N.; Schijlen, E.; van de Geest, H.; Bianco, L.; Micheletti, D.; Velasco, R.; et al. High-quality de novo assembly of the apple genome and methylome dynamics of early fruit development. Nat. Genet. 2017, 49, 1099–1106. [Google Scholar] [CrossRef]
  44. Dujak, C.; Coleto-Alcudia, V.; Aranzana, M.J. Genomic analysis of fruit size and shape traits in apple: Unveiling candidate genes through GWAS analysis. Hortic. Res. 2023, 11, uhad270. [Google Scholar] [CrossRef]
  45. McClure, K.A.; Gong, Y.; Song, J.; Vinqvist-Tymchuk, M.; Campbell Palmer, L.; Fan, L.; Burgher-MacLellan, K.; Zhang, Z.; Celton, J.-M.; Forney, C.F.; et al. Genome-wide association studies in apple reveal loci of large effect controlling apple polyphenols. Hortic. Res. 2019, 6, 107. [Google Scholar] [CrossRef]
  46. Roth, M.; Muranty, H.; Di Guardo, M.; Guerra, W.; Patocchi, A.; Costa, F. Genomic prediction of fruit texture and training population optimization towards the application of genomic selection in apple. Hortic. Res. 2020, 7, 148. [Google Scholar] [CrossRef]
  47. Kostick, S.A.; Bernardo, R.; Luby, J.J. Genomewide selection for fruit quality traits in apple: Breeding insights gained from prediction and postdiction. Hortic. Res. 2023, 10, uhad088. [Google Scholar] [CrossRef]
  48. King, G.J.; Lynn, J.R.; Dover, C.J.; Evans, K.M.; Seymour, G.B. Resolution of quantitative trait loci for mechanical measures accounting for genetic variation in fruit texture of apple (Malus pumila Mill.). Theor. Appl. Genet. 2001, 102, 1227–1235. [Google Scholar] [CrossRef]
  49. Bus, V.G.M.; Bowen, J.K.; Patocchi, A.; Broggini, G.A.L.; Kumar, S.; Laurens, F.N.D. Breeding fruit cultivars with durable disease resistance. In Integrated Management of Diseases and Insect Pests of Tree Fruit; Xu, X., Ed.; Burleigh Dodds Science Publishing Limited: Cambridge, UK, 2019; pp. 233–274. [Google Scholar] [CrossRef]
  50. Howard, N.P.; van de Weg, E.; Tillman, J.; Tong, C.B.S.; Silverstein, K.A.T.; Luby, J.J. Two QTL characterized for soft scald and soggy breakdown in apple (Malus × domestica) through pedigree-based analysis of a large population of interconnected families. Tree Genet. Genomes 2017, 14, 2. [Google Scholar] [CrossRef]
  51. Longhi, S.; Moretto, M.; Viola, R.; Velasco, R.; Costa, F. Comprehensive QTL mapping survey dissects the complex fruit texture physiology in apple (Malus × domestica Borkh.). J. Exp. Bot. 2012, 63, 1107–1121. [Google Scholar] [CrossRef] [PubMed]
  52. Liebhard, R.; Kellerhals, M.; Pfammatter, W.; Jertmini, M.; Gessler, C. Mapping quantitative physiological traits in apple (Malus × domestica Borkh.). Plant Mol. Biol. 2003, 52, 511–526. [Google Scholar] [CrossRef] [PubMed]
  53. Sagar, M.; Chervin, C.; Roustan, J.-P.; Bouzayen, M.; Zouine, M. Under-expression of the Auxin Response Factor Sl-ARF4 improves post-harvest behavior of tomato fruits. Plant Signal. Behav. 2013, 8, e25647. [Google Scholar] [CrossRef]
  54. Urrestarazu, J.; Muranty, H.; Denancé, C.; Leforestier, D.; Ravon, E.; Guyader, A.; Guisnel, R.; Feugey, L.; Aubourg, S.; Celton, J.-M.; et al. Genome-Wide Association Mapping of Flowering and Ripening Periods in Apple. Front. Plant Sci. 2017, 8, 1923. [Google Scholar] [CrossRef]
  55. Brown, S. Apple. In Fruit Breeding, Handbook of Plant Breeding; Badenes, M.L., Byrne, D.H., Eds.; Springer: Berlin/Heidelberg, Germany, 2012; pp. 329–367. [Google Scholar]
Figure 2. Two-dimensional PCA plots of variables illustrating the fruit texture variability evaluated in the NAAC2, at harvest (A), postharvest (B), and for the storage index (C). The loading variables yield force (P1), maximum force (P2), final force (P3), number of force peaks (P4), force strain area (P5), force linear distance (P6), Young’s Modulus (P7), mean force (P8), number of acoustic peaks (P9), maximum acoustic pressure (P10), mean acoustic pressure (P11), and acoustic linear distance (P12) are colored according to group: mechanical (red) and acoustic (blue). The mechanical parameter “number of force peaks” has been reported [7] to correlate with the acoustic parameters, hence the yellow coloration.
Horticulturae 10 01049 g002
Figure 3. Manhattan plots using FarmCPU and MLMM with a minor allele frequency ≥5% and FDR corrected significance thresholds of the NAAC2 genotypes, together with phenotypic data collected at harvest, postharvest, and for the storage index in 2022. The mechanical texture signature is depicted at the upper half of the figure (Dim1), and significant associations were detected on chromosome 3 at postharvest and chromosome 16 for the storage index. The acoustic texture signature is depicted at the lower half of the figure (Dim2), and for this texture parameter, chromosome 12 was mapped as a novel region at both harvest and for the storage index.
Horticulturae 10 01049 g003
Figure 4. Marker associations for Dim1 postharvest/storage index and Dim2 harvest/storage index with a narrowed-in view on chromosomes 3, 12, and 16, with the most significant markers marked in red. The left panels depict the phenotypic distribution of the markers with the most significant signal for the storage index among NAAC2 apple accessions grouped according to their genotype in this SNP. Different lowercase letters are significant differences, defined by Tukey’s multiple comparisons of means at 95% family-wise confidence level between the homozygous and heterozygous alleles.
Horticulturae 10 01049 g004
Disclaimer/Publisher’s Note: The statements, opinions and data contained in all publications are solely those of the individual author(s) and contributor(s) and not of MDPI and/or the editor(s). MDPI and/or the editor(s) disclaim responsibility for any injury to people or property resulting from any ideas, methods, instructions or products referred to in the content.

