Abstract
Anthocyanins, recognized as stress indicators, particularly under high-light conditions, play a pivotal role in plant stress responses. The advent of transcriptomics has opened avenues to elucidate the mechanisms underlying high light-induced anthocyanin biosynthesis. This study delved into transcriptomic changes in Begonia semperflorens leaves under varying light intensities: 950–9600 lx (TL_100), 6800–7000 lx (HS_75), and 4300–4500 lx (LS_25). To confirm the expression profiles of the key genes, we chose 12 critical genes associated with anthocyanin production for quantitative reverse transcription PCR (qRT-qPCR) analysis. Following this, we measured the levels of anthocyanins to substantiate the findings from the gene expression analysis. The transcriptome assembly in this study was extensive, yielding 43,038 unigenes that collectively spanned about 49.83 million base pairs, with an average unigene length of 1157 bp and an N50 value of 1685 bp. This assembly facilitated a thorough functional annotation across seven distinct protein databases, leading to the classification of 16,363 unigenes into 58 different families of transcription factors. Our comparative analysis of the transcriptomes highlighted a substantial number of differentially expressed genes (DEGs): 5411 DEGs between HS_75 and TL_100 conditions, with 3078 showing increased expression and 2333 showing decreased expression; 4701 DEGs between LS_25 and TL_100, consisting of 2648 up-regulated and 2053 down-regulated genes; and 6558 DEGs between LS_25 and HS_75, with 3032 genes up-regulated and 3526 down-regulated. These DEGs were significantly involved in critical pathways, such as anthocyanin synthesis, plant hormone signaling, and other regulatory mechanisms. This study suggests that genes, including F3′H, MYB102, and SWEET1, could play vital roles in regulating anthocyanin synthesis in response to various light conditions, potentially impacting the expression levels of other genes, like WRKYs, ATHB12, and those similar to HSP.
1. Introduction
Ornamental plants, renowned for their diverse colors and patterns, significantly contribute to the aesthetics and commercial success within the floriculture industry [1,2]. Predominant pigments, like chlorophyll, flavonoids, carotenoids, and betalains, define plant coloration, each stemming from distinct metabolic pathways [3,4]. Flavonoids, a prevalent class of secondary metabolites in angiosperms, exhibit a wide spectrum of colors [5]. These compounds are crucial for various physiological roles in plants, including pigmentation, resilience against biotic and abiotic stressors, and developmental regulation. For instance, studies have shown that flavonoids in Ginkgo biloba confer resistance to low temperatures and salt stress by scavenging free radicals [6] and offer protection against insect predation [7]. In Oryza sativa, the flavonoids present in phloem or leaves can deter pests like Niloparvata lugens or Ditylenchus angustus, inhibit the growth of fungi and bacteria, and counteract other pathogenic organisms [8,9]. In Arabidopsis, flavonols are known to influence auxin transport, impacting root growth, anther dehiscence, and pollen germination [10].
Anthocyanins, a subset of flavonoids, are water-soluble pigments responsible for vibrant hues, ranging from orange to blue in leaves, flowers, and fruits [4,11]. These compounds serve as vital secondary metabolites, imparting color to plant tissues and protecting against the oxidative stress caused by environmental factors, such as salinity, low temperature, drought, and high light [12]. They also safeguard against ultraviolet radiation and help prevent oxidative damage to DNA [7,13]. Furthermore, anthocyanins in Arabidopsis seeds play a role in regulating dormancy and germination [14]. Beyond their aesthetic value in ornamental plants, flavonoids have been recognized for their antioxidant properties, which contribute to neuroprotection, anti-inflammatory effects, pain relief, antibacterial and antispasmodic activities, cancer cell growth inhibition, and cardiovascular disease prevention [8,15].
B. semperflorens, a perennial evergreen herb belonging to the Begonia family, is extensively used for ornamental purposes in gardens and lawns. Its leaves often exhibit red pigmentation, primarily due to the accumulation of anthocyanins, in response to environmental triggers, such as low temperature, intense light, malnutrition, and physical injury. This makes B. semperflorens an excellent subject for investigating environmentally induced anthocyanin synthesis. However, detailed genetic information on many Begoniaceae species remains scarce. Transcriptome sequencing has emerged as an accurate and reliable method for exploring genomic characteristics, particularly for plants with unsequenced genomes, aiding in the comprehensive understanding of plant growth and regulatory mechanisms [16,17]. Under a low-nitrogen environment, the PAL (phenylalanine ammonia-lyase), CHS (chalcone synthase), and DFR (dihydroflavonol 4-reductase) genes are responsible for accumulating flavonoids in snow chrysanthemum (Coreopsis tinctoria Nutt.); this was revealed through both flavonoid metabolism and transcriptomics [16]. In Chrysanthemum morifolium, a combination of genomic and transcriptomic approaches demonstrates that the C. morifolium genome can be used to identify genes underlying key ornamental traits [17].
Previous research has demonstrated that lower temperatures increase the anthocyanin content in B. semperflorens seedlings, with reactive oxygen species (ROS) produced by BsRBOHD playing a crucial role in this process [18,19]. Additionally, short day conditions have been identified as essential for anthocyanin biosynthesis in Begonia seedlings under low temperatures [19]. When the shading degree was increased, the flower number, chlorophyll content, peroxidase activity, and nitrate reductase began to increase and then decreased, while the anthocyanin content decreased gradually [20]. However, the specific mechanisms through which light influences anthocyanin biosynthesis remain under-explored. In this study, we analyzed the transcriptomes of adult B. semperflorens leaves under various light conditions—TL_100 (9500–9600 lx), HS_75 (6800–7000 lx), and LS_25 (4300–4500 lx)—to unravel the biological mechanisms governing anthocyanin biosynthesis in response to light.
2. Methods
2.1. Plant Material and Treatment
B. semperflorens plants were grown in plastic containers filled with a 7:3 mixture of peat and vermiculite, with three plants per pot. These were then acclimatized to natural environmental conditions. After 20 d, the plants underwent different light treatments using shading nets set 1.5 m above the ground, creating three light intensity environments: TL_100 (9500–9600 lx), HS_75 (6800–7000 lx), and LS_25 (4300–4500 lx). Each treatment group consisted of twenty pots. Then, 30 d later, the third and fourth leaves from each plant were collected, instantly frozen in liquid nitrogen, and stored at −80 °C for RNA extraction. For RNA-seq analysis, three biological replicates were used per treatment group.
2.2. Sequencing and De Novo Splicing
The total RNA was isolated and contaminating DNA was removed using DNase. Eukaryotic mRNAs were then enriched using Oligo (DT) magnetic beads. Following this, single-stranded cDNA was synthesized using random primers, which was then converted into double-stranded cDNA. The double-stranded cDNA underwent end repair, a-tailing, adapter ligation, size selection, and PCR amplification. Sequencing was carried out using the Illumina HiSeq X Ten platform, generating 150 bp paired-end reads. Unigenes were identified using Trinity software (version 2.4.0) for splice assembly, selecting the longest sequence per gene based on similarity and length [21]. CD-HIT software (version 4.6) was employed to cluster sequences and eliminate redundancy [22].
2.3. Database Annotation and Unigene Expression Analysis
Unigenes were annotated using various databases, including NR, KOG, GO, Swiss-Prot, eggNOG, KEGG, and the Pfam database, employing diamond (version 0.4.7) and HMMER software (version 3.0) [23,24]. The abundance of each unigene’s expression was quantified using sequence similarity comparison methods [25]. Bowtie2 software (version 2.3.3.1) was used to map reads to unigenes and expression levels were determined by calculating Fragments Per Kilobase of transcript per million mapped reads (FPKMs) using eXpress software (version 1.5.1) [26,27]. DESeq software (version 1.18.0) was used to normalize unigene counts, calculate expression multiples, and assess the significance of read number differences using a negative binomial distribution [28]. Significantly different expression was defined by a p-value < 0.05 and an absolute log2 fold change >2.
2.4. Quantitative RT-PCR
For qRT-PCR analysis, we collected the third leaf from each B. semperflorens plant. Tissue samples, comprising a combination of 3 to 5 plants, represented a single biological replicate. And 1 microgram of RNA was used for cDNA synthesis via reverse transcription with PrimeScript®Reverse Transcriptase. Primer design was facilitated by Primer 5.0 software. Each tissue sample was subjected to qRT-PCR in triplicate, and the reaction conditions were as follows: 95 °C/10 s, 40 cycles of 95 °C/10 s, and 60 °C/45 s. Relative abundance of transcripts was determined using the 2−ΔΔCt method [29], with the B. semperflorens 18S rRNA gene serving as the reference.
2.5. Anthocyanin Quantification
We quantified anthocyanin content following the protocol by Mita et al. [30]. Leaf tissue, weighing 0.3 g, was homogenized in 3 mL of 1% HCl in methanol and incubated in darkness at 4 °C for 24 h. After centrifugation at 3500× g for 15 min, we measured the absorbance of the supernatant at 530 nm and 657 nm. Anthocyanin content was calculated as the absorbance unit (A530–0.25 × A657) per mL of the extraction solution.
3. Results
3.1. Anthocyanin Quantification, RNA-Seq, and Sequence Assembly
Exposure to light induced a red pigmentation in B. semperflorens leaves, with the TL_100 treatment resulting in entirely red leaves (Figure 1A). Correspondingly, the anthocyanin content in the leaves increased with light intensity (Figure 1B). Leaf samples from the three light treatments (LS_25, HS_75, and TL_100), including biological replicates, were used to construct the libraries using Illumina sequencing.
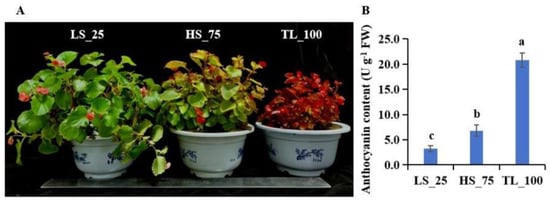
Figure 1.
Phenotypes (A) and the relative content of anthocyanin (B) in the leaves of B. semperflorens under different light conditions: TL_100 (9500–9600 lx), HS_75 (6800–7000 lx), and LS_25 (4300–4500 lx). Values given in the form of mean ± SE (n = 3). Significant differences were analyzed using Duncan’s multiple range test; bars with different letters (a, b, c) are significantly different from each other (p < 0.05).
In this study, a total of nine samples (SJHT01–SJHT09) were analyzed (Table 1 and Table S1). Trimmomatic software (version 0.36) was employed to preprocess the quality of the raw data [31]. Low-quality bases at the 3′ and 5′ ends were trimmed and the number of reads was counted. A total of 43,038 unigenes were assembled, with an average length of 1157 bp, an N50 value of 1685 bp, and a range of lengths from 301 to 13,934 bp. The Q30 score for each sample ranged between 94.13% and 94.72%, with an average GC content of 46.78%.

Table 1.
Summary of sequencing data quality preprocessing results.
For mapping clean reads to unigenes, Bowtie2 software (version 2.3.3.1) was utilized, showing a total read mapping rate of 100%, with over 80% of reads mapped and more than 60% uniquely mapped (Table 2) [25]. Pearson’s correlation coefficient among biological replicates in each light condition indicated a high transcript abundance correlation (Figure S1). This was further supported by principal component analysis (PCA) results (Figure S2).
Table 2.
Statistics of comparison results between reads and unigenes.
3.2. Transcriptome Functional Annotation
The unigenes were compared with NR, KOG, GO, Swiss-Prot, eggNOG, and the KEGG database using diamond software (version 0.4.7) and the Pfam database via HMMER software (version 3.0) [23,24]. All of the unigenes were aligned to the NR, Swiss-Prot, KEGG, KOG, eggNOG, GO, and Pfam protein databases. And the results showed that 31,197, 24,591, 12,096, 18,309, 30,226, 22,489, and 41 unigenes were identified in the NR, Swiss-Prot, KEGG, KOG, eggNOG, GO, and Pfam protein databases, respectively (Table 3). Most unigenes were annotated in NR protein databases, reaching 72.49%.
Table 3.
Annotation of the unigenes in seven databases.
3.3. Differentially Expressed Gene Analysis
Differential gene expression was assessed using DESeq software (version 1.18.0) [32]. A total of 5411 DEGs were identified between HS_75 and TL_100, with 3078 up-regulated and 2333 down-regulated (Figure 2A; Table S2). In the LS_25 vs. TL_100 comparison, 4701 DEGs were identified, with 2648 up-regulated and 2053 down-regulated (Figure 2A; Table S3). Between LS_25 and HS_75, there were 6558 DEGs, with 3032 up-regulated and 3526 down-regulated (Figure 2A; Table S4). Additionally, 416 DEGs were commonly expressed across all three comparisons (Figure 2B; Table S5).
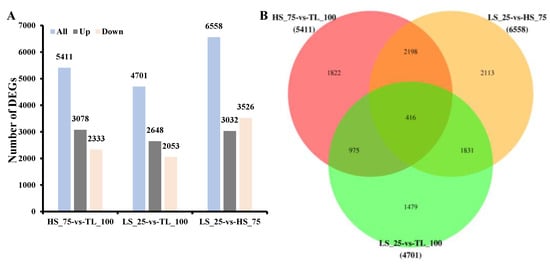
Figure 2.
Number of up- or down-regulated genes in the three comparisons (A). The unigene venn diagram was expressed differently in each group (B).
3.3.1. GO Enrichment Analysis of DEGs
GO enrichment analysis was performed on the DEGs and results were integrated with those of GO annotations. The number of differential mRNAs produced in each GO term was counted and hypergeometric distribution tests were conducted to determine the significance of enrichment (Figure 3). The identified biological processes included flavonoid biosynthesis, pigment biosynthesis, and the regulation of flavonoid biosynthetic processes. Molecular functions related to enzymes involved in anthocyanin biosynthesis were also identified (Figure 3).
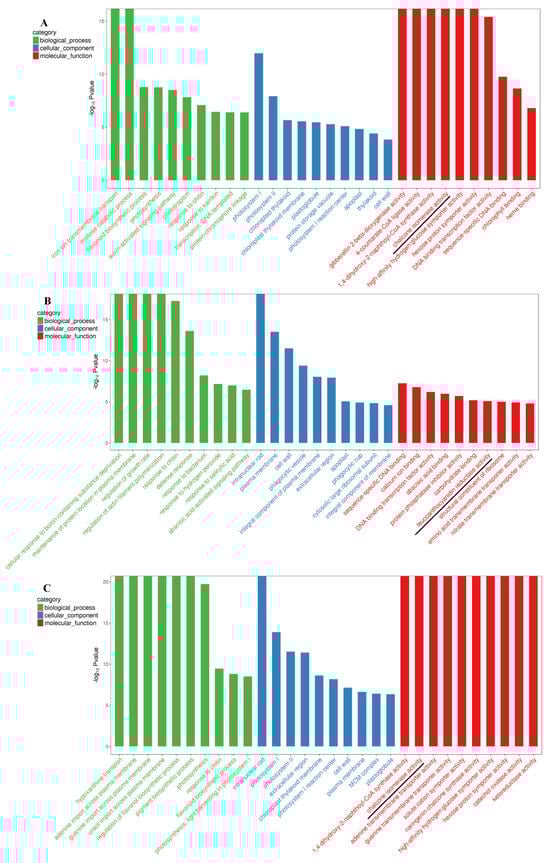
Figure 3.
GO enrichment of top 30 terms of DEGs that were detected in the three comparisons of HS_75–vs–TL_100 (A), LS_25–vs–TL_100 (B), and LS_25–vs–HS_75 (C) in leaves. The blank lines indicate some anthocyanin biosynthesis-related enzymes. The horizontal coordinate shows the GO term and the vertical coordinate indicates the −log10 p value.
3.3.2. KEGG Enrichment Analysis of DEGs
KEGG pathway analysis was carried out to understand the pathways associated with the DEGs [33]. The top 20 enriched pathways are represented in a bubble diagram (Figure 4). Flavonoid metabolism, along with starch and sucrose metabolism and plant hormone signal transduction pathways, was found to be influenced by the light environment (Figure 4). The above results indicate that high-light stress can induce anthocyanin biosynthesis.
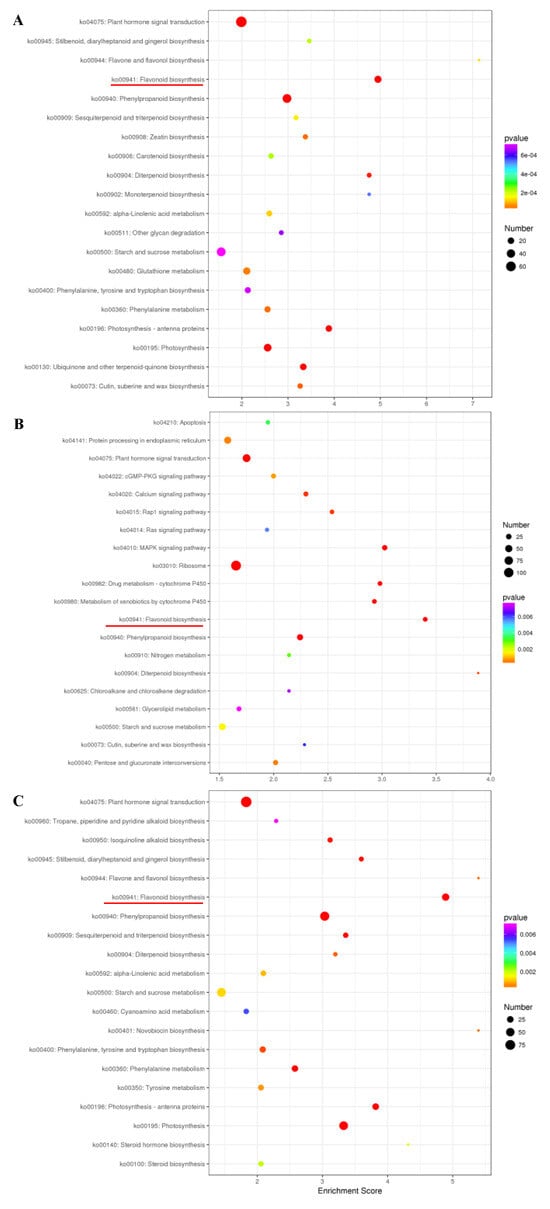
Figure 4.
KEGG classification of DEGs that were detected in the three comparisons of HS_75–vs–TL_100 (A), LS_25–vs–TL_100 (B), and LS_25–vs–HS_75 (C). Red line shows the flavonoid biosynthesis pathway item. The x-axis is the enrichment score. The larger the bubble, the more the number of DEGs. The color of the bubble changes from purple to blue to green to red. The smaller the p-value of the bubble, the greater the significance.
3.4. Analysis of DEGs Involved in Flavonoid Biosynthesis
Within the study, several genes involved in phenylpropanoid biosynthesis, which leads to anthocyanin production, were identified. DEGs, including CHS, CHI, F3H, F3′5′H, F3′H, DFR, and ANS, were present in different conditions, whereas 3GT (UDP-glucose: flavonoid 3-o-glucosyltransferase) was not detected. The expression of the F3′H gene was notably up-regulated with increased light intensity (Figure 5), suggesting its role in light-induced anthocyanin biosynthesis.
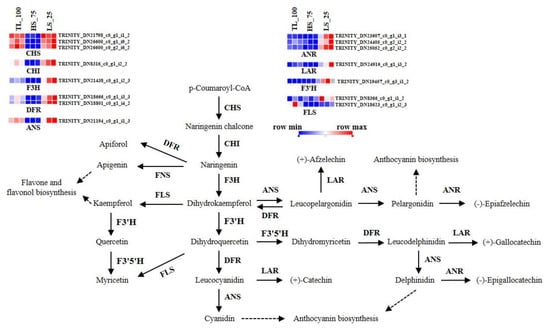
Figure 5.
Schematic of physiological roles and the expression of DEGs regulated by different light conditions in flavonoid biosynthesis in B. semperflorens. CHS, chalcone synthase; CHI, chalcone isomerase; DFR, dihydroflavonol 4–reductase; F3H, flavanone 3–hydroxylase; F3′H, flavanone–3–hydroxylase; F3′5′H, flavonoid F3′5′H–hydroxylase; FNS, flavone synthase; LAR, leucoanthocyanidin reductase; ANR, anthocyanidin reductase; FLS, flavonol synthase.
3.5. Transcription Factor Database Annotation
Transcription factors are proteins that bind to specific DNA sequences, which play a key role in gene expression regulation by controlling the transcription of genetic information from DNA to RNA. PlantTFDB (https://opendata.pku.edu.cn/dataset.xhtml?persistentId=doi:10.18170/DVN/GHICUF, accessed on 10 January 2024) is a database of plant transcription factors which contains sequences from 165 plants and 58 families of plant transcription factors, and the top 10 species distribution is shown in Figure S3. The unigene sequence was compared to the transcription factor database by blastx (E-value < 1 × 10⁻⁵). A total of 16,363 unigenes were annotated in the transcription factor database, which were distributed in 58 families. The TF comparison results are shown in Figure 6, and the MYB and MYB-related, bHLH (basic Helix–Loop–Helix), WRKY (WRKYGQK), and ERF (Ethylene-Responsive Factor) transcription factors showed a higher number.
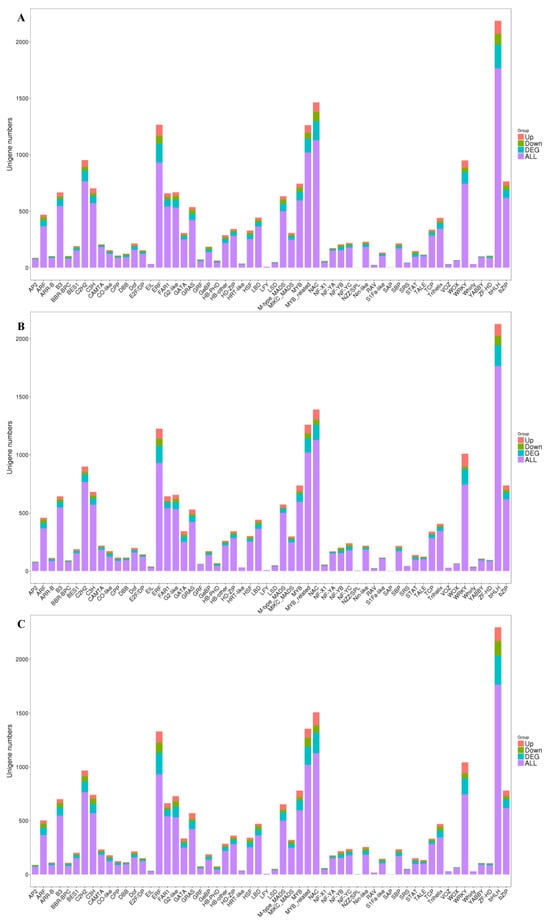
Figure 6.
The distribution of the transcription factor family that were detected in the three comparisons of HS_75–vs–TL_100 (A), LS_25–vs–TL_100 (B), and LS_25–vs–HS_75 (C). Purple represents all unigenes, blue represents differentially expressed unigenes, green represents down-regulation of unigenes, and red represents up-regulation of unigenes. The abscissa is the transcription factor family and the ordinate is the number of unigenes.
Then, the expression levels of some key candidate DEGs related with anthocyanin biosynthesis were further examined under light conditions (Table S6). The expression of the CRF6 (Cytokinin Response Factor 6), ERF2, F3′H, MYB102, WRKY40, WRKY76, WRKY53, and WRKY70 genes was up-regulated in HS_75-vs-TL_100, LS_25-vs-TL_100, and LS_25-vs-HS_75; however, the expression of SWEET1 (Sugars Will Eventually be Exported Transporters), ATHB12 (Arabidopsis thaliana homeobox genes), HSP20 (Heat Shock Protein 20), and HSP-like was down-regulated (Figure 6). In short, transcription factors may also be involved in regulating the anthocyanin biosynthesis of B. semperflorens under light conditions.
3.6. Transcriptome Data Were Verified via qRT-PCR
In order to verify the validity of the data of transcriptomes, we selected 12 genes (ERF2, MYB102, F3′H, WRKY40, WRKY76, WRKY53, WRKY70, SWEET1, CHI, F3H, ATHB12, and HSP-like) from the DEGs for qRT-PCR analysis of their expression under different light conditions (Figure 7). These results are consistent with the data of transcriptomes. Meanwhile, we also found that the ERF2, MYB102, F3′H, WRKY40, WRKY76, WRKY53, and WRKY70 genes were up-regulated with increases in light intensity (Figure 7); in contrast, the SWEET1, ATHB12, and HSP-like genes decreased with increases in light intensity (Figure 7).
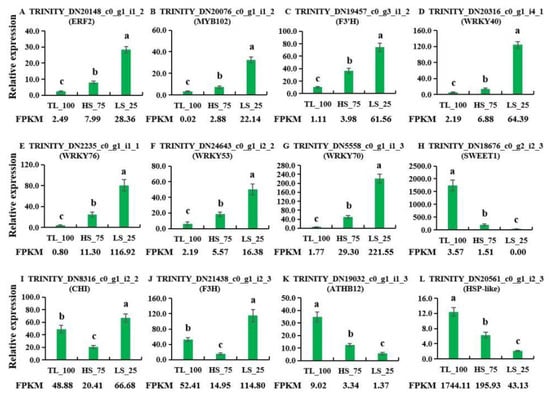
Figure 7.
qRT-PCR validation of the transcriptome data. The relative transcript levels of these twelve genes were shown in panel (A) (ERF2), (B) (MYB102), (C) (F3’H), (D) (WRKY40), (E) (WRKY76), (F) (WRKY53), (G) (WRKY70), (H) (SWEET1), (I) (CHI), (J) (F3H), (K) (ATHB12), and (L) (HSP-like). Values given in the form of mean ± SE (n = 3). Significant differences were analyzed using Duncan’s multiple range test; bars with different letters are significantly different from each other (p < 0.05). The sequences of primers are shown in Table S7.
4. Discussion
4.1. Anthocyanin Was Induced by Light Conditions
Anthocyanins, as significant flavonoid compounds, play a critical role in plant defense mechanisms and adaptability to various environmental stresses [18,34]. The biosynthesis of anthocyanins in B. semperflorens ‘Super Olympia’ seedlings is induced by low temperatures, alongside the synthesis of lignin [18]. Similarly, anthocyanin content in grapes increases upon infection with Colletotrichum gloeosporioides [34]. Previous studies, including ours, have shown that shading can alter both the morphological and physiological characteristics of plants [5,20]. High light induces an accumulation of superoxide anions (O2−) and malondialdehyde (MDA); meanwhile, the relative contents of anthocyanin, soluble sugar, starch, and superoxide dismutase (SOD) activity also increased [20]. Fortunately, under high-light conditions, the color of B. semperflorens leaves turned to red, which has high ornamental value (Figure 1A).
Generally, the structural genes, like CHI, CHS, DFR, and ANS, within the flavonoid metabolic pathway significantly influence the flavonoid content [35,36]. High light is known to induce anthocyanin biosynthesis by up-regulating these structural genes, such as PAL, CHS, F3H, and ANS genes [18]. And our study reveals a novel aspect, where F3′H gene expression was markedly up-regulated with increased light intensity (Table S6 and Figure 7). So far, the F3′H gene has been reported to positively regulate anthocyanin biosynthesis. In the present study, the anthocyanin content was 11.54 ± 1.99 U·g−1·FW, 45.42 ± 3.43 U·g−1·FW, and 134.60 ± 6.4 U·g−1·FW in LS_25, HS_75, and TL_100, respectively (Figure 1B). Therefore, the F3′H gene is responsible for anthocyanin synthesis and then further resistance to high-light stress. And, in B. semperflorens, it was also reported that exogenous sucrose could induce anthocyanin accumulation, which is related to the up-regulation of PAL, CHI, DFR, etc. [37]. Hence, the function of the F3′H gene must be further explored.
4.2. High Light Affects the Expression of Transcription Factors
It is well known that transcription factors also play key roles in modulating anthocyanin biosynthesis under stress conditions [38,39]. For example, in Lycoris radiata, LrWRKY3/27 regulates anthocyanin synthesis under drought stress [39]. In Malus crabapple, the McWRKY71 transcription factor is induced by ozone stress, influencing anthocyanin and proanthocyanidin synthesis [40]. The bHLH137 transcription factor is involved in the positive regulation of proanthocyanidins and anthocyanins in grapevines, enhancing resistance to C. gloeosporioides [34]. Additionally, the postharvest temperature and light treatments in ‘Akihime’ plum (Prunus salicina Lindl.) induce anthocyanin accumulation via the transcription factor PsMYB10.1 [41]. In the Asiatic hybrid lily (Lilium spp.), LhWRKY44 is implicated in light- and drought-induced anthocyanin synthesis [12]. Furthermore, a model of light-regulated anthocyanin biosynthesis in rose petals included a network of genes, such as HY5 (ELONGATED HYPOCOTYL 5), MYB114a, bHLH3, CHS, and F3′H [42].
In the present study, we observed that high-light exposure not only induces anthocyanin biosynthesis-related genes but also affects the expression levels of various stress-responsive genes (Table 4), like WRKY, HSP-like, ERF genes, etc. Meanwhile, in order to resist the high-light environment, we found that the leaf area decreased and curled, the flower number decreased, the plant height reduced, and so on (Figure 1A). These results imply that the pant growth was also affected by these transcription factors, such as AP1 (APETALA1), ERF2, SWEET1, etc. And these transcription factors may have functions in responding to high-light environments. However, the lack of transgenic systems makes it difficult to clearly explain their function.
Table 4.
Some key transcription factors that respond to high-light conditions.
5. Conclusions
In summary, our research demonstrates that high-light exposure triggers anthocyanin accumulation in the leaves of adult B. semperflorens plants. The identification of DEGs under high-light conditions revealed that anthocyanin accumulation is a strategic response to high-light stress. Importantly, these DEGs not only include structural genes but also transcription factors (Table 4; Figure 8). High light promoted the expression of ERF2, MYB102, F3′H, WRKYs, etc., but also inhibited the expression of SWEET1, ATHB12, and HSP-like genes. This suggests that these genes may be involved in both anthocyanin biosynthesis and the response to high-light stress environments.
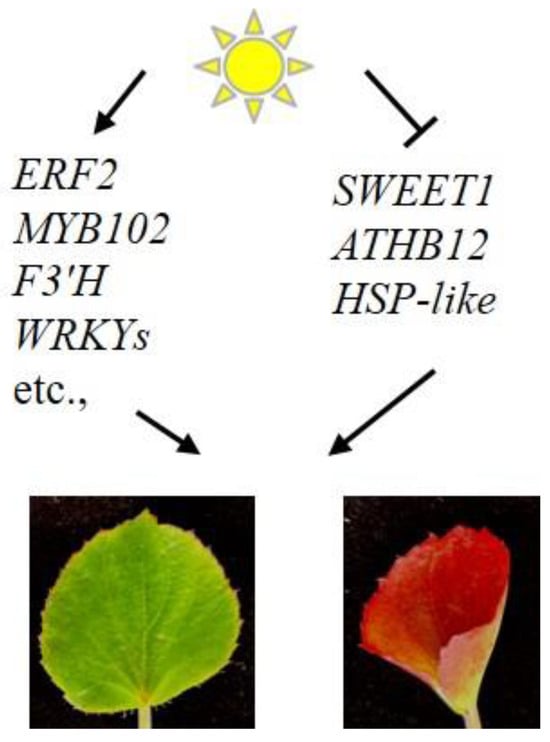
Figure 8.
Working model of light-regulated DEGs in B. semperflorens.
Supplementary Materials
The following supporting information can be downloaded at https://www.mdpi.com/article/10.3390/horticulturae10010096/s1: Table S1: The results of transcriptome splicing; Figure S1: Pearson’s correlation between nine samples; Figure S2: Principal component analysis; Table S2: DEGs in HS_75–vs–TL_100; Table S3: DEGs in LS_25–vs–TL_100; Table S4: DEGs in HS_75–vs–TL_100; Table S5: DEGs in the three comparisons; Figure S3: Transcription factor alignment results; Table S6: The differentially expressed genes; Table S7: The sequences of primer used in this study.
Author Contributions
Conceptualization, A.L. and Y.Z.; methodology, Z.Z. and W.L.; software, S.Y.; validation, Z.Z. and W.L.; formal analysis, K.Z.; investigation, K.Z.; resources, A.L. and W.L.; data curation, A.L.; writing—original draft preparation, K.Z. and A.L.; writing—review and editing, K.Z. and A.L.; visualization, K.Z. and Z.Z.; supervision, A.L.; project administration, Y.Z. and A.L.; funding acquisition, W.L. and Y.Z. All authors have read and agreed to the published version of the manuscript.
Funding
This study was financially supported by grants from the Key Projects of Natural Science Research in colleges and universities of Anhui (2022AH051621, 2022AH051622), the Science and Technology Plan Project of the Anhui Housing Construction Department (2022-YF038), the Key Research Project of Chuzhou (2022ZN015), the Introduction of Talent Projects of Anhui Science and Technology University (JZYJ202201), and the Natural Science Foundation of Zhejiang Province (Q22C158467).
Data Availability Statement
All data included in this study are available upon request through contact with the corresponding author. The data are not publicly available due to the use in other unpublished articles.
Conflicts of Interest
The authors declare no conflicts of interest.
References
- Hong, Y.; Li, M.; Dai, S. Ectopic expression of multiple chrysanthemum (Chrysanthemum × morifolium) R2R3-MYB transcription factor genes regulates anthocyanin accumulation in tobacco. Genes 2019, 10, 777. [Google Scholar] [CrossRef]
- Naing, A.; Park, K.; Ai, T.; Chung, M.; Han, J.; Kang, Y.; Lim, K.; Kim, C. Overexpression of snapdragon Delila (Del) gene in tobacco enhances anthocyanin accumulation and abiotic stress tolerance. BMC Plant Biol. 2017, 17, 65. [Google Scholar] [CrossRef] [PubMed]
- Zhou, L.; Liu, S.; Wang, Y.; Wang, Y.; Song, A.; Jiang, J.; Chen, S.; Guan, Z.; Chen, F. CmMYB3-like negatively regulates anthocyanin biosynthesis and flower color formation during the post-flowering stage in Chrysanthemum morifolium. Hortic. Plant J. 2023, 10, 194–204. [Google Scholar] [CrossRef]
- Qi, F.; Liu, Y.; Luo, Y.; Cui, Y.; Lu, C.; Li, H.; Huang, H.; Dai, S. Functional analysis of the ScAG and ScAGL11 MADS-box transcription factors for anthocyanin biosynthesis and bicolour pattern formation in Senecio cruentus ray florets. Hortic. Res. 2022, 9, uhac071. [Google Scholar] [CrossRef]
- Zhao, D.; Tao, J. Recent advances on the development and regulation of flower color in ornamental plants. Front. Plant Sci. 2015, 6, 261. [Google Scholar] [CrossRef] [PubMed]
- Xu, N.; Liu, S.; Lu, Z.; Pang, S.; Wang, L.; Wang, L.; Li, W. Gene expression profiles and flavonoid accumulation during salt stress in Ginkgo biloba seedlings. Plants 2020, 9, 1162. [Google Scholar] [CrossRef]
- Mao, D.; Zhong, L.; Zhao, X.; Wang, L. Function, biosynthesis, and regulation mechanisms of flavonoids in Ginkgo biloba. Fruit Res. 2023, 3, 18. [Google Scholar] [CrossRef]
- Harborne, J.; Williams, C. Advances in avonoid research since 1992. Phytochemistry 2000, 55, 481–504. [Google Scholar] [CrossRef]
- Dixon, R.; Achnine, L.; Kota, P.; Liu, C.; Reddy, M.; Wang, L. The phenylpropanoid pathway and plant defence—A genomics perspective. Mol. Plant Pathol. 2002, 3, 371–390. [Google Scholar] [CrossRef]
- Grunewald, W.; De Smet, I.; Lewis, D.; Löfke, C.; Jansen, L.; Goeminne, G.; Vanden Bossche, R.; Karimi, M.; De Rybel, B.; Vanholme, B.; et al. Transcription factor WRKY23 assists auxin distribution patterns during Arabidopsis root development through local control on flavonol biosynthesis. Proc. Natl. Acad. Sci. USA 2012, 109, 1554–1559. [Google Scholar] [CrossRef]
- Grotewold, E.; Sainz, M.; Tagliani, L.; Hernandez, J.; Bowen, B.; Chandler, V. Identification of the residues in the Myb domain of maize C1 that specify the interaction with the bHLH cofactor R. Proc. Natl. Acad. Sci. USA 2000, 97, 13579–13584. [Google Scholar] [CrossRef] [PubMed]
- Bi, M.; Liang, R.; Wang, J.; Qu, Y.; Liu, X.; Cao, Y.; He, G.; Yang, Y.; Yang, P.; Xu, L.; et al. Multifaceted roles of LhWRKY44 in promoting anthocyanin accumulation in Asiatic hybrid lilies (Lilium spp.). Hortic. Res. 2023, 10, uhad167. [Google Scholar] [CrossRef] [PubMed]
- Sarma, A.; Sharma, R. Anthocyanin-DNA copigmentation complex: Mutual protection against oxidative damage. Phytochemistry 1999, 52, 1313–1318. [Google Scholar] [CrossRef]
- Debeaujon, I.; Léon-Kloosterziel, K.; Koornneef, M. Influence of the testa on seed dormancy, germination, and longevity in Arabidopsis. Plant Physiol. 2000, 122, 403–413. [Google Scholar] [CrossRef] [PubMed]
- He, J.; Giusti, M. Anthocyanins: Natural colorants with health-promoting properties. Annu. Rev. Food Sci. Technol. 2010, 1, 163–187. [Google Scholar] [CrossRef] [PubMed]
- Li, Z.; Jiang, H.; Jiang, X.; Zhang, L.; Qin, Y. Integrated physiological, transcriptomic, and metabolomic analyses reveal that low-nitrogen conditions improve the accumulation of flavonoids in snow chrysanthemum. Ind. Crops Prod. 2023, 197, 116574. [Google Scholar] [CrossRef]
- Song, A.; Su, J.; Wang, H.; Zhang, Z.; Zhang, X.; Van de Peer, Y.; Chen, F.; Fang, W.; Guan, Z.; Zhang, F.; et al. Analyses of a chromosome-scale genome assembly reveal the origin and evolution of cultivated chrysanthemum. Nat. Commun. 2023, 14, 2021. [Google Scholar] [CrossRef]
- Dong, Y.; Qu, Y.; Qi, R.; Bai, X.; Tian, G.; Wang, Y.; Wang, J.; Zhang, K. Transcriptome analysis of the biosynthesis of anthocyanins in Begonia semperflorens under low-temperature and high-light conditions. Forests 2018, 9, 87. [Google Scholar] [CrossRef]
- Zhang, K.; Wang, J.; Guo, M.; Du, W.; Wu, R.; Wang, X. Short-day signals are crucial for the induction of anthocyanin biosynthesis in Begonia semperflorens under low temperature condition. J. Plant Physiol. 2016, 204, 1–7. [Google Scholar] [CrossRef]
- Zhang, Y.; Liu, A.; Zhang, X.; Huang, S. Effects of shading on some morphological and physiologycal characteristics of Begonial semperflorens. Pak. J. Bot. 2018, 50, 2173–2179. [Google Scholar]
- Grabherr, M.; Haas, B.; Yassour, M.; Levin, J.; Thompson, D.; Amit, I.; Adiconis, X.; Fan, L.; Raychowdhury, R.; Zeng, Q.; et al. Full-length transcriptome assembly from RNA-Seq data without a reference genome. Nat. Biotechnol. 2011, 29, 644–652. [Google Scholar] [CrossRef] [PubMed]
- Li, W.; Jaroszewski, L.; Godzik, A. Clustering of highly homologous sequences to reduce the size of large protein databases. Bioinformatics 2001, 17, 282–283. [Google Scholar] [CrossRef] [PubMed]
- Benjamin, B.; Chao, X.; Daniel, H. Fast and sensitive protein alignment using DIAMOND. Nat. Methods 2015, 12, 59–60. [Google Scholar]
- Jaina, M.; Finn, R.; Eddy, S.; Bateman, A.; Punta, M. Challenges in homology search: HMMER3 and convergent evolution of coiled-coil regions. Nucleic Acids Res. 2013, 41, e121. [Google Scholar]
- Langmead, B.; Salzberg, S.L. Fast gapped-read alignment with Bowtie 2. Nat. Methods 2012, 9, 357–359. [Google Scholar] [CrossRef] [PubMed]
- Roberts, A. Ambiguous Fragment Assignment for High-Throughput Sequencing Experiments; University of California: Berkeley, CA, USA, 2013. [Google Scholar]
- Roberts, A.; Trapnell, C.; Donaghey, J.; Rinn, J.; Pachter, L. Improving RNA-seq expression estimates by correcting for fragment bias. Genome Biol. 2011, 12, R22. [Google Scholar] [CrossRef] [PubMed]
- Anders, S.; Huber, W. Differential Expression of RNA-Seq Data at the Gene Level-the DESeq Package; European Molecular Biology Laboratory: Heidelberg, Germany, 2012. [Google Scholar]
- Thomas, S.; Liva, K. Analysis of relative gene expression data using RT-qPCR. Methods 2001, 25, 402–408. [Google Scholar]
- Mita, S.; Murano, N.; Akaike, M.; Nakamura, K. Mutants of Arabidopsis thaliana with pleiotropic effects on the expression of the gene for beta-amylase and on the accumulation of anthocyanin that are inducible by sugars. Plant J. 2010, 11, 841–851. [Google Scholar] [CrossRef]
- Bolger, A.; Lohse, M.; Usadel, B. Trimmomatic: A flexible trimmer for Illumina sequence data. Bioinformatics 2014, 30, 2114–2120. [Google Scholar] [CrossRef]
- Love, M.; Huber, W.; Anders, S. Moderated estimation of fold change and dispersion for RNA-seq data with DESeq2. Genome Biol. 2014, 15, 550. [Google Scholar] [CrossRef]
- Kanehisa, M.; Araki, M.; Goto, S.; Hattori, M.; Hirakawa, M.; Itoh, M.; Katayama, T.; Kawashima, S.; Okuda, S.; Tokimatsu, T.; et al. KEGG for linking genomes to life and the environment. Nucleic Acids Res. 2008, 36, 480–484. [Google Scholar] [CrossRef] [PubMed]
- Yu, D.; Wei, W.; Fan, Z.; Chen, J.; You, Y.; Huang, W.; Zhan, J. VabHLH137 promotes proanthocyanidin and anthocyanin biosynthesis and enhances resistance to Colletotrichum gloeosporioides in grapevine. Hortic. Res. 2023, 10, uhac261. [Google Scholar] [CrossRef] [PubMed]
- Ohno, S.; Hori, W.; Hosokawa, M.; Tatsuzawa, F.; Doi, M. Post-transcriptional silencing of chalcone synthase is involved in phenotypic lability in petals and leaves of bicolor dahlia (Dahlia variabilis) ‘Yuino’. Planta 2018, 247, 413–428. [Google Scholar] [CrossRef] [PubMed]
- Cai, C.; Zhou, F.; Li, W.; Yu, Y.; Guan, Z.; Zhang, B.; Guo, W. The R2R3-MYB transcription factor GaPC controls petal coloration in cotton. Crop J. 2023, 11, 1319–1330. [Google Scholar] [CrossRef]
- Zhang, K.; Li, Z.; Li, Y.; Li, Y.; Kong, D.; Wu, R. Carbohydrate accumulation may be the proximate trigger of anthocyanin biosynthesis under autumn conditions in Begonia semperflorens. Plant Biol. 2013, 15, 991–1000. [Google Scholar] [CrossRef] [PubMed]
- He, G.; Zhang, R.; Jiang, S.; Wang, H.; Ming, F. The MYB transcription factor RcMYB1 plays a central role in rose anthocyanin biosynthesis. Hortic. Res. 2023, 10, uhad080. [Google Scholar] [CrossRef] [PubMed]
- Javed, T.; Gao, S. WRKY transcription factors in plant defense. Trends Genet. 2023, 39, 787–801. [Google Scholar] [CrossRef]
- Zhang, J.; Wang, Y.; Mao, Z.; Liu, W.; Ding, L.; Zhang, X.; Yang, Y.; Wu, S.; Chen, X.; Wang, Y. Transcription factor McWRKY71 induced by ozone stress regulates anthocyanin and proanthocyanidin biosynthesis in Malus crabapple. Ecotoxicol. Environ. Saf. 2022, 232, 113274. [Google Scholar] [CrossRef]
- Fang, Z.; Wang, K.; Jiang, C.; Zhou, D.; Lin, Y.; Pan, S.; Espley, R.; Ye, X. Postharvest temperature and light treatments induce anthocyanin accumulation in peel of ‘Akihime’ plum (Prunus salicina Lindl.) via transcription factor PsMYB10.1. Postharvest Biol. Technol. 2021, 179, 111592. [Google Scholar] [CrossRef]
- Yan, Y.; Zhao, J.; Lin, S.; Li, M.; Liu, J.; Raymond, O.; Vergne, P.; Kong, W.; Wu, Q.; Zhang, X.; et al. Light-mediated anthocyanin biosynthesis in rose petals involves a balanced regulatory module comprising transcription factors RhHY5, RhMYB114a, and RhMYB3b. Bot. Rev. 2023, 74, 5783–5804. [Google Scholar] [CrossRef]
Disclaimer/Publisher’s Note: The statements, opinions and data contained in all publications are solely those of the individual author(s) and contributor(s) and not of MDPI and/or the editor(s). MDPI and/or the editor(s) disclaim responsibility for any injury to people or property resulting from any ideas, methods, instructions or products referred to in the content. |
© 2024 by the authors. Licensee MDPI, Basel, Switzerland. This article is an open access article distributed under the terms and conditions of the Creative Commons Attribution (CC BY) license (https://creativecommons.org/licenses/by/4.0/).