Article

Comparative Proteomics Analysis of Primulina serrulata Leaves Reveals New Insight into the Formation of White Veins

1
Department of Biology, Zunyi Normal College, Zunyi 563002, China
2
Sichuan Academy of Forestry, Chengdu 610081, China
*
Author to whom correspondence should be addressed.
These authors contributed equally to this work.
Horticulturae 2024, 10(1), 19; https://doi.org/10.3390/horticulturae10010019
Submission received: 21 November 2023 / Revised: 15 December 2023 / Accepted: 20 December 2023 / Published: 23 December 2023
(This article belongs to the Special Issue Physiological and Molecular Biology Research on Ornamental Flower)

Abstract

:
Primulina serrulata is a valuable ornamental herb with rosette leaves and vibrant flowers. Some leaves of this species exhibit a bright and distinct white color along the upper veins, enhancing their ornamental value, while others are less white or entirely green. This variation is observed in adult leaves from natural habitats and among young leaves from seedlings grown in the laboratory. TMT-labeled proteomics technology was used to study the protein-level biogenesis of white-veined (WV) P. serrulata leaves. Our objective was to offer novel insight into the breeding of WV plants. Chlorophyll (Chl) content was significantly lower in the WV group than in the control group. Out of 6261 proteins identified, a mere 69 met the criteria for differentially expressed proteins (DEPs) after stringent screening for subsequent analyses. Among these DEPs, there were 44 proteins that exhibited downregulation and 25 that were upregulated in the WV plants. Some DEPs associated with chloroplasts and Chl biosynthesis were downregulated, leading to the absence of green coloration. Concurrently, Gene Ontology enrichment analysis further emphasized an insufficiency of magnesium, the key element in Chl biosynthesis. Many DEPs associated with abiotic or biotic stressors were downregulated, suggesting an overall weakening of stress resistance with certain compensatory mechanisms. Similarly, many DEPs related to modifying biomacromolecules were downregulated, possibly affected by the decrease in proteins involved in photosynthesis and stress resistance. Some DEPs containing iron were upregulated, indicating that iron is mainly used to synthesize heme and ferritin rather than Chl. Additionally, several DEPs related to sulfur or sulfate were upregulated, suggesting strengthened respiration. Expansin-A4 and pectinesterase were upregulated, coinciding with the emergence of a rough and bright surface in the white area of leaves, indicative of the elongation and gelation processes in the cell walls. These findings provide new insight for future studies to explore the mechanism of color formation in WV leaves.

1. Introduction

Variations in leaf color are widely observed in the natural world, encompassing a spectrum of patterns and hues. Among the variations, the presence of white sections in leaves is particularly notable. Plants exhibiting such white variegation, including those specifically bred to possess albino leaves, are highly prized in ornamental horticulture. While the presence of albino sections can affect photosynthetic efficiency, this unique coloration contributes to ornamental appeal, thereby increasing the economic value of these plants.
Many causes have been linked with white-leaf veins. This phenomenon is not limited to a single factor, as it can result from various conditions, including genetic mutations, environmental stressors, nutritional deficiencies, or diseases such as viral or fungal infections and insect nibbling. Each of these factors affects the pigmentation or the structural integrity of the leaf veins, leading to their white appearance.
The absence of chloroplast activity in white leaves leads to an increase in mitochondrial gene copy number and elevated mitochondrial transcription levels [1], suggesting a compensatory response within the cells, where the reduced functionality of chloroplasts, typically responsible for photosynthesis, prompts upregulation of mitochondrial activity. This adaptation may be a way to manage energy production and cellular respiration under the changing conditions caused by the lack of chlorophyll (Chl) in white leaves [2].
miRNAs play a role in the formation of white leaves and the development of white cells. miRNAs are involved in the regulation of gene expression and affect the development and differentiation of plant tissues. These miRNAs have been implicated in the modulation of genes responsible for pigment production, chloroplast development, and other related processes, contributing to the altered pigmentation observed in these leaves [3].
Some proteins affect the white coloration in leaves. The IM (IMMUTANS) protein is involved in the formation and functioning of chloroplasts. Mutations that occur in the IM gene result in areas of leaves lacking Chl and appearing white [4]. When a fully functional plastid terminal oxidase (PTOX) is non-functional or absent, the disruption results in the formation of white leaves, as key processes during chloroplast development and function are impaired, leading to the lack of normal leaf coloration [5].
Some metabolites also affect coloration. An increased concentration of 12-hydroxyjasmonic acid (OPDA) in white leaves suggests that the white cells are utilizing OPDA as a signaling molecule to upregulate genes associated with the stress response and scavenging activities [6]. This mechanism helps to reduce the levels of reactive oxygen species, thereby conferring a survival advantage [6].
Several studies have shown that yellowing or albinism of plant leaves is related to poor development of the chloroplast structure and obstruction of Chl synthesis [7] stemming from direct or indirect effects of genetic mutations [8,9]. Leaves with less Chl become light green or lose their green color [10]. The expression of Chl biosynthetic genes is downregulated in yellow or albino leaves, whereas Chl degradation-related enzymes and carotenoid-related genes are highly expressed [11,12].
The ability to accurately identify and locate leaf-color mutant genes is increasing, given the continuous improvements in genomics, transcriptomics, and molecular marker technology [13]. Proteomics analysis contributes to our understanding of how plants respond to various environmental changes and is an effective analytical method for determing the relationships between changes in the abundances of proteins and their biological functions [9].
Primulina serrulata R.B. Zhang & F. Wen is a gesneriad with high ornamental value because of its rosette leaves and colorful flowers [14]. Some white-veined (WV) leaves in the natural habitat have bright WVs, whereas others have fewer WVs or are almost completely green (Figure 1A,B). The leaves of seedlings grown in the laboratory also vary in the ratio of WVs (Figure 1C). Here, we determined the Chl content of leaves and carried out a proteomics experiment to identify the differentially expressed proteins (DEPs) between WV plants and the control and characterized the role of DEPs in WV coloration. Our data provide new insight to aid in the breeding of WV plants.

2. Materials and Methods

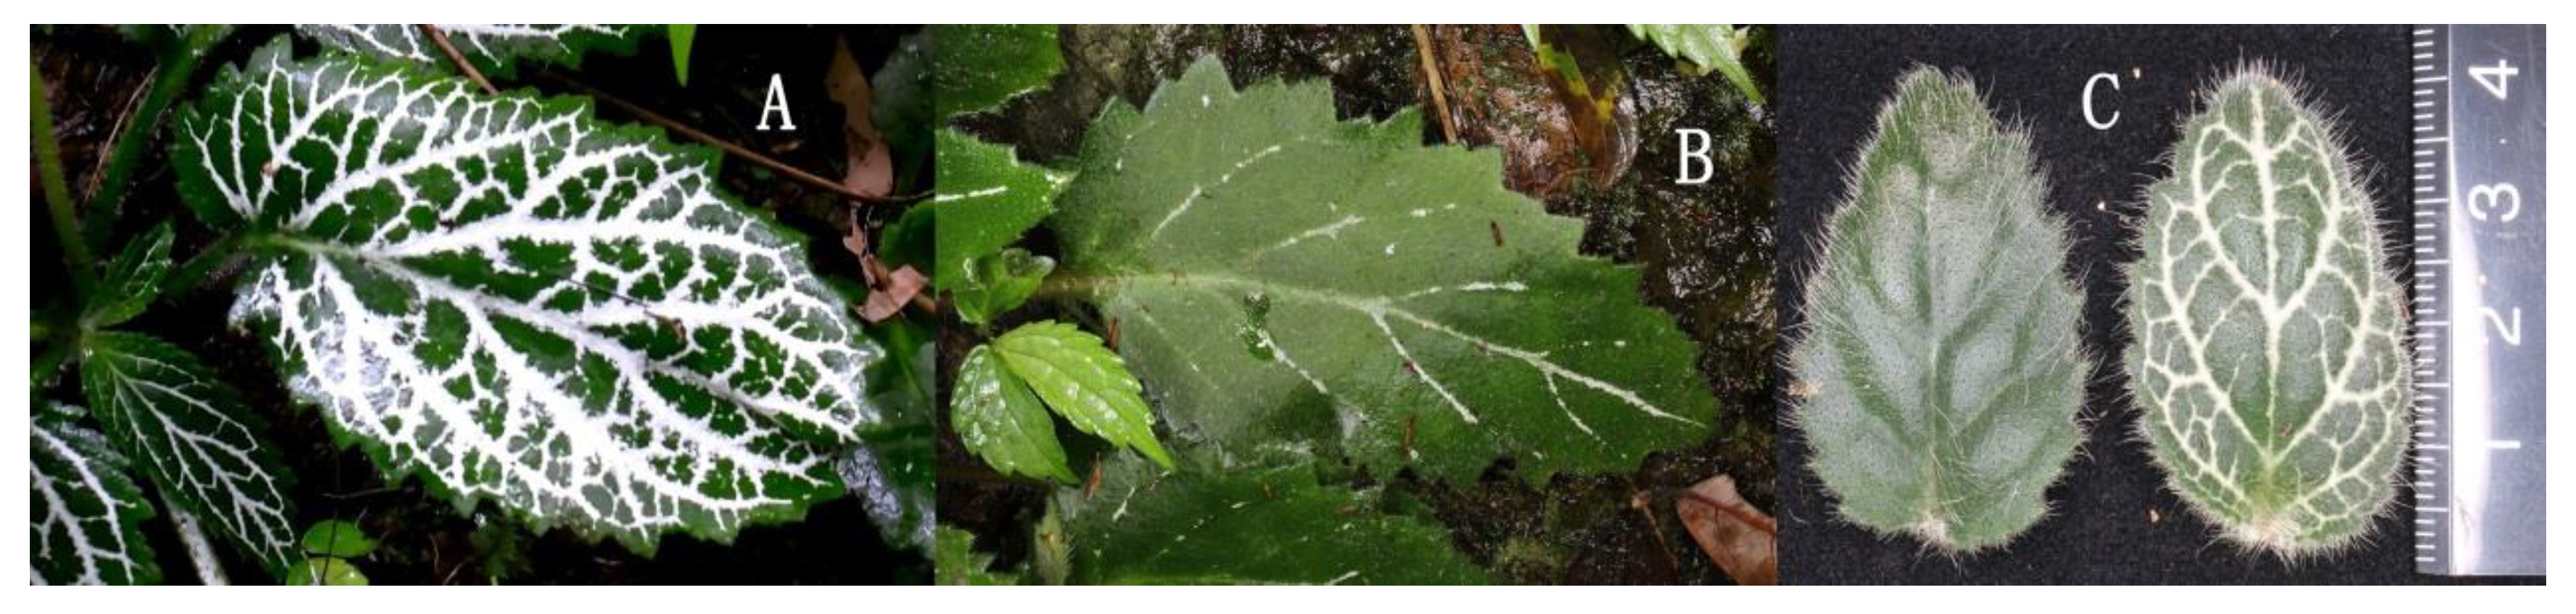
2.1. Plant Materials and Chl Determination

The plant materials were obtained from P. serrulata seedlings cultivated in the laboratory at Zunyi Normal College (Zunyi, China). The parent plants, consisting of only a few fruiting individuals (from which we collected seeds) and not posing any harm to wild populations, were collected from the P. serrulata type locality in a karst gorge located in Qiandongnan Prefecture, Guizhou Province.
Leaf blades (2 × 2 cm) were categorized into two distinct types. One type had bright and distinct WVs, and the other had few WVs (Figure 1C). Chl a and Chl b were determined using spectrophotometry, following Zhang, Qu, and Li [15]:
m T ( m g / g ) = m a + m b
where mT represents total Chl content and ma and mb denote the contents of Chl a and b, respectively.
m a ( m g g ) = C a ( m g L ) × V 1000 × W
m b ( m g g ) = C b ( m g L ) × V 1000 × W
V refers to the total volume of the extract (L) and W indicates the fresh leaf weight (0.5 g).
C a ( m g L ) = 12.7 O D 663 2.69 O D 645
C b ( m g L ) = 22.9 O D 645 4.68 O D 663
OD663 and OD645 denote the absorbance values at wavelengths of 663 nm and 645 nm, respectively.
Leaves from WV and control plants were promptly harvested (weight 0.18–0.30 g) and immediately submerged in liquid nitrogen. Three biological replicates were used for each group. These samples were sent for proteomics analysis at BioNovoGene Co. (Suzhou, China).

2.2. Protein Extraction, Digestion, and TMT Labeling

First, 600 μL of lysis solution (lysis buffer composition: 7 M urea, 4% SDS, 30 mM HEPES, 1 mM PMSF, 2 mM EDTA, 10 mM DTT, 1× protease inhibitor) was added to each sample and the tissues were dissociated by ultrasound on ice for 10 min. The mixture was centrifuged at 10,000× g for 10 min, and the supernatant was collected. Proteins were quantified using the BCA method. Next, 100 μg of protein solution was added to DTT at a final concentration of 10 mM; the solution was placed in a 55 °C water bath for 1 h, indole acetic acid was quickly added to a final concentration of 55 mM, and the solution was left in a dark room for 30 min. Acetone at four times the volume of the sample solution was added and precipitated at –20 °C for at least 3 h. After centrifugation at 4 °C and 20,000× g for 30 min, the precipitate was removed; this step was repeated twice. Finally, 100 μL of 100 mM TEAB solution was added, mixed, and centrifuged.
A total of 1.5 μg of trypsin was added to each sample. Next, 1.0 μg of enzyme was added for each 100 μg of protein substrate, and the samples were placed in a water bath at 37 °C for 4 h. After centrifugation at 5000 × g, one sample was selected from each group, and 1 μg of enzyme-dissolved sample was analyzed by liquid chromatography–mass spectrometry (LC-MS) for 1 h.
The peptide solution was cold-dried and then dissolved in 100 μL of 0.1 M TEAB to a concentration of 1 μg/μL. The TMT-labeling reagent was stabilized at room temperature, and 41 μL of isopropanol was added, followed by vortexing for 1 min and centrifugation. Labeling reagents were added to the peptide solution. The peptides were fully mixed with the labeling reagents, centrifuged, and left at room temperature for 1 h. Next, 5% hydroxylamine was added to terminate the reactions for 15 min. Five μg of material from each sample was mixed to test labeling efficiency. The labeled samples were mixed with one sample and transferred to a new EP tube. The samples were cold-dried.

2.3. High pH Phase Separation

The mixed labeled peptides were desalted using 0.1% TFA in a 0.5% and 60% acetonitrile solution. The labeled peptides were separated using high pH and reverse-phase LC. The pH was 10.0; 10 mM ammonium formate was used for mobile phase A, and 10 mM ammonium formate and 90% acetonitrile were used for mobile phase B. The labeled peptides were separated using an H-Class LC system (Waters Corp., Miford, MA, USA): sample volume was 50 μL, flow velocity was 250 μL/min, and the samples were tested at 215 nm. One tube of the distillation fraction was collected each minute starting at the second minute. The distillation fractions were pooled into six shares according to the chromatographic peak pattern.

2.4. MS analysis

MS analysis was performed using an Easy-nLC 1200 liquid chromatography system and an Orbitrap Fusion Lumos mass spectrometer (Thermo Fisher Scientific, Waltham, MA, USA). The ion source spray voltage was 2.2 kV. The ion transfer tube temperature of the Orbitrap Fusion Lumos mass spectrometer was maintained at 320 °C. The system automatically switched between MS and MS/MS acquisition in data-dependent mode. Full-scan MS was performed using the Orbitrap for primary scanning, with a scan range of m/z 350–1550 and a resolution of 120,000 (at m/z 200). The maximum ion injection time was 50 ms, and the automatic gain control (AGC) was set to 50,000 ions. Subsequently, parent ions meeting the criteria for MS/MS fragmentation were fragmented using 38% higher energy C-trap dissociation and scanned with the Orbitrap at a resolution of 15,000. The scan range was automatically controlled based on the parent ion m/z ratio, with the minimum scan range fixed at m/z = 100. The minimum ion intensity for MS/MS was set to 50,000. The maximum ion injection time was 22 ms, AGC was set to 50,000 ions, and the parent ion selection window was set to 1.6 Da. Ions with two to seven charge states were collected for MS/MS, with dynamic exclusion set to prevent MS/MS acquisition of the same parent ion for 30 s after one MS/MS acquisition.

2.5. Protein Identification and Quantification

The total ion flow chromatogram of the MS signal was derived from MS scanning; the abscissa was the elution time, and the ordinate was peak intensity. The MS data were inputted into Proteome Discoverer software (version 2.4, Thermo Fisher Scientific) for sieving. The embedded Sequest program was used to analyze the results of the sieved spectrogram. The protein quantification value was determined based on the signal value from the extracted TMT-reported ions; the peptide quantification value was indicated by the median, and the protein quantification value was indicated by the accumulation of the peptide quantification value.

2.6. Bioinformatics Analysis

The original RNA-seq transcripts (no. SRR1184436) of closely related species (P. fimbrisepala) were downloaded from the SRA database. The sequences were assembled to construct the predicted transcriptional sequences and translated to form a reference protein pool for the species in this experiment. Sequencing quality was assessed with FastQC software (version 0.11.9), and Trimmomatic software (version 0.36) was used to filter low-quality sequences and putative chimeras. The high-quality sequences were assembled using Trinity (version 2.10.0) to obtain the transcripts. The coding proteins were predetermined for the obtained transcript sequences using TransDecoder (version 5.5.0).
The search results were filtered using Proteome Discoverer 2.4 to reduce the false positive rate. Peptide spectra that matched with reliability > 99% and proteins that contained at least one unique peptide were considered credible. Only credible proteins and peptide spectrum matches were retained and verified by the false discovery rate (FDR). Peptides and proteins with an FDR > 1% were removed.
DEP screening: The ratio of the average values of each protein in the two sample groups was considered as the fold change (FC). A T-test was conducted on the quantitative values of each protein in the two sample groups, and the corresponding p-value was calculated to detect differences. The BH FDR method was used to adjust the p-values. Proteins with a fold-change > 1.5 and a p-value < 0.05 were selected as DEPs. The fold change for each protein was logarithmically transformed to base 2, and the p-value was converted to the negative logarithm to base 10. These data were used to create a volcano plot.

3. Results

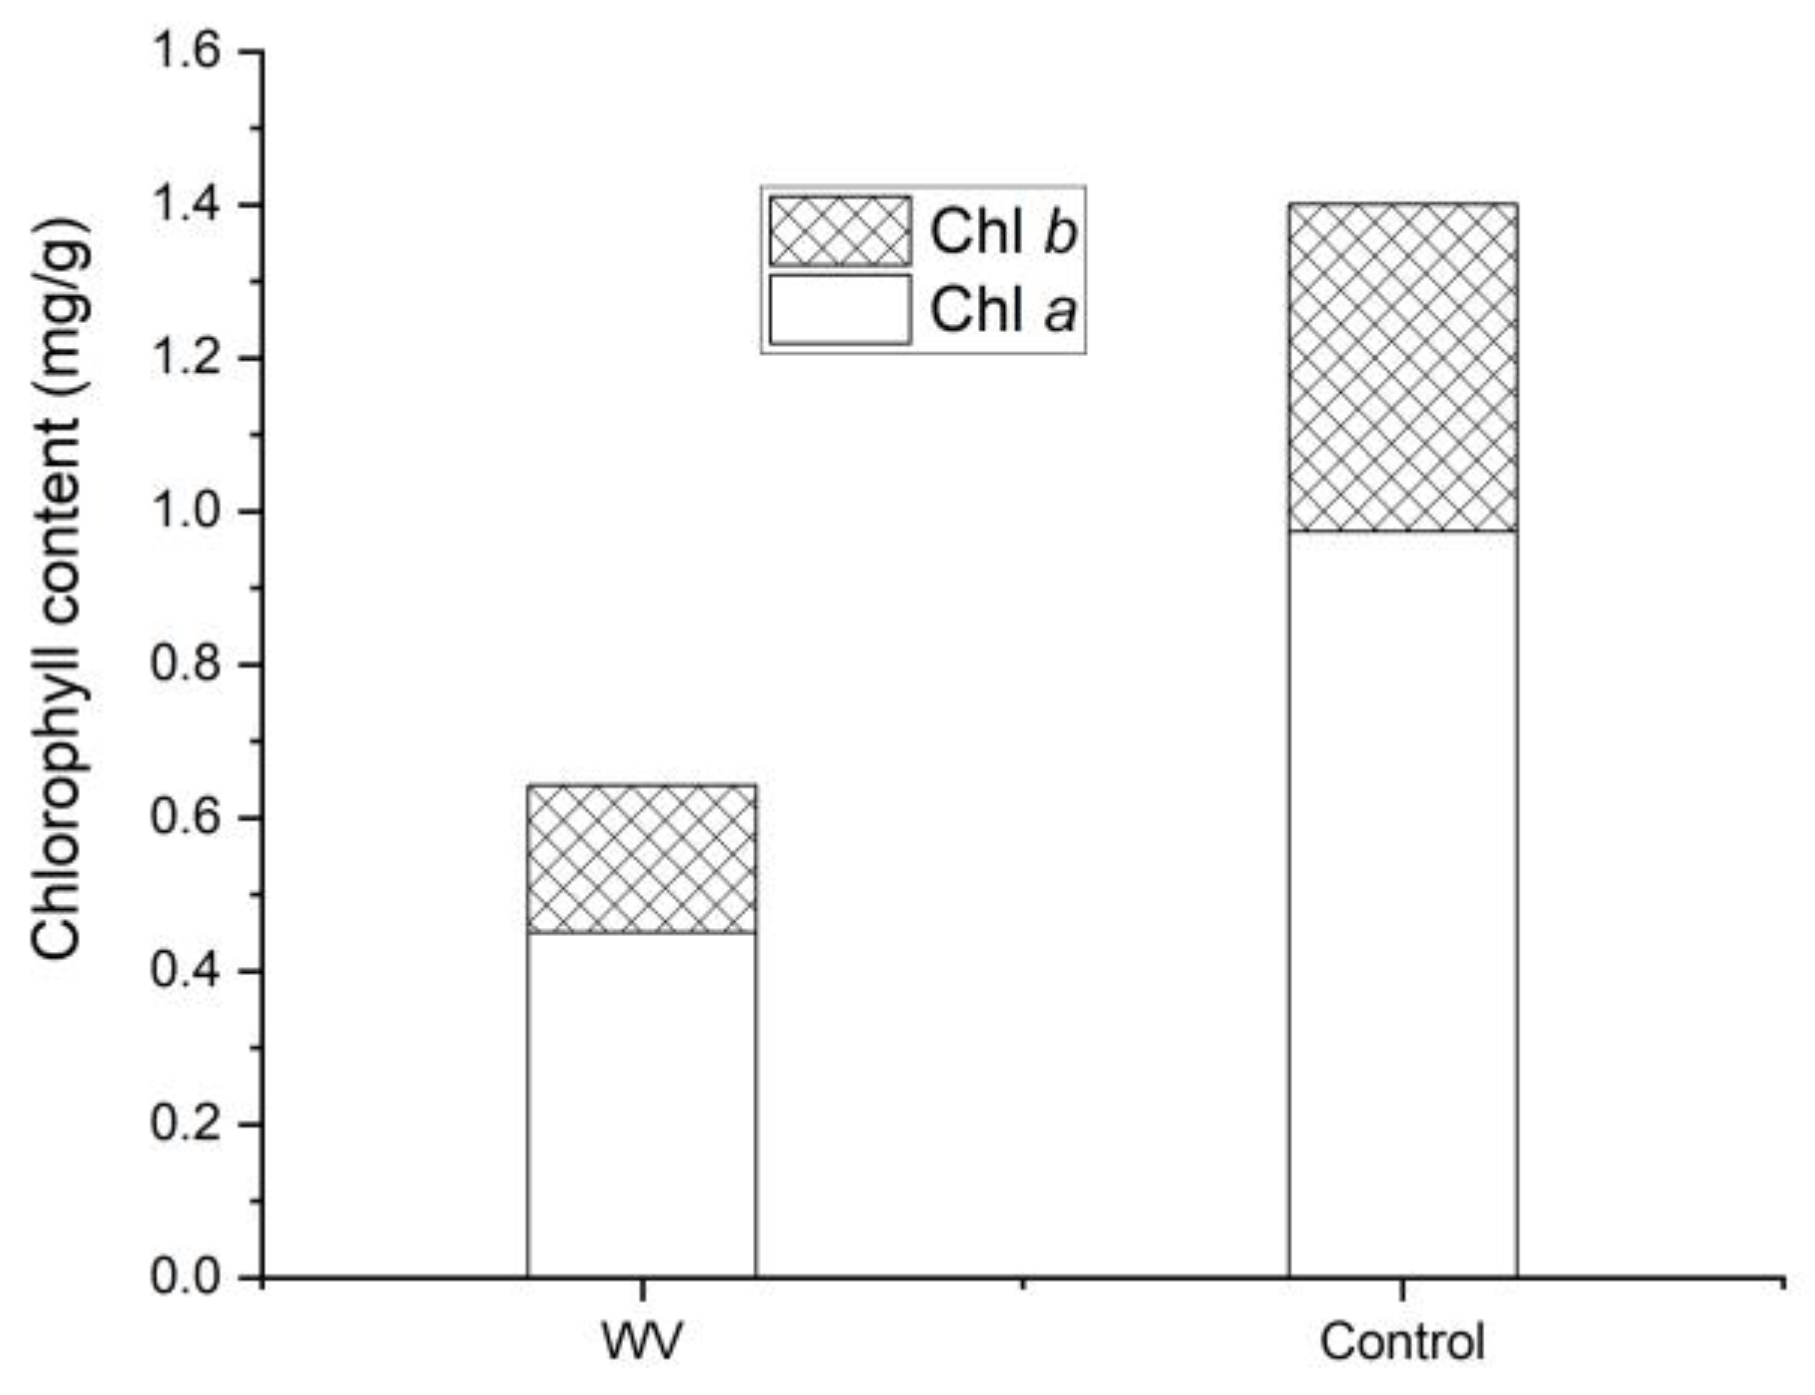
3.1. Chl Contents in WV Plants and the Control

Chl content (a + b; mg g−1) was significantly lower (p < 0.001) in the WV group (0.64 ± 0.16) than in the control group (1.40 ± 0.12) (Figure 2), suggesting that Chl synthesis was lower in WV leaves than in the control group.

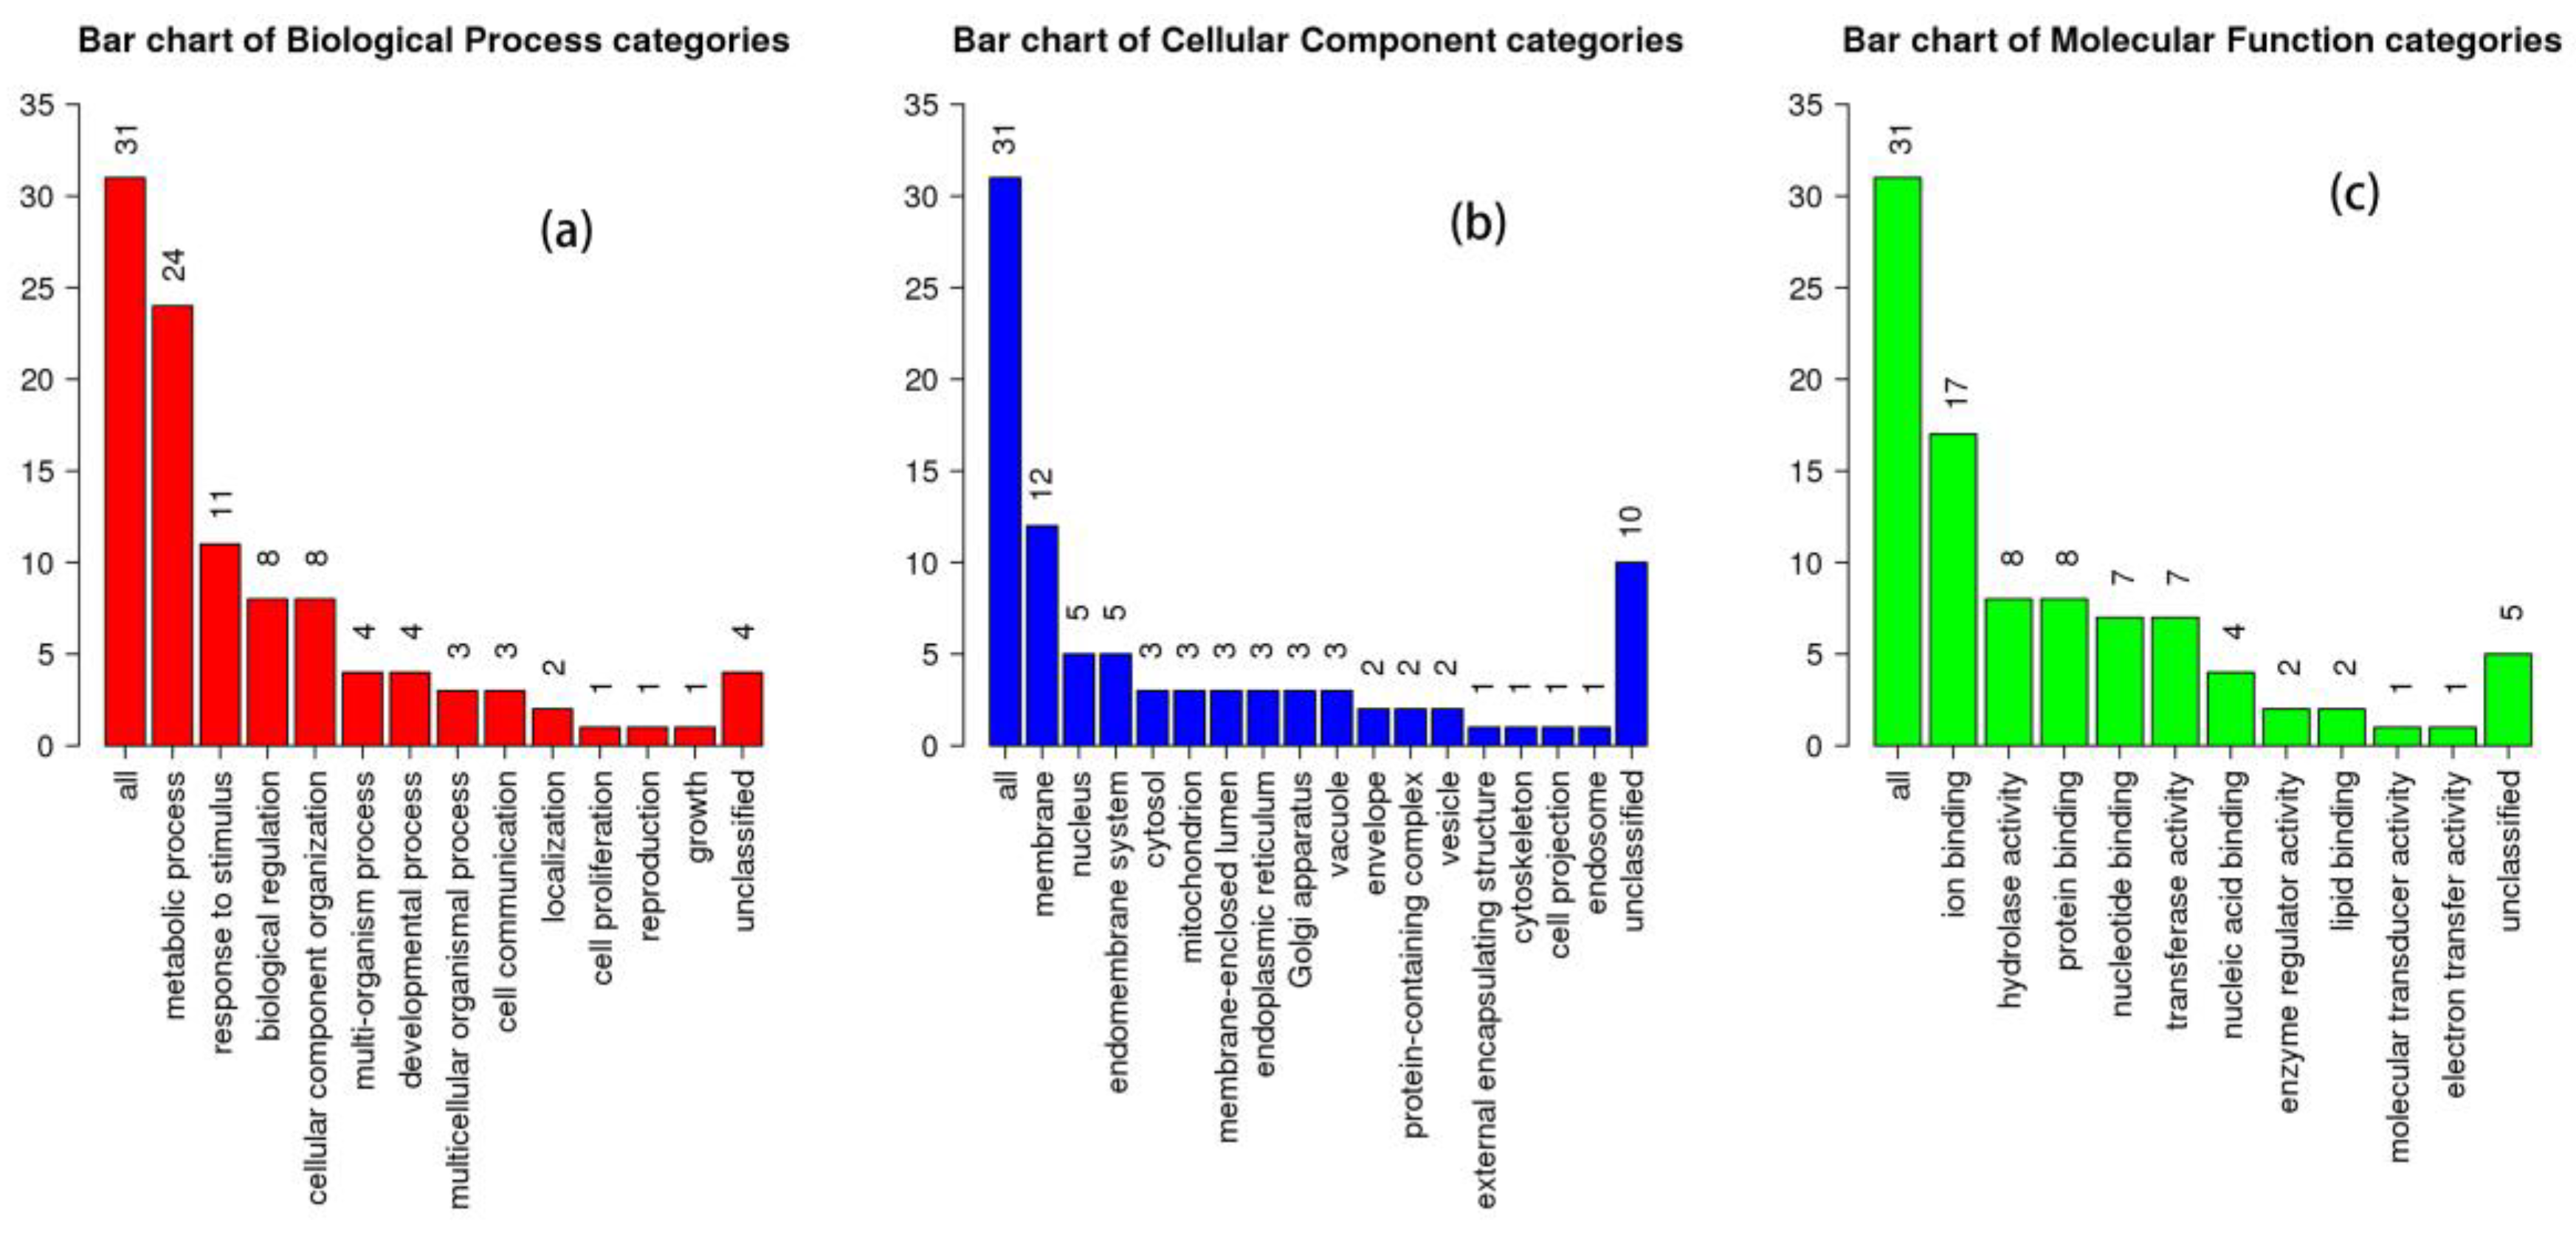
3.2. Functional Analysis of Total Proteins

Our proteomics analysis successfully identified 6261 proteins (Table S1). Figure 3 illustrates the results through Gene Ontology (GO) database annotation and shows that the P. serrulata leaf proteins are primarily associated with diverse biological processes (BPs). These processes encompass metabolic activities, responses to stimuli, biological regulation, organization of cellular components, and other processes. The proteins also exhibited molecular function (MF) activities such as ion binding, hydrolase activity, and protein binding. The proteins were enriched in cellular components (CCs) such as the membrane, the nucleus, and the endomembrane system.

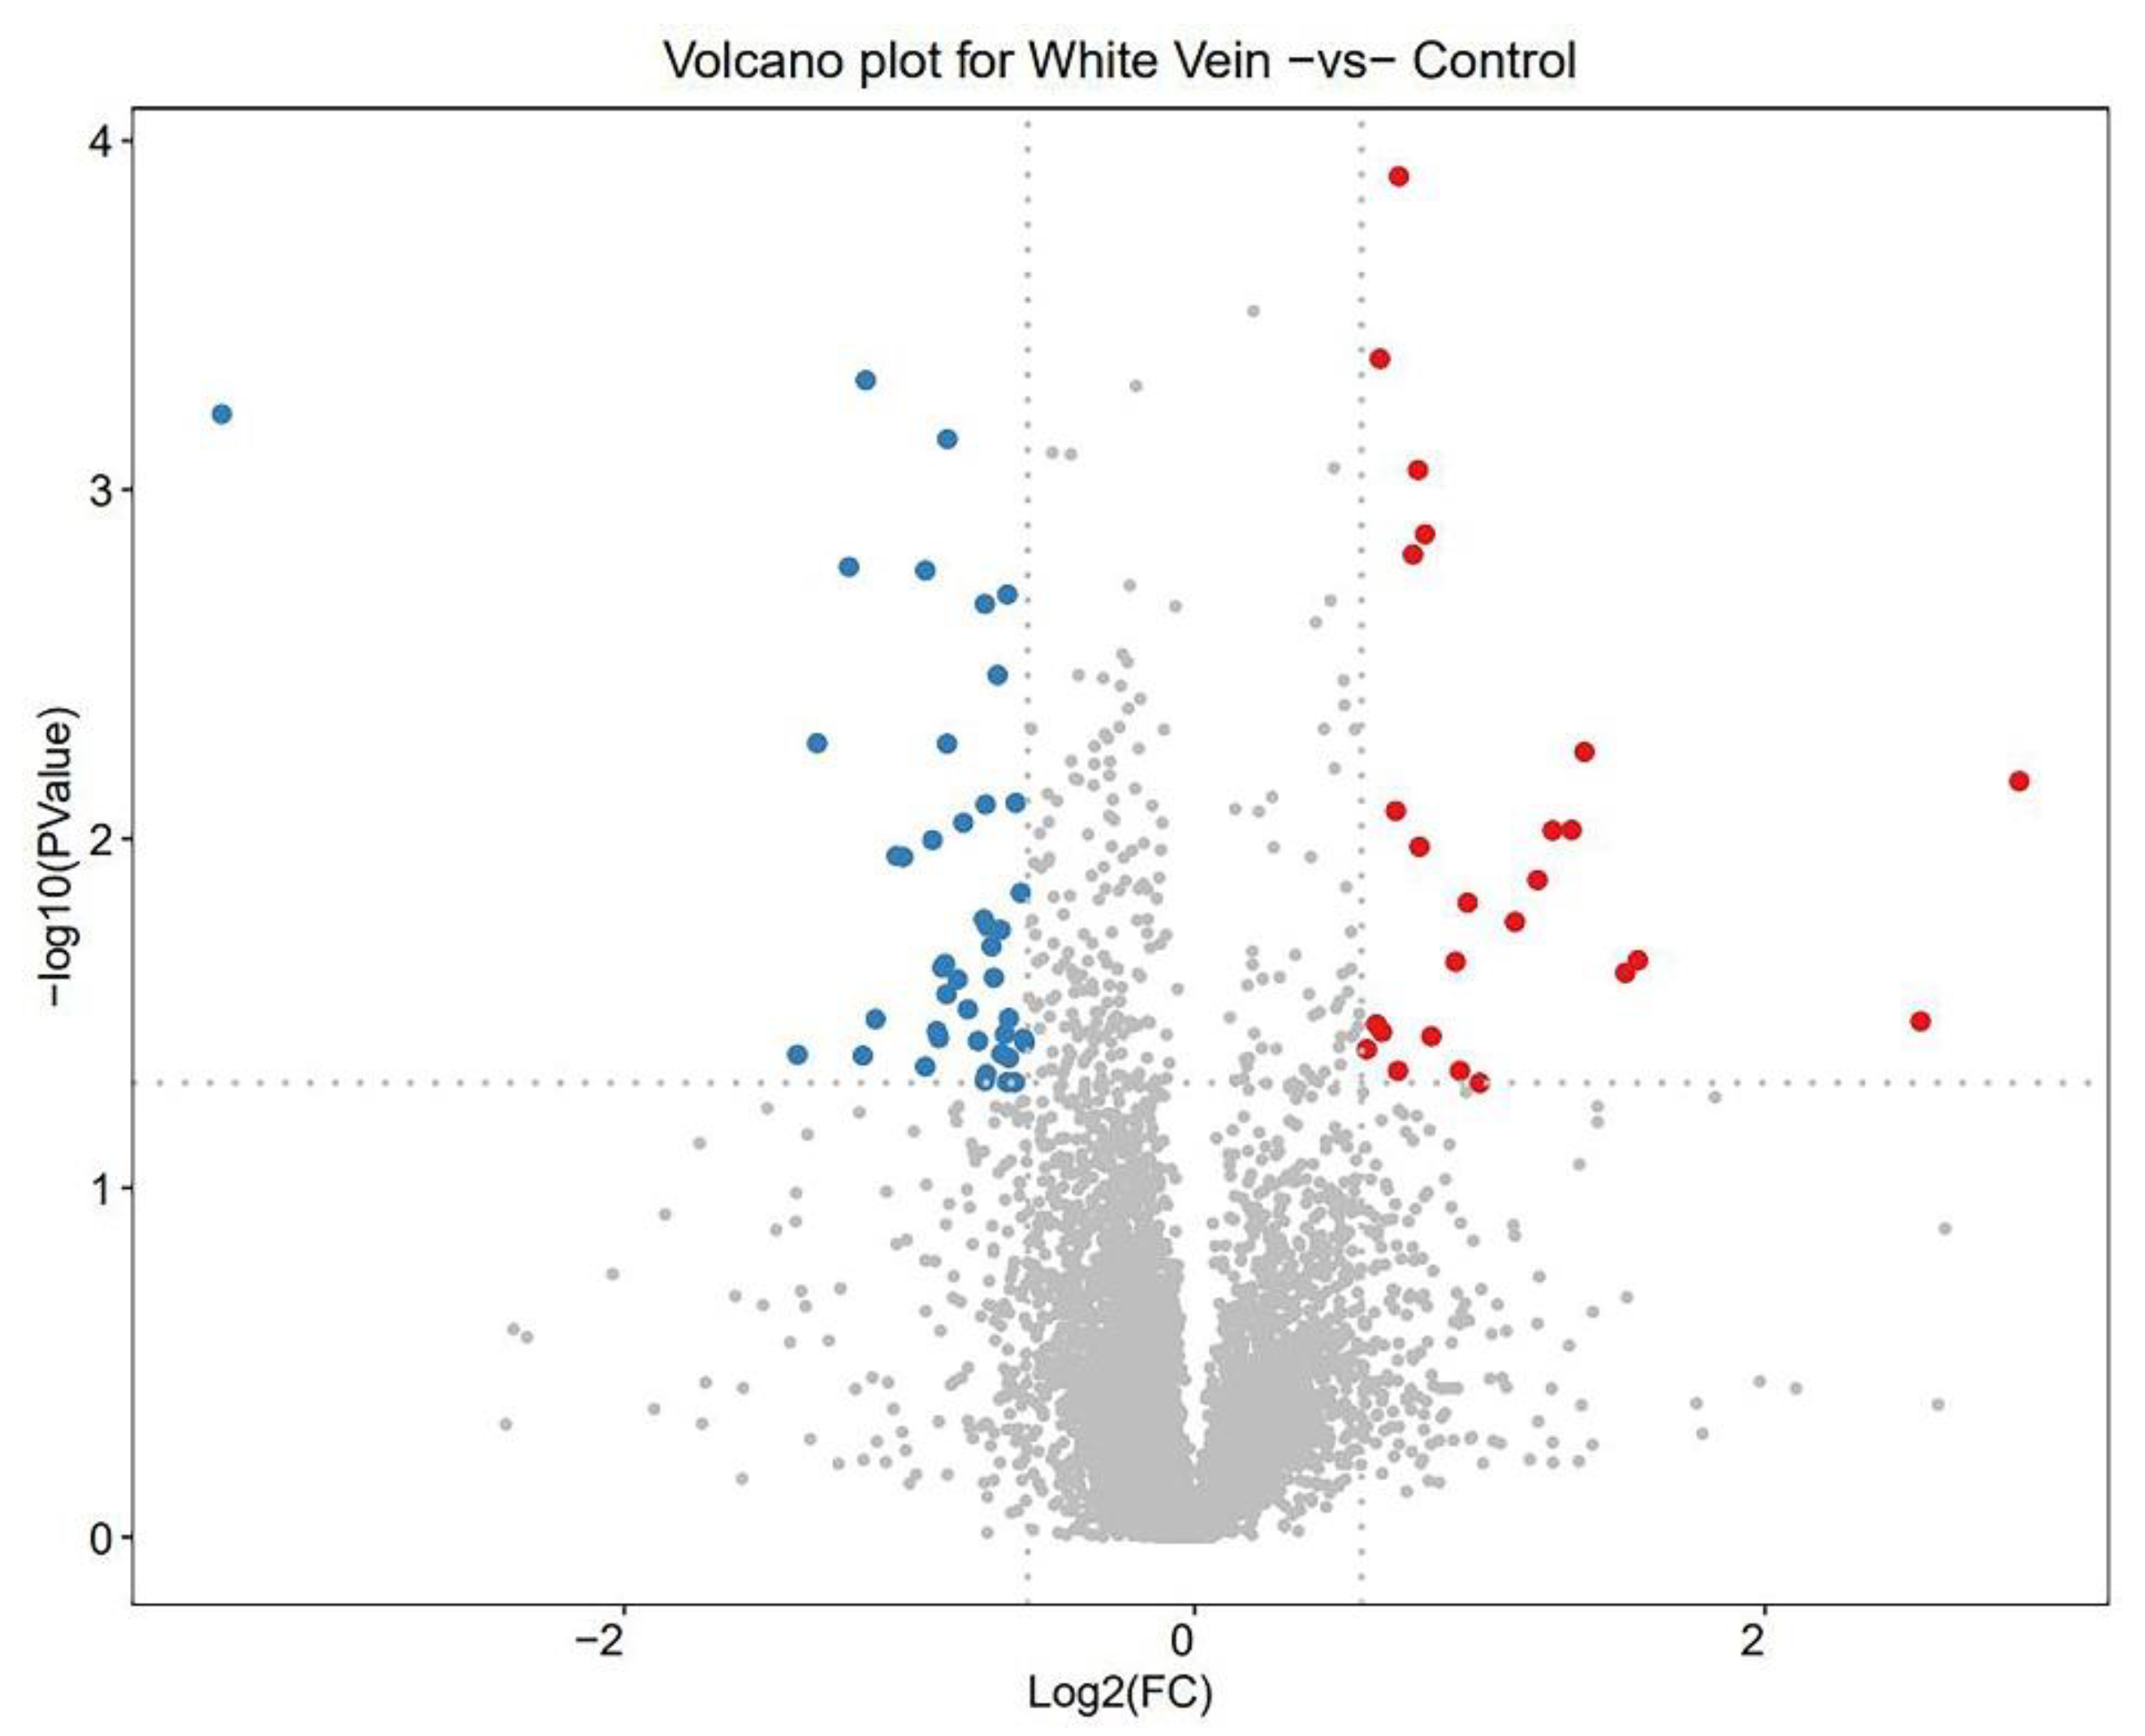
3.3. Quantity of DEPs

In this study, a total of 6261 DEPs was identified (Table S1). Of these, 399 DEPs were selected based on log2 fold change (log2FC) criteria of less than −0.58 or greater than 0.58 (Table S2). For a more accurate and realistic analysis, the BH FDR method was applied to adjust the p-values of these 399 DEPs. Ultimately, only 69 DEPs (Table S3) were chosen for further analysis.
The volcano plot (Figure 4) visualizes the differential expression of proteins between the WV plants and the control group, as assessed by our proteomics analysis. The plot highlights 44 proteins that were downregulated in WV plants, as shown by the blue points, and 25 proteins that were upregulated, indicated by the red points. These DEPs were significantly distant from zero on the Log2FC axis, which denotes the magnitude of the expression change. The vertical axis represents the negative logarithm to the base 10 of the p-value (−log10 [p-value]), illustrating the difference in the expression of each protein. Proteins that surpassed the threshold for statistical significance, as denoted by the horizontal dotted line, demonstrated substantial changes in expression and high statistical significance. The clustering of red points to the right suggests a group of proteins that were more abundant in the WV plants than in the control, while the cluster of blue points to the left indicates a set of less-abundant proteins.

3.4. Functional Enrichment Analysis of the DEPs

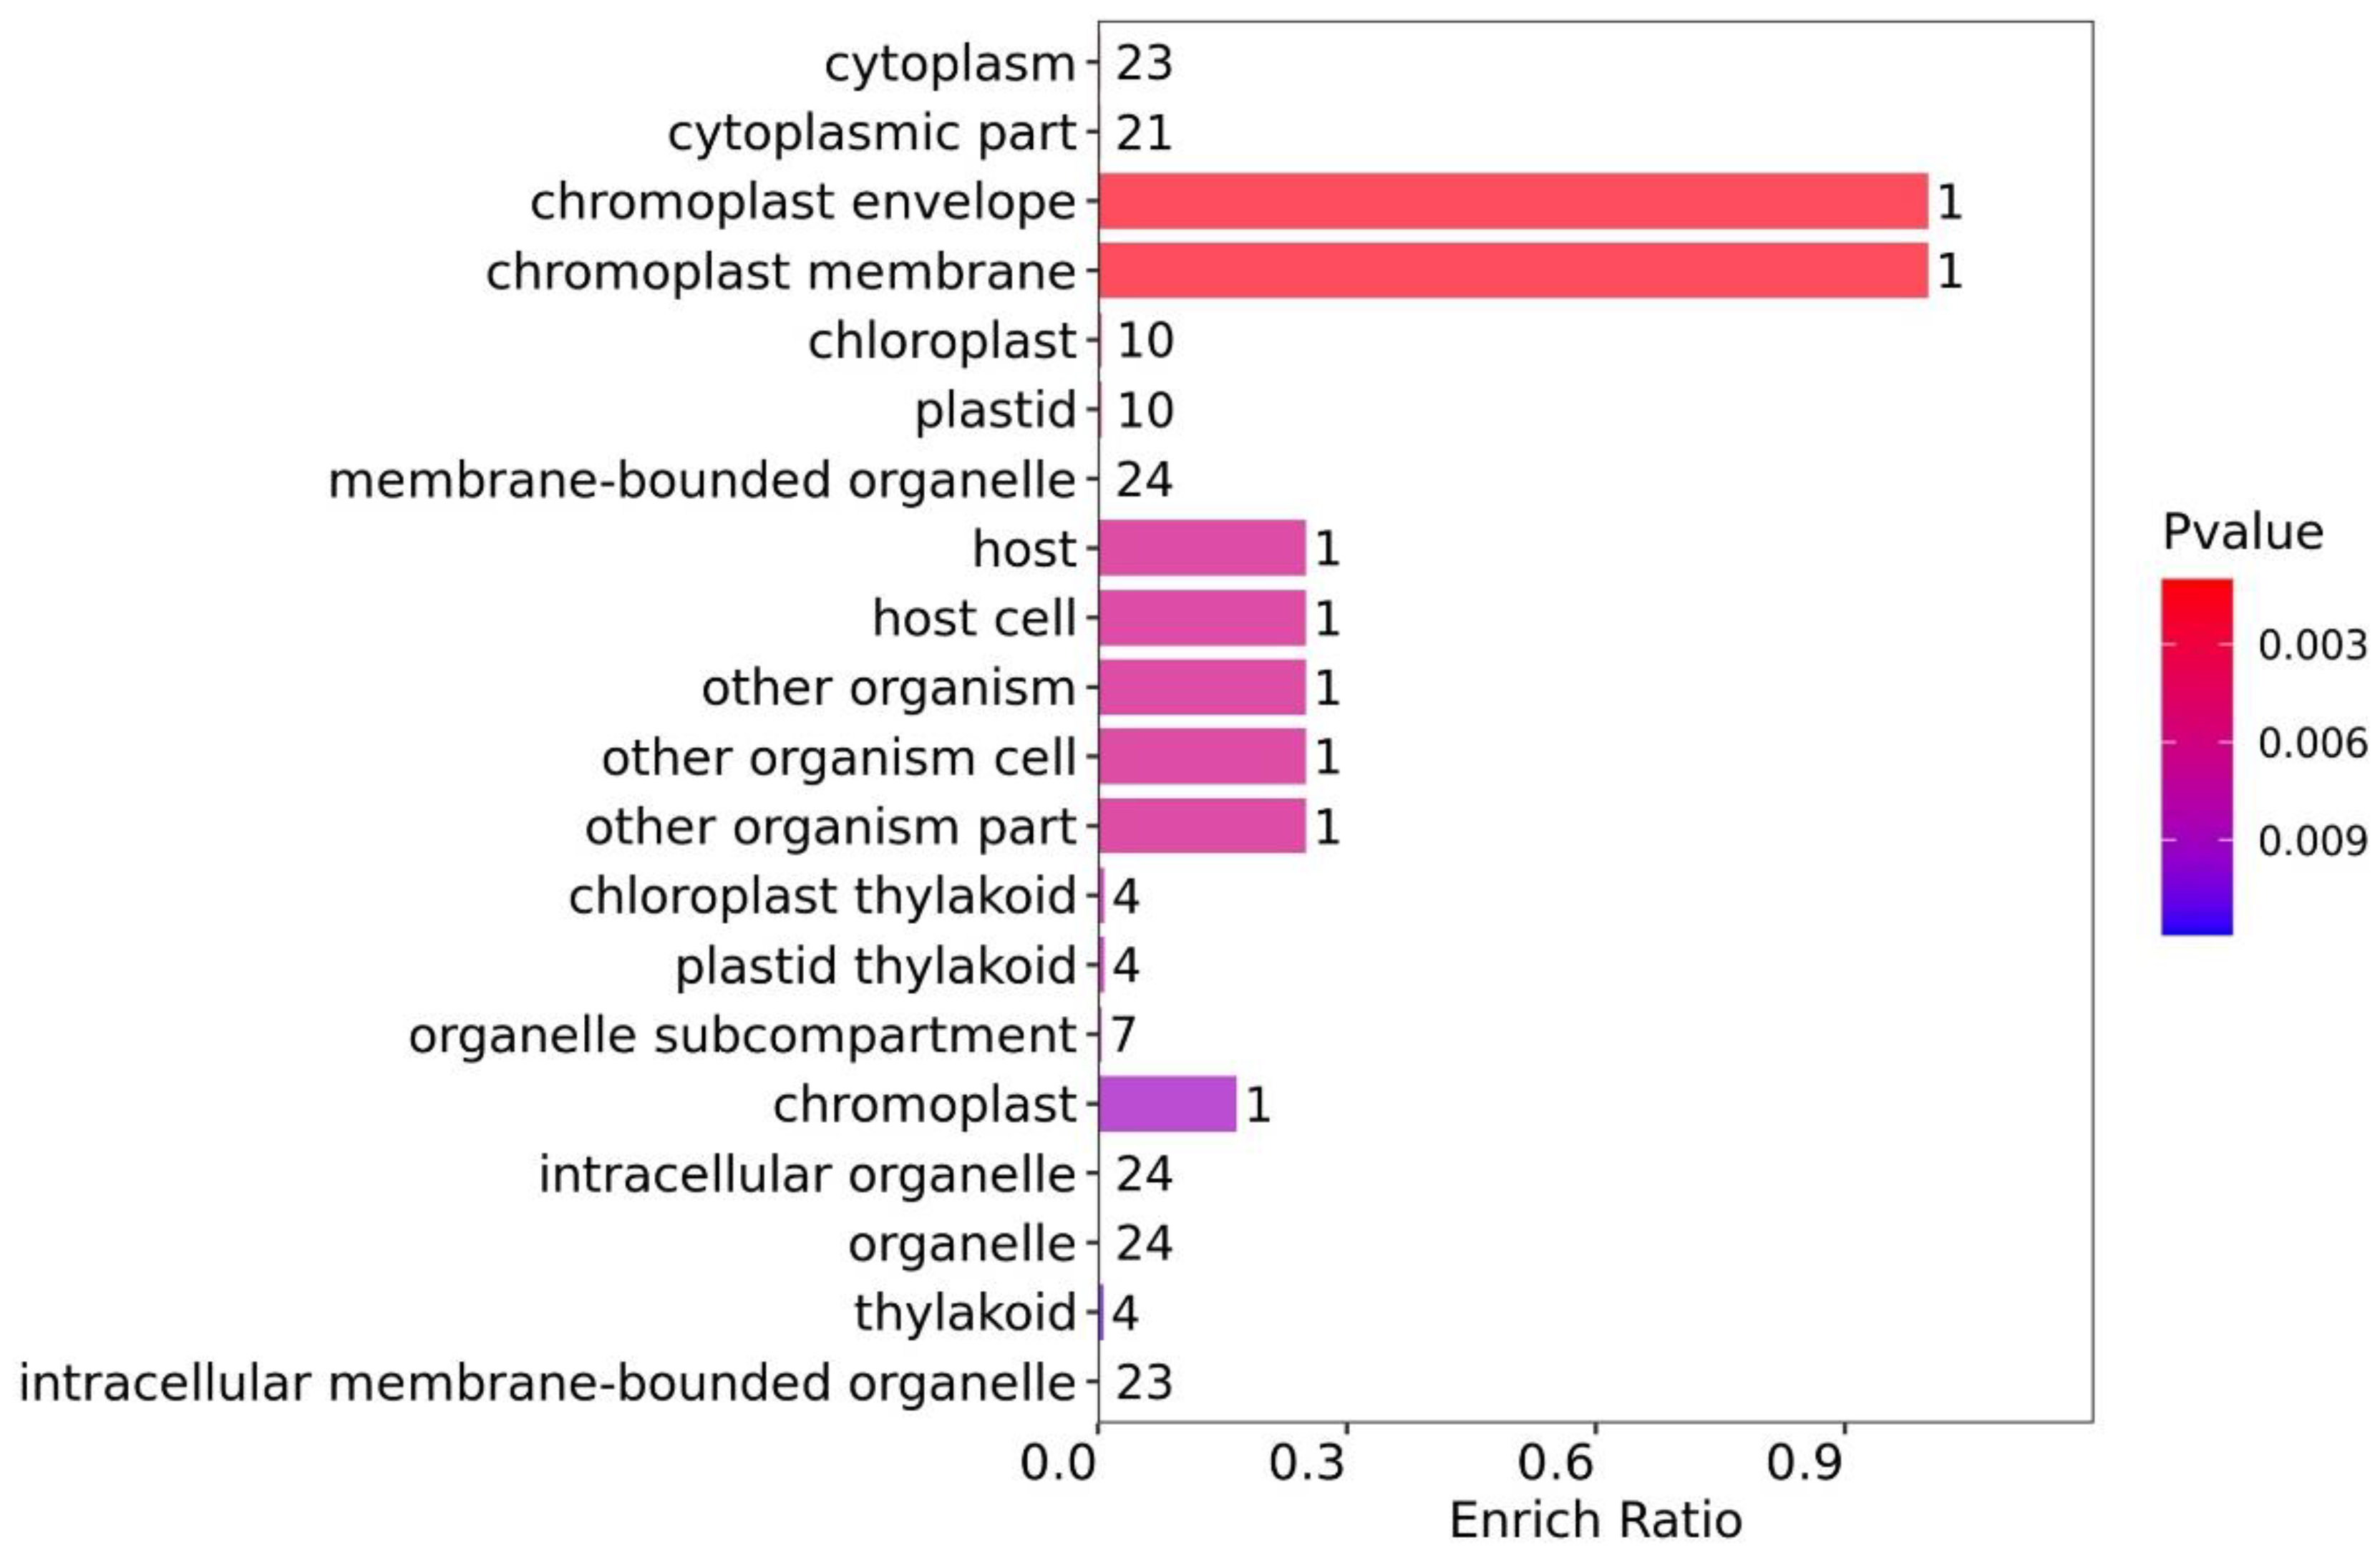
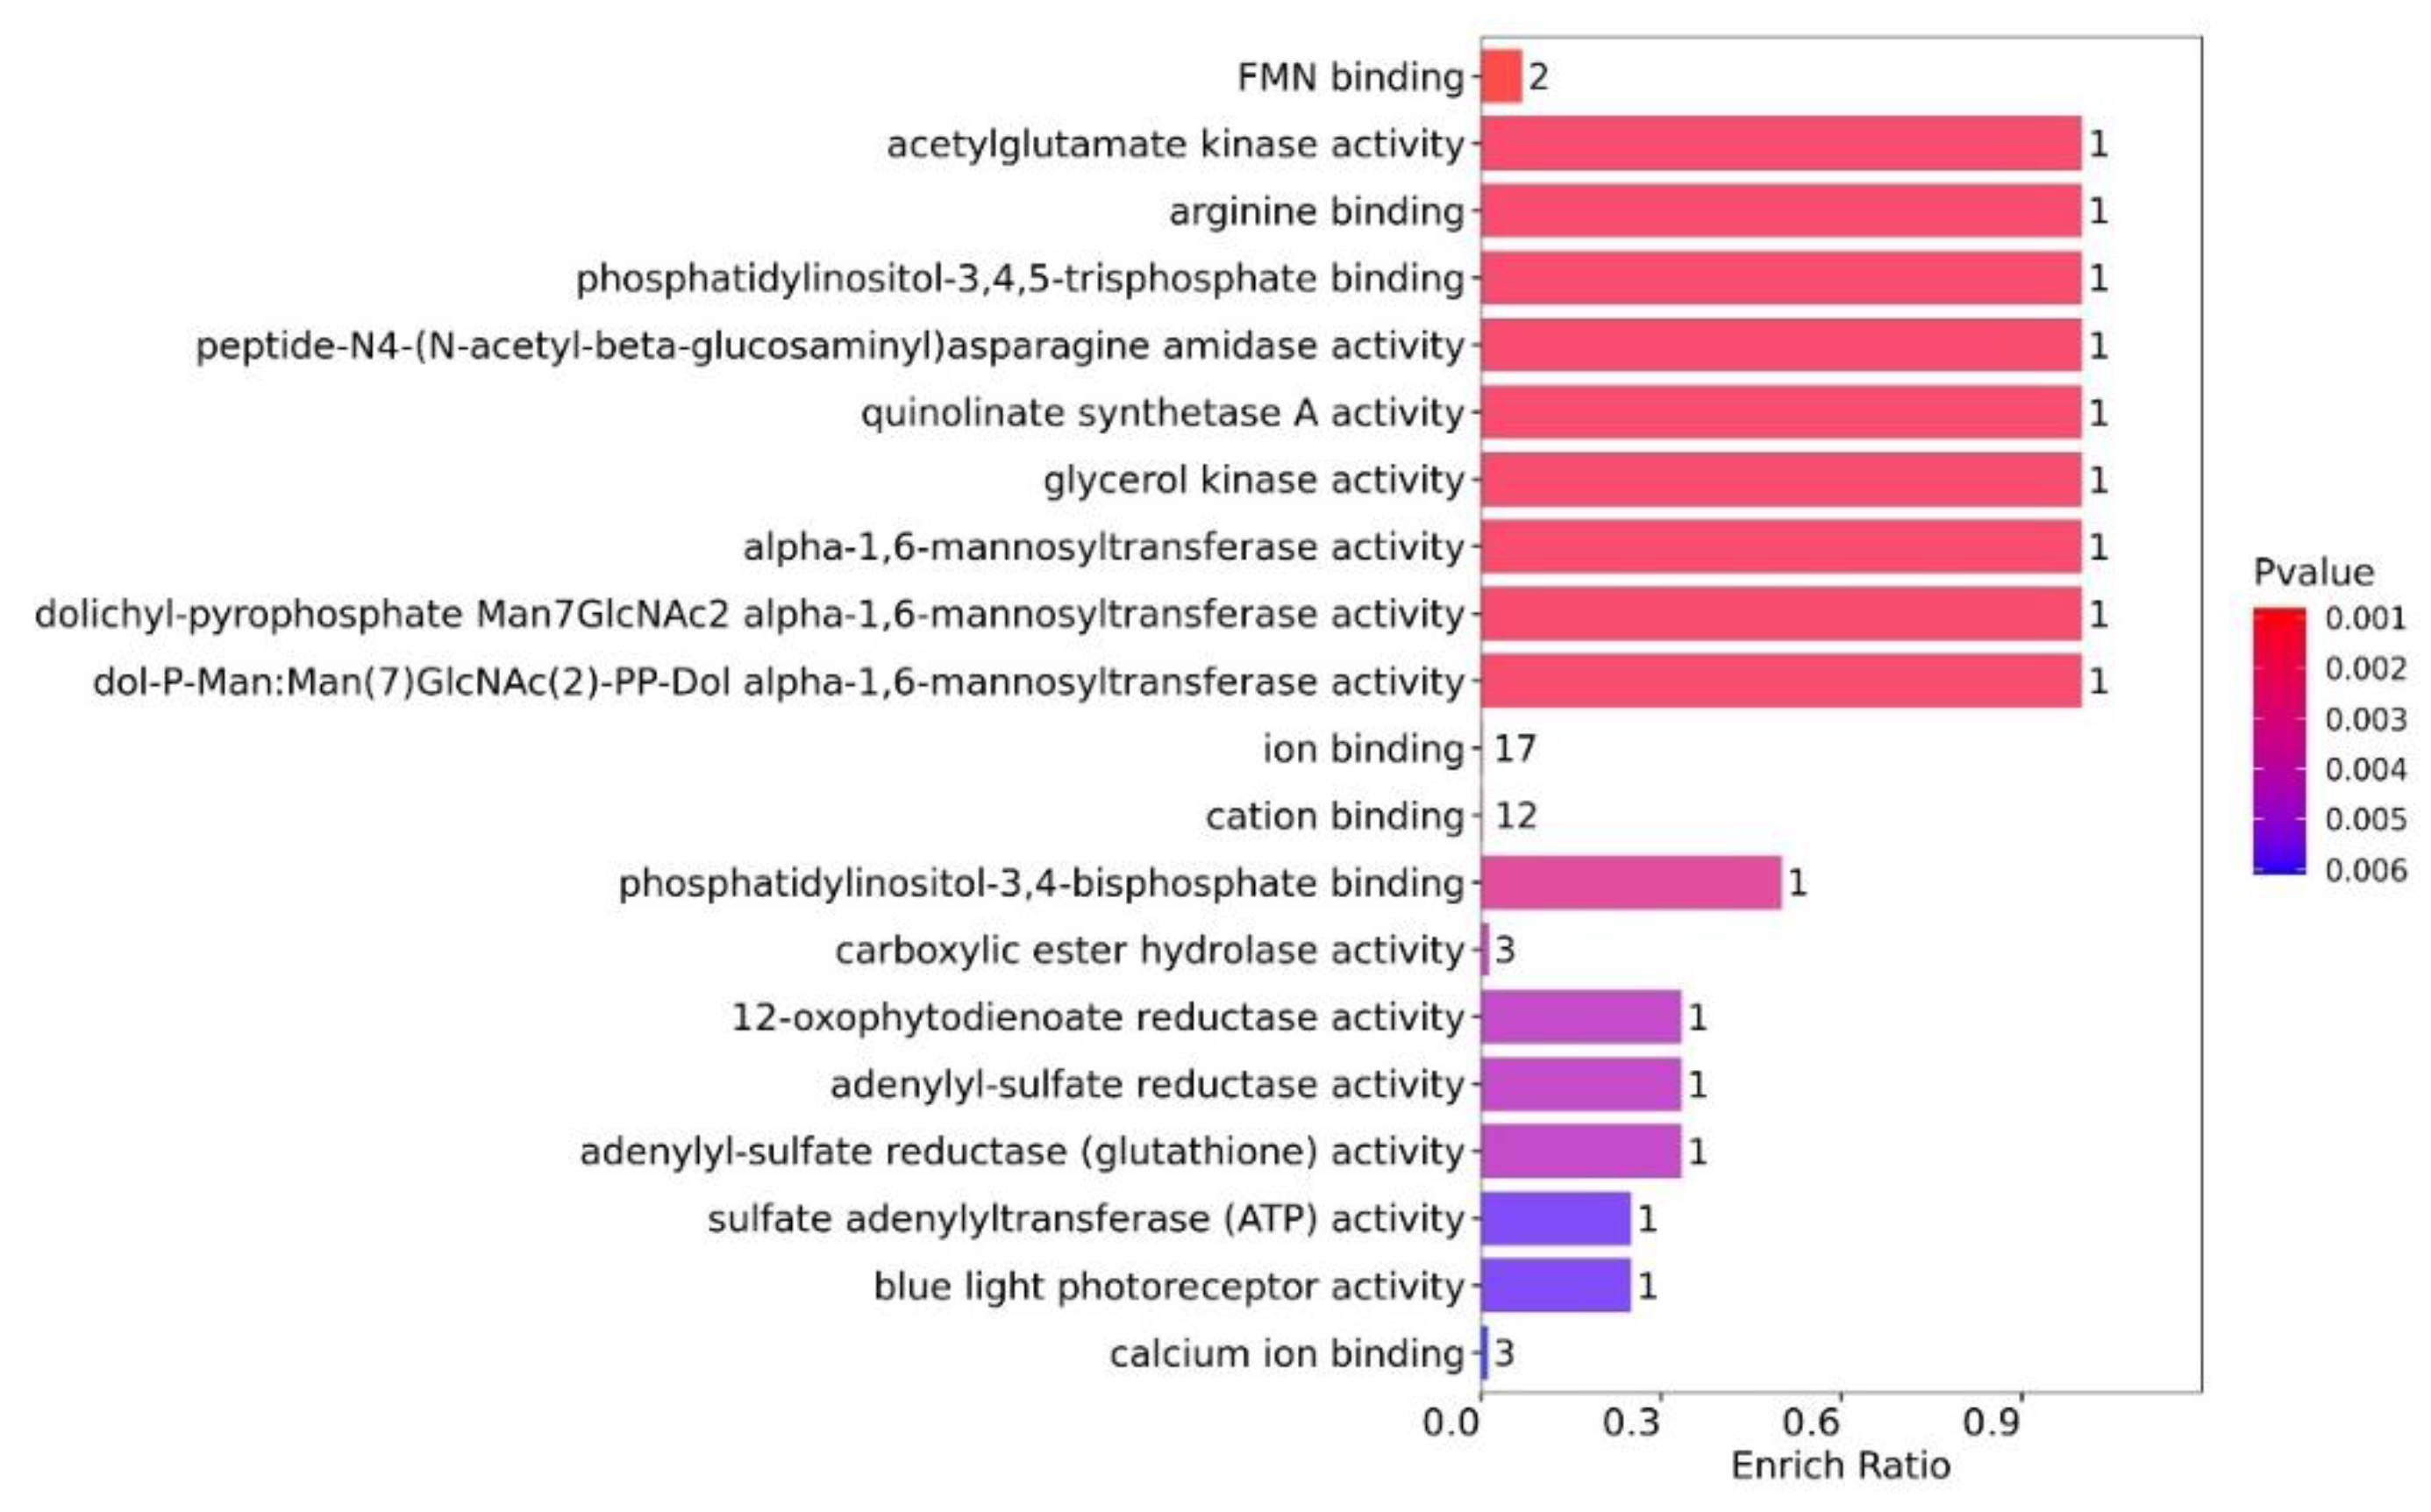
3.4.1. Functional GO Enrichment Analysis

The DEPs with the highest enrichment ratios were predominantly associated with magnesium metabolism, despite a medium level of statistical significance (Figure 5). Specifically, these results encompassed cellular responses to magnesium starvation (1, with an enriched quantity of DEPs following suit), response to magnesium ions (1), and cellular response to magnesium ions (1). As magnesium is an essential element for Chl synthesis, these results align with the decrease in Chl content and the downregulation of DEPs related to Chl synthesis observed in the WV group.
Other BP DEPs exhibiting notable enrichment ratios were linked to cellular responses to a mannitol stimulus (1) or sorbitol (1), as well as the biosynthetic processes of quinolinate (1) or glycerol-3-phosphate (1). Despite a relatively low enrichment ratio, these DEPs were associated with metabolic processes (24), cellular metabolic processes (22), and cellular processes (24).
From the GO-CC enrichment analysis (Figure 6), the DEPs with the highest enrichment ratios were associated with chromoplasts [chromoplast envelope (1) and chromoplast membrane (1)], and statistical significance was high. Although the enrichment ratio was low, the DEPs were primarily related to the cytoplasm, organelles, and chloroplasts, including the cytoplasm (23), cytoplasmic parts (21), chloroplasts (10), plastids (10), membrane-bounded organelles (24), intracellular organelles (24), organelles (24), and intracellular membrane-bounded organelles (23). These results agree with the downregulation of DEPs related to chloroplast synthesis observed in the WV group.
The DEPs with the highest enrichment ratios from the GO-MF enrichment analysis (Figure 7) were involved in material binding (arginine (1) and phosphatidylinositol-3,4,5-triphosphate (1)) and enzyme activity (seven enzymes and one DEP for each). Although the enrichment ratios were low, the DEPs were related to ion binding (17) and cation binding (12), with three DEPs involved in calcium ion binding.

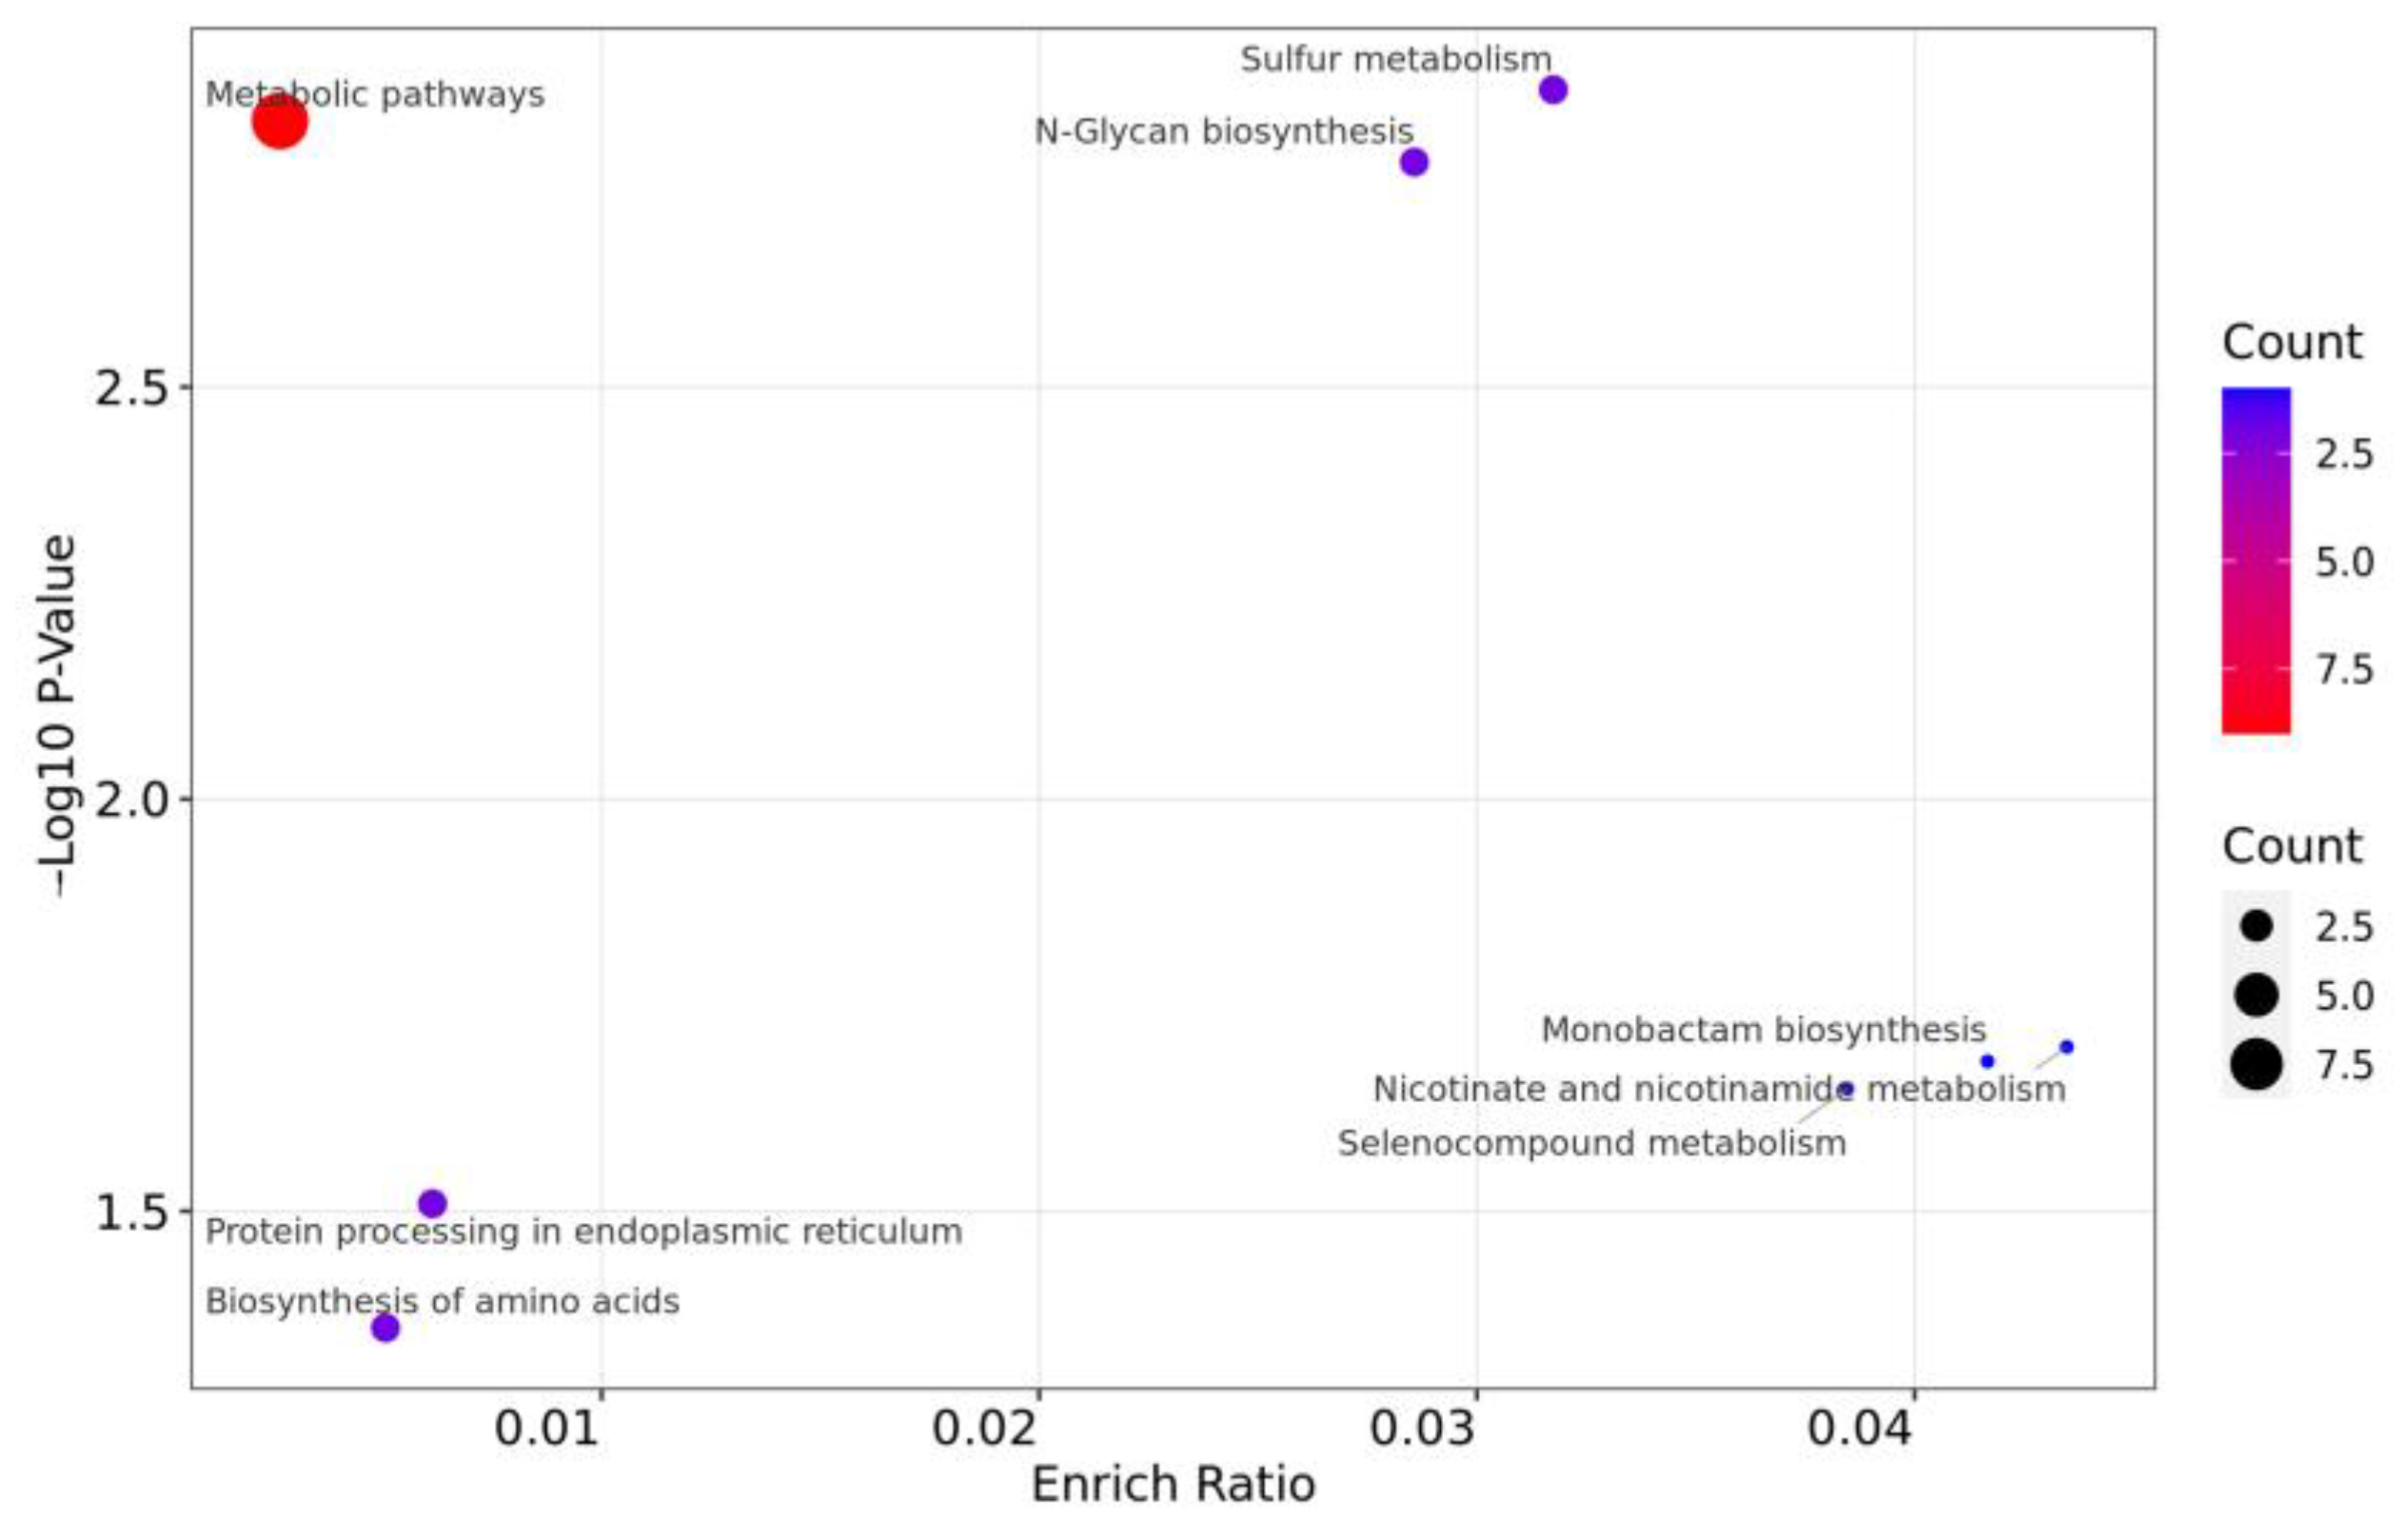
3.4.2. Functional KEGG Enrichment Analysis

The DEPs were significantly enriched in “metabolic pathways” (9) in the KEGG enrichment analysis (Figure 8). Other counts (one or two DEPs) were enriched in nicotinate and nicotinamide metabolism, monobactam biosynthesis, selenocompound metabolism, sulfur metabolism, N-glycan biosynthesis, protein processing in the endoplasmic reticulum (ER), and biosynthesis of amino acids.

3.5. Protein Interaction Network Analysis

Strong correlations were detected (Figure 9) between phosphoadenosine phosphosulfate reductase (APR3) and adenylyl phosphosulfate (APS1) and between the peptide: N-glycanase (PNG1) and glycerol kinase (NHO1). Interactions occurred between the pentatricopeptide repeat-containing (PPR) protein (AT4G36680) and PPR336 (At1g61870), mannosyl-oligosaccharide 1,2-alpha-mannosidase IA (MNS2) and the asparagine-linked glycosylation (ALG) protein 12 homolog (ALG12), quinolinate synthase (QS) A and probable phosphoglycerate mutase (PGAM) GpmB (AT3G05350), and phototropin (PHOT2) and photosynthetic NAD(P)H dehydrogenase (NDH) subunit of subcomplex B 4 (PnsB4).

4. Discussion

4.1. Proteins Affecting the Formation of Chloroplast and Chl

Some downregulated DEPs in the WV group were associated with the formation of chloroplasts, including reticulon-3, allene oxide synthase (AOS), and cytochrome c6. Reticulons are ubiquitous ER-localized proteins in eukaryotic organisms [16]. Inactivation of the plant reticulon gene leads to severe defects in chloroplast functioning and oxidative stress, resulting in pale-green leaves [17]. AOS is targeted to the chloroplast envelope through a pathway that involves ATP and proteins [18]. Cytochrome c6 is a soluble metalloprotein involved in the reduction of photosystem I [19]. The downregulation of these DEPs suggests a weakening of chloroplast biosynthesis in WV leaves.
Some downregulated DEPs in the WV group were related to Chl biosynthesis, including PHOT2 and guanine nucleotide-binding protein (G-protein) subunit beta. Chl biosynthesis may be controlled by the joint action of phytochromes and PHOTs, which regulate the formation of different chlorophyllide forms [20]. In addition to GTPase activity, G-proteins exhibit various specific molecular functions [21] and are involved in activating the phytochrome-mediated Chl a/b-binding proteins (cab) gene [22]. Downregulation of these DEPs suggests a weakening of chlorophyll biosynthesis in WV leaves.

4.2. Proteins Related to Stress Resistance

Some downregulated DEPs enhance resistance to environmental stressors, such as drought (late embryogenesis abundant protein [23] and maspardin [24]), salt (salt stress root protein RS1 (conjectured from the literal meaning), maspardin [24] and MNS2 [25]), heat shock (general stress protein CTC [26] and retrovirus-related Pol polyprotein from transposon [27]), oxidation (putative oxidoreductase GLYR1 [28], SIA1 [29] and reticulon [17]), toxins (GPR107 [30] and cell number regulator [31]), misfolded glycoprotein (peptide: N-glycanase 1 [32]), herbivore (AOS [33]), phytopathogenic fungi (polygalacturonase inhibitor [34]), and other abiotic and biotic stressors (alcohol dehydrogenase 1 [35] and beta-glucosidase [36]).
Fewer DEPs related to stress resistance were upregulated in the WV group than in the control group, such as acetylglutamate kinase, carboxylesteraseisozyme, major pollen allergen Bet v 1, purple acid phosphatase, and ferritin-1.
In general, stress resistance was weak in the WV leaves but there were some compensatory mechanisms against particular stressors.

4.3. Proteins Related to Biomacromolecule Modification

Some downregulated DEPs in the WV group were related to biomacromolecule modification, such as factor of DNA methylation 1, retrovirus-related Pol polyprotein from transposon 297, GPI transamidase component GAA1, polyadenylate-binding protein 2, and pentatricopeptide repeat-containing protein At1g61870.
Many DEPs related to modifying biomacromolecules were downregulated in the WV group. This was likely attributable to the downregulation of many DEPs involved in photosynthesis and stress resistance in the WV group.

4.4. Proteins Related to Iron and/or Sulfur Increase in WV Leaves

Some upregulated DEPs in the WV group contain iron and/or sulfur, such as QS, APR3, ferritin-1, acid phosphatase, sulfate adenylyl transferase, and prolyl endopeptidase-like protein. QS and APR are iron-sulfur enzymes. Most of the cellular iron is stored in ferritin, which is both the acceptor and donor of iron for metabolic processes [37].
Two upregulated proteins contain heme, whose porphyrin ring surrounds an iron ion [38]. The nitrate reductase monomer is composed of a ∼100-kD polypeptide and FAD, heme-iron, and molybdenum-molybdopterin molecules [39]. A heme-heme binuclear center is in the cytochrome bd ubiquinol oxidase [40].
One upregulated protein catalyzes the reaction related to iron. Acid phosphatase catalyzes the hydrolysis of phosphate monoesters under acidic condition and most of the isoforms exhibit a characteristic purple color due to charge transfer from a tyrosine residue to Fe (III) [41].
Although iron is an essential element for Chl synthesis [42], it was likely utilized for synthesizing heme and ferritin in WV leaves. This is further supported by the downregulation of several DEPs involved in Chl synthesis and the upregulation of several DEPs containing heme or ferritin in this study. Iron-rich ferritins are thought to hinder Chl biosynthesis because of the mutual inhibition between heme and Chl [13]. Heme and Chl contain a porphyrin ring structure; in heme, the porphyrin ring surrounds an iron ion, while in Chl, it surrounds a magnesium ion [38].
Some upregulated DEPs in the WV group are related to sulfate and respiration. Heme catalyzes respiration to release the energy stored in chemical bonds, while Chl catalyzes to convert the energy of sunlight into the stored chemical energy of bonds [43]. Sulfate is taken up by the cell and is activated by sulfate adenylyl transferase to adenylyl phosphosulfate and inorganic pyrophosphate [44]. Prolyl endopeptidase-like is a (thio)esterase involved in mitochondrial respiratory chain function [45].
Two pairs of proteins related to sulfate or respiration interacted in this study, such as APR3 and APS1 and QS and AT3G05350 (Figure 9). APR controls the sulfate assimilation pathway, which provides reduced sulfur for synthesizing the amino acids cysteine and methionine [46]. APS is reduced to sulfite and adenosine monophosphate [44], so it is related to sulfate assimilation pathway and energy metabolism.
QS is an iron–sulfur enzyme involved in the biosynthesis of nicotinamide adenine dinucleotide (NAD) and plays a crucial role as a cofactor in many essential redox biological reactions [47], such as the tricarboxylic acid cycle (TCA). 2,3-Biphophoglycerate-independent PGAM AT3G05350 is a key glycolytic enzyme that catalyzes the reversible interconversion of 3-phosphoglycerate (3-PGA) to 2-phosphoglycerate (2-PGA) [48]. Because TCA and glycolysis are crucial processes in energy metabolism, the interaction between QS and AT3G05350 in this study indicated that the formation of WV was related to energy metabolism.
The upregulated DEPs containing iron or sulfur in the WV group, along with the interacting proteins related to the sulfate assimilation pathway and energy metabolism, indicate that photosynthesis was weakened, and respiration was enhanced in the WV leaves. Our findings are consistent with the result that the absence of chloroplast activity leads to an increase in mitochondrial gene copy number and elevated mitochondrial transcription levels in white leaves [10].

4.5. DEPs Affecting Cell-Wall Formation

Expansin-A4, PnsB4, and pectinesterase were upregulated in the WV group. Expansin-A4 is involved in cell elongation and cell-wall modifications by loosening and extending plant cell walls [49]. PnsB4 is also related to cell elongation [50]. Pectinesterase acts on pectins in the cell wall in vivo, causing gel formation [51]. The upregulation of these three DEPs in P. serrulata suggests ongoing cell-wall elongation and gelation within the WVs, which agrees with the visual traits of the WVs, where cells appear more protrusive and irregular (Figure 10A) compared to the smoother cells in the green areas (Figure 10B). These differences are potentially ascribed to the extension of the cell walls in the white region. Moreover, the enhanced refractivity noted in the white area suggests a greater accumulation of gels within these cellular structures.

5. Conclusions

In this study, we performed an in-depth proteomic analysis using a TMT-based approach, specifically focusing on contrasting WV and green-leaved P. serrulata. This proteomics landscape offered several key insights into the physiological changes occurring in WV leaves, including: (1) a notable decrease in chloroplast and Chl biosynthesis, pointing to fundamental changes in photosynthetic machinery; (2) a shift in iron usage, favoring heme and ferritin synthesis over Chl, suggesting altered metabolic priorities; (3) enhanced respiratory activity, which could be a compensatory response to a low photosynthetic rate; and (4) changes in cell-wall properties, as evidenced by elongation and gelling, indicating structural adaptations. These proteomic variations underscore the complex interplay of molecular processes in WV leaves. Importantly, our study highlights the potential for targeted manipulation of these proteomic pathways to optimize the cultivation of WV P. serrulata plants, opening up avenues for further research in plant variegation and horticulture.

Supplementary Materials

The following supporting information can be downloaded at: https://www.mdpi.com/article/10.3390/horticulturae10010019/s1, Table S1: All differentially expressed proteins in this study; Table S2: DEPs with log2FC less than −0.58 or greater than 0.58; Table S3: DEPs with fold change greater than 1.5.

Author Contributions

Conceptualization and methodology, Q.-L.D. and R.-B.Z.; formal analysis, M.-F.C.; investigation, D.-J.X. and T.D.; software, Z.-M.Q. and S.-S.W.; writing—original draft preparation, Q.-L.D. and D.-J.X.; writing—review and editing, R.-B.Z.; funding acquisition, D.-J.X. All authors have read and agreed to the published version of the manuscript.

Funding

This research was funded by the National Natural Science Foundation of China (Grant No. 31860162), the Science and Technology Bureau Scientific Research Project of Zunyi City (Grant No. 2305011203), and the Science & Technology Fundamental Resources Investigation Program (Grant No. 2022FY100201).

Data Availability Statement

Data are contained within the article and supplementary materials.

Acknowledgments

We thank Suzhou Bionovogene Company, China, for helping with the experiments.

Conflicts of Interest

The authors declare no conflict of interest.

References

  1. Hedtke, B.; Wagner, I.; Börner, T.; Hess, W. Inter-organellar crosstalk in higher plants: Impaired chloroplast development affects mitochondrial gene and transcript levels. Plant J. Cell Mol. Biol. 1999, 19, 635–643. [Google Scholar] [CrossRef] [PubMed]
  2. Toshoji, H.; Katsumata, T.; Takusagawa, M.; Yusa, Y.; Sakai, A. Effects of chloroplast dysfunction on mitochondria: White sectors in variegated leaves have higher mitochondrial DNA levels and lower dark respiration rates than green sectors. Protoplasma 2011, 249, 805–817. [Google Scholar] [CrossRef] [PubMed]
  3. Xiong, Y.; Ma, J.; He, Y.; Lin, Z.; Li, X.; Yu, S.; Li, R.; Jiang, F.; Li, X.; Huang, Z.; et al. High-throughput sequencing analysis revealed the regulation patterns of small RNAs on the development of A. comosus var. bracteatus leaves. Sci. Rep. 2018, 8, 1947. [Google Scholar] [CrossRef] [PubMed]
  4. Aluru, M.; Bae, H.; Wu, D.; Rodermel, S. The Arabidopsis immutans mutation affects plastid differentiation and the morphogenesis of white and green sectors in variegated plants. Plant Physiol. 2001, 127, 67–77. [Google Scholar] [CrossRef] [PubMed]
  5. Foudree, A.; Putarjunan, A.; Kambakam, S.; Nolan, T.; Fussell, J.; Pogorelko, G.; Rodermel, S. The Mechanism of Variegation in immutans Provides Insight into Chloroplast Biogenesis. Front. Plant Sci. 2012, 3, 260. [Google Scholar] [CrossRef] [PubMed]
  6. Sun, Y.; Hung, C.; Qiu, J.; Chen, J.; Kittur, F.; Oldham, C.; Henny, R.; Burkey, K.; Fan, L.; Xie, J. Accumulation of high OPDA level correlates with reduced ROS and elevated GSH benefiting white cell survival in variegated leaves. Sci. Rep. 2017, 7, 44158. [Google Scholar] [CrossRef] [PubMed]
  7. Chen, L.Y.; He, L.T.; Lai, J.L.; He, S.T.; Wu, Y.X.; Zheng, Y.S. The variation of chlorophyll biosynthesis and the structure in different color leaves of Bambusa multiplex ‘Silverstripe’. J. For. Environ. 2017, 37, 385–391. [Google Scholar]
  8. Wei, Y.L.; Shi, Y.F.; Wu, J.L. Rice (Oryza sativa L.) leaf color mutants. J. Nucl. Agric. Sci. 2011, 25, 1169–1178. [Google Scholar]
  9. Li, S.M.; Wang, S.; Wang, P.; Gao, L.L.; Yang, R.T.; Li, Y. Label-free comparative proteomic and physiological analysis provides insight into leaf color variation of the golden-yellow leaf mutant of Lagerstroemia indica. J. Proteom. 2020, 228, 103942. [Google Scholar] [CrossRef]
  10. Xu, M.Y.; He, P.; Lai, W.; Chen, L.H.; Ge, L.L.; Liu, S.Q.; Yang, Y.J.; Advances in Molecular Mechanism of Plant Leaf Color Variation. Molecular Plant Breeding 2021. Available online: https://kns.cnki.net/kcms/detail/46.1068.S.20210112.1619.016.html (accessed on 22 October 2023).
  11. Dong, X.Y.; Huang, L.B.; Chen, Q.S.; Lyu, Y.Z.; Sun, H.N.; Liang, Z.H. Physiological and anatomical differences and differentially expressed genes reveal yellow leaf coloration in Shumard Oak. Plants 2020, 9, 169. [Google Scholar] [CrossRef]
  12. Li, C.F.; Xu, Y.; Ma, J.Q.; Jin, J.Q.; Huang, D.; Yao, M.; Ma, C.L.; Chen, L. Biochemical and transcriptomic analyses reveal different metabolite biosynthesis profiles among three color and developmental stages in ‘Anji Baicha’ (Camellia sinensis). BMC Plant Biol. 2016, 16, 195. [Google Scholar] [CrossRef] [PubMed]
  13. Du, W.K.; Yuan, S.X.; Hu, F.R. Research Progress on Molecular Mechanisms of the Leaf Color Mutation. Mol. Plant Breed. 2019, 17, 1888–1897. [Google Scholar]
  14. Jiang, H.; Deng, T.; Lv, X.-Y.; Zhang, R.-B.; Wen, F. Primulina serrulata (Gesneriaceae), a new species from southeastern Guizhou, China. PhytoKeys 2019, 132, 11–18. [Google Scholar] [CrossRef] [PubMed]
  15. Zhang, Z.L.; Qu, W.J.; Li, X.F. Experimental Guidance of Plant Biology, 4th ed.; Higher Education Press: Beijing, China, 2009. [Google Scholar]
  16. Tolley, N.J. Functional Analysis of a Reticulon Protein from Arabidopsis thaliana; Department of Biological Sciences, University of Warwick: Coventry, UK, 2010. [Google Scholar]
  17. Tarasenko, V.I.; Garnik, E.Y.; Katyshec, A.I.; Subota, I.Y.; Konstantinov, Y.M. Disruption of Arabidopsis reticulon gene RTNLB16 results in chloroplast dysfunction and oxidative stress. J. Stress Physiol. Biochem. 2012, 8, S21. [Google Scholar]
  18. Knopf, R.R.; Feder, A.; Mayer, K.; Lin, A.; Rozenberg, M.; Schaller, A.; Adam, Z. Rhomboid proteins in the chloroplast envelope affect the level of allene oxide synthase in Arabidopsis thaliana. Plant J. 2012, 72, 559–571. [Google Scholar] [CrossRef] [PubMed]
  19. De la Rosa, M.A.; Navarro, J.A.; Dıaz-Quintana, A.; De la Cerda, B.; Molina-Heredia, F.P.; Balme, A.; del S Murdoch, P.; Dıaz-Moreno, I.; Durán, R.V.; Hervás, M. An evolutionary analysis of the reaction mechanisms of photosystem I reduction by cytochrome c6 and plastocyanin. Bioelectrochemistry 2002, 55, 41–45. [Google Scholar] [CrossRef] [PubMed]
  20. Kong, Y.; Zheng, Y. Phototropin is partly involved in blue-light-mediated stem elongation, flower initiation, and leaf expansion: A comparison of phenotypic responses between wild Arabidopsis and its phototropin mutants. Environ. Exp. Bot. 2020, 171, 103967. [Google Scholar] [CrossRef]
  21. Millner, P.A. Are guanine nucleotide-binding proteins involved in regulation of thylakoid protein kinase activity? FEBS Lett. 1987, 226, 155–160. [Google Scholar] [CrossRef]
  22. Romerro, L.C.; Lam, E. Guanine nucleotide binding protein involvement in early steps of phytochrome-regulated gene expression. Proc. Natl. Acad. Sci. USA 1993, 90, 1465–1469. [Google Scholar] [CrossRef]
  23. Shih, M.-D.; Hoekstra, F.A.; Hsing, Y.-I.C. Late embryogenesis abundant proteins. In Advances in Botanical Research; Elsevier: Amsterdam, The Netherlands, 2008; pp. 211–255. [Google Scholar]
  24. Wang, F.-B.; Wan, C.-Z.; Niu, H.-F.; Qi, M.-Y.; Gang, L.; Zhang, F.; Hu, L.-B.; Ye, Y.-X.; Wang, Z.-X.; Pei, B.-L. OsMas1, a novel maspardin protein gene, confers tolerance to salt and drought stresses by regulating ABA signaling in rice. J. Integr. Agric. 2023, 22, 341–359. [Google Scholar] [CrossRef]
  25. Liu, C.; Niu, G.; Zhang, H.; Sun, Y.; Sun, S.; Yu, F.; Lu, S.; Yang, Y.; Li, J.; Hong, Z. Trimming of N-glycans by the Golgi-localized α-1, 2-mannosidases, MNS1 and MNS2, is crucial for maintaining RSW2 protein abundance during salt stress in Arabidopsis. Mol. Plant 2018, 11, 678–690. [Google Scholar] [CrossRef] [PubMed]
  26. Völker, U.; Engelmann, S.; Maul, B.; Riethdorf, S.; Völker, A.; Schmid, R.; Mach, H.; Hecker, M. Analysis of the induction of general stress proteins of Bacillus subtilis. J. Microbiol. 1994, 140, 741–752. [Google Scholar] [CrossRef] [PubMed]
  27. Traylor-Knowles, N.; Rose, N.H.; Sheets, E.A.; Palumbi, S.R. Early transcriptional responses during heat stress in the coral Acropora hyacinthus. Biol. Bull. 2017, 232, 91–100. [Google Scholar] [CrossRef] [PubMed]
  28. Margaria, P.; Abbà, S.; Palmano, S. Novel aspects of grapevine response to phytoplasma infection investigated by a proteomic and phospho-proteomic approach with data integration into functional networks. BMC Genom. 2013, 14, 1–15. [Google Scholar] [CrossRef] [PubMed]
  29. Manara, A.; DalCorso, G.; Leister, D.; Jahns, P.; Baldan, B.; Furini, A. At SIA 1 AND At OSA 1: Two Abc1 proteins involved in oxidative stress responses and iron distribution within chloroplasts. New Phytol. 2014, 201, 452–465. [Google Scholar] [CrossRef] [PubMed]
  30. Tafesse, F.G.; Guimaraes, C.P.; Maruyama, T.; Carette, J.E.; Lory, S.; Brummelkamp, T.R.; Ploegh, H.L. GPR107, a G-protein-coupled Receptor Essential for Intoxication by Pseudomonas aeruginosa Exotoxin A, Localizes to the Golgi and Is Cleaved by Furin. J. Biol. Chem. 2014, 289, 24005–24018. [Google Scholar] [CrossRef]
  31. Qiao, K.; Tian, Y.; Hu, Z.; Chai, T. Wheat cell number regulator CNR10 enhances the tolerance, translocation, and accumulation of heavy metals in plants. Environ. Sci. Technol. 2018, 53, 860–867. [Google Scholar] [CrossRef]
  32. Suzuki, T.; Park, H.; Hollingsworth, N.M.; Sternglanz, R.; Lennarz, W.J. PNG1, a yeast gene encoding a highly conserved peptide: N-glycanase. J. Cell Biol. 2000, 149, 1039–1052. [Google Scholar] [CrossRef]
  33. Farmer, E.E.; Goossens, A. Jasmonates: What ALLENE OXIDE SYNTHASE does for plants. J. Exp. Bot. 2019, 70, 3373–3378. [Google Scholar] [CrossRef]
  34. De Lorenzo, G.; Ferrari, S. Polygalacturonase-inhibiting proteins in defense against phytopathogenic fungi. Curr. Opin. Plant Biol. 2002, 5, 295–299. [Google Scholar] [CrossRef]
  35. Shi, H.; Liu, W.; Yao, Y.; Wei, Y.; Chan, Z. Alcohol dehydrogenase 1 (ADH1) confers both abiotic and biotic stress resistance in Arabidopsis. Plant Sci. 2017, 262, 24–31. [Google Scholar] [CrossRef] [PubMed]
  36. Gómez-Anduro, G.; Ceniceros-Ojeda, E.A.; Casados-Vázquez, L.E.; Bencivenni, C.; Sierra-Beltrán, A.; Murillo-Amador, B.; Tiessen, A. Genome-wide analysis of the beta-glucosidase gene family in maize (Zea mays L. var B73). Plant Mol. Biol. 2011, 77, 159–183. [Google Scholar] [CrossRef] [PubMed]
  37. Zielińska-Dawidziak, M. Plant ferritin—A source of iron to prevent its deficiency. Nutrients 2015, 7, 1184–1201. [Google Scholar] [CrossRef] [PubMed]
  38. Alberts, B. Molecular Biology of the Cell; Garland Science: New York, NY, USA, 2017. [Google Scholar]
  39. Campbell, W.H. Nitrate reductase structure, function and regulation: Bridging the gap between biochemistry and physiology. Annu. Rev. Plant Biol. 1999, 50, 277–303. [Google Scholar] [CrossRef] [PubMed]
  40. Hill, J.J.; Alben, J.O.; Gennis, R.B. Spectroscopic evidence for a heme-heme binuclear center in the cytochrome bd ubiquinol oxidase from Escherichia coli. Proc. Natl. Acad. Sci. USA 1993, 90, 5863–5867. [Google Scholar] [CrossRef]
  41. Anand, A.; Srivastava, P.K. A molecular description of acid phosphatase. Appl. Biochem. 2012, 167, 2174–2197. [Google Scholar] [CrossRef]
  42. Marsh, H., Jr.; Evans, H.; Matrone, G. Investigations of the role of iron in chlorophyll metabolism. II. Effect of iron deficiency on chlorophyll synthesis. Plant Physiol. 1963, 38, 638. [Google Scholar] [CrossRef]
  43. Granick, S. Evolution of Heme and Chlorophyll, Evolving Genes and Proteins; Elsevier: Amsterdam, The Netherlands, 1965; pp. 67–88. [Google Scholar]
  44. Christensen, G.; Zane, G.; Kazakov, A.; Li, X.; Rodionov, D.; Novichkov, P.; Dubchak, I.; Arkin, A.; Wall, J. Rex (encoded by DVU_0916) in Desulfovibrio vulgaris Hildenborough is a repressor of sulfate adenylyl transferase and is regulated by NADH. J. Bacteriol. 2015, 197, 29–39. [Google Scholar] [CrossRef]
  45. Rosier, K.; McDevitt, M.T.; Smet, J.; Floyd, B.J.; Verschoore, M.; Marcaida, M.J.; Bingman, C.A.; Lemmens, I.; Peraro, M.D.; Tavernier, J. Prolyl endopeptidase-like is a (thio) esterase involved in mitochondrial respiratory chain function. Iscience 2021, 24, 103460. [Google Scholar] [CrossRef]
  46. Kopriva, S.; Koprivova, A. Plant adenosine 5′-phosphosulphate reductase: The past, the present, and the future. J. Exp. Bot. 2004, 55, 1775–1783. [Google Scholar] [CrossRef]
  47. Choudens, S.O.-D.; Loiseau, L.; Sanakis, Y.; Barras, F.; Fontecave, M. Quinolinate synthetase, an iron–sulfur enzyme in NAD biosynthesis. FEBS Lett. 2005, 579, 3737–3743. [Google Scholar] [CrossRef] [PubMed]
  48. Zhao, Z.; Assmann, S.M. The glycolytic enzyme, phosphoglycerate mutase, has critical roles in stomatal movement, vegetative growth, and pollen production in Arabidopsis thaliana. J. Exp. Bot. 2011, 62, 5179–5189. [Google Scholar] [CrossRef] [PubMed]
  49. Lin, Z.; Li, Q.; Yin, Q.; Wang, J.; Zhang, B.; Gan, S.; Wu, A.-M. Identification of novel miRNAs and their target genes in Eucalyptus grandis. Tree Genet. Genomes 2018, 14, 1–9. [Google Scholar] [CrossRef]
  50. Costacurta, A.; Vanderleyden, J. Synthesis of phytohormones by plant-associated bacteria. Crit. Rev. Microbiol. 1995, 21, 1–18. [Google Scholar] [CrossRef]
  51. Zhou, H.-W.; Ben-Arie, R.; Lurie, S. Pectin esterase, polygalacturonase and gel formation in peach pectin fractions. Phytochemistry 2000, 55, 191–195. [Google Scholar] [CrossRef]
Figure 1. Variation in the ratio of white veins in Primulina serrulata leaves. (A) Bright and distinct white veins in the natural habitat; (B) few, indistinct white veins in the natural habitat; (C) compared seedling leaves grown in the laboratory.
Horticulturae 10 00019 g001
Figure 2. Chl a and Chl b contents in the WV and control groups.
Horticulturae 10 00019 g002
Figure 3. Gene Ontology annotation of the total proteins. (a) Bar chart of Biological Process categories; (b) Bar chart of Cellular Component categories; (c) Bar chart of Molecular Function categories.
Horticulturae 10 00019 g003
Figure 4. Volcano plot of the DEPs between the WV plants and the control. Red: upregulated DEPs; blue: downregulated DEPs; grey: no significant difference.
Horticulturae 10 00019 g004
Figure 5. Bar chart of the GO-BP enrichment results.
Horticulturae 10 00019 g005
Figure 6. Bar chart of GO-CC enrichment analysis.
Horticulturae 10 00019 g006
Figure 7. Bar chart of the GO-MF enrichment results.
Horticulturae 10 00019 g007
Figure 8. Bubble chart of the KEGG enrichment results.
Horticulturae 10 00019 g008
Figure 9. Protein interaction network in Primulina serrulata leaves. Different colored lines between the proteins indicate ofdifferent interactions.
Horticulturae 10 00019 g009
Figure 10. Top view of the white vein of Primulina serrulata. (A) White area; (B) green area.
Horticulturae 10 00019 g010
Disclaimer/Publisher’s Note: The statements, opinions and data contained in all publications are solely those of the individual author(s) and contributor(s) and not of MDPI and/or the editor(s). MDPI and/or the editor(s) disclaim responsibility for any injury to people or property resulting from any ideas, methods, instructions or products referred to in the content.

