Article

Strategies for Recovery, Purification and Quantification of Torularhodin Produced by Rhodotorula mucilaginosa Using Different Carbon Sources

1
Faculty of Food Science and Engineering, Kunming University of Science and Technology, Kunming 650500, China
2
Yunnan Engineering Research Center for Fruit & Vegetable Products, Kunming 650500, China
3
International Green Food Processing Research and Development Center of Kunming City, Kunming 650500, China
*
Author to whom correspondence should be addressed.
Fermentation 2023, 9(9), 846; https://doi.org/10.3390/fermentation9090846
Submission received: 5 August 2023 / Revised: 11 September 2023 / Accepted: 12 September 2023 / Published: 15 September 2023
(This article belongs to the Special Issue Yeast for the Production of Biochemicals and Biofuels)

Abstract

:
Torularhodin is a fungus-derived carotenoid, and the lack of downstream processing of torularhodin is still a challenge for its large-scale production. To support the industrial production of torularhodin, this work initially evaluated the efficiency of carotenoid release from Rhodotorula mucilaginosa using thermal acid treatment, saponification and ultrasound-assisted enzymatic lysis. Based on the polarity, torularhodin was then purified using methanol/acetone/hexane (2/2/1, v/v/v) solution eluting from a silica cartridge. Thermal acid treatment was considered the most appropriate method for total carotenoid release and torularhodin recovery. The highest carotenoid content was 121.3 ± 7.0 μg/g dry cell weight and 63.0 ± 6.1% of torularhodin (50.5 ± 3.0 μg/g dry cell weight in total) was recovered after purification. To fast quantify the content of torularhodin extracted from yeast, the absorption coefficient ( E 1 c m 1 % = 3342) of torularhodin dissolved in chloroform was assayed. With the developed strategy for torularhodin recovery, purification and quantification, the potential of this yeast to produce torularhodin using xylose and glycerol was further evaluated. It was found that carbon sources may influence the proportion of carotenoids in this yeast, but torularhodin was still the dominant pigment. The results obtained in this study identified the feasibility of sustainable production of torularhodin from Rhodotorula mucilaginosa with high efficiency and purity.

Graphical Abstract

1. Introduction

Carotenoids are important natural isoprenoid pigments. Due to appealing colors and bioactivities, carotenoids have been widely utilized in cosmetic, medical and food industries. The estimated global market for carotenoids could reach USD 2.0 billion in 2026 [1]. There are more than 700 different types of carotenoids, and they can be naturally synthesized by plants, bacteria and fungi [2]. Although many carotenoids can be synthesized artificially, the safety concerns and negative assessments of synthetic pigments from consumers have led to a great interest in natural colorants [3]. It has been suggested that synthetic pigments may cause such adverse toxicological effects as allergic and carcinogenic effects, while natural carotenoids may be healthier and exhibit stronger antioxidant activity [4]. For instance, compared with synthetic astaxanthin, natural astaxanthin is 50 times stronger in singlet oxygen quenching and 20 times stronger in neutralizing free radicals [5]. Therefore, carotenoids from natural sources, especially microbial sources, have attracted increasing attentions, as their production is not affected by season, location or climate variations [6].
Rhodotorula species have been regarded as potential natural carotenoid producers. The major pigments produced by these microorganisms include torularhodin, torulene, γ-carotene and β-carotene [7]. Torularhodin is a unique carotenoid among others, as it has a long carbon chain skeleton rich in conjugated double bonds and a terminal carboxylic group (Figure 1), which is considered to possess stronger antioxidant activity than that of lycopene and β-carotene [8,9]. Studies previously reported that torularhodin also exhibits a wide range of biological activities, including anti-inflammatory and antibacterial activity, liver protection and anticancer activity [10]. Nevertheless, only fungi are able to produce torularhodin, and it is an intracellular product of yeasts. The rigid yeast cell wall and a mixture of several carotenoids in yeast result in difficulties extracting and purifying torularhodin effectively [6]. Thus, development of appropriate cell disruption methods and purification technologies is the key to large-scale production of torularhodin.
Organic solvent extraction is the most common, simplest and easiest method for laboratory and small-scale carotenoid extraction applications [11]. However, these methods usually take a long time and require a large number of organic solvents [12]. Therefore, various alternative technologies such as thermal acid treatment, saponification and ultrasound-assisted enzymatic lysis have been developed. Liu et al. [12] compared several cell wall disruption methods and found that the efficiency of HCl treatment was the most effective one and the astaxanthin recovery from Haematococcus pluvialis was more than 80%. It was also reported that alcoholic saponification resulted in a higher carotenoid and lipid recovery yield from Rhodosporidium toruloides [1]. Furthermore, Michelon et al. [13] noted that the extractability of carotenoids in Phaffia rhodozyma increased by 12% using ultrasound-assisted enzymatic lysis compared with that without ultrasound. However, most of these techniques are applied in total carotenoid recovery from yeast; there are scant studies on single carotenoid purification, especially for torularhodin. Purified single carotenoid may possess a higher value and have wider industrial applications. Due to differences in polarity, carotenoids from Rhodotorula can be separated using different organic solvent elution. Generally, such nonpolar solvents as hexane and petroleum ether are good choices for the elution of nonpolar carotenoids, while polar solvents such as acetone, ethanol and ethyl acetate are more suitable for the elution of polar carotenoids [14]. Therefore, it is possible to develop a simple and effective strategy to extract and separate torularhodin from yeasts for an industrial utilization.
In addition, the use of cheap, nonedible and renewable carbon sources for strain cultivation is also crucial for microbial carotenoid production on a large scale. The yeast Rhodotorula mucilaginosa has been proven able to use glucose, galactose, sucrose, xylose and glycerol for propagation [15]. Xylose, a pentose, together with glucose, is the essential component of lignocellulosic feedstocks. Lignocellulosic biomass can be obtained from nonedible agricultural and forest residues, as well as herbaceous materials and urban wastes, and it is also one of the most abundant renewable resources on the planet [16]. Glycerol is the byproduct of biodiesel production, and this waste can also be used as a low-cost substrate for the production of high-value products [17]. Effective utilization of industrial byproducts as alternative nutrient sources through microbial carotenoid production processes can minimize production costs.
In present work, the effectiveness of thermal acid treatment, saponification and ultrasound-assisted enzymatic lysis for the cell disruption of R. mucilaginosa was initially compared and a suitable method for the recovery and purification of torularhodin was further developed. Then, a rapid assay for torularhodin quantification was also proposed. After that, the developed strategy was applied to extract, purify and quantify torularhodin accumulated by R. mucilaginosa using xylose and glycerol as the sole carbon sources. The completion of this study could provide supports for microbial torularhodin production in a sustainable way.

2. Materials and Methods

2.1. Microorganism Cultivation

The used strain, Rhodotorula mucilaginosa I2002, was isolated from a fermented steamed bread in Yunnan province, China. It was identified by morphological, physiological characteristics and ITS rDNA gene sequence blasting with R. mucilaginosa strains in NCBI GenBank (similarity 99.8%). When cultivated on yeast extract peptone dextrose (YPD) agar plates (containing 10 g/L yeast extract, 20 g/L peptone, 20 g/L glucose and 20 g/L agar), the colony of this strain was orange-red in color, with a bright surface, soft and sticky texture. There was no obvious change in medium color and no exudate. The strain is preserved in 40% of glycerol at −80 °C in the strain collection of Kunming University of Science and Technology.
For experiments, yeast strain was maintained in YPD agar plates at 4 °C and transferred to fresh plates once a month. In the pre-cultivation step, one loop of yeast cells was inoculated into 250 mL Erlenmeyer flasks containing 100 mL of YPD medium at 30 °C, 210 rpm for 72 h. After that, cells were collected by centrifugation at 2772× g for 5 min and transferred to the synthetic media with an inoculum concentration of 1 g/L dry weight cells. The synthetic media were initially composed of 50 g/L glucose, xylose or glycerol as the sole carbon source, 1.7 g/L yeast nitrogen base without amino acids and ammonium sulfate (Y1251, Sigma-Aldrich, St. Louis, MO, USA). As red yeasts can accumulate more carotenoids under nitrogen-limited conditions [18], different amount of ammonium sulfate as nitrogen source was supplemented to reach a carbon-to-nitrogen (C/N) molar ratio of around 200 according to Tao et al. [19].
To evaluate the carotenoid accumulation ability of this strain, yeast was cultivated in synthetic media with different carbon sources previously described. All flasks were incubated at 30 °C, 210 rpm. After 96 h fermentation, cells were harvested by centrifugation (2772× g, 5 min) and washed twice with distilled water. After that, the cell pellets were lyophilized in a freeze dryer (SCIENTZ-10N, Ningbo Scientz Biotechnology Co., Ltd., Ningbo, China) and stored in the dark at −40 °C for further treatments. The biomass of yeast cells was determined gravimetrically after drying at 60 °C to a constant weight (approx. 24 h).

2.2. Characterization of Yeast Cells

Total carbohydrates in yeast cells were quantified as described by Postma et al. [20]. For total protein content on a dry weight basis, 2.5 mg of freeze-dried yeast cells were resuspended in 1 mL of 0.4 mol/L NaOH and incubated in a boiling water bath for 60 min. The protein content in the supernatant was examined using an Enhanced BCA Protein Assay Kit (Beyotime, Shanghai, China).
For total lipid quantification, freeze-dried cells (approx. 200 mg) were mixed in the flask with 100 mg pyrogallic acid, 2 mL 95% ethanol and 10 mL HCl and hydrolyzed at 70–80 °C for 40 min. Then, 10 mL of 95% ethanol and 50 mL of diethyl ether/petroleum ether (1/1, v/v) were added to the sample, shaken for 5 min and separated using a liquid-liquid extraction funnel. Lipids were extracted 3 times; the ether phases were collected and dried with rotary evaporation. The extracts were saponified by heating at 85 °C for 30 min in 2 mL of 2% methanolic NaOH. After that, 3 mL of 14% methanolic boron trifluoride was added for further heating at the same temperature for 30 min for esterification. After cooling to room temperature, the sample was added with 1 mL n-hexane and vortexed for 2 min. When a phase separation was observed (approx. 1 h), 100 μL of the supernatant hexane phase was withdrawn, diluted to 1 mL with n-hexane, and filtered through a 0.45 μm filter.
Fatty acid analysis was performed on a gas chromatograph system (Agilent 7890A, Agilent Technologies, Santa Clara, CA, USA) equipped with a TG-FAME (50 m × 0.25 mm × 0.2 μm, Thermo Fisher Scientific, Cleveland, OH, USA) capillary column. Nitrogen gas was used as the carrier at a flow rate of 0.63 mL/min. The temperature program was as follows: first maintained at 80 °C for 1 min, and increased to 160 °C kept for 1.5 min at a speed of 20 °C/min; for the second stage, the column temperature further increased to 250 °C at a speed of 3 °C/min and kept at 250 °C for 3 min. The flame ionization detector temperature was set at 280 °C. The injector was set at 270 °C with a split ratio of 100:1. The fatty acid compositions of samples were identified as the peak areas relative to the retention times of the Supelco 37 Component FAME Mix (Sigma-Aldrich, Shanghai, China).

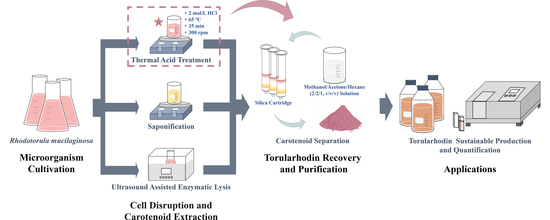
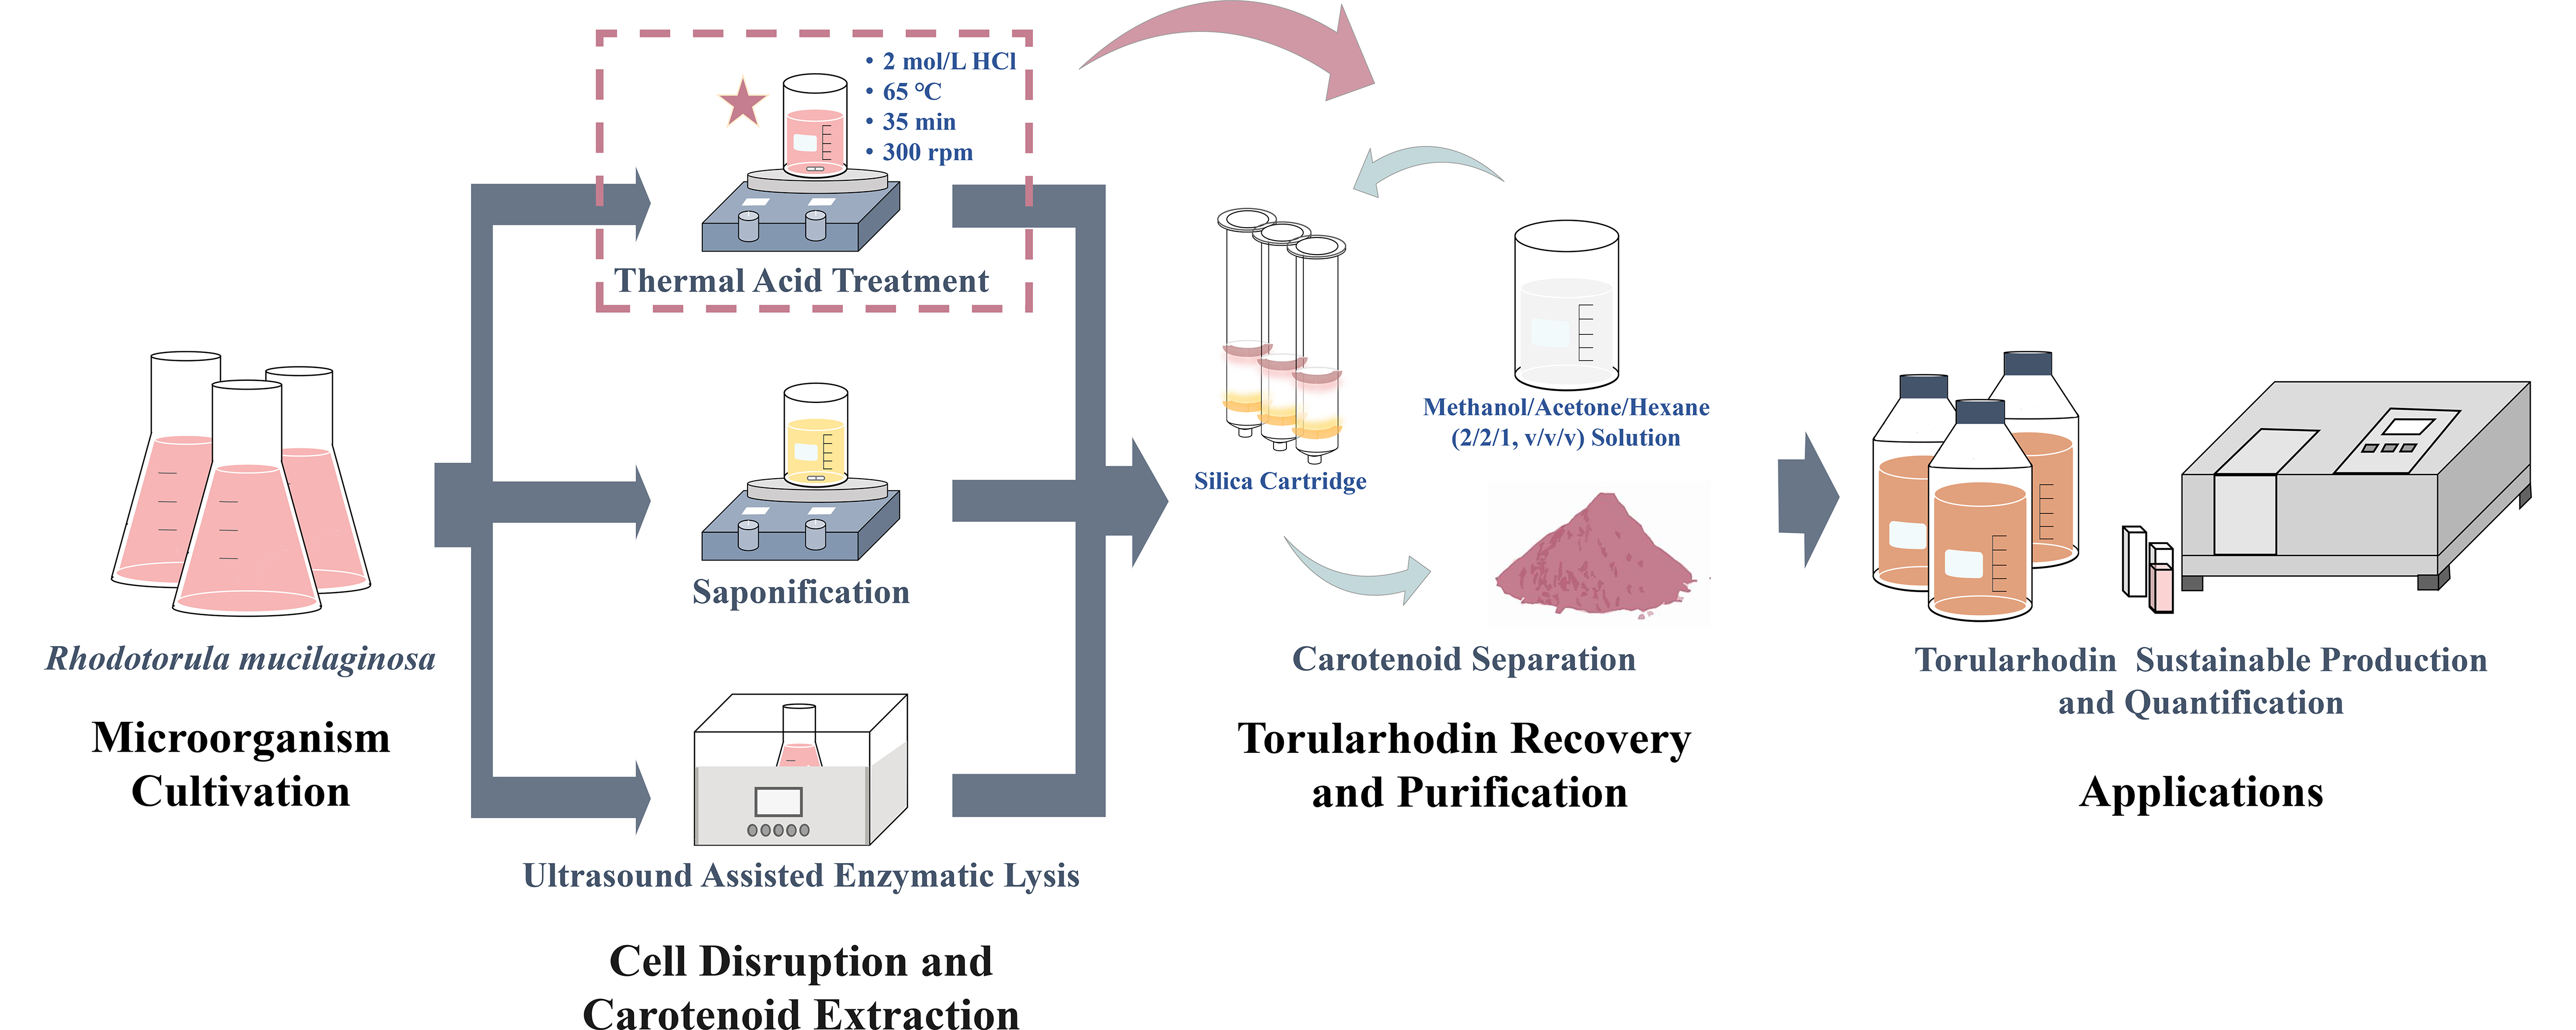
2.3. Cell Disruption and Carotenoid Extraction

2.3.1. Sample Preparation

Before treated with different cell disruption methods, the freeze-dried yeast cells were mixed with distilled water to get wet and then collected by centrifugation (2772× g, 20 min). All the operations were performed under subdued light to avoid pigment degradation.

2.3.2. Thermal Acid Treatment

Thermal acid treatment was performed according to Xiao et al. [21] with minor modifications. Briefly, yeast cells were resuspended in 2 mol/L HCl to reach a cell density of around 10 g/L and stirred at 65 °C for 35 min (300 rpm). After that, the samples were quickly placed on ice, and washed with distilled water to remove excess acid. Then, the cell debris was mixed with the absolute ethanol to reach a density of around 10 g/L and fully vortexed. Later, the same volume of distilled water and n-hexane was added to extract carotenoids (n-hexane and some certain low-toxic organic solvents have been approved to be used in the pharmaceutical industries by the Food and Drug Administration [22,23]). After vortex and centrifugation (2772× g, 5 min), the n-hexane phase (up layer) containing pigments was transferred into a new tube, and the extraction was repeated until the cell debris became entirely colorless. The crude carotenoid extracts were dried under N2 gas flow and used for further isolation.

2.3.3. Saponification

The saponification processing of yeast cells was conducted in accordance with Liu et al. [1]. The wet cells were saponified with 1.1 mol/L KOH in ethanol to reach a cell density of around 10 g/L and stirred at 65 °C for 3 h (300 rpm). The same volume of distilled water and n-hexane was then added to extract carotenoids. After vortex and centrifugation (2772× g, 5 min), the organic phase containing carotenoids was dried under N2 gas flow.

2.3.4. Ultrasound-Assisted Enzymatic Lysis

The ultrasound-assisted enzymatic lysis was performed according to the description of Machado et al. [24] with some modifications. Cells were disrupted with 71.4 U/mL lyticase (Bioss Inc., Beijing, China) in a 1.2 mol/L sorbitol phosphate buffer, which was prepared with 0.1 mol/L disodium hydrogen phosphate and sodium dihydrogen phosphate. Cells density in buffer was 0.7 g/L. After incubation at 30 °C for 30 min (100 rpm), samples were subjected to an ultrasonic cell disruptor (SB-5200DTD, Ningbo Scientz Biotechnology Co., Ltd., Ningbo, China) for a treatment at 40 kHz for 30 min (360 W). After that, cell debris was collected by 2772× g, 5 min centrifugation and resuspended in distilled water to reach its density of 15 g/L. The same volume of chloroform/methanol (1/1.25, v/v) solution was then added in the suspension and vortexed to extract carotenoids. The following step was centrifugation at 2772× g for 5 min to separate the organic phase (bottom phase) and aqueous phase (top phase). The extraction process was repeated until cell debris became white. Afterward, all the bottom phase solution was combined and dried under N2 atmosphere.

2.4. Carotenoid Separation and Analysis

The crude carotenoid extracts were redissolved in 0.5 mL n-hexane/diethyl ether (7/1, v/v) solution and loaded to a Sep-Pak Silica 6cc Vac cartridge (1 g sorbent per cartridge, 55–105 μm, Waters, Dublin, Ireland) equilibrated with n-hexane previously. Nonpolar carotenoids were firstly eluted out using n-hexane/diethyl ether (7/1, v/v) solution. The polar carotenoids were subsequently eluted out using methanol/acetone/hexane (2/2/1, v/v/v) solution. All fractions were evaporated under N2 gas flow and used for carotenoid analysis.
Total carotenoids, polar and nonpolar carotenoids were solubilized in 1.5 mL acetone containing 0.2% (w/v) BHT (butylated hydroxytoluene) and filtered through 0.45 μm microporous film before injecting. The extracts were analyzed using a HPLC system (Agilent 1260, Agilent Technologies, Santa Clara, CA, USA) equipped with a DAD detector. Carotenoids were separated using a TC-C18 column (250 × 4.6 mm, 5 μm particle size, Agilent, Amstelveen, The Netherlands) maintained at 25 °C. According to Li et al. [25], mobile phases A and B consisted of acetonitrile/H2O (9/1, v/v) and ethyl acetate, respectively. The gradient elution was as follows (1 mL/min): a 6 min linear gradient from 20% B to 60% B, a 9 min hold at 60% B, a 5 min linear gradient from 60% B to 100% B, a 5 min gradient back to 20% B and kept at 20% B for 5 min. The total run time was 30 min and injection volume was 20 μL. Torularhodin and torulene standards were purchased from CaroteNature (Münsingen, Switzerland); β-carotene and lycopene standards were purchased from Yuanye (Shanghai, China); γ-carotene standard was purchased from Sigma-Aldrich (Buchs, Switzerland). The calibration curve for each carotenoid was acquired at each maximal absorption wavelength (494 nm for torularhodin, 486 nm for torulene, 450 nm for β-carotene and 461 nm for γ-carotene). The carotenoid recovery (%) was calculated by Equation (1). Carotenoids extracted from thermal acid treatment were considered as the total, as the highest release of carotenoids was obtained with this method.
Carotenoid recovery = Carotenoids recovered in each fraction/Total carotenoids in the cell mass × 100%

2.5. Determination of the Absorption Coefficient ( E 1 c m 1 % ) of Torularhodin

Torularhodin standard was dissolved in acetone, chloroform or n-hexane/ethanol (1/1, v/v) solution containing 0.2% (w/v) BHT, respectively, to determine the absorbance of torularhodin in different solvents using UV-Vis spectroscopy (SpectraMax M5; Molecular Device, Sunnyvale, CA, USA). The absorbance of torularhodin in different solvents was measured at each maximum absorbance wavelength at 494 nm for acetone, 514 nm for chloroform and 499 nm for n-hexane/ethanol solution (Figure 2) under three different dilutions. Moreover, polar carotenoids obtained from thermal acid treatment were also solubilized in these three solvents and analyzed using HPLC and UV-Vis spectroscopy to assay the concentration and corresponding absorbance of torularhodin, respectively. All samples were filtrated with 0.45 μm microporous film prior to determination. Based on the Beer–Lambert law, the absorption coefficient ( E 1 c m 1 % ) of torularhodin was calculated according to Equation (2) for each concentration.
E 1 c m 1 %   = A / cl
In this equation, where A represents the absorbance of torularhodin at different concentrations, c is the concentration of torularhodin (g/100 mL) and l indicates the path length (1 cm).

2.6. Statistical Analysis

Results were analyzed using SPSS statistics software (version 25) and all plots were made using Origin 2018 software (Origin Lab Corporation, Northampton, MA, USA). The data were presented as mean ± standard deviation of three independent batches. One-way ANOVA and Tukey’s test were performed at a significance level of 0.05 (p ˂ 0.05) to compare the content and recovery of carotenoids using different cell disruption methods.

3. Results and Discussion

3.1. The Characterization of Yeast Cells

To develop the strategy for torularhodin extraction, purification and quantification, the chemical characterization of R. mucilaginosa cultivated in glucose medium was initially performed. It was found that R. mucilaginosa was composed of 65.7 ± 3.0% of carbohydrates, 22.5 ± 0.4% of proteins and 11.5 ± 0.4% of lipids.
Carbohydrates represent the most abundant components in R. mucilaginosa. This may be a general response of yeast cells to nutrient limitation (nitrogen deficiency) conditions, as a previous study reported that when Saccharomyces cerevisiae cultivated in a medium lacking nitrogen, sulfur or phosphorus, the content of glycogen and trehalose increased [26]. Additionally, the second major compound of yeast biomass, protein, is also considered a valuable recyclable product of yeast cells, as they can be used for animal feeding or as a nutrient source during microbial cultivation [1].
Lipids present in yeast cells are energy storage units (cytoplasmic droplets, mainly triglycerides) and structural components (cell membranes, mainly phospholipids) [27]. Rhodotorula genus has been considered as an oleaginous yeast for microbial oil production [7]. The fatty acid composition of this strain was therefore quantified. However, a different result was obtained and only around 11% of cell mass in this yeast comprised lipids. This could be due to the differences in strains. As shown in Table S1, oleic acid (C18:1n9c) was the dominant fatty acid in this strain (79.7 ± 0.1% of total lipids), reaching 92.0 ± 3.1 mg/g dry cell weight, followed by palmitic acid (C16:0) (9.6 ± 0.1% of total lipids) and linoleic acid (C18:2n6c) (4.5 ± 0.1% of total lipids). Similarly, oleic and palmitic acid were found to be the most abundant fatty acids presented in Rhodotorurla genus [28,29]. These two fatty acids have been reported as ideal alternatives for biodiesel production [30].

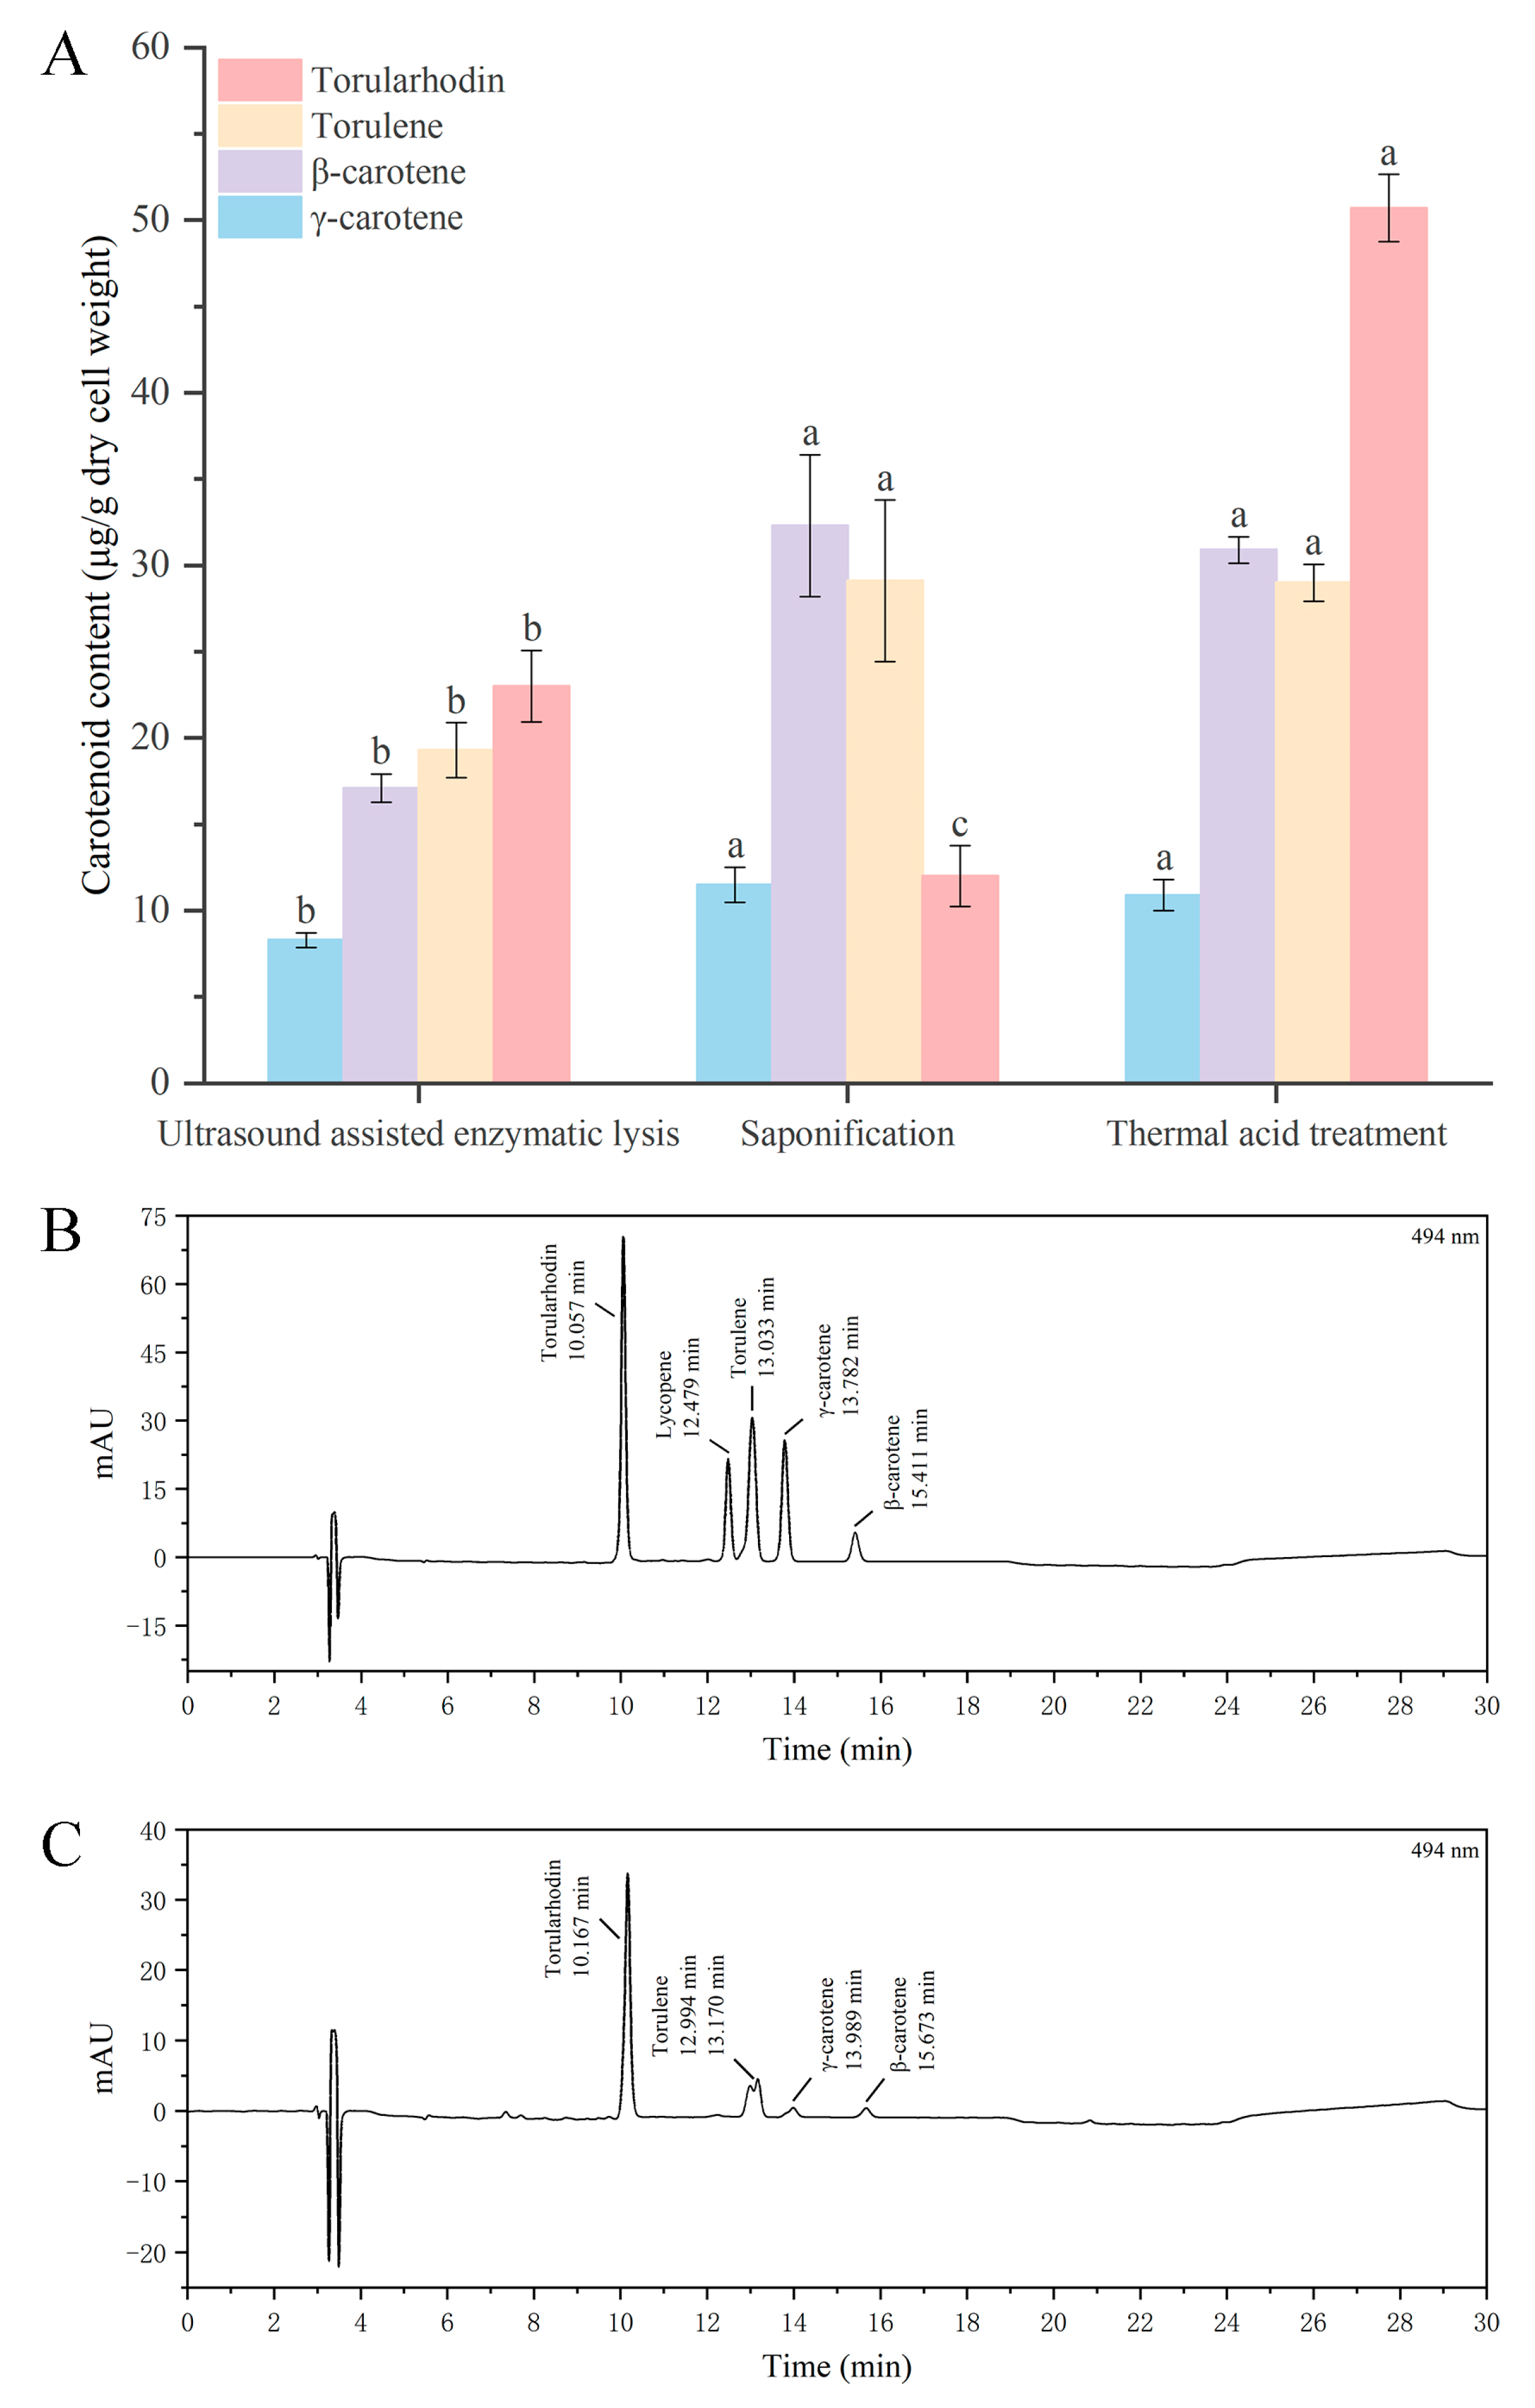
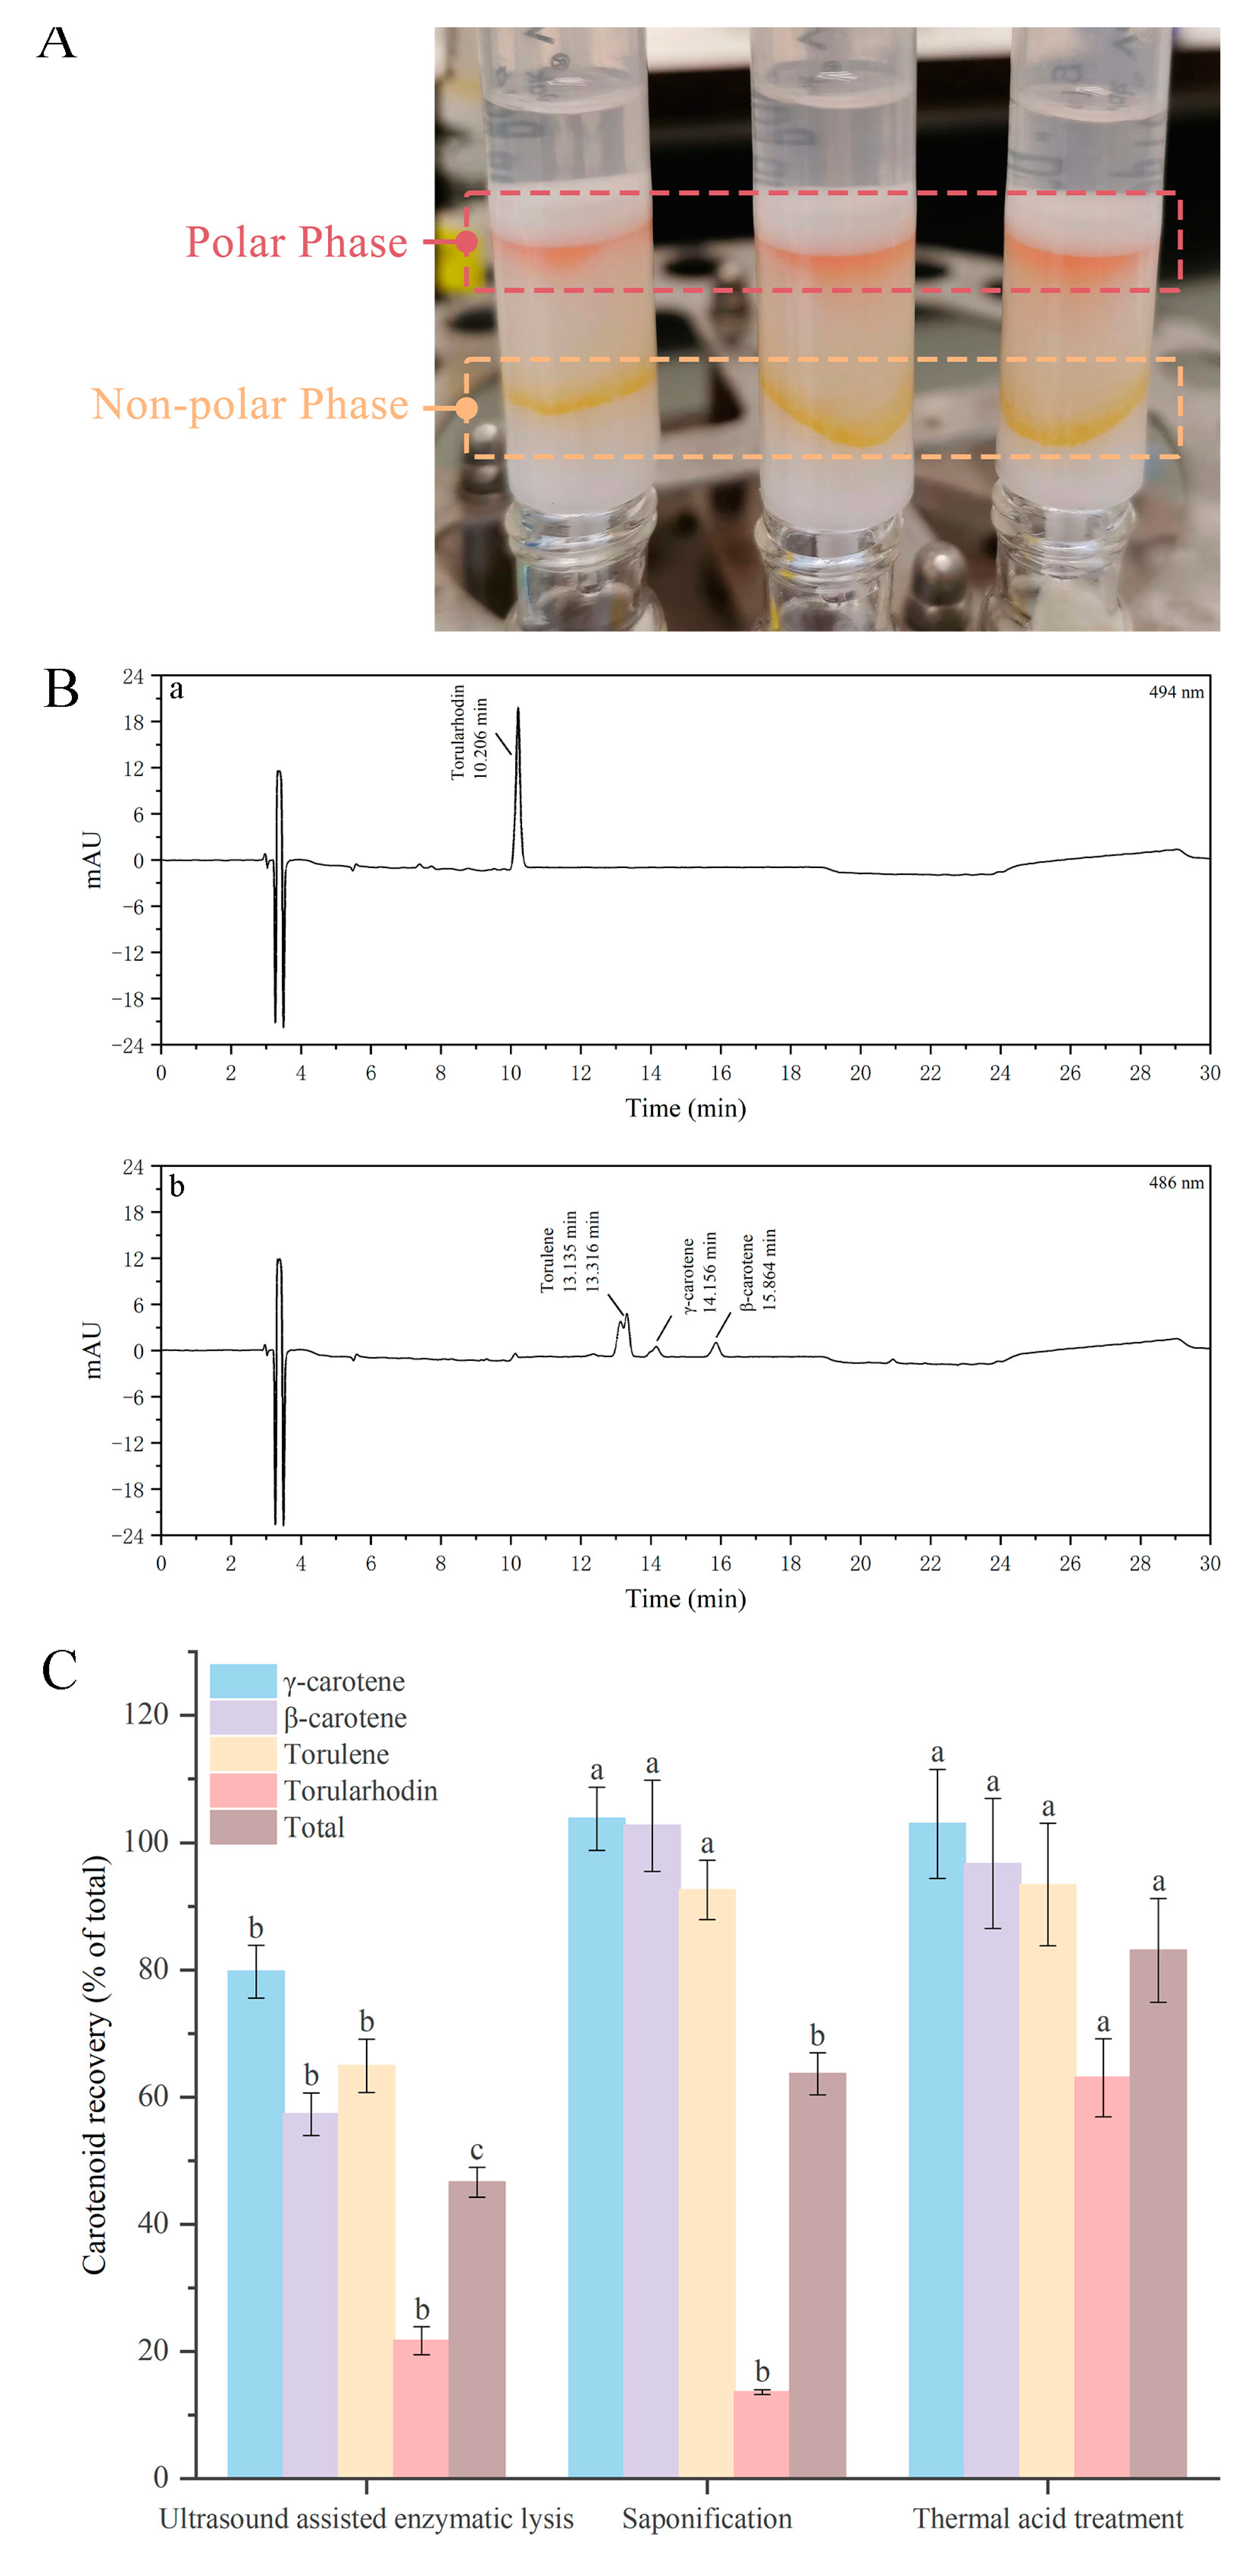
3.2. Effect of Different Cell Disruption Techniques on Release of Carotenoids

Carotenoids found in Rhodotorula genus include β-carotene, γ-carotene, torulene and torularhodin [31]. The proportion of carotenoids in red yeast largely depends on species and yeast cultivation conditions. For example, a study on Brazilian yeast showed that torularhodin was the third most abundant carotenoid in R. mucilaginosa, but it was not detected in R. graminis and R. minuta, after 5 days of cultivation in YM broth [32]. According to Frengova et al. [33], the fermentation temperatures also affected the proportion of carotenoids in R. glutinis.
Carotenoids are distributed as a mixture in the lipid droplets of yeast and cell disruption is therefore a necessary step for pigment release [1]. In this study, thermal acid treatment, saponification and ultrasound-assisted enzymatic lysis were employed to disrupt yeast cells and for carotenoid characterization. As illustrated in Figure 3A, cell disruption methods had significant effects on carotenoid recovery in yeast cells. Thermal acid treatment was the most effective technology for carotenoid release in this yeast. A total of 121.3 ± 7.0 μg/g dry cell weight carotenoids were obtained using this method. The following one was saponification, resulting in 84.9 ± 11.0 μg/g dry cell weight carotenoid release. In contrast, ultrasound-assisted enzymatic lysis was the least effective approach for carotenoid release in this case; 68.1 ± 7.0 μg/g dry cell weight carotenoids were released using this technology. As a result, carotenoids in yeast cells ranged from 0.7 ± 0.1‱ to 1.2 ± 0.1‱ of dry cell mass with different cell disrupt methods. Although the total carotenoid content was relatively low in cell mass, it has been reported that only accounting for 1% of cell mass, microbial carotenoids may have commercial potential [34], as this strain possesses a higher carbohydrate content in cells, and these carbohydrates, including glucan, mannan and chitin, are important components of the yeast cell wall [35]. These compounds are sensitive to acidic conditions, as acids effectively cause degradation in polymer glucosidic chains [36]. Thermal acid treatment therefore resulted in a higher efficiency of cell disruption in this yeast. Enzymatic lysis is normally considered as a mild technology to release bioactive compounds from microorganisms. Therefore, the enzymatic hydrolysis disruption method is less effective, resulting in a lower carotenoid release. Moreover, acoustic cavitation caused during the ultrasonic process may contribute to the accumulation of radicals and lead to the consuming of antioxidant compounds (carotenoids) [14,37].
It was worthy to note that cell disruption technologies also yield a dramatic effect on single carotenoid release. The highest torularhodin release (50.5 ± 3.0 μg/g dry cell weight) was obtained using thermal acid treatment. Conversely, only 12.0 ± 2.0 μg/g dry cell weight torularhodin released when saponification cell disruption was adopted. However, there were no significant differences (p ˂ 0.05) in other carotenoid contents between thermal acid treatment and saponification. It was widely accepted that carotenoids are more stable in alkaline conditions [38]. Nevertheless, torularhodin is a unique carotenoid with a carboxyl; the hydrogen ions can be replaced and neutralized by the KOH present in the saponification solution, resulting in the change in and loss of torularhodin. Nagaraj et al. [7] also reported that torularhodin was considerably affected by saponification, since there was a significant decrease in the concentration of torularhodin standard after saponification. In addition, it is worth noting that there were usually two incompletely separated peaks present in the chromatogram of torulene (Figure 3C). This may be due to the existence of torulene isomers. According to the spectrum obtained using the DAD detector, the first peak observed obvious absorption at 380 nm (Figure S3A), which was reported to be the characteristic cis-peak of torulene [3,32], but no such characterization absorption was found in the subsequent peak (Figure S3B), suggesting that it was a trans isomer. Meanwhile, Squina and Mercadante [39] also found that the cis isomer of torulene extracted from 5 Rhodotorula strains had a peak at 378 nm. Thus, torulene in R. mucilaginosa may consist of a common trans isomer and a cis isomer.
To conclude, thermal acid treatment was the most suitable method for releasing carotenoids produced by R. mucilaginosa. The highest carotenoid and torularhodin releases were obtained with this method. In addition, this method is low cost and easy to scale up. Therefore, carotenoids released using thermal acid treatment was considered as the total carotenoids to calculate the recovery of each carotenoid in further study.

3.3. Effect of Different Cell Disruption Techniques on the Recovery of Torularhodin
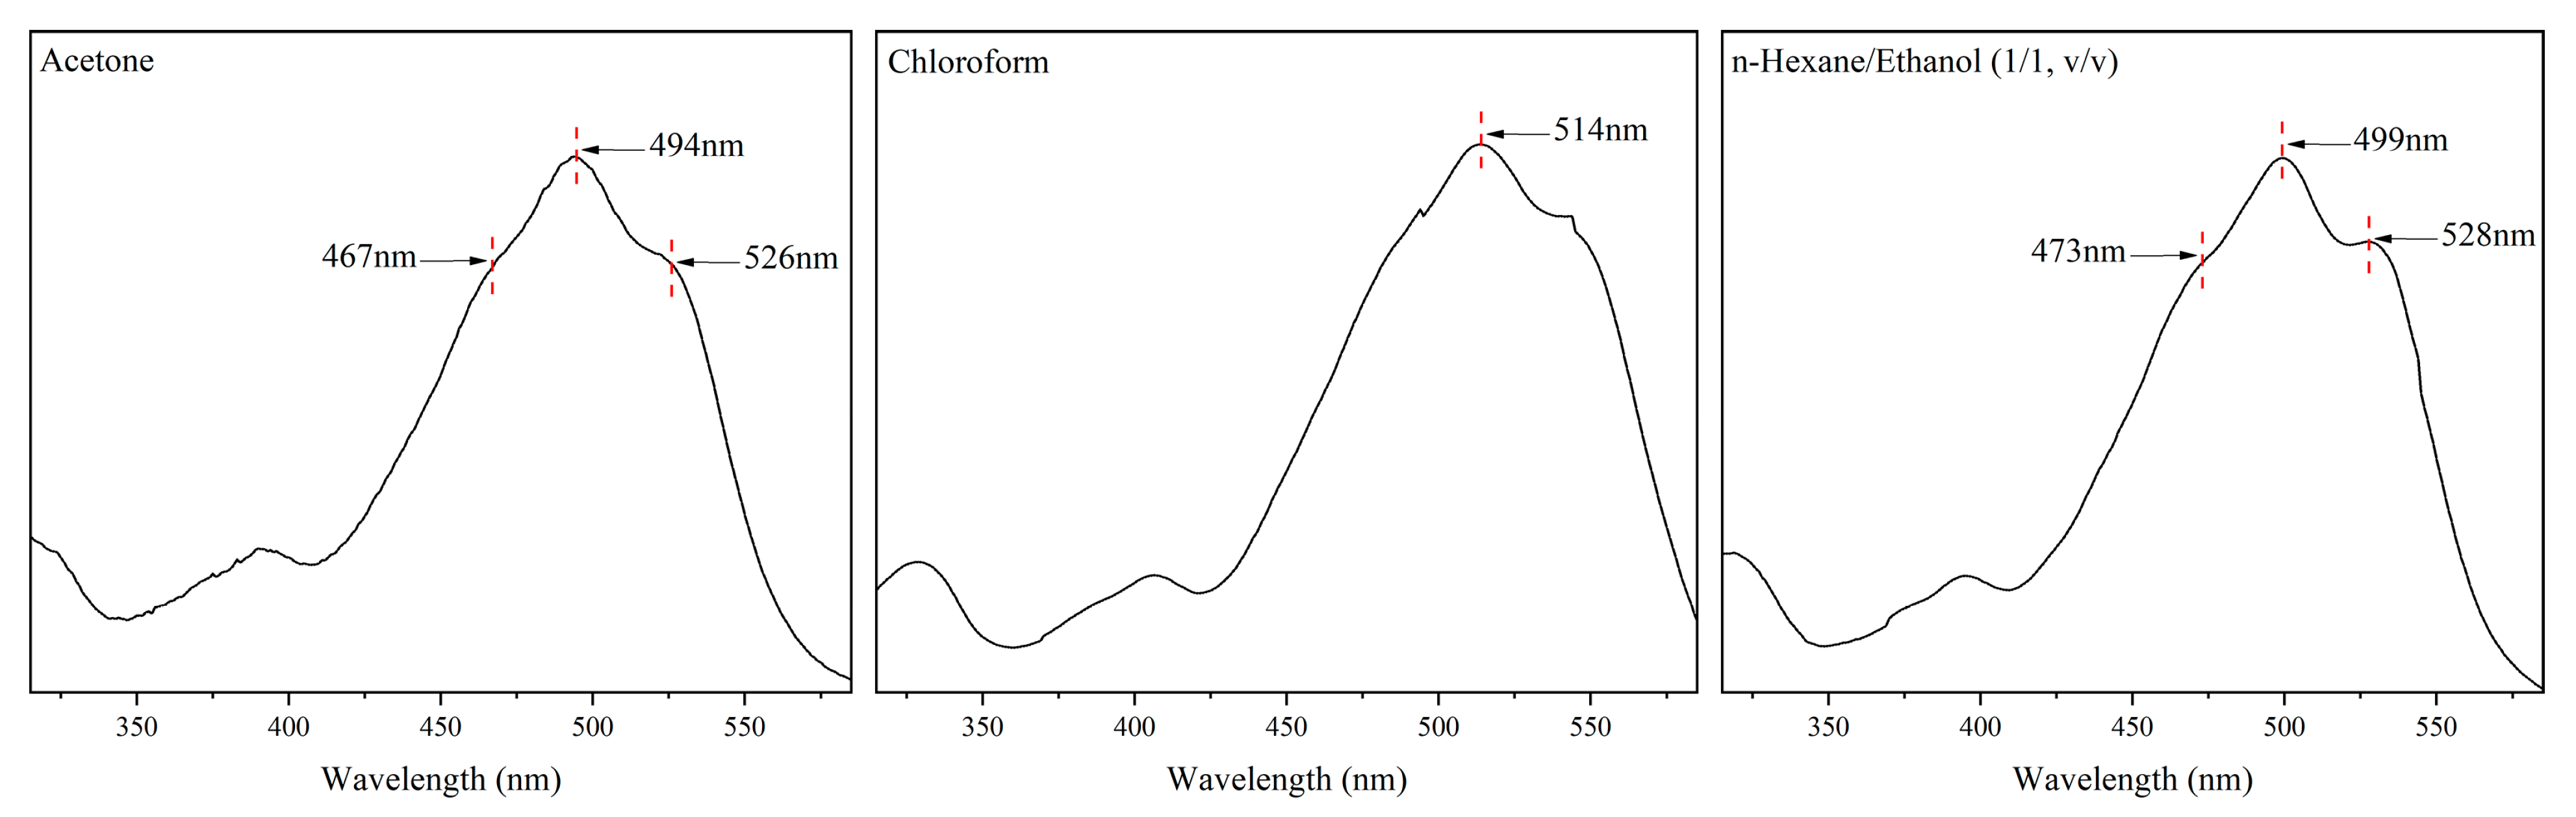
Due to differences in polarity, carotenoids extracted from R. mucilaginosa can be separated using a solid-phase extraction cartridge eluted with different solvents (Figure 4A). As shown in Figure 4B, the pink to red pigment eluted out using the polar solvent (mixture solution of methanol, acetone and n-hexane) was identified as torularhodin. The yellow to orange compounds eluted out using the nonpolar solvent (mixture solution of n-hexane and diethyl ether) were identified as torulene, γ-carotene and β-carotene. Similarly, Mussagy et al. [40] found that torularhodin had higher polarity than torulene and β-carotene; torularhodin can therefore be eluted out using polar solvents.
As shown in Figure 4C, almost all β-carotene, γ-carotene, torulene was recovered after cartridge separation. However, the content of torularhodin decreased significantly; the recovery of torularhodin using thermal acid treatment, saponification and ultrasound-assisted enzymatic lysis were 63.0 ± 6.1%, 13.6 ± 0.4% and 21.7 ± 2.2%, respectively. Among these cell disruption methods, saponification was a special one, as it can separate lipids and carotenoids from yeast cells [1] and provided a considerable recovery efficiency for γ-carotene (103.7 ± 4.9%), β-carotene (102.6 ± 7.1%) and torulene (92.6 ± 4.7%). Similarly, a previous study found that saponification only reduced the concentrations of β-carotene and γ-carotene standards by 14% and 7%, respectively [7]. However, saponification process resulted in a significant loss in torularhodin and the recovery efficiency of torularhodin was only 13.6 ± 0.4%. As mentioned earlier, saponification may lead to a change in and loss of torularhodin. There was an unidentified peak found in the HPLC chromatogram of samples treated using saponification (Figure S1). This peak was eluted out together with torularhodin in the polar phase and present in front of torularhodin, indicating that the torularhodin neutralized by KOH and converted into potassium salt. As the elution order of carotenoids in an octadecyl bonded silica phase is consistent with their polarity [41], the potassium salt of torularhodin possess a higher polarity than itself. It is strongly suggested that saponification was not suitable for the recovery of torularhodin. As discussed earlier, due to less effective in carotenoid release, ultrasound-assisted enzymatic lysis showed low carotenoid recovery efficiency. The total carotenoid recovery was as low as 46.6 ± 2.4%. Therefore, thermal acid treatment is optimal for torularhodin recovery, and the saponification process is better for the separation of lipids and other carotenoids in yeast.

3.4. Absorption Coefficient ( E 1 c m 1 % ) of Torularhodin in Different Solvents

Absorption coefficient ( E 1 c m 1 % ) is usually employed to quickly quantify a substance with light absorption properties. Selecting the appropriate solvents is critical to dissolve, extract and quantify carotenoids. Acetone, chloroform and n-hexane/ethanol are the most frequently used solvents for carotenoid extraction [14]. To develop a rapid method for torularhodin quantification after separation, torularhodin standard and extracted torularhodin were dissolved in the above solvents to determine its E 1 c m 1 % , respectively. According to Figure 2, it was found that the UV-Vis absorption spectra of torularhodin varied with the solvent used. The maximum absorption of torularhodin in acetone was at 494 nm, which was similar to that in the mixture solvent of n-hexane/ethanol (1/1, v/v), but was different from that in chloroform.
Similarly, as shown in Table 1, the E 1 c m 1 % of torularhodin differed from the applied solvents. However, the E 1 c m 1 % of extracted torularhodin in different solvents were much higher than those of standards. This may be due to the presence of other compounds in extracted torularhodin, affecting the absorbance of samples. Another study also reported that carotenoid content measured by spectroscopy were higher than HPLC [2,7]. Furthermore, the E 1 c m 1 % of torularhodin is related to the solvent properties. The polarity of these four solvents is ethanol > acetone > chloroform > n-hexane. Torularhodin is a polar carotenoid, and its polarity might be close to that of chloroform; a more stable E 1 c m 1 % was detected when torularhodin was dissolved in chloroform. Therefore, chloroform can be used as a solvent to dissolve torularhodin extracted and purified from yeast cells for spectroscopy rapid quantification.

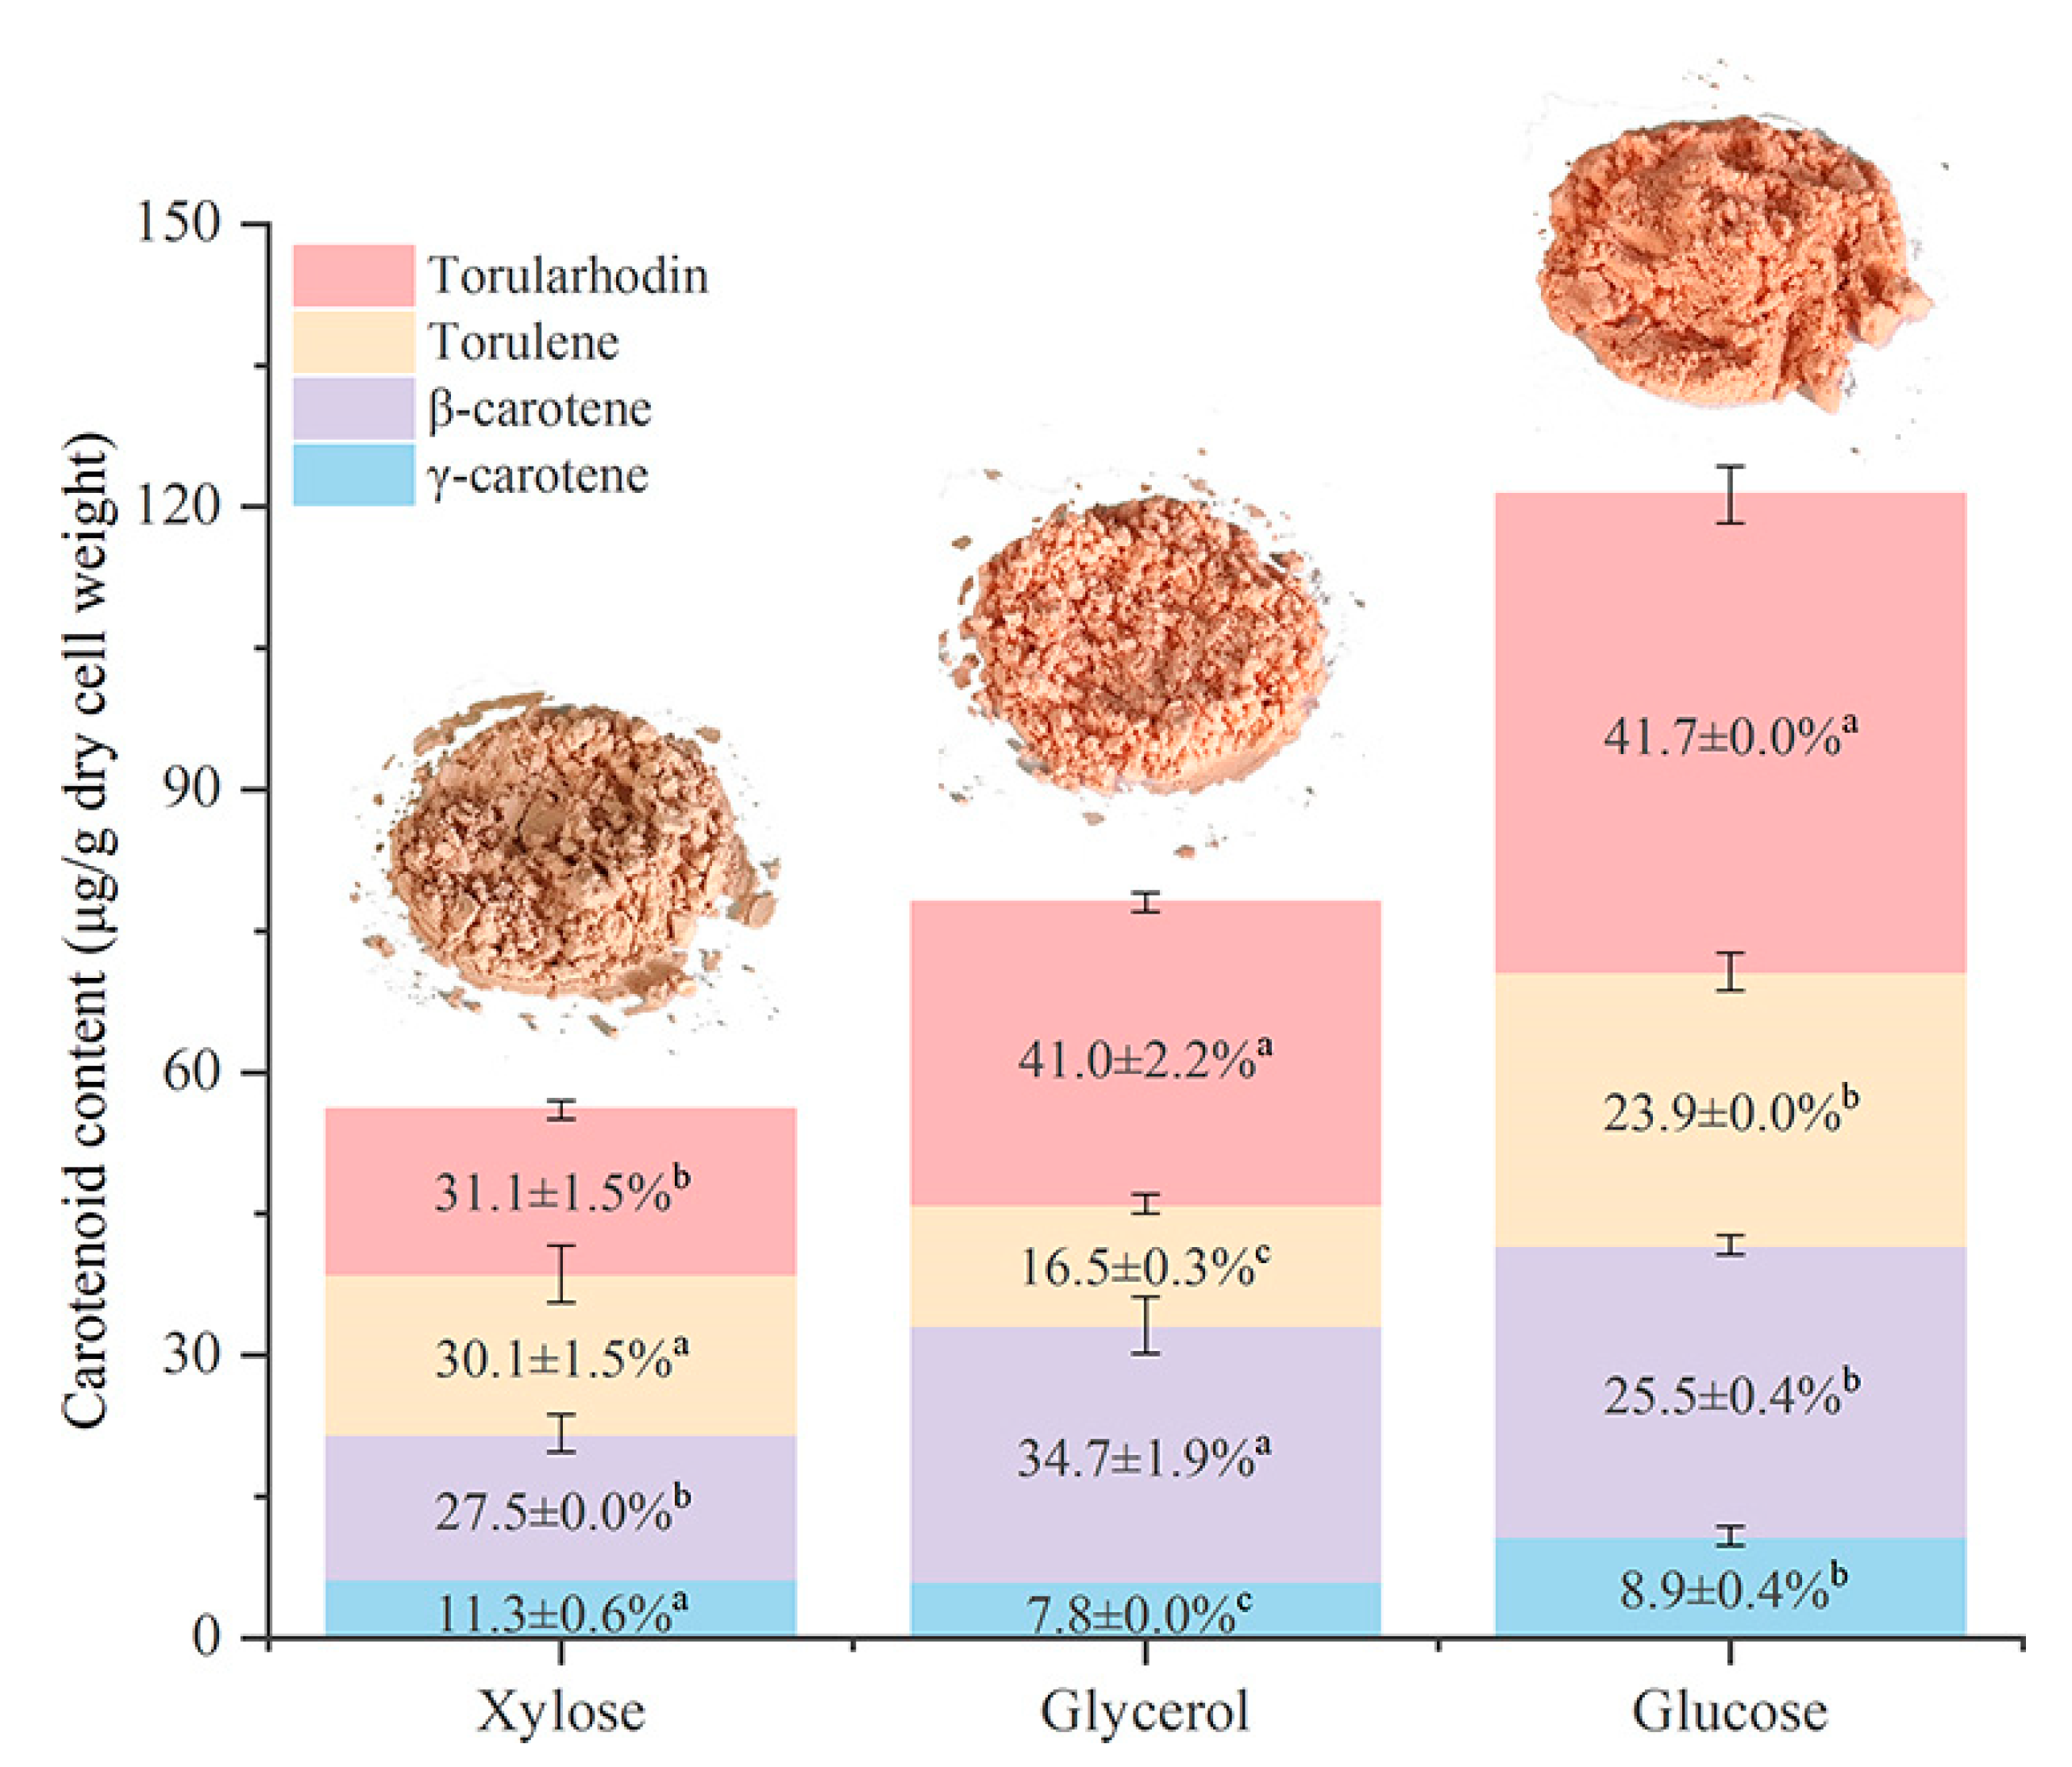
3.5. Effect of Different Carbon Sources on Carotenoid Production by R. mucilaginosa

Except from effective strategies for torularhodin extraction and purification, the utilization of low cost and alternative carbon sources for microbial torularhodin production is also essential for sustainable processing. It has been proven that R. mucilaginosa was able to use glucose, galactose, sucrose, xylose and glycerol for growth [15]. In this study, xylose and glycerol were used as the single carbon source to cultivate R. mucilaginosa and evaluate the efficiency of this strain for torularhodin production in comparison with a control glucose medium.
Results showed that R. mucilaginosa could metabolize both xylose and glycerol for cell growth, but its growth performance was better when glucose was used as a media (Table S2). After 96 h fermentation, the highest biomass of 4.7 ± 0.3 g/L was achieved in glucose medium, followed by glycerol medium (2.4 ± 0.1 g/L) and xylose medium (1.9 ± 0.1 g/L). Correspondingly, the concentration of total carotenoids (566.6 ± 31.0 μg/L) obtained in glucose medium was also higher, while only 185.5 ± 7.0 μg/L and 104.9 ± 10.0 μg/L were detected in glycerol and xylose medium after thermal acid treatment and extraction, respectively.
According to Figure 5, in terms of carotenoid accumulation ability of yeast cultivated in different mediums, it was found that the total carotenoid production was higher in glucose medium (121.3 ± 7.0 μg/g dry cell weight) compared to glycerol medium (78.1 ± 3.0 μg/g dry cell weight) and xylose medium (56.0 ± 6.0 μg/g dry cell weight). Moreover, the accumulation of each carotenoid in glucose medium was also superior to those obtained in xylose and glycerol. It was worthy to note that torularhodin was the most abundant carotenoid in this yeast using different carbon sources. The accumulation of torularhodin reached up to 50.5 ± 3.0 μg/g dry cell weight (41.7 ± 0.0% of total carotenoids) in glucose medium, 32.0 ± 1.0 μg/g dry cell weight (41.0 ± 2.2% of total carotenoids) in glycerol medium and 17.4 ± 1.0 μg/g dry cell weight (31.1 ± 1.5% of total carotenoids) in xylose medium. Similarly, Moliné et al. [44] found that R. mucilaginosa produced torularhodin as a major carotenoid pigment (comprising 60–80% of total carotenoids) when cultured in MMS medium (containing 10 g/L glucose, 2 g/L (NH4)2SO4, 2 g/L KH2(PO4), 0.5 g/L MgSO4·7H2O and 1 g/L yeast extract). The differences of torularhodin content in yeast cells using different carbon sources can also be detected from the color of cells. As torularhodin is a rosy-red pigment [45], yeast cells cultivated in glucose and glycerol medium showed a deeper color (Figure 5). Additionally, it is remarkable that a higher proportion of torulene (accounting for 30.1 ± 1.5% of total carotenoids) and γ-carotene (accounting for 11.3 ± 0.6% of total carotenoids) was obtained when this yeast was cultivated in xylose medium. Furthermore, the proportion of β-carotene was higher in yeast cultivated in glycerol medium (34.7 ± 1.9% of total carotenoids) compared to those in xylose (27.5 ± 0.0% of total carotenoids) and glucose medium (25.5 ± 0.4% of total carotenoids).
The accumulation of carotenoid differences in this yeast caused by different carbon sources could be partially explained by the utilization efficiency of carbon sources of yeasts. These carbon sources are assimilated through different metabolic pathways in yeast before entering the carotenoid synthesis pathway and the utilization efficiency of unconventional carbon sources (xylose, glycerol and arabinose) in yeast has been proven to be lower than those of conventional carbon sources (glucose, sucrose and fructose), which were reflected in the longer consumption of time for unconventional sugars [46]. In the work performed by Tiukova et al. [47], the uptake rate of glucose by R. toruloides was approximately twice the xylose uptake rate during exponential phase. The consumption of xylose in the medium was accompanied by the synthesis of arabitol and xylitol, which were then utilized by R. toruloides to generate cell biomass and produce carotenoids at the late growth phase [48]. This may be the reason why cell biomass and carotenoid accumulation were relatively low in xylose medium after 96 h fermentation. Additionally, a maximum specific growth rate of Rhodosporidium toruloides in glycerol medium was also observed lower than that in glucose medium [49]. Therefore, it is possible that the utilization of these three carbon sources by R. mucilaginosa was varied, which led to the differences in the efficiency of carotenoid production. More carotenoids may be obtained by prolonging the fermentation time of R. mucilaginosa, especially in xylose and glycerol medium.
In addition, variations in carotenoid composition of yeast cultivated in different mediums may also be caused by the expression of carotenoid synthesis genes crtI (phytoene desaturase encoding gene) and crtYB (lycopene cyclase and phytoene synthase encoding gene) [50]. Fermentation parameters usually have significant effects on gene expression and activities of enzymes coded by these two genes. For example, Li et al. [50] observed that the production of torulene and torularhodin in R. glutinis increased accompanied by the upregulation of gene crtI under salt stress. Another research reported that even if crtI and crtYB of Rhodosporidiobolus colostri were downregulated at low temperature (16 °C), their respective enzymatic activities might be enhanced, leading to an increase in β-carotene and torulene accumulation and a decrease in torularhodin accumulation [51]. Additionally, according to Gong et al. [46], total carotenoids produced by R. glutinis increased under irradiation was found along with an upregulation of crtI and crtYB genes. Thus, it could be speculated that the presence of different carbon sources or their degradation products may affect the level of gene transcription and enzyme activities, resulting in different carotenoid proportions.
Furthermore, the developed strategy was used to extract and purify torularhodin produced by R. mucilaginosa cultivated in medium composed of different carbon sources. Absorption coefficient 3342 measured in chloroform was adopted to quantify the obtained torularhodin. The 92.3 ± 6.8% and 88.0 ± 1.9% of total torularhodin were recovered from yeast cells cultivated in xylose and glycerol medium, respectively (Table 2). This result indicated the feasibility of the developed process for torularhodin extraction, purification and quantification produced by red yeast using different carbon sources.
To conclude, R. mucilaginosa could use renewable carbon sources (xylose and glycerol) to produce carotenoids, and the developed process of purifying microbial torularhodin was feasible. In fact, the ability of R. mucilaginosa to produce torularhodin, β-carotene, and torulene from agro-industrial waste has also been proven [52]. Cheng and Yang [53] reported that the cell growth and carotenoid synthesis by R. mucilaginosa in molasses waste were both better than those in YM medium, the percentages of β-carotene, torulene and torularhodin in molasses waste were 23.8%, 67.5% and 8.7%, respectively. Moreover, it was observed that the carotenoid yield of R. mucilaginosa was higher in whey lactose as a carbon source (35.0 mg total carotenoids per gram of dry cells) compared to molasses sucrose as a carbon source [54]. However, most of the study was to maximize the production of carotenoids by using low cost and alternative carbon sources. There were rare works on the whole process of purifying microbial carotenoids by using renewable carbon sources, especially for torularhodin. The completion of this work could provide solutions to the downstream processing of torularhodin in large scale production.

4. Conclusions

An established strategy including cell disruption and elution with suitable solvents was proven to be feasible for recovery and purification of torularhodin from red yeast R. mucilaginosa. Saponification allowed for the separation of lipids and carotenoids produced by this yeast, but it resulted in a significant loss of torularhodin due to carboxyl present in torularhodin molecules. Ultrasound-assisted enzymatic lysis was not strong enough to disrupt yeast cells and release carotenoids in this case. Thermal acid treatment was therefore to be the most effective method for both carotenoid release and torularhodin recovery in this study. The determination of absorption coefficient of torularhodin provided a rapid quantitative way for the extracted torularhodin. Chloroform was found an appropriate solvent for torularhodin determination, and the absorption coefficient ( E 1 c m 1 % = 3342) for torularhodin was obtained. For the potential of this yeast to produce torularhodin using low-cost and renewable carbon sources, xylose and glycerol were found utilizable for this yeast. Although xylose and glycerol resulted in an increased β-carotene accumulation, torularhodin was still the major carotenoid produced by this yeast. The proposed processing in this study could promote the progress of industrial production of torularhodin.

Supplementary Materials

The following supporting information can be downloaded at: https://www.mdpi.com/article/10.3390/fermentation9090846/s1, Figure S1: HPLC chromatogram of total (A), polar (B) and nonpolar (C) carotenoids obtained from saponification; Figure S2: HPLC chromatogram of total (A), polar (B) and nonpolar (C) carotenoids obtained using ultrasound-assisted enzymatic lysis; Figure S3: UV-Vis absorption spectra of cis (A) and trans (B) isomers of torulene obtained in the present study; Figure S4: HPLC chromatogram of total carotenoids from R. mucilaginosa cultivated in synthetic medium with glucose (A), xylose (B) and glycerol (C); Table S1: Lipid accumulation of R. mucilaginosa cultivated in glucose medium; Table S2: Biomass and total carotenoids produced by R. mucilaginosa cultivated in synthetic medium with different carbon sources.

Author Contributions

Conceptualization, Z.L.; methodology, Y.Z. and R.W.; software, Y.Z.; validation, R.W. and H.Z.; formal analysis, R.W. and H.Z.; investigation, Y.Z., R.W., J.L. and H.Z.; resources, J.Y.; data curation, Y.Z., H.Z. and J.L.; writing—original draft preparation, Y.Z.; writing—review and editing, Z.L. and J.Y.; visualization, Y.Z. and J.L.; supervision, Z.L. and J.Y.; project administration, Z.L. and J.Y.; funding acquisition, Z.L. and J.Y. All authors have read and agreed to the published version of the manuscript.

Funding

This research was funded by Science and Technology Project of Yunnan Province (grant No. 202102AE090050) and Yunnan Fundamental Research Projects (grant NO. 202201BE070001-005 and 202301AT070170).

Institutional Review Board Statement

Not applicable.

Informed Consent Statement

Not applicable.

Data Availability Statement

Data are contained within the article or supplementary material.

Conflicts of Interest

The authors declare no conflict of interest.

References

  1. Liu, Z.; van den Berg, C.; Weusthuis, R.A.; Dragone, G.; Mussatto, S.I. Strategies for an Improved Extraction and Separation of Lipids and Carotenoids from Oleaginous Yeast. Sep. Purif. Technol. 2021, 257, 117946. [Google Scholar] [CrossRef]
  2. Biehler, E.; Mayer, F.; Hoffmann, L.; Krause, E.; Bohn, T. Comparison of 3 Spectrophotometric Methods for Carotenoid Determination in Frequently Consumed Fruits and Vegetables. J. Food Sci. 2010, 75, C55–C61. [Google Scholar] [CrossRef] [PubMed]
  3. Shi, Q.; Wang, H.; Du, C.; Zhang, W.; Qian, H. Tentative Identification of Torulene Cis/Trans Geometrical Isomers Isolated from Sporidiobolus pararoseus by High-Performance Liquid Chromatography-Diode Array Detection-Mass Spectrometry and Preparation by Column Chromatography. Anal. Sci. 2013, 29, 997–1002. [Google Scholar] [CrossRef] [PubMed]
  4. Torres, F.A.E.; Zaccarim, B.R.; de Lencastre Novaes, L.C.; Jozala, A.F.; dos Santos, C.A.; Teixeira, M.F.S.; Santos-Ebinuma, V.C. Natural Colorants from Filamentous Fungi. Appl. Microbiol. Biotechnol. 2016, 100, 2511–2521. [Google Scholar] [CrossRef] [PubMed]
  5. Novoveská, L.; Ross, M.E.; Stanley, M.S.; Pradelles, R.; Wasiolek, V.; Sassi, J.F. Microalgal Carotenoids: A Review of Production, Current Markets, Regulations, and Future Direction. Mar. Drugs 2019, 17, 640. [Google Scholar] [CrossRef]
  6. Lopes, N.A.; Remedi, R.D.; dos Santos Sá, C.; Burkert, C.A.V.; de Medeiros Burkert, J.F. Different Cell Disruption Methods for Obtaining Carotenoids by Sporodiobolus pararoseus and Rhodothorula mucilaginosa. Food Sci. Biotechnol. 2017, 26, 759–766. [Google Scholar] [CrossRef] [PubMed]
  7. Nagaraj, Y.N.; Burkina, V.; Okmane, L.; Blomqvist, J.; Rapoport, A.; Sandgren, M.; Pickova, J.; Sampels, S.; Passoth, V. Identification, Quantification and Kinetic Study of Carotenoids and Lipids in Rhodotorula toruloides CBS 14 Cultivated on Wheat Straw Hydrolysate. Fermentation 2022, 8, 300. [Google Scholar] [CrossRef]
  8. Li, J.; Qian, H.; Pi, F.; Wang, B.X. Bioavailability Evaluation of the Intestinal Absorption and Liver Accumulation of Torularhodin Using a Rat Postprandial Model. Food Funct. 2022, 13, 5946–5952. [Google Scholar] [CrossRef] [PubMed]
  9. Buzzini, P.; Innocenti, M.; Turchetti, B.; Libkind, D.; Van Broock, M.; Mulinacci, N. Carotenoid Profiles of Yeasts Belonging to the Genera Rhodotorula, Rhodosporidium, Sporobolomyces, and Sporidiobolus. Can. J. Microbiol. 2007, 53, 1024–1031. [Google Scholar] [CrossRef] [PubMed]
  10. Li, X.; He, Q.; Zhang, G. The Impact of the Physical Form of Torularhodin on Its Metabolic Fate in the Gastrointestinal Tract. Food Funct. 2021, 12, 9955–9964. [Google Scholar] [CrossRef]
  11. Liu, C.; Hu, B.; Cheng, Y.; Guo, Y.; Yao, W.; Qian, H. Carotenoids from Fungi and Microalgae: A Review on Their Recent Production, Extraction, and Developments. Bioresour. Technol. 2021, 337, 125398. [Google Scholar] [CrossRef] [PubMed]
  12. Liu, Z.W.; Zeng, X.A.; Cheng, J.H.; Liu, D.B.; Aadil, R.M. The Efficiency and Comparison of Novel Techniques for Cell Wall Disruption in Astaxanthin Extraction from Haematococcus pluvialis. Int. J. Food Sci. Technol. 2018, 53, 2212–2219. [Google Scholar] [CrossRef]
  13. Michelon, M.; de Matos de Borba, T.; da Silva Rafael, R.; Burkert, C.A.V.; de Medeiros Burkert, J.F. Extraction of Carotenoids from Phaffia rhodozyma: A Comparison between Different Techniques of Cell Disruption. Food Sci. Biotechnol. 2012, 21, 1–8. [Google Scholar] [CrossRef]
  14. Saini, R.K.; Keum, Y.S. Carotenoid Extraction Methods: A Review of Recent Developments. Food Chem. 2018, 240, 90–103. [Google Scholar] [CrossRef]
  15. Allahkarami, S.; Sepahi, A.A.; Hosseini, H.; Razavi, M.R. Isolation and Identification of Carotenoid-Producing Rhodotorula Sp. from Pinaceae Forest Ecosystems and Optimization of in Vitro Carotenoid Production. Biotechnol. Rep. 2021, 32, e00687. [Google Scholar] [CrossRef]
  16. Cai, J.; He, Y.; Yu, X.; Banks, S.W.; Yang, Y.; Zhang, X.; Yu, Y.; Liu, R.; Bridgwater, A.V. Review of Physicochemical Properties and Analytical Characterization of Lignocellulosic Biomass. Renew. Sustain. Energy Rev. 2017, 76, 309–322. [Google Scholar] [CrossRef]
  17. Cardoso, L.A.C.; Jäckel, S.; Karp, S.G.; Framboisier, X.; Chevalot, I.; Marc, I. Improvement of Sporobolomyces ruberrimus Carotenoids Production by the Use of Raw Glycerol. Bioresour. Technol. 2016, 200, 374–379. [Google Scholar] [CrossRef] [PubMed]
  18. Braunwald, T.; Schwemmlein, L.; Graeff-Hönninger, S.; French, W.T.; Hernandez, R.; Holmes, W.E.; Claupein, W. Effect of Different C/N Ratios on Carotenoid and Lipid Production by Rhodotorula glutinis. Appl. Microbiol. Biotechnol. 2013, 97, 6581–6588. [Google Scholar] [CrossRef]
  19. Tao, Z.; Zhang, P.; Qin, Z.; Li, Y.-Q.; Wang, G. Poly(3-Hydroxybutyrate) Anabolism in Cupriavidus necator Cultivated at Various Carbon-to-Nitrogen Ratios: Insights from Single-Cell Raman Spectroscopy. J. Biomed. Opt. 2016, 21, 097005. [Google Scholar] [CrossRef]
  20. Postma, P.R.; Pataro, G.; Capitoli, M.; Barbosa, M.J.; Wijffels, R.H.; Eppink, M.H.M.; Olivieri, G.; Ferrari, G. Selective Extraction of Intracellular Components from the Microalga Chlorella vulgaris by Combined Pulsed Electric Field-Temperature Treatment. Bioresour. Technol. 2016, 203, 80–88. [Google Scholar] [CrossRef]
  21. Xiao, A.F.; Ni, H.; Cai, H.N.; Li, L.J.; Su, W.J.; Yang, Q.M. An Improved Process for Cell Disruption and Astaxanthin Extraction from Phaffia rhodozyma. World J. Microbiol. Biotechnol. 2009, 25, 2029–2034. [Google Scholar] [CrossRef]
  22. Joshi, D.R.; Adhikari, N. An Overview on Common Organic Solvents and Their Toxicity. J. Pharm. Res. Int. 2019, 28, 1–18. [Google Scholar] [CrossRef]
  23. FDA. Q3C—Tables and List Guidance for Industry. 2017. Available online: https://www.fda.gov/media/71737/download. (accessed on 10 September 2023).
  24. Machado, F.R.S.; Trevisol, T.C.; Boschetto, D.L.; Burkert, J.F.M.; Ferreira, S.R.S.; Oliveira, J.V.; Burkert, C.A.V. Technological Process for Cell Disruption, Extraction and Encapsulation of Astaxanthin from Haematococcus pluvialis. J. Biotechnol. 2016, 218, 108–114. [Google Scholar] [CrossRef]
  25. Li, C.; Zhang, N.; Li, B.; Xu, Q.; Song, J.; Wei, N.; Wang, W.; Zou, H. Increased Torulene Accumulation in Red Yeast Sporidiobolus pararoseus NGR as Stress Response to High Salt Conditions. Food Chem. 2017, 237, 1041–1047. [Google Scholar] [CrossRef] [PubMed]
  26. Lillie, S.H.; Pringle, J.R. Reserve Carbohydrate Metabolism in Saccharomyces cerevisiae: Responses to Nutrient Limitation. J. Bacteriol. 1980, 143, 1384–1394. [Google Scholar] [CrossRef] [PubMed]
  27. Zhang, X.; Yan, S.; Tyagi, R.D.; Drogui, P.; Surampalli, R.Y. Ultrasonication Assisted Lipid Extraction from Oleaginous Microorganisms. Bioresour. Technol. 2014, 158, 253–261. [Google Scholar] [CrossRef] [PubMed]
  28. Liu, Z.; Feist, A.M.; Dragone, G.; Mussatto, S.I. Lipid and Carotenoid Production from Wheat Straw Hydrolysates by Different Oleaginous Yeasts. J. Clean. Prod. 2020, 249, 119308. [Google Scholar] [CrossRef]
  29. Yu, X.; Zheng, Y.; Dorgan, K.M.; Chen, S. Oil Production by Oleaginous Yeasts Using the Hydrolysate from Pretreatment of Wheat Straw with Dilute Sulfuric Acid. Bioresour. Technol. 2011, 102, 6134–6140. [Google Scholar] [CrossRef]
  30. Liu, Z.; Radi, M.; Mohamed, E.T.T.; Feist, A.M.; Dragone, G.; Mussatto, S.I. Adaptive Laboratory Evolution of Rhodosporidium toruloides to Inhibitors Derived from Lignocellulosic Biomass and Genetic Variations behind Evolution. Bioresour. Technol. 2021, 333, 125171. [Google Scholar] [CrossRef]
  31. Ungureanu, C.; Ferdes, M.; Chirvase, A.A. Torularhodin Biosynthesis and Extraction by Yeast Cells of Rhodotorula rubra. Rev. Chim. 2012, 63, 316–318. [Google Scholar]
  32. Maldonade, I.R.; Rodriguez-Amaya, D.B.; Scamparini, A.R.P. Carotenoids of Yeasts Isolated from the Brazilian Ecosystem. Food Chem. 2008, 107, 145–150. [Google Scholar] [CrossRef]
  33. Frengova, G.I.; Simova, E.D.; Beshkova, D.M. Effect of Temperature Changes on the Production of Yeast Pigments Co-Cultivated with Lacto-Acid Bacteria in Whey Ultrafiltrate. Biotechnol. Lett. 1995, 17, 1001–1006. [Google Scholar] [CrossRef]
  34. Liu, Z.; Natalizio, F.; Dragone, G.; Mussatto, S.I. Maximizing the Simultaneous Production of Lipids and Carotenoids by Rhodosporidium toruloides from Wheat Straw Hydrolysate and Perspectives for Large-Scale Implementation. Bioresour. Technol. 2021, 340, 125598. [Google Scholar] [CrossRef] [PubMed]
  35. Schwerdt, J.; Qiu, H.; Shirley, N.; Little, A.; Bulone, V. Phylogenomic Analyses of Nucleotide-Sugar Biosynthetic and Interconverting Enzymes Illuminate Cell Wall Composition in Fungi. MBio 2021, 12, e03540-20. [Google Scholar] [CrossRef]
  36. Liu, D.; Ding, L.; Sun, J.; Boussetta, N.; Vorobiev, E. Yeast Cell Disruption Strategies for Recovery of Intracellular Bio-Active Compounds—A Review. Innov. Food Sci. Emerg. Technol. 2016, 36, 181–192. [Google Scholar] [CrossRef]
  37. Jaeschke, D.P.; Rech, R.; Marczak, L.D.F.; Mercali, G.D. Ultrasound as an Alternative Technology to Extract Carotenoids and Lipids from Heterochlorella luteoviridis. Bioresour. Technol. 2017, 224, 753–757. [Google Scholar] [CrossRef]
  38. Sun, M.; Hu, J.; Pan, S. Study on Stability of Carotenoids from Orange Peels. Food Sci. 2016, 28, 46–49. [Google Scholar]
  39. Squina, F.M.; Mercadante, A.Z. HPLC Analysis of Carotenoids from Five Rhodotorula Strains. Rev. Bras. Cienc. Farm. J. Pharm. Sci. 2003, 39, 309–318. [Google Scholar]
  40. Mussagy, C.U.; Santos-Ebinuma, V.C.; Gonzalez-Miquel, M.; Coutinho, J.A.P.; Pereira, J.F.B. Protic Ionic Liquids as Cell-Disrupting Agents for the Recovery of Intracellular Carotenoids from Yeast Rhodotorula glutinis CCT-2186. ACS Sustain. Chem. Eng. 2019, 7, 16765–16776. [Google Scholar] [CrossRef]
  41. Turcsi, E.; Nagy, V.; Deli, J. Study on the Elution Order of Carotenoids on Endcapped C18 and C30 Reverse Silica Stationary Phases. A Review of the Database. J. Food Compos. Anal. 2016, 47, 101–112. [Google Scholar] [CrossRef]
  42. Zoz, L.; Carvalho, J.C.; Soccol, V.T.; Casagrande, T.C.; Cardoso, L. Torularhodin and Torulene: Bioproduction, Properties and Prospective Applications in Food and Cosmetics—A Review. Braz. Arch. Biol. Technol. 2015, 58, 278–288. [Google Scholar] [CrossRef]
  43. Simpson, K.L.; Nakayama, T.O.; Chichester, C.O. Biosynthesis of Yeast Carotenoids. J. Bacteriol. 1964, 88, 1688–1694. [Google Scholar] [CrossRef] [PubMed]
  44. Moliné, M.; Libkind, D.; Van Broock, M. Production of Torularhodin, Torulene, and β-Carotene by Rhodotorula Yeasts. Methods Mol. Biol. 2012, 898, 275–283. [Google Scholar] [PubMed]
  45. Sun, Z.; Lv, J.; Ji, C.; Liang, H.; Li, S.; Yang, Z.; Xu, W.; Zhang, S.; Lin, X. Analysis of Carotenoid Profile Changes and Carotenogenic Genes Transcript Levels in Rhodosporidium toruloides Mutants from an Optimized Agrobacterium tumefaciens-Mediated Transformation Method. Biotechnol. Appl. Biochem. 2021, 68, 71–81. [Google Scholar] [CrossRef]
  46. Gong, G.; Liu, L.; Zhang, X.; Tan, T. Comparative Evaluation of Different Carbon Sources Supply on Simultaneous Production of Lipid and Carotene of Rhodotorula glutinis with Irradiation and the Assessment of Key Gene Transcription. Bioresour. Technol. 2019, 288, 121559. [Google Scholar] [CrossRef]
  47. Tiukova, I.A.; Brandenburg, J.; Blomqvist, J.; Sampels, S.; Mikkelsen, N.; Skaugen, M.; Arntzen, M.O.; Nielsen, J.; Sandgren, M.; Kerkhoven, E.J. Proteome Analysis of Xylose Metabolism in Rhodotorula toruloides during Lipid Production. Biotechnol. Biofuels 2019, 12, 1–17. [Google Scholar] [CrossRef]
  48. Pinheiro, M.J.; Bonturi, N.; Belouah, I.; Miranda, E.A.; Lahtvee, P.J. Xylose Metabolism and the Effect of Oxidative Stress on Lipid and Carotenoid Production in Rhodotorula toruloides: Insights for Future Biorefinery. Front. Bioeng. Biotechnol. 2020, 8, 1008. [Google Scholar] [CrossRef]
  49. Bommareddy, R.R.; Sabra, W.; Maheshwari, G.; Zeng, A.P. Metabolic Network Analysis and Experimental Study of Lipid Production in Rhodosporidium toruloides Grown on Single and Mixed Substrates. Microb. Cell Fact. 2015, 14, 1–13. [Google Scholar] [CrossRef]
  50. Li, C.; Cheng, P.; Li, Z.; Xu, Y.; Sun, Y.; Qin, D.; Yu, G. Transcriptomic and Metabolomic Analyses Provide Insights into the Enhancement of Torulene and Torularhodin Production in Rhodotorula glutinis ZHK under Moderate Salt Conditions. J. Agric. Food Chem. 2021, 69, 11523–11533. [Google Scholar] [CrossRef]
  51. Li, C.; Xu, Y.; Li, Z.; Cheng, P.; Yu, G. Transcriptomic and Metabolomic Analysis Reveals the Potential Mechanisms Underlying the Improvement of β-Carotene and Torulene Production in Rhodosporidiobolus colostri under Low Temperature Treatment. Food Res. Int. 2022, 156, 111158. [Google Scholar] [CrossRef]
  52. Sharma, R.; Ghoshal, G. Optimization of Carotenoids Production by Rhodotorula mucilaginosa (MTCC-1403) Using Agro-Industrial Waste in Bioreactor: A Statistical Approach. Biotechnol. Rep. 2020, 25, e00407. [Google Scholar] [CrossRef] [PubMed]
  53. Cheng, Y.T.; Yang, C.F. Using Strain Rhodotorula Mucilaginosa to Produce carotenoids Using Food Wastes. J. Taiwan Inst. Chem. Eng. 2016, 61, 270–275. [Google Scholar] [CrossRef]
  54. Aksu, Z.; Tuǧba Eren, A. Carotenoids Production by the Yeast Rhodotorula mucilaginosa: Use of Agricultural Wastes as a Carbon Source. Process Biochem. 2005, 40, 2985–2991. [Google Scholar] [CrossRef]
Figure 1. Chemical structures of γ-carotene, β-carotene, torulene and torularhodin.
Fermentation 09 00846 g001
Figure 2. UV-Vis absorption spectra of torularhodin in different solvents.
Fermentation 09 00846 g002
Figure 3. (A) Effects of cell disruption techniques on the carotenoid composition of yeast cells. Different letters (a–c) indicate significant differences between each carotenoid obtained from different treatments. Values in bars marked with the same letter(s) are not significantly different according to Tukey’s test (p ˂ 0.05); (B) HPLC chromatogram of carotenoid standards at a concentration of 2 mg/mL; (C) HPLC chromatogram of total carotenoids obtained using thermal acid treatment.
Fermentation 09 00846 g003
Figure 4. (A) Separation of carotenoids by silica cartridge elution; (B) HPLC chromatogram of polar (a) and nonpolar (b) carotenoids obtained from the thermal acid treatment; (C) recovery of carotenoids using different cell disruption methods. Different letters (a–c) indicate significant differences between each carotenoid obtained using different treatments. Values in bars marked with the same letter(s) are not significantly different according to Tukey’s test (p ˂ 0.05).
Fermentation 09 00846 g004
Figure 5. Carotenoids accumulation of R. mucilaginosa cultivated in synthetic media with different carbon sources. Different letters (a–c) indicate significant differences in the proportion of each carotenoid among all carbon sources. Values in bars followed by the same letter(s) are not significantly different according to Tukey’s test (p ˂ 0.05).
Fermentation 09 00846 g005
Table 1. The maximum absorption wavelength and E 1 c m 1 % of torularhodin.
Sample SourceSolventsThe Maximum Absorption Wavelength (nm) E 1 c m 1 % Reference
Torularhodin
standard
Acetone4942303 ± 119-
Chloroform5142829 ± 143-
n-Hexane/ethanol (1/1, v/v)4992174 ± 25-
Extracted
torularhodin
Acetone4943257 ± 52-
Chloroform5143342 ± 46-
n-Hexane/ethanol (1/1, v/v)4993578 ± 39-
Previous
reports
Petroleum ether474–500–5332580[42]
Hexane468–502–5392040[42]
Chloroform5151932[43]
Table 2. Torularhodin recovered from R. mucilaginosa cultivated in synthetic media with different carbon sources.
Torularhodin Content (μg/g Dry Cell Weight)Torularhodin Recovery (%)
Before Separation *After Separation **
Xylose17.4 ± 1.016.1 ± 2.092.3 ± 6.8
Glycerol32.0 ± 1.028.1 ± 2.088.0 ± 1.9
*: HPLC was used to quantify. **: samples were dissolved in chloroform and quantified by UV-Vis spectroscopy using the E 1 c m 1 % of torularhodin sample determined above.
Disclaimer/Publisher’s Note: The statements, opinions and data contained in all publications are solely those of the individual author(s) and contributor(s) and not of MDPI and/or the editor(s). MDPI and/or the editor(s) disclaim responsibility for any injury to people or property resulting from any ideas, methods, instructions or products referred to in the content.

