
Production of Potential Substitutes for Conventional Plastics Using Metabolically Engineered Acetobacterium woodii

Abstract
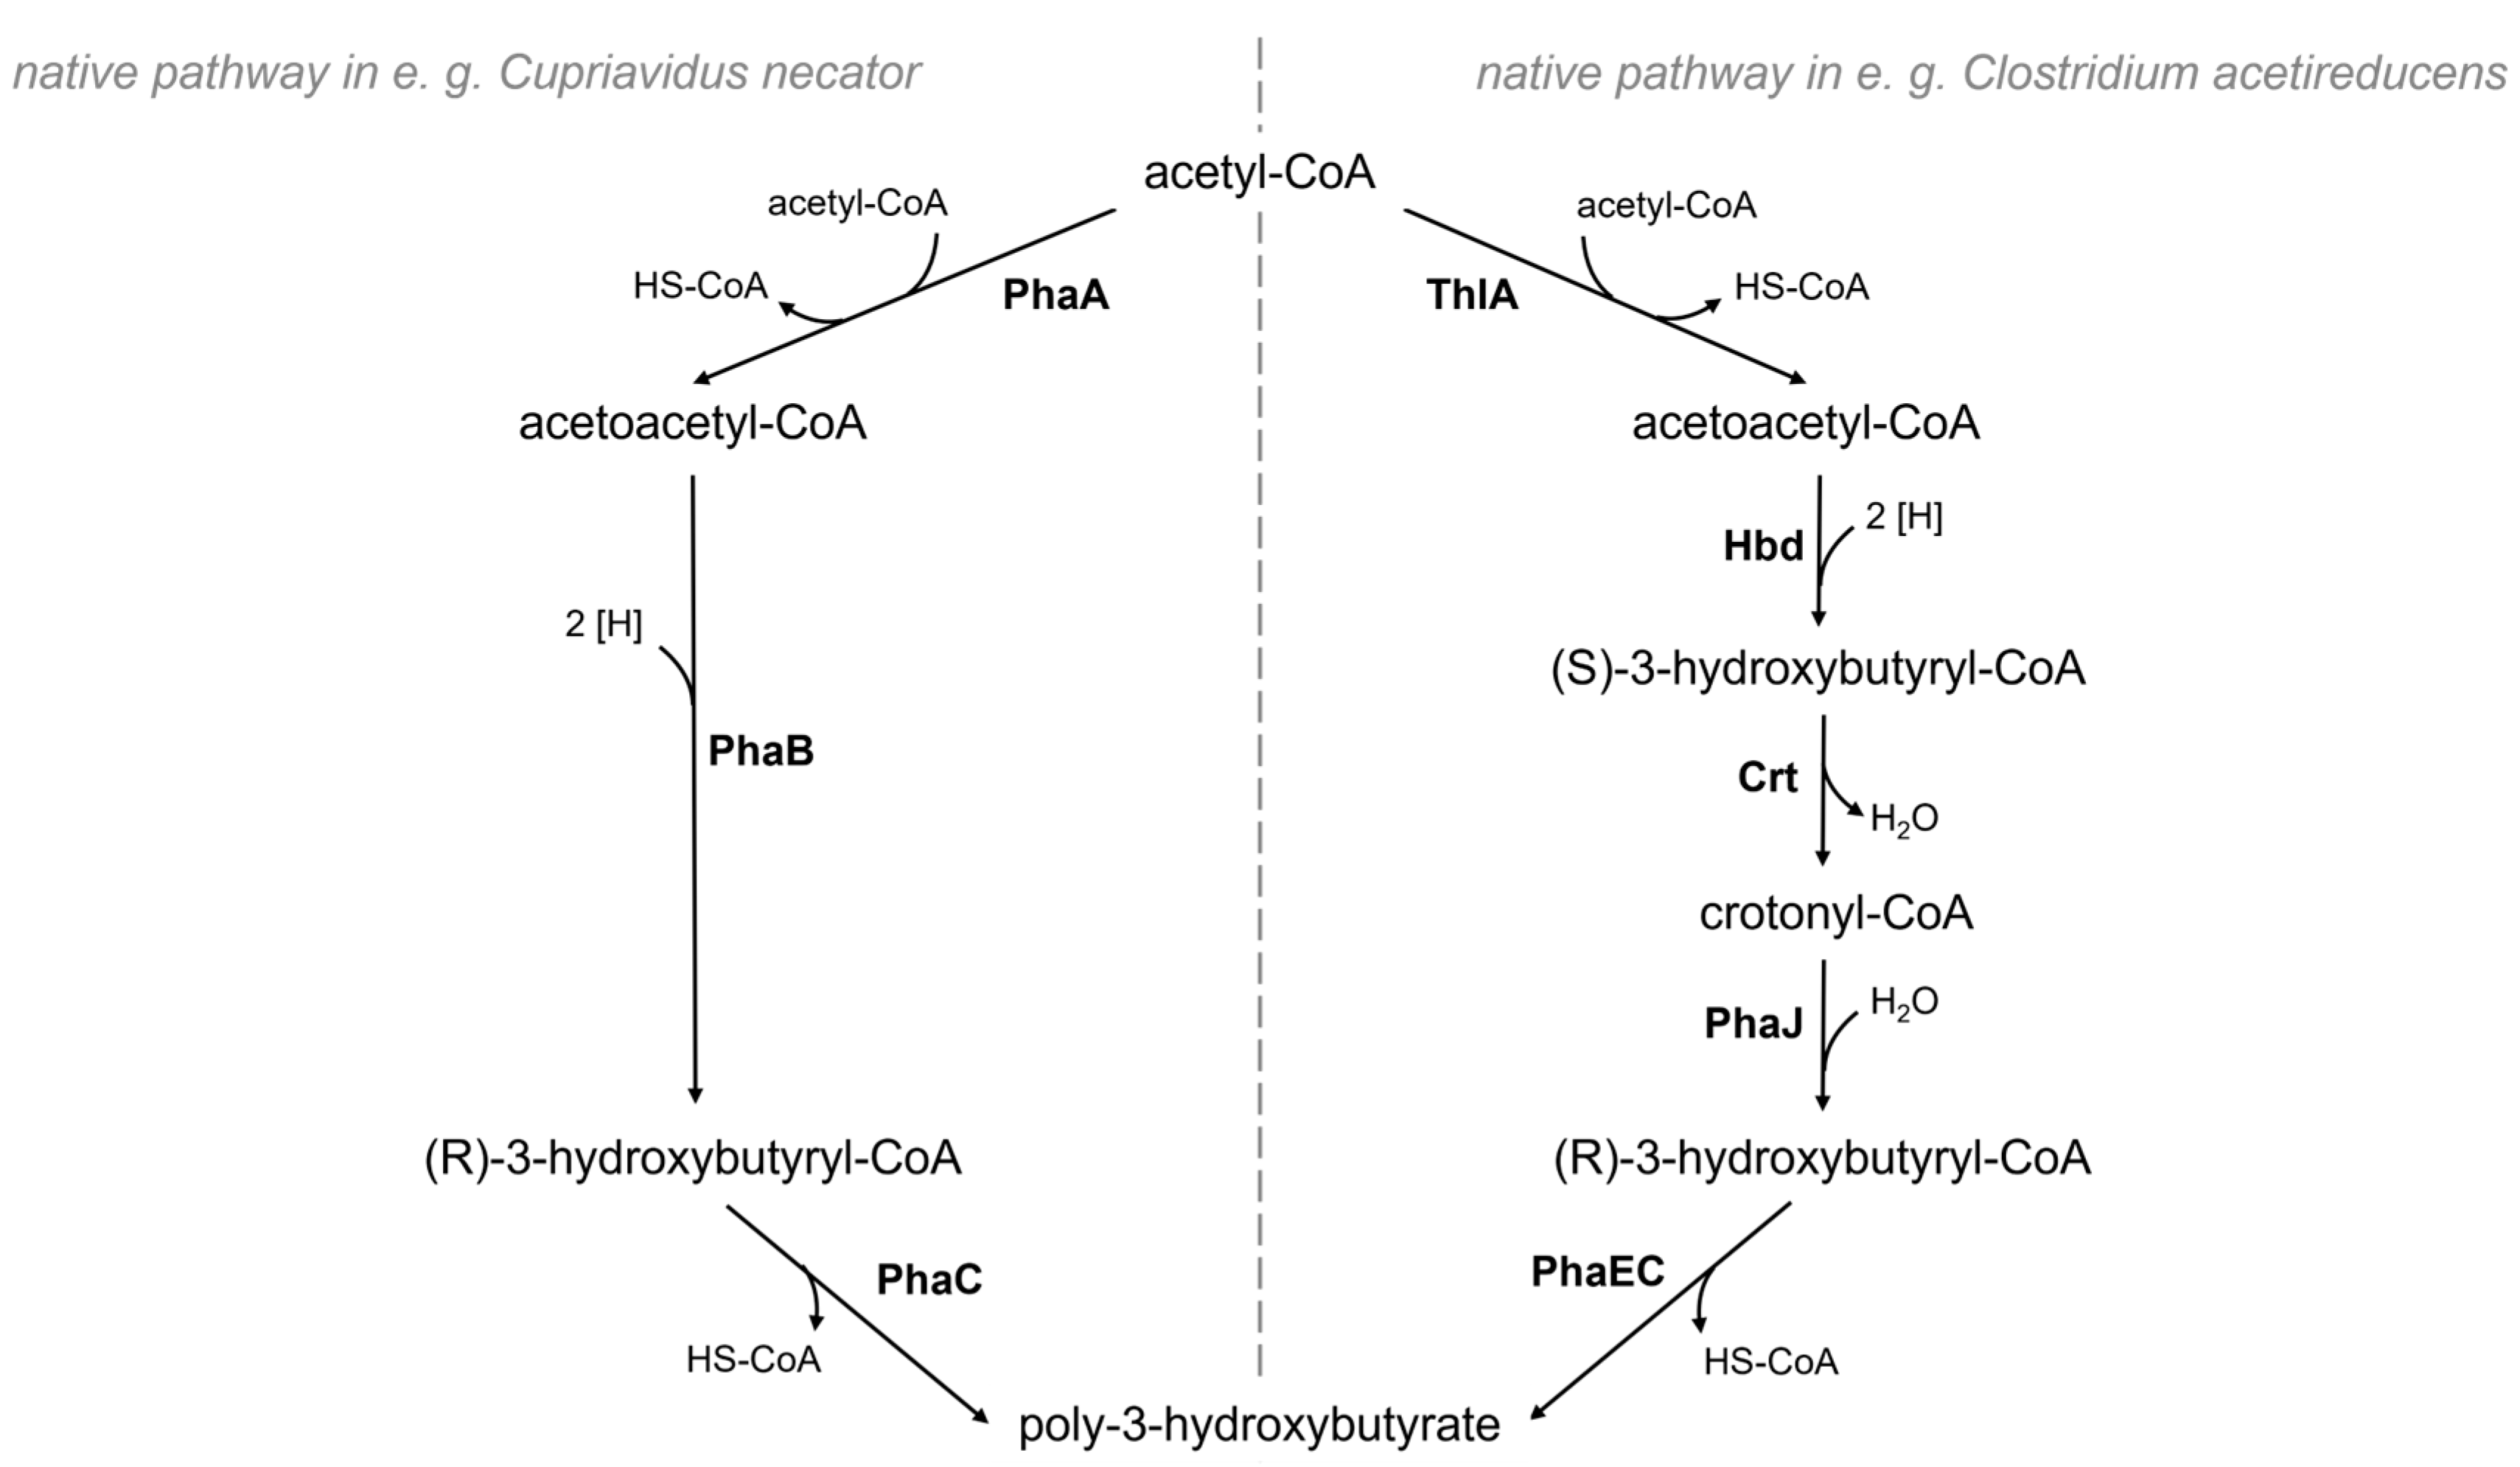
:1. Introduction
2. Materials and Methods
2.1. Bacterial Strains and Media
2.2. Isolation of Genomic and Plasmid DNA
2.3. Electroporation Procedure for A. Woodii
2.4. Growth Conditions of Batch Experiments
2.5. Analytics
2.5.1. Optical Density and pH Measurements
2.5.2. High-Performance Liquid Chromatography
2.5.3. Establishment of a LipidGreen2-Assay for In Vivo PHB Detection
2.5.4. Quantification of PHB Using Gas Chromatography
2.6. Visualization of Poly-3-Hydroxybutyrate In Vivo
2.6.1. Transmission Electron Microscopy
2.6.2. Fluorescence Microscopy
3. Results
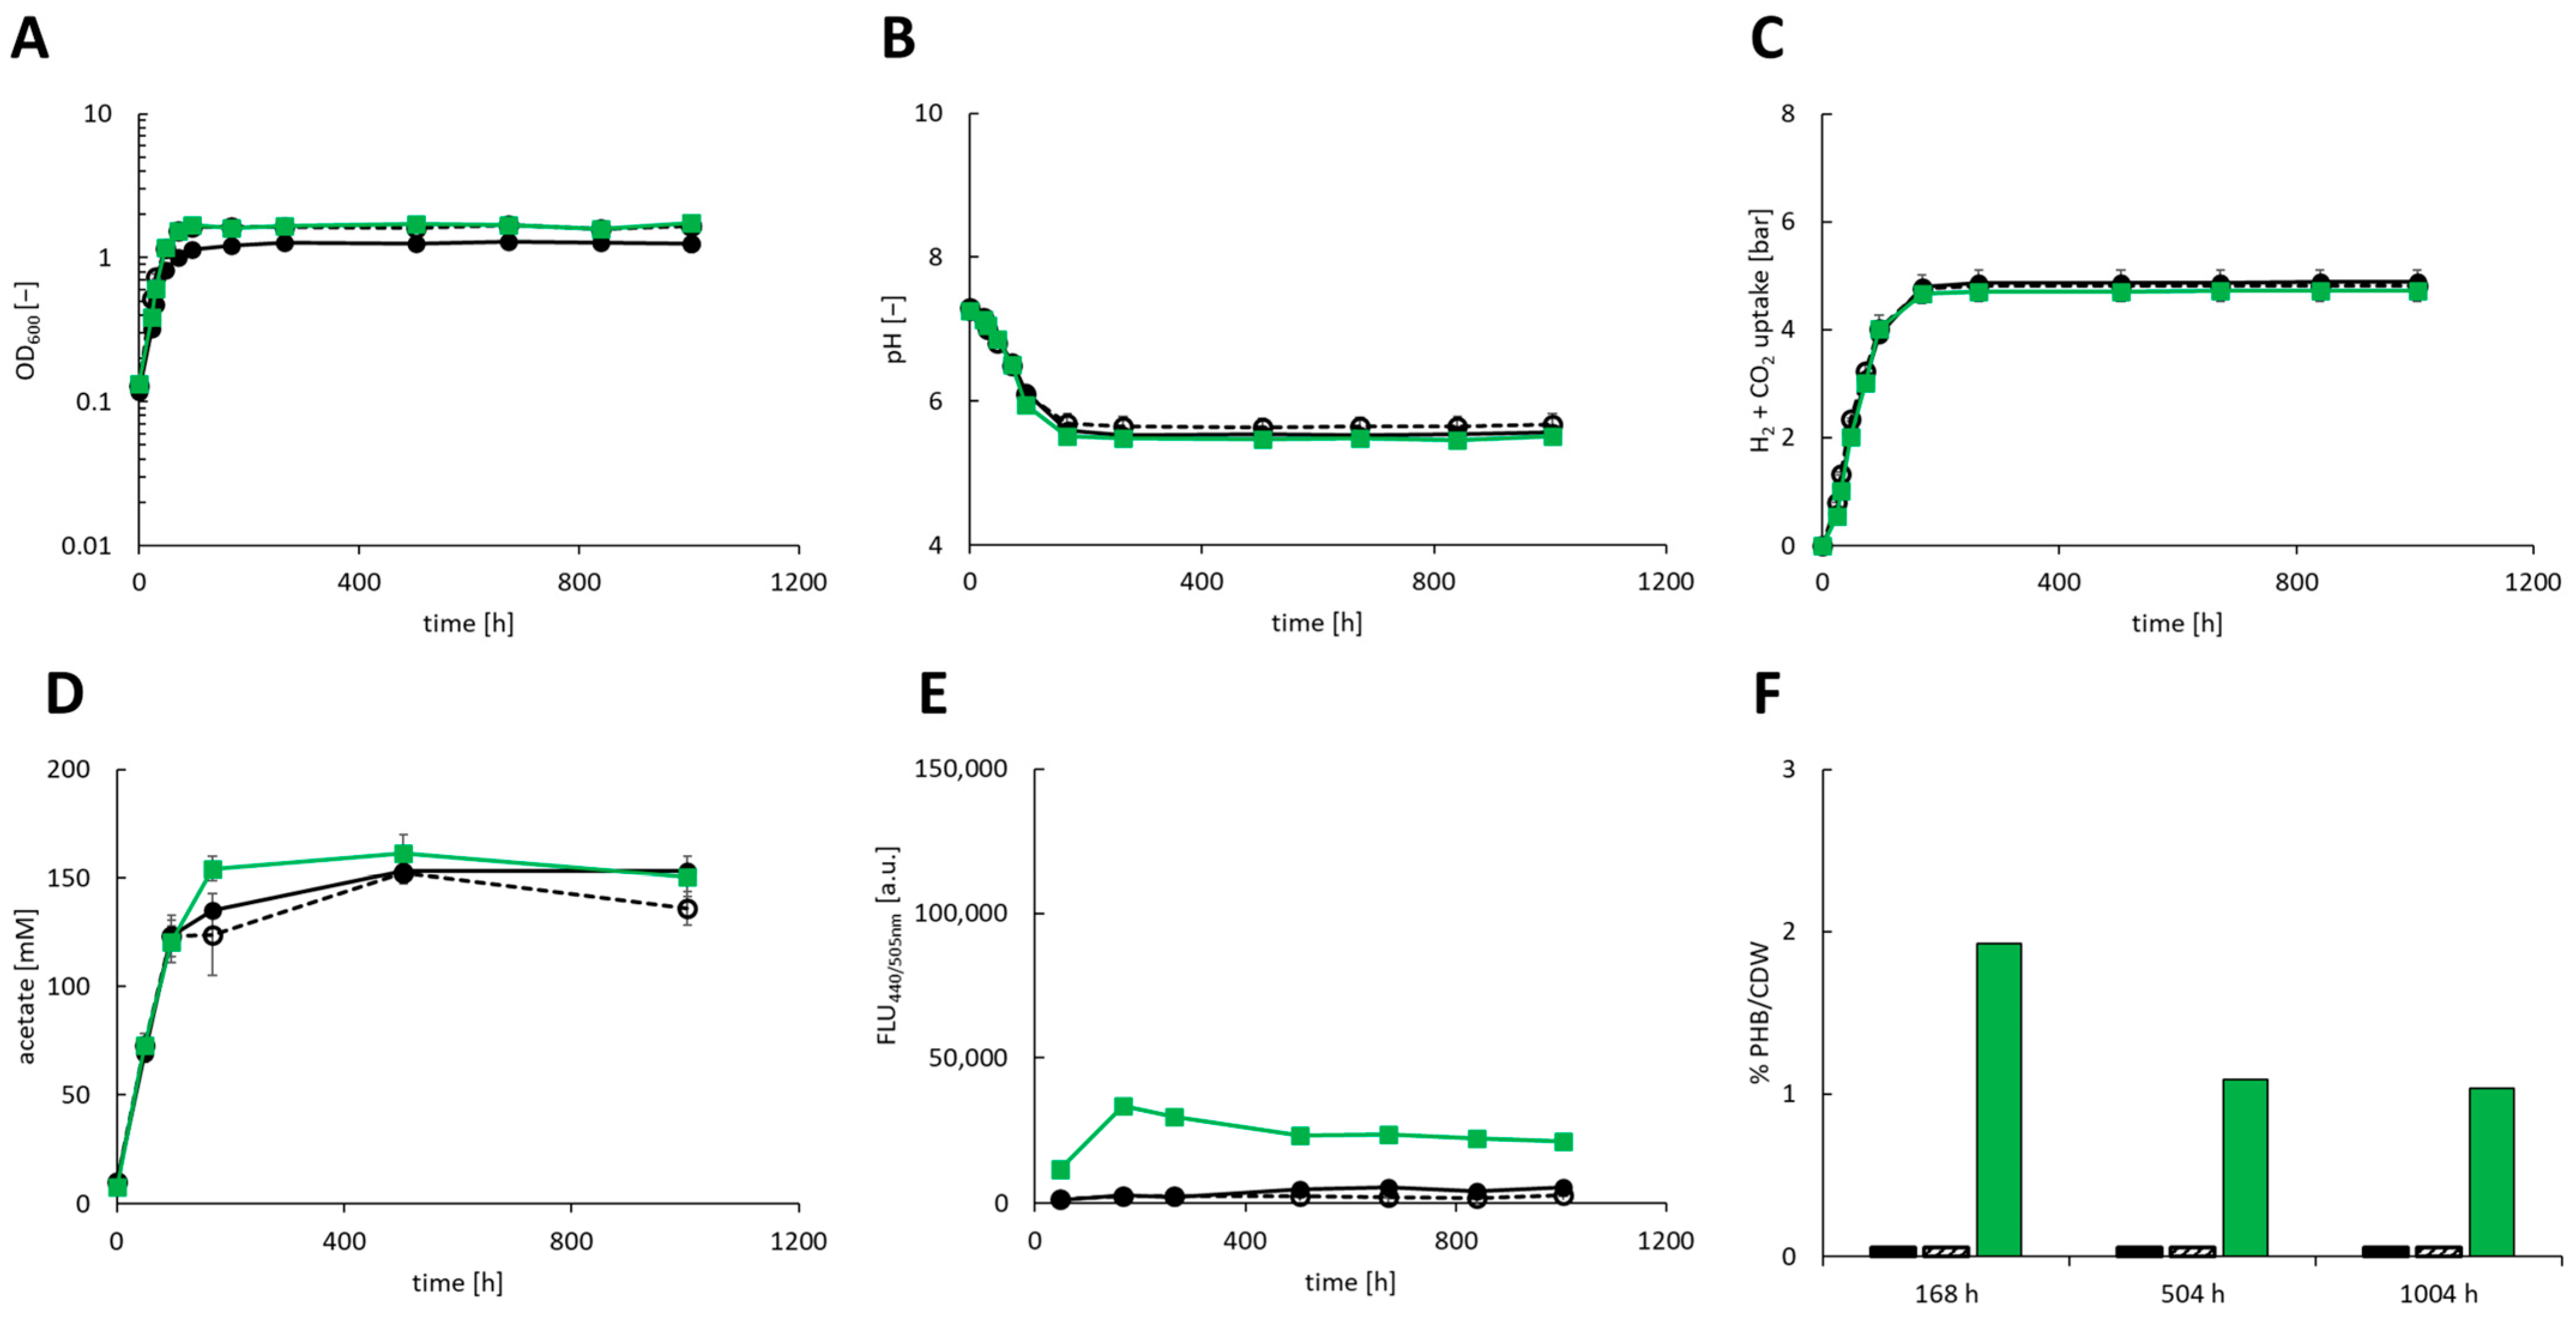
3.1. Heterotrophic Growth of Recombinant A. Woodii Strains
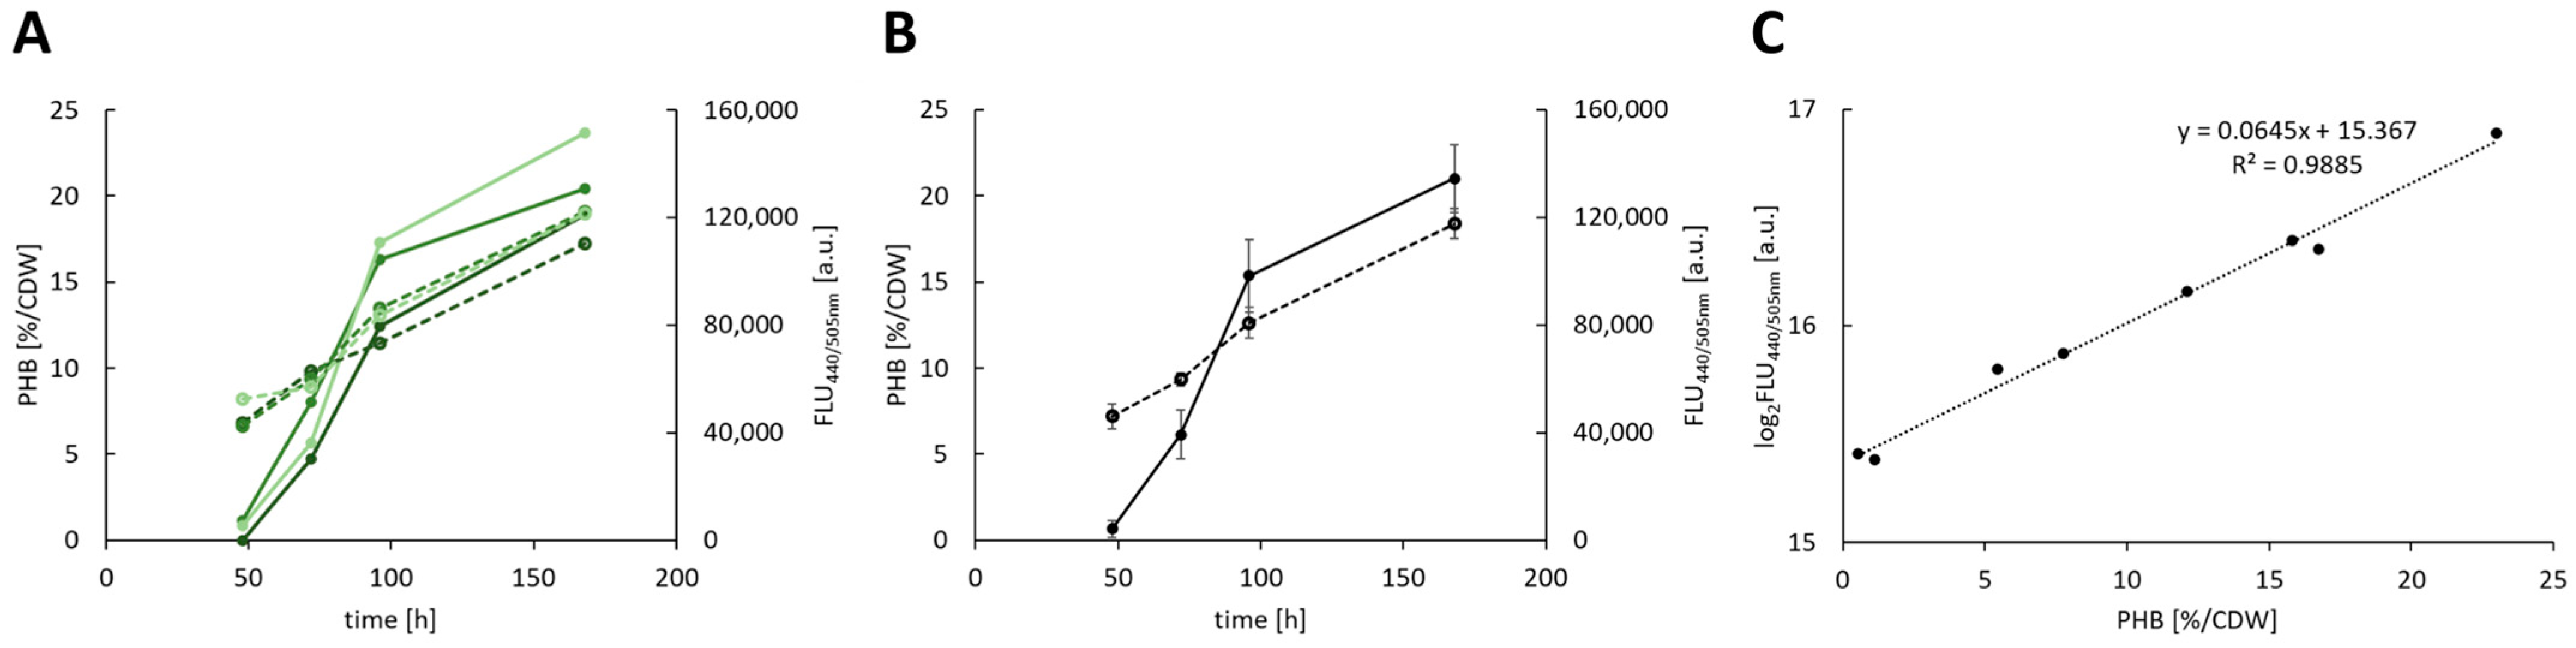
3.2. Establishment of a LipidGreen2 Assay
3.3. Autotrophic Production of PHB
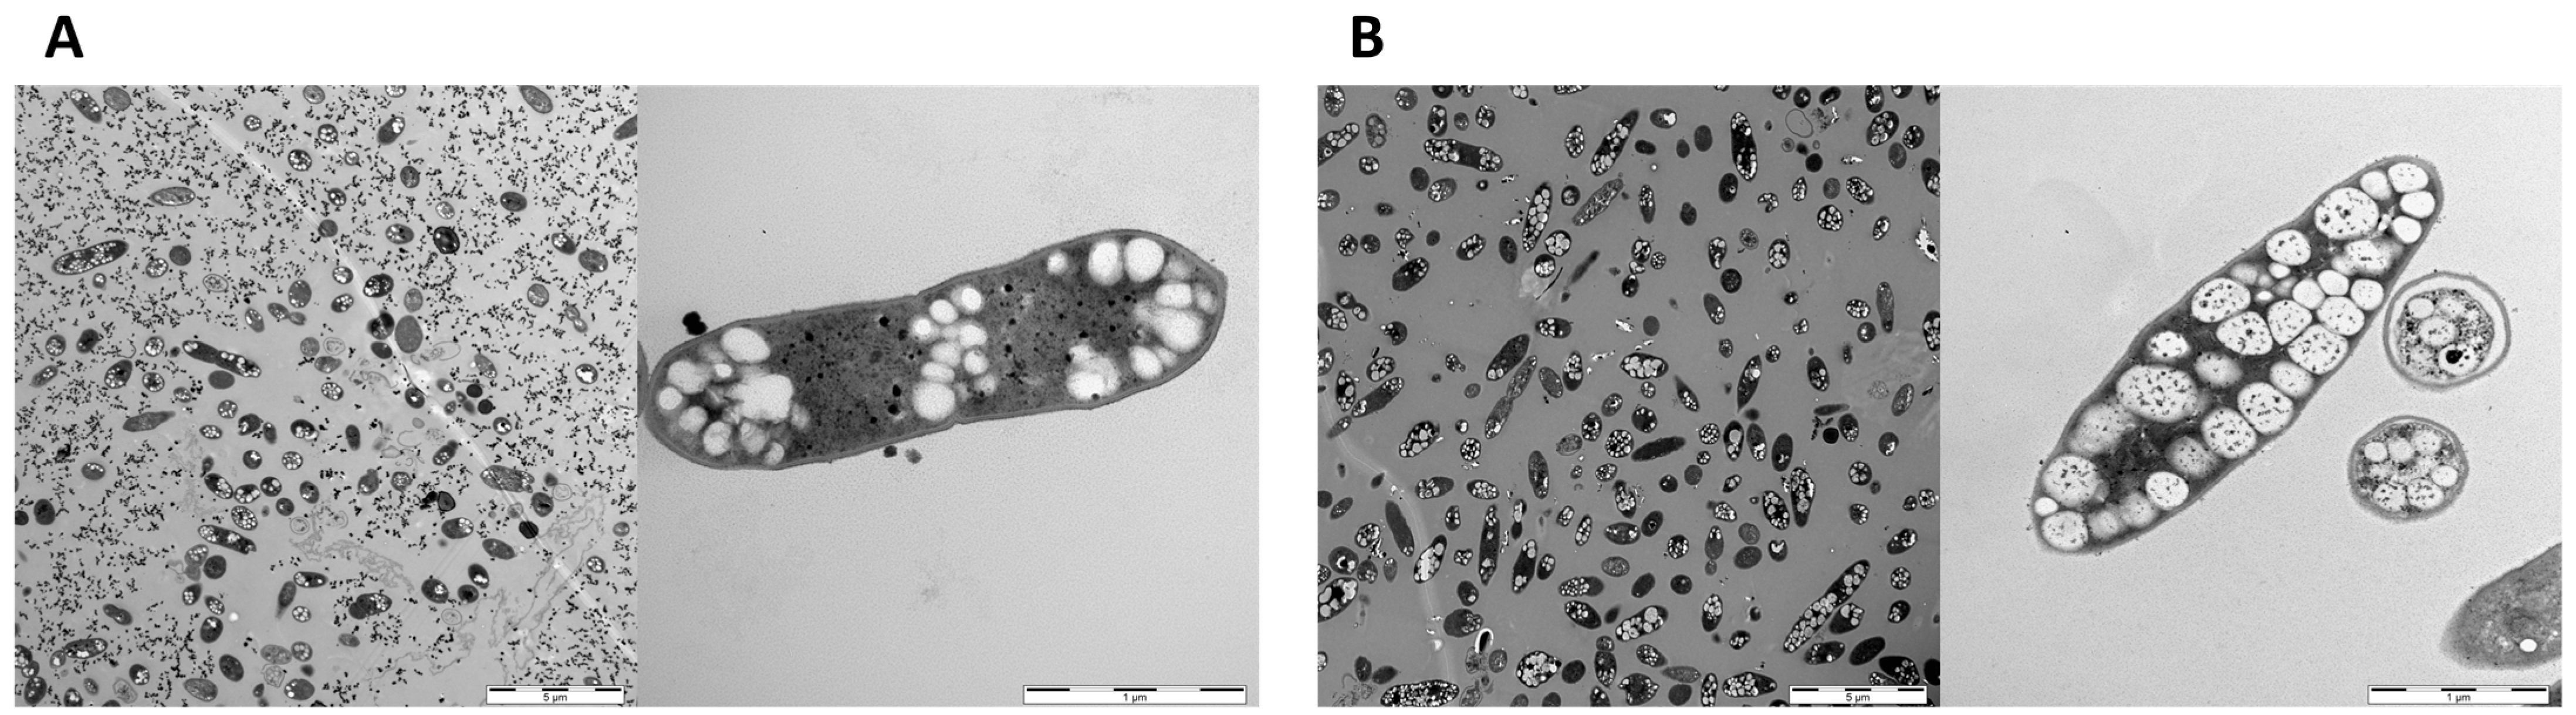
3.4. Visualization of PHB Granula in Recombinant A. Woodii
4. Discussion
Author Contributions
Funding
Institutional Review Board Statement
Informed Consent Statement
Data Availability Statement
Acknowledgments
Conflicts of Interest
References
- Tokiwa, Y.; Calbia, B.P.; Ugwu, C.U.; Aiba, S. Biodegradability of Plastics. Int. J. Mol. Sci. 2009, 10, 3722–3742. [Google Scholar] [CrossRef]
- Plastics—The Facts 2022. Available online: https://plasticseurope.org/de/knowledge-hub/plastics-the-facts-2022/ (accessed on 13 July 2023).
- What Are Bioplastics? Available online: https://www.european-bioplastics.org/bioplastics/ (accessed on 14 July 2023).
- Li, Z.; Yang, J.; Loh, X.J. Polyhydroxyalkanoates: Opening doors for a sustainable future. NPG Asia Mater. 2016, 8, e265. [Google Scholar] [CrossRef]
- Reddy, C.S.K.; Ghai, R.; Rashmi; Kalia, V.C. Polyhydroxyalkanoates: An overview. Bioresour. Technol. 2003, 87, 137–146. [Google Scholar] [CrossRef] [PubMed]
- Flüchter, S.; Follonier, S.; Schiel-Bengelsdorf, B.; Bengelsdorf, F.R.; Zinn, M.; Dürre, P. Anaerobic production of poly(3-hydroxybutyrate) and its precursor 3-hydroxybutyrate from synthesis gas by autotrophic clostridia. ACS Biomac. 2019, 20, 3271–3282. [Google Scholar] [CrossRef]
- Drake, H.; Gößner, A.S.; Daniel, S.L. Old acetogens, new light. Ann. N. Y. Acad. Sci. 2008, 1125, 100–128. [Google Scholar] [CrossRef]
- Reinecke, F.; Steinbüchel, A. Ralstonia eutropha strain H16 as model organism for PHA metabolism and for biotechnological production of technically interesting biopolymers. J. Mol. Biol. Biotechnol. 2009, 16, 91–108. [Google Scholar] [CrossRef]
- De Souza Pinto Lemgruber, R.; Valgepea, K.; Tappel, R.; Behrendorff, J.B.; Palfreyman, R.W.; Plan, M.; Hodson, M.P.; Simpson, S.D.; Nielsen, L.K.; Köpke, M.; et al. Systems-level engineering and characterisation of Clostridium autoethanogenum through heterologous production of poly-3-hydroxybutyrate (PHB). Metab. Eng. 2019, 53, 14–23. [Google Scholar] [CrossRef]
- Kettner, A.; Griehl, C. The use of LipidGreen2 for visualization and quantification of intracellular poly(3-hydroxybutyrate) in Cupriavidus necator. Biochem. Biophys. Rep. 2020, 24, 100819. [Google Scholar] [CrossRef]
- Brandl, H.; Gross, R.A.; Lenz, R.W.; Fuller, R.C. Pseudomonas oleovorans as a source of poly(β-hydroxyalkanoates) for potential applications as biodegradable polyesters. Appl. Environ. Microbiol. 1988, 54, 1977–1982. [Google Scholar] [CrossRef]
- Karr, D.B.; Waters, J.K.; Emerich, D.W. Analysis of poly-β-hydroxybutyrate in Rhizobium japonicum bacteroids by ion-exclusion high-pressure liquid chromatography and UV detection. Appl. Environ. Microbiol. 1983, 46, 1339–1344. [Google Scholar] [CrossRef]
- Chun, H.-S.; Jeon, H.; Pagire, H.S.; Lee, J.H.; Chung, H.-C.; Park, M.J.; So, J.-H.; Ryu, J.-H.; Kim, C.-H.; Ahn, J.H.; et al. Synthesis of LipidGreen2 and its application in lipid and fatty liver imaging. Mol. Biosyst. 2013, 9, 630–633. [Google Scholar] [CrossRef]
- Kettner, A.; Noll, M.; Griehl, C. In situ quantification of poly(3-hydroxybutyrate) and biomass in Cupriavidus necator by fluorescence spectroscopic assay. Appl. Microbiol. Biotechnol. 2022, 106, 635–645. [Google Scholar] [CrossRef]
- Green, M.R.; Sambrook, J. Molecular Cloning: A laboratory Manual, 4th ed.; Cold Spring Harbor Laboratory Press: New York, NY, USA, 2012. [Google Scholar]
- Hoffmeister, S.; Gerdom, M.; Bengelsdorf, F.R.; Linder, S.; Flüchter, S.; Öztürk, H.; Blümke, W.; May, A.; Fischer, R.-J.; Bahl, H.; et al. Acetone production with metabolically engineered strains of Acetobacterium woodii. Metabol. Eng. 2016, 36, 37–47. [Google Scholar] [CrossRef] [PubMed]
- Schlegel, H.G.; Gottschalk, G.; von Bartha, R. Formation and utilization of poly-β-hydroxybutyric acid by Knallgas bacteria (Hydrogenomonas). Nature 1961, 191, 463–464. [Google Scholar] [CrossRef]
- McAdam, B.; Fournet, M.B.; McDonald, P.; Mojicevic, M. Production of polyhydroxybutyrate (PHB) and factors impacting its chemical and mechanical properties. Polymers 2020, 12, 2908. [Google Scholar] [CrossRef] [PubMed]
- Horowitz, D.M.; Sanders, J.K.M. Amorphous, biomimetic granules of polyhydroxybutyrate: Preparation, characterization, and biological implications. J. Am. Chem. Soc. 1994, 116, 2695–2702. [Google Scholar] [CrossRef]
- Evans, J.D.; Sikdar, S.K. Biodegradable plastics: An idea whose time has come? Chem. Technol. 1990, 20, 38–42. [Google Scholar]
- Kavitha, G.; Rengasamy, R.; Inbakandan, D. Polyhydroxybutyrate from marine source and its application. Biomac 2018, 111, 102–108. [Google Scholar] [CrossRef]
- Verlinden, R.A.J.; Hill, D.J.; Kenward, M.A.; Williams, C.D.; Radecka, I. Bacterial synthesis of biodegradable polyhydroxyalkanoates. J. Appl. Microbiol. 2007, 102, 1437–1449. [Google Scholar] [CrossRef]
- Steinbüchel, A.; Schlegel, H.G. Physiology and molecular genetics of poly(β-hydroxyalkanoic acid) synthesis in Alcaligenes eutrophus. Mol. Microbiol. 1991, 5, 535–542. [Google Scholar] [CrossRef]
- López-Abelairas, M.; García-Torreiro, M.; Lú-Chau, T.; Lema, J.M.; Steinbüchel, A. Comparison of several methods for the separation of poly(3-hydroxybutyrate) from Cupriavidus necator H16 cultures. Biochem. Eng. J. 2015, 93, 250–259. [Google Scholar] [CrossRef]
- Sichwart, S.; Hetzler, S.; Bröker, D.; Steinbüchel, A. Extension of the substrate utilization range of Ralstonia eutropha strain H16 by metabolic engineering to include mannose and glucose. Appl. Environ. Microb. 2011, 77, 1325–1334. [Google Scholar] [CrossRef]
- Zhang, L.; Jiang, Z.; Tsui, T.-H.; Loh, K.-C.; Dai, Y.; Tong, Y.W. A review on enhancing Cupriavidus necator fermentation for poly(3-hydroxybutyrate) (PHB) production from low-cost carbon sources. Front. Bioeng. Biotechnol. 2022, 10, 946085. [Google Scholar] [CrossRef] [PubMed]
- Garcia-Gonzalez, L.; Mozumder, M.S.I.; Dubreuil, M.; Volcke, E.I.P.; De Wever, H. Sustainable autotrophic production of polyhydroxybutyrate (PHB) from CO2 using a two-stage cultivation system. Catal. Today 2015, 257, 237–245. [Google Scholar] [CrossRef]
- Pötter, M.; Müller, H.; Reinecke, F.; Wieczorek, R.; Fricke, F.; Bowien, B.; Friedrich, B.; Steinbüchel, A. The complex structure of polyhydroxybutyrate (PHB) granules: Four orthologous and paralogous phasin occur in Ralstonia eutropha. Microbiology 2004, 150, 2301–2311. [Google Scholar] [CrossRef]
- Mezzina, M.P.; Pettinari, M.J. Phasins, multifaceted polyhydroxyalkanoate granule-associated proteins. Appl. Environ. Microbiol. 2016, 82, 5060–5067. [Google Scholar] [CrossRef]
- Bredwell, M.D.; Srivastava, P.; Worden, R.M. Reactor design issues for synthesis-gas fermentations. Biotechnol. Prog. 1999, 15, 834–844. [Google Scholar] [CrossRef]
- Steger, F.; Rachbauer, L.; Windhagauer, M.; Montgomery, L.F.R.; Bochmann, G. Optimisation of continuous gas fermentation by immobilisation of acetate-producing Acetobacterium woodii. Anaerobe 2017, 46, 96–103. [Google Scholar] [CrossRef]
- Straub, M.; Demler, M.; Weuster-Botz, D.; Dürre, P. Selective enhancement of autotrophic acetate production with genetically modified Acetobacterium woodii. J. Biotechnol. 2014, 178, 67–72. [Google Scholar] [CrossRef]
- Kantzow, C.; Weuster-Botz, D. Effects of hydrogen partial pressure on autotrophic growth and product formation of Acetobacterium woodii. Bioprocess Biosyst. Eng. 2016, 39, 1325–1330. [Google Scholar] [CrossRef]


| Strain | Genotype | Origin |
|---|---|---|
| E. coli XL1-Blue MRF’ | Δ (mcrA)183 Δ (mcrCB-hsd SMR-mrr)173 endA1 supE44 thi-1recA1 gyrA96 relA1 lac [F’proAB lacIq ZΔM15 Tn10 (TetR)] | Agilent Technologies (Santa Clara, CA, USA) |
| A. woodii DSM 1030 | type strain | German Collection of Microorganisms and Cell Cultures (DSMZ, Brunswick, Germany) |
Disclaimer/Publisher’s Note: The statements, opinions and data contained in all publications are solely those of the individual author(s) and contributor(s) and not of MDPI and/or the editor(s). MDPI and/or the editor(s) disclaim responsibility for any injury to people or property resulting from any ideas, methods, instructions or products referred to in the content. |
© 2023 by the authors. Licensee MDPI, Basel, Switzerland. This article is an open access article distributed under the terms and conditions of the Creative Commons Attribution (CC BY) license (https://creativecommons.org/licenses/by/4.0/).
Share and Cite
Höfele, F.; Dürre, P. Production of Potential Substitutes for Conventional Plastics Using Metabolically Engineered Acetobacterium woodii. Fermentation 2023, 9, 799. https://doi.org/10.3390/fermentation9090799
Höfele F, Dürre P. Production of Potential Substitutes for Conventional Plastics Using Metabolically Engineered Acetobacterium woodii. Fermentation. 2023; 9(9):799. https://doi.org/10.3390/fermentation9090799
Chicago/Turabian StyleHöfele, Franziska, and Peter Dürre. 2023. "Production of Potential Substitutes for Conventional Plastics Using Metabolically Engineered Acetobacterium woodii" Fermentation 9, no. 9: 799. https://doi.org/10.3390/fermentation9090799
APA StyleHöfele, F., & Dürre, P. (2023). Production of Potential Substitutes for Conventional Plastics Using Metabolically Engineered Acetobacterium woodii. Fermentation, 9(9), 799. https://doi.org/10.3390/fermentation9090799