
Exploring Anaerobic Digestion from Mesophilic to Thermophilic Temperatures—Operational and Microbial Aspects


Abstract
:
1. Introduction
2. Materials and Methods
2.1. Substrate
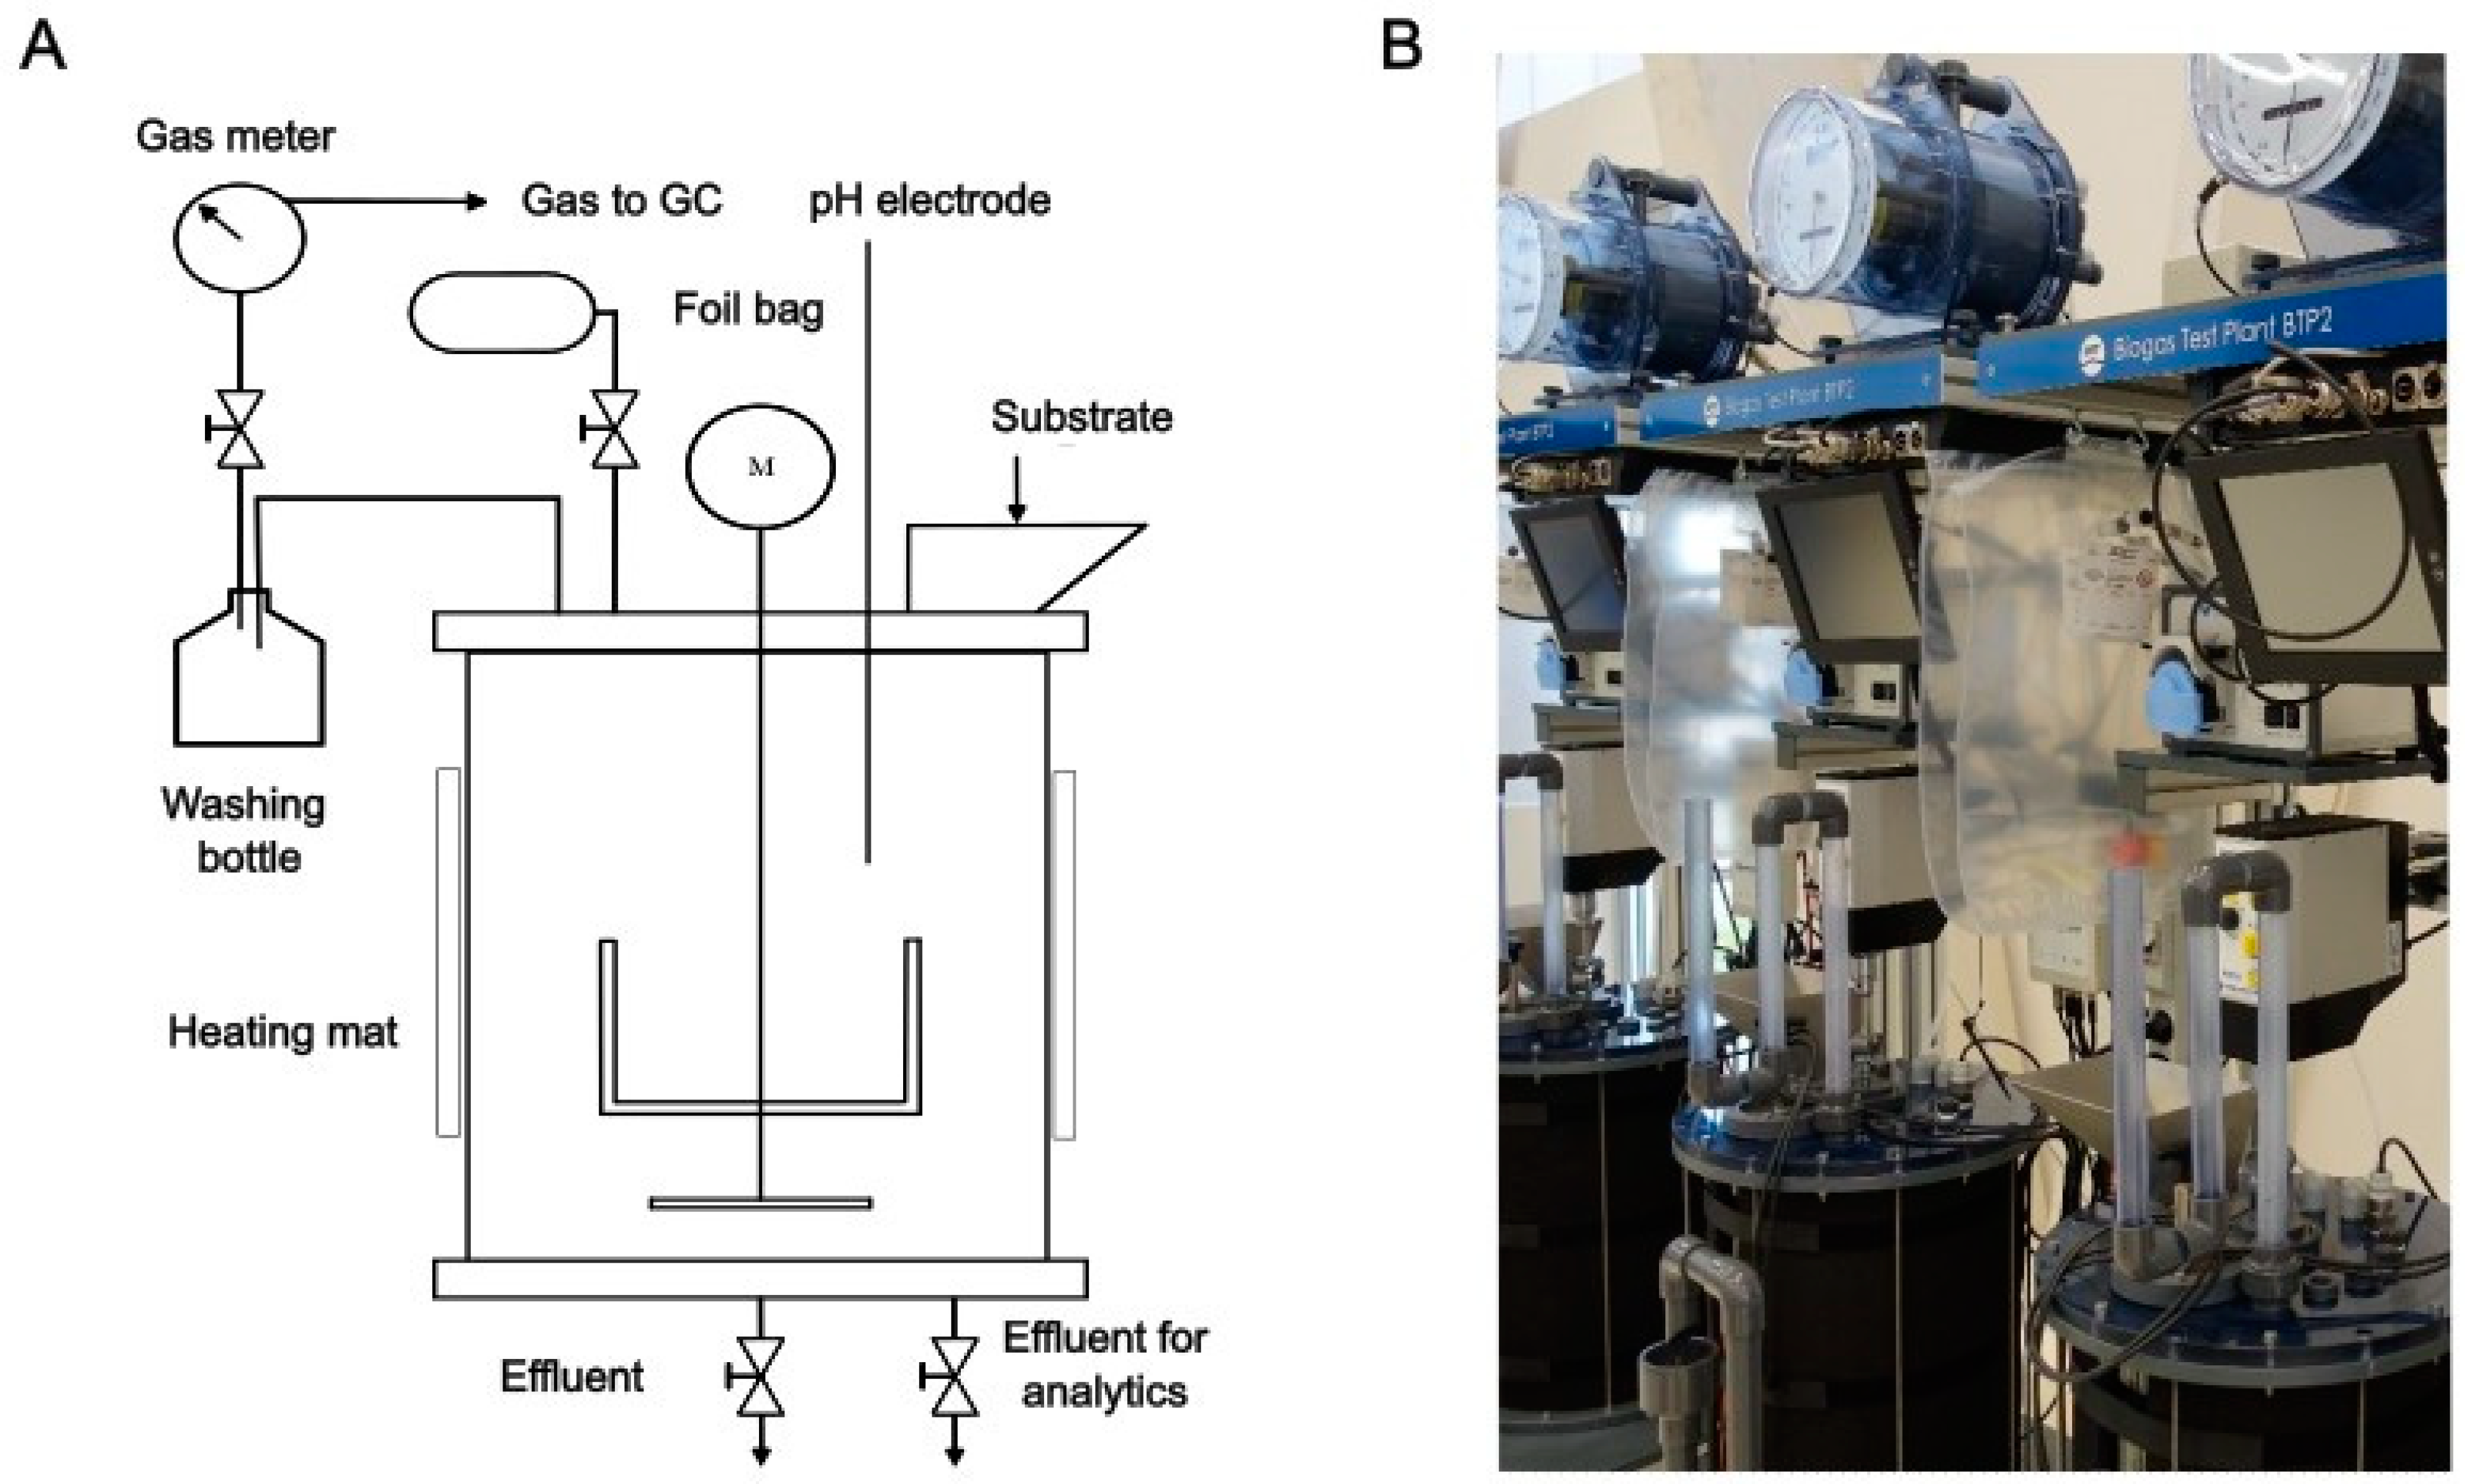
2.2. Design and Operation of Lab Digesters
2.3. Analysis
2.3.1. Operation of the Lab Digesters
2.3.2. DNA Extraction
2.3.3. Amplicon Sequencing
2.4. Calculations
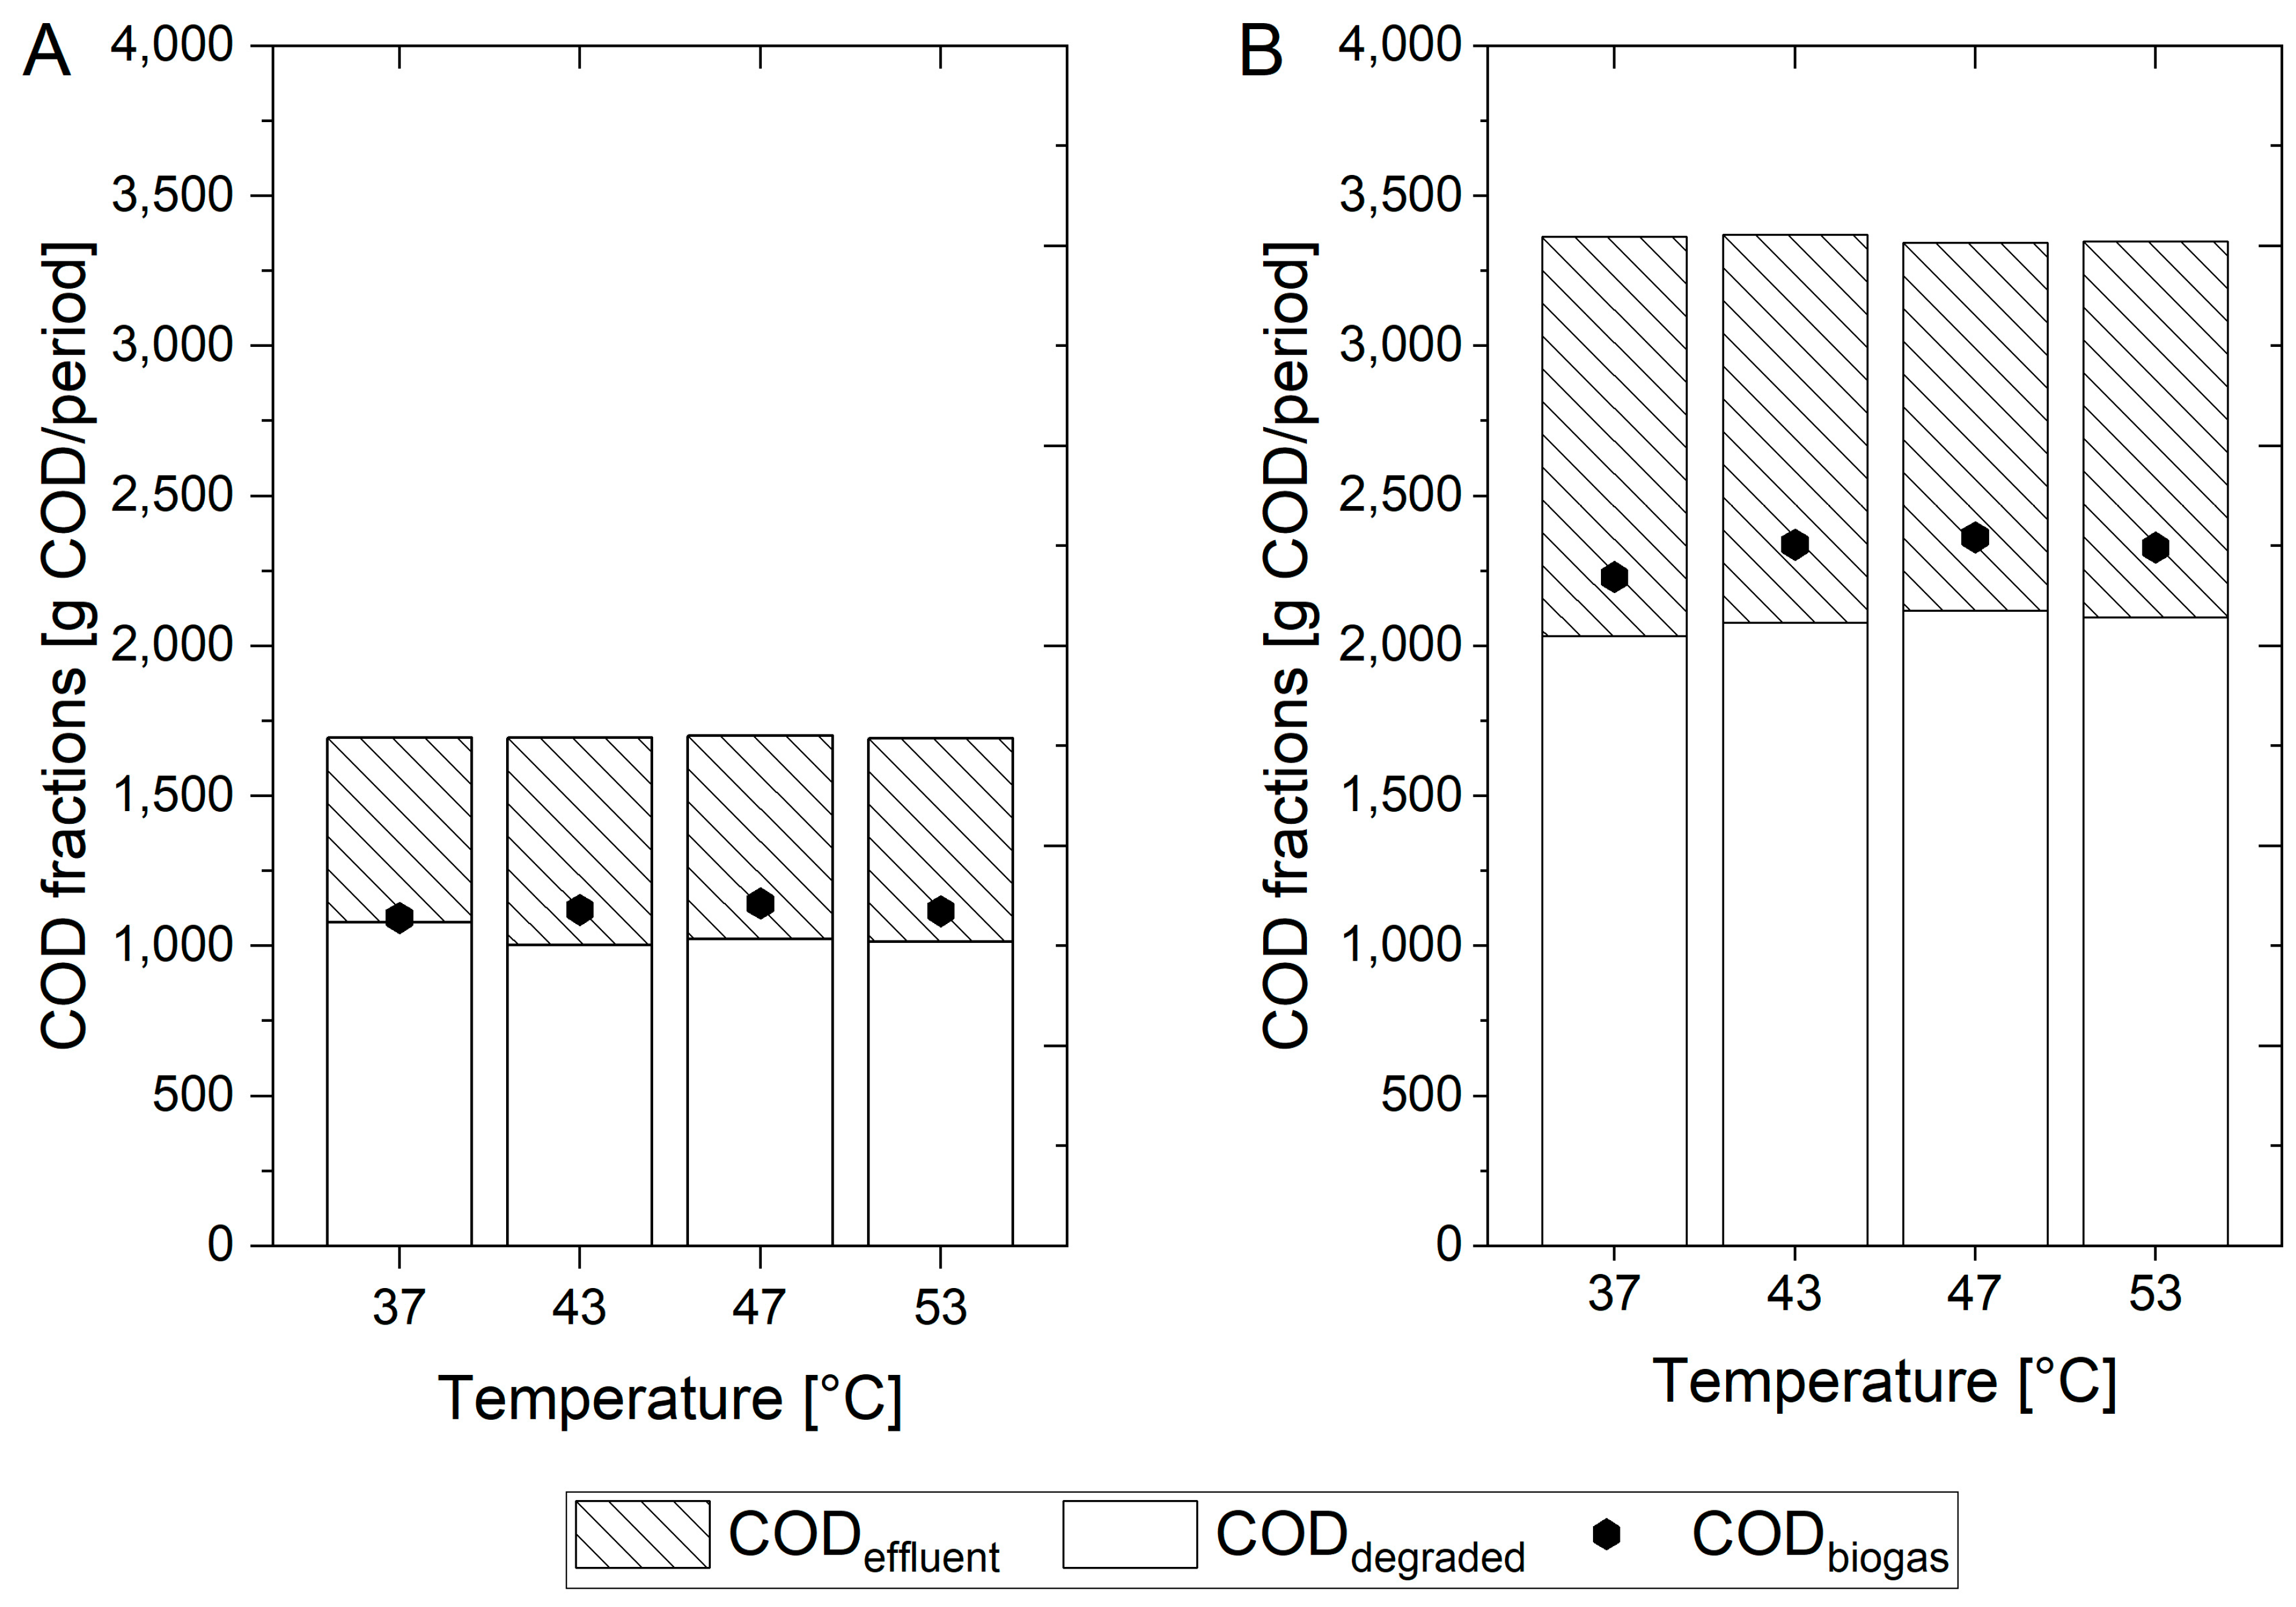
2.4.1. COD Balances
2.4.2. Statistical Analyses
2.4.3. Microbiome Analyses
3. Results and Discussion
3.1. Performance of the Lab Digesters
3.1.1. COD Balances of Lab Digesters
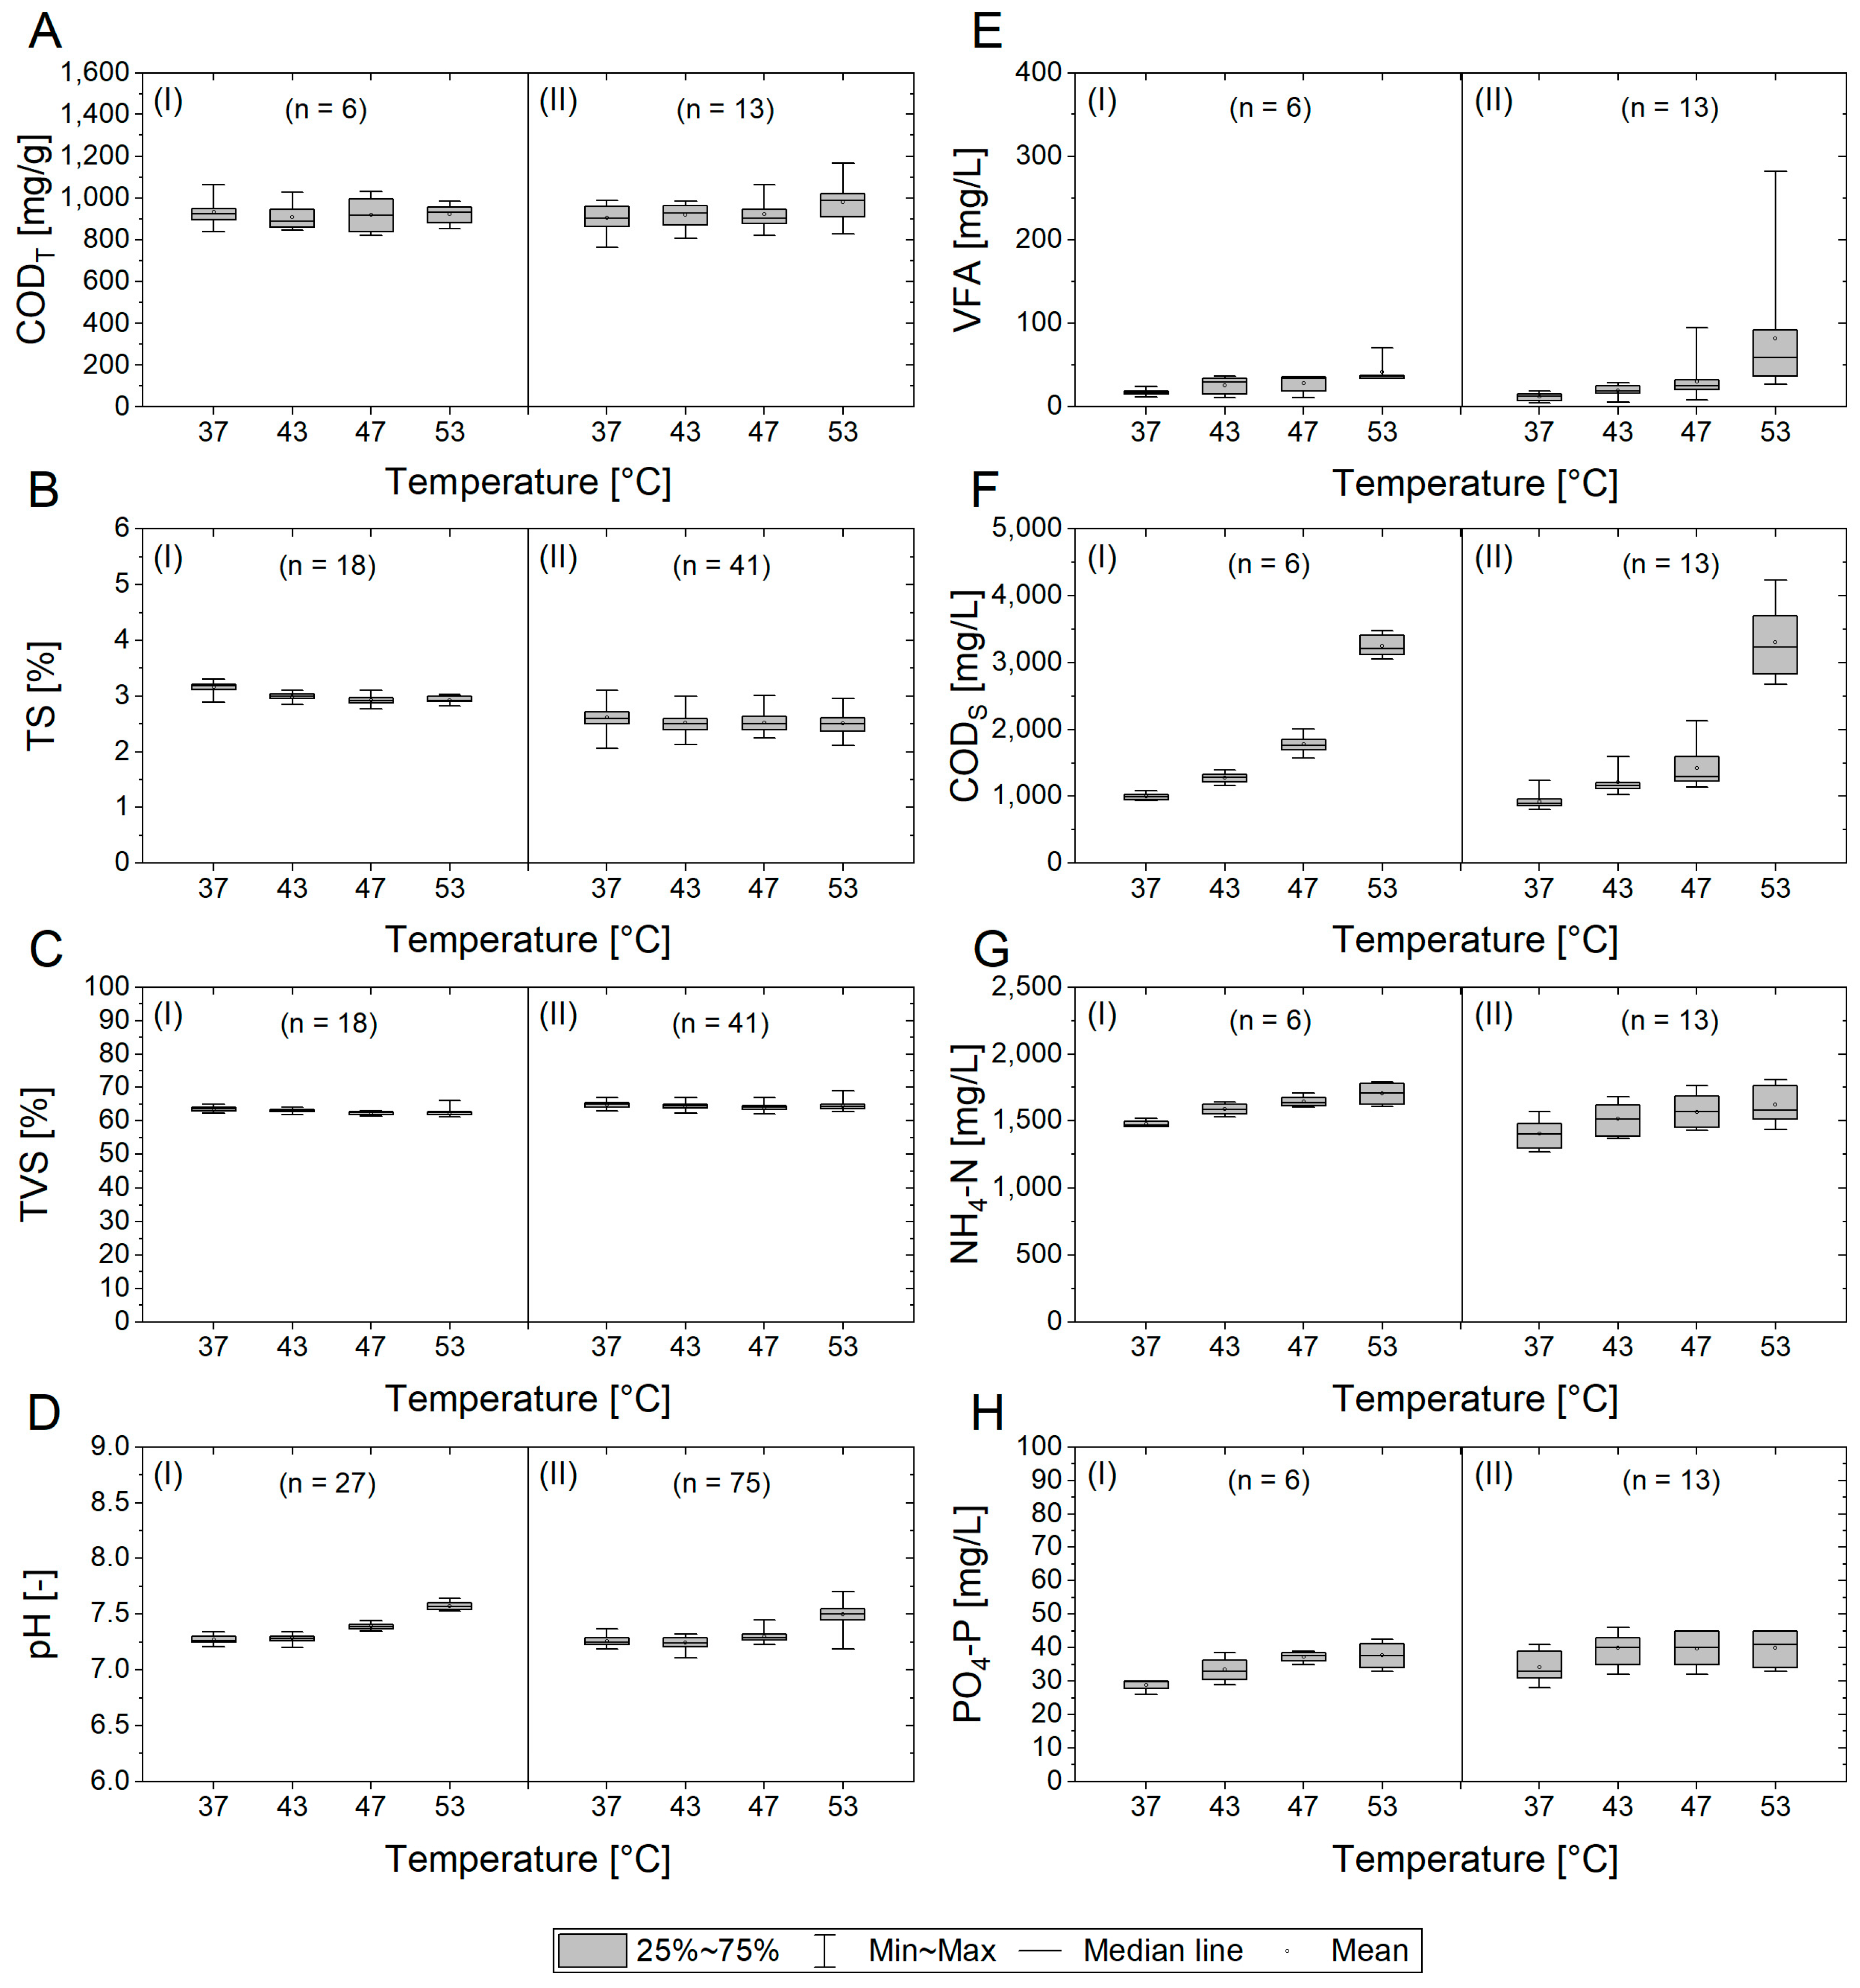
3.1.2. Physicochemical Parameters
3.1.3. Organic Acids and Alkalinity as Indicators for Process Stability
3.2. Microbial Community Analysis
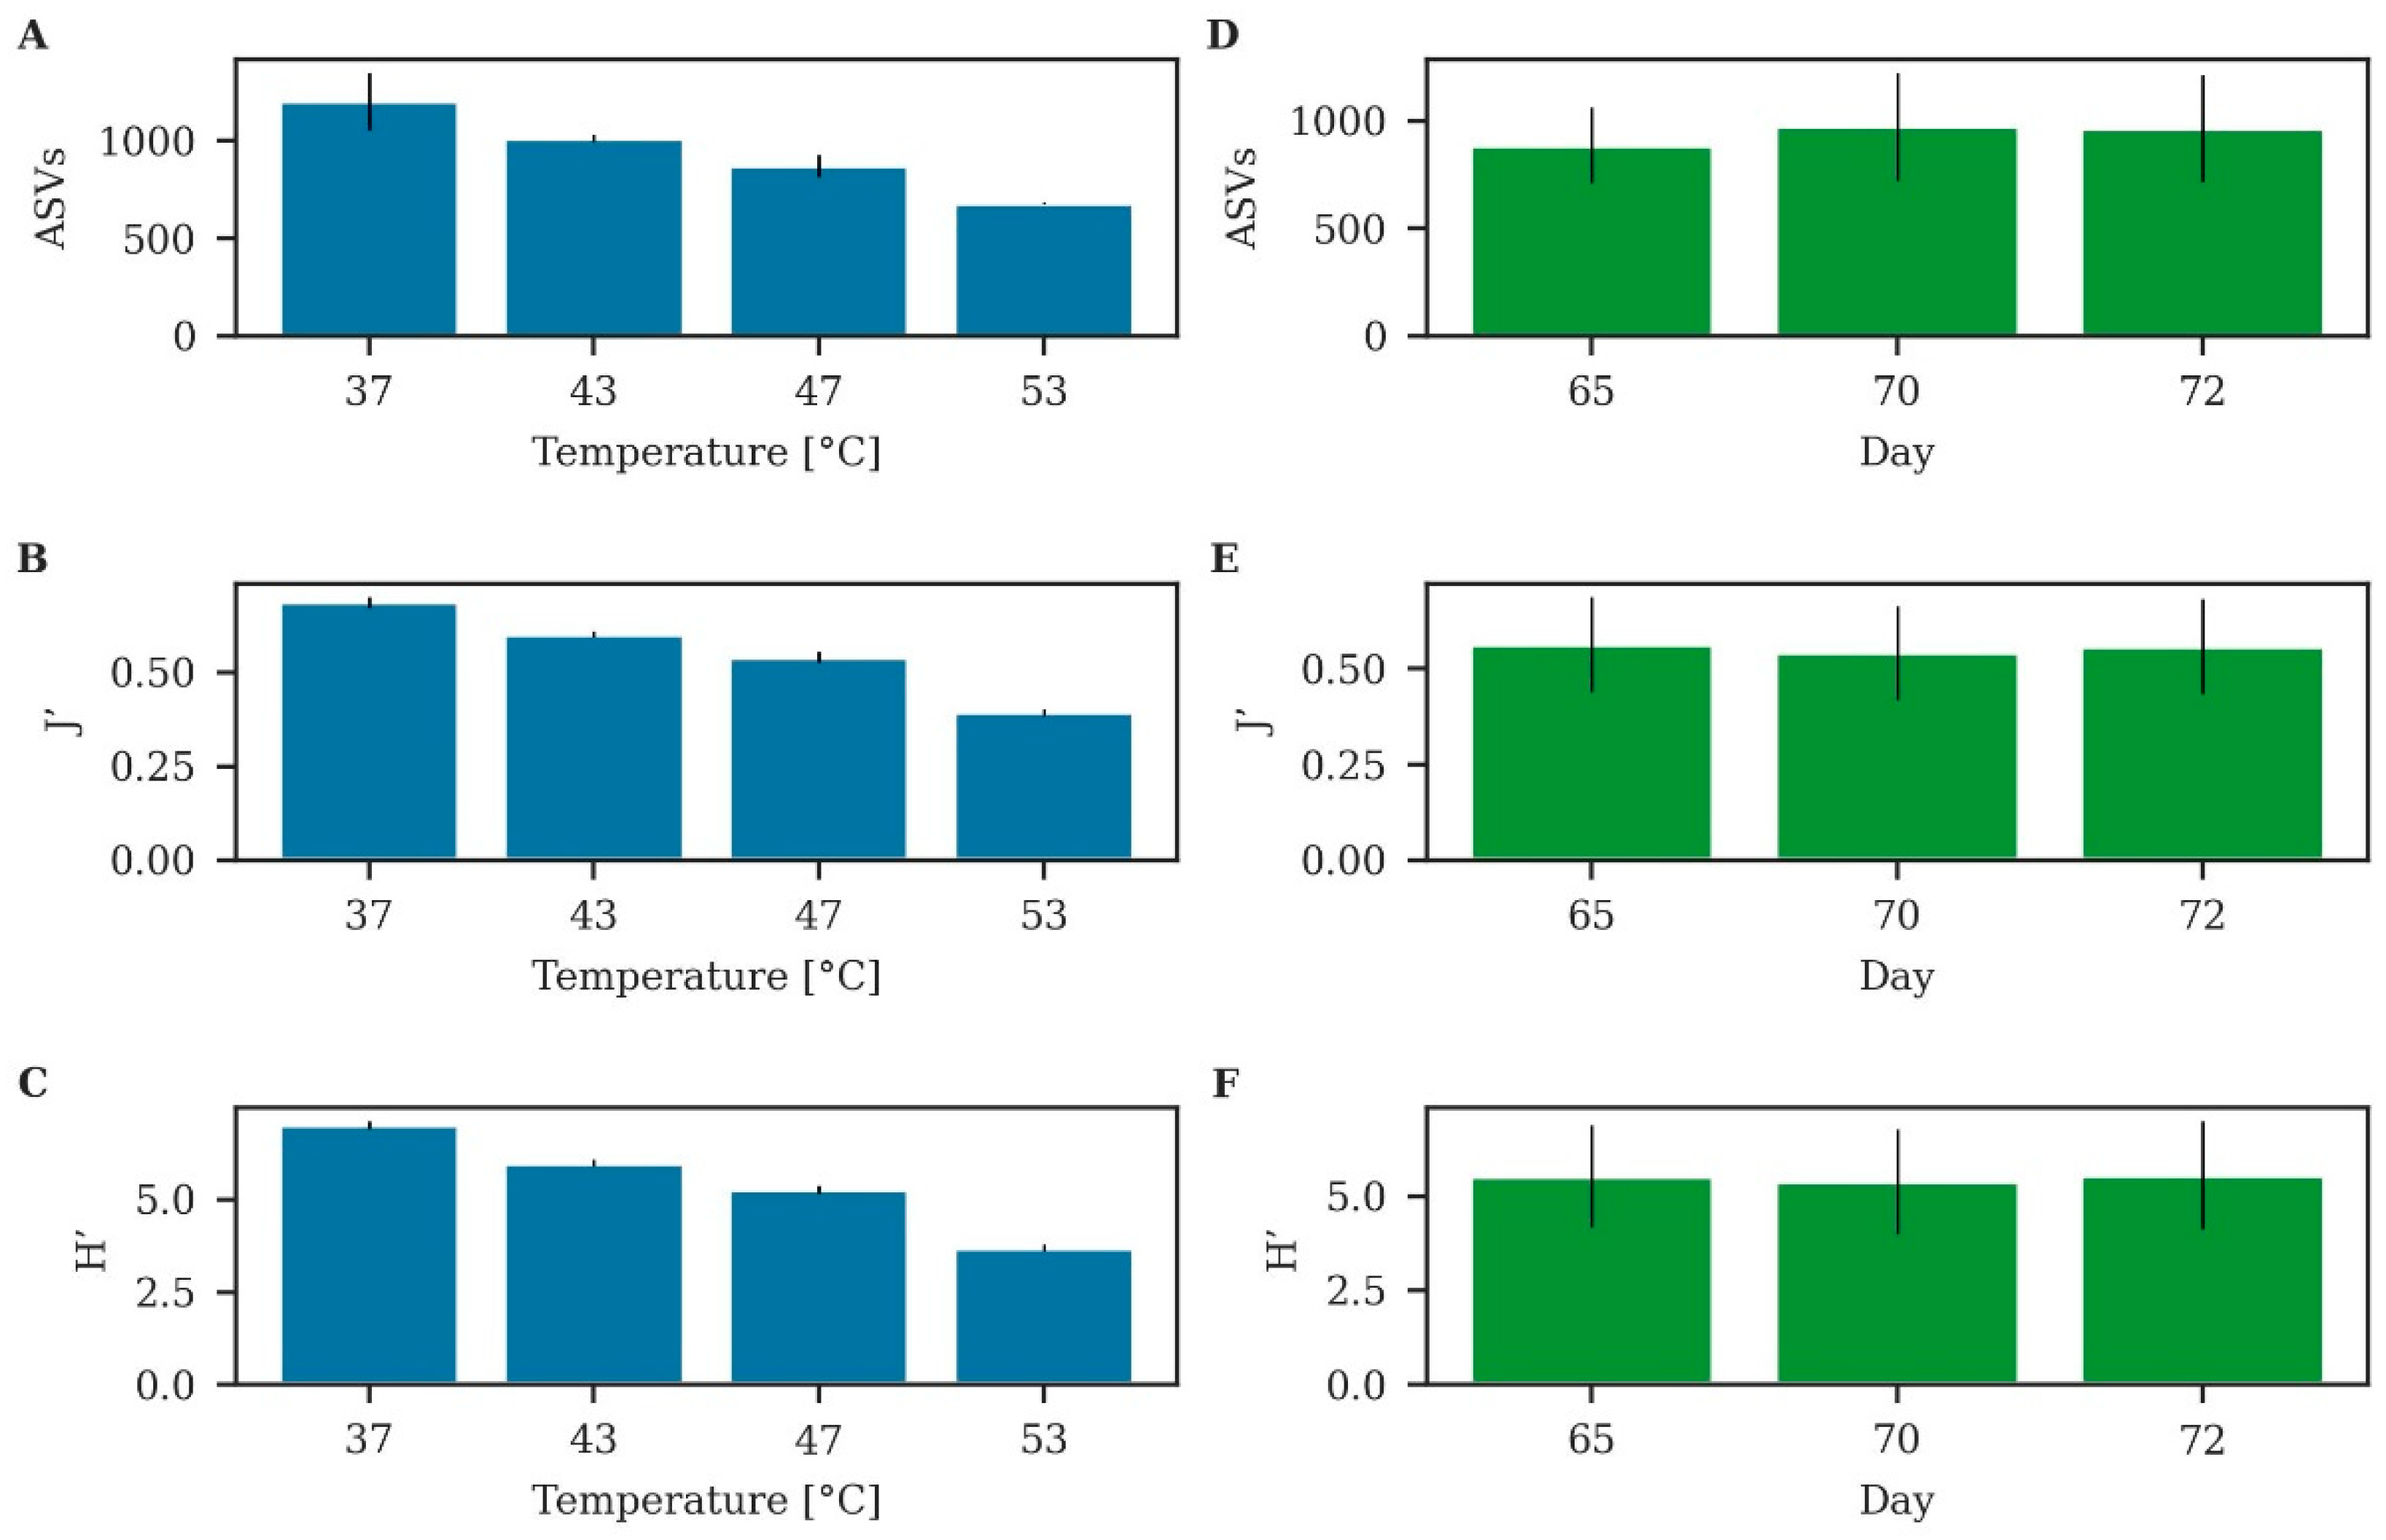
3.2.1. Microbial Diversity
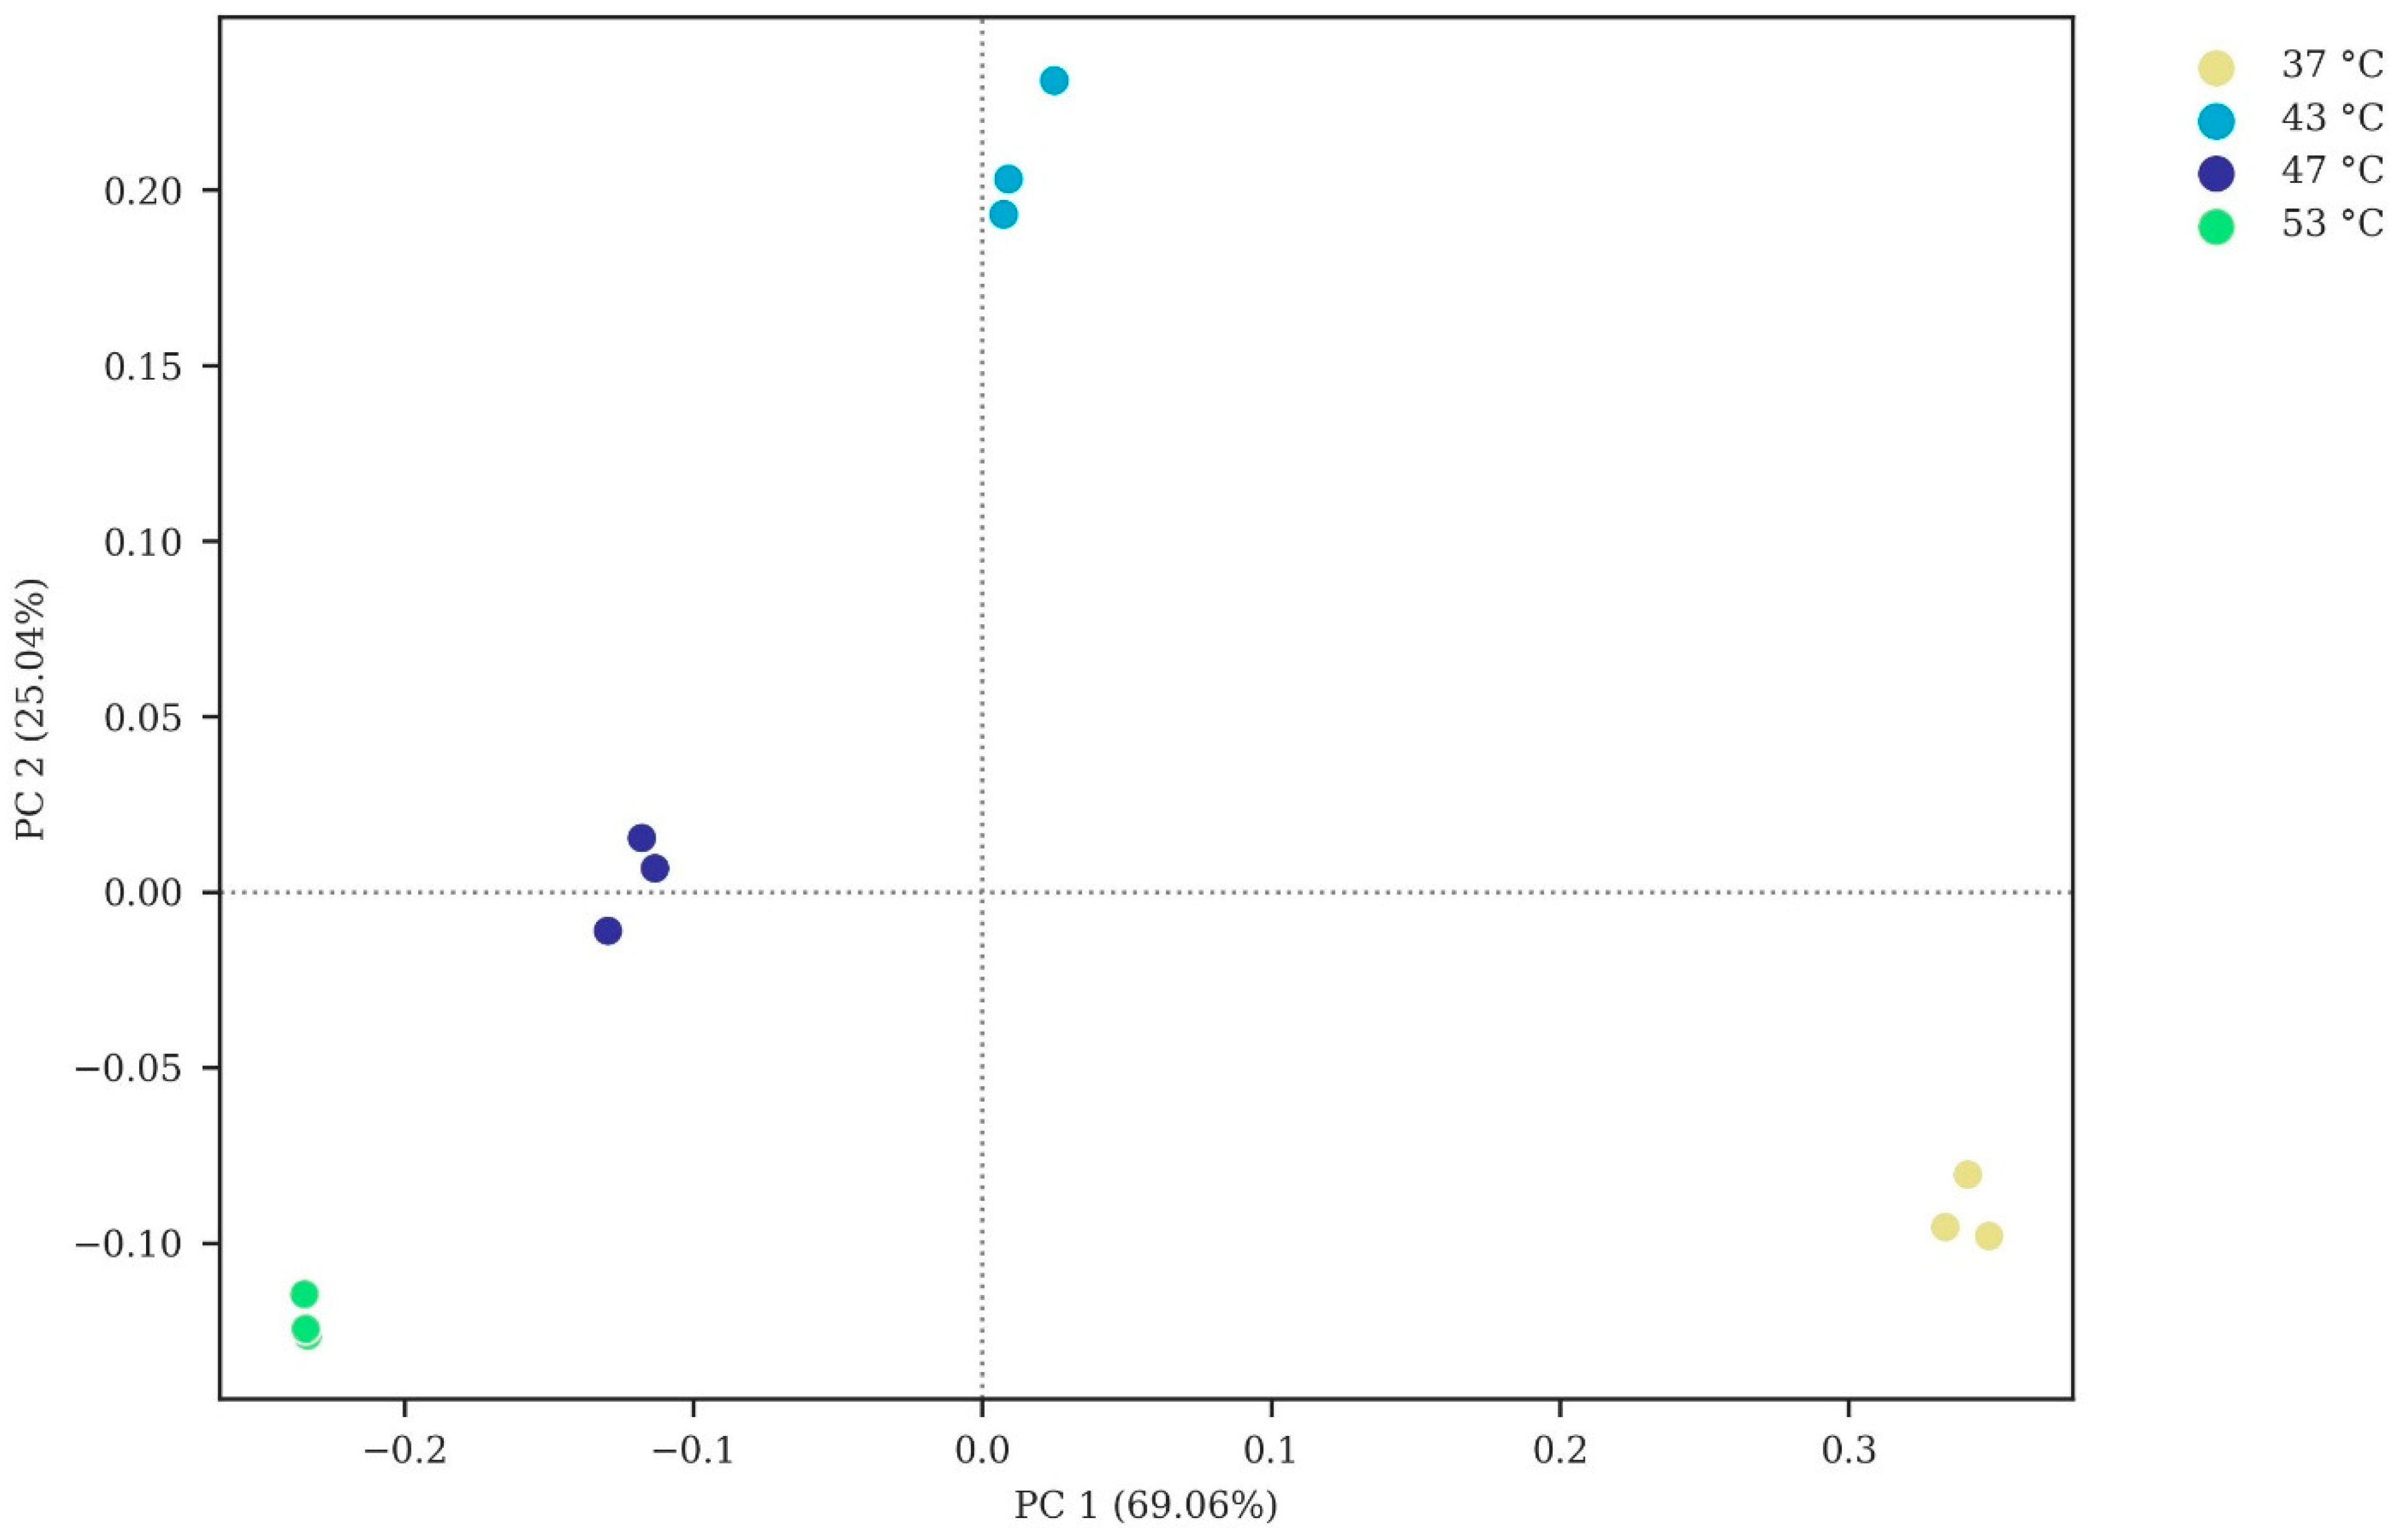
3.2.2. Microbial Community Composition
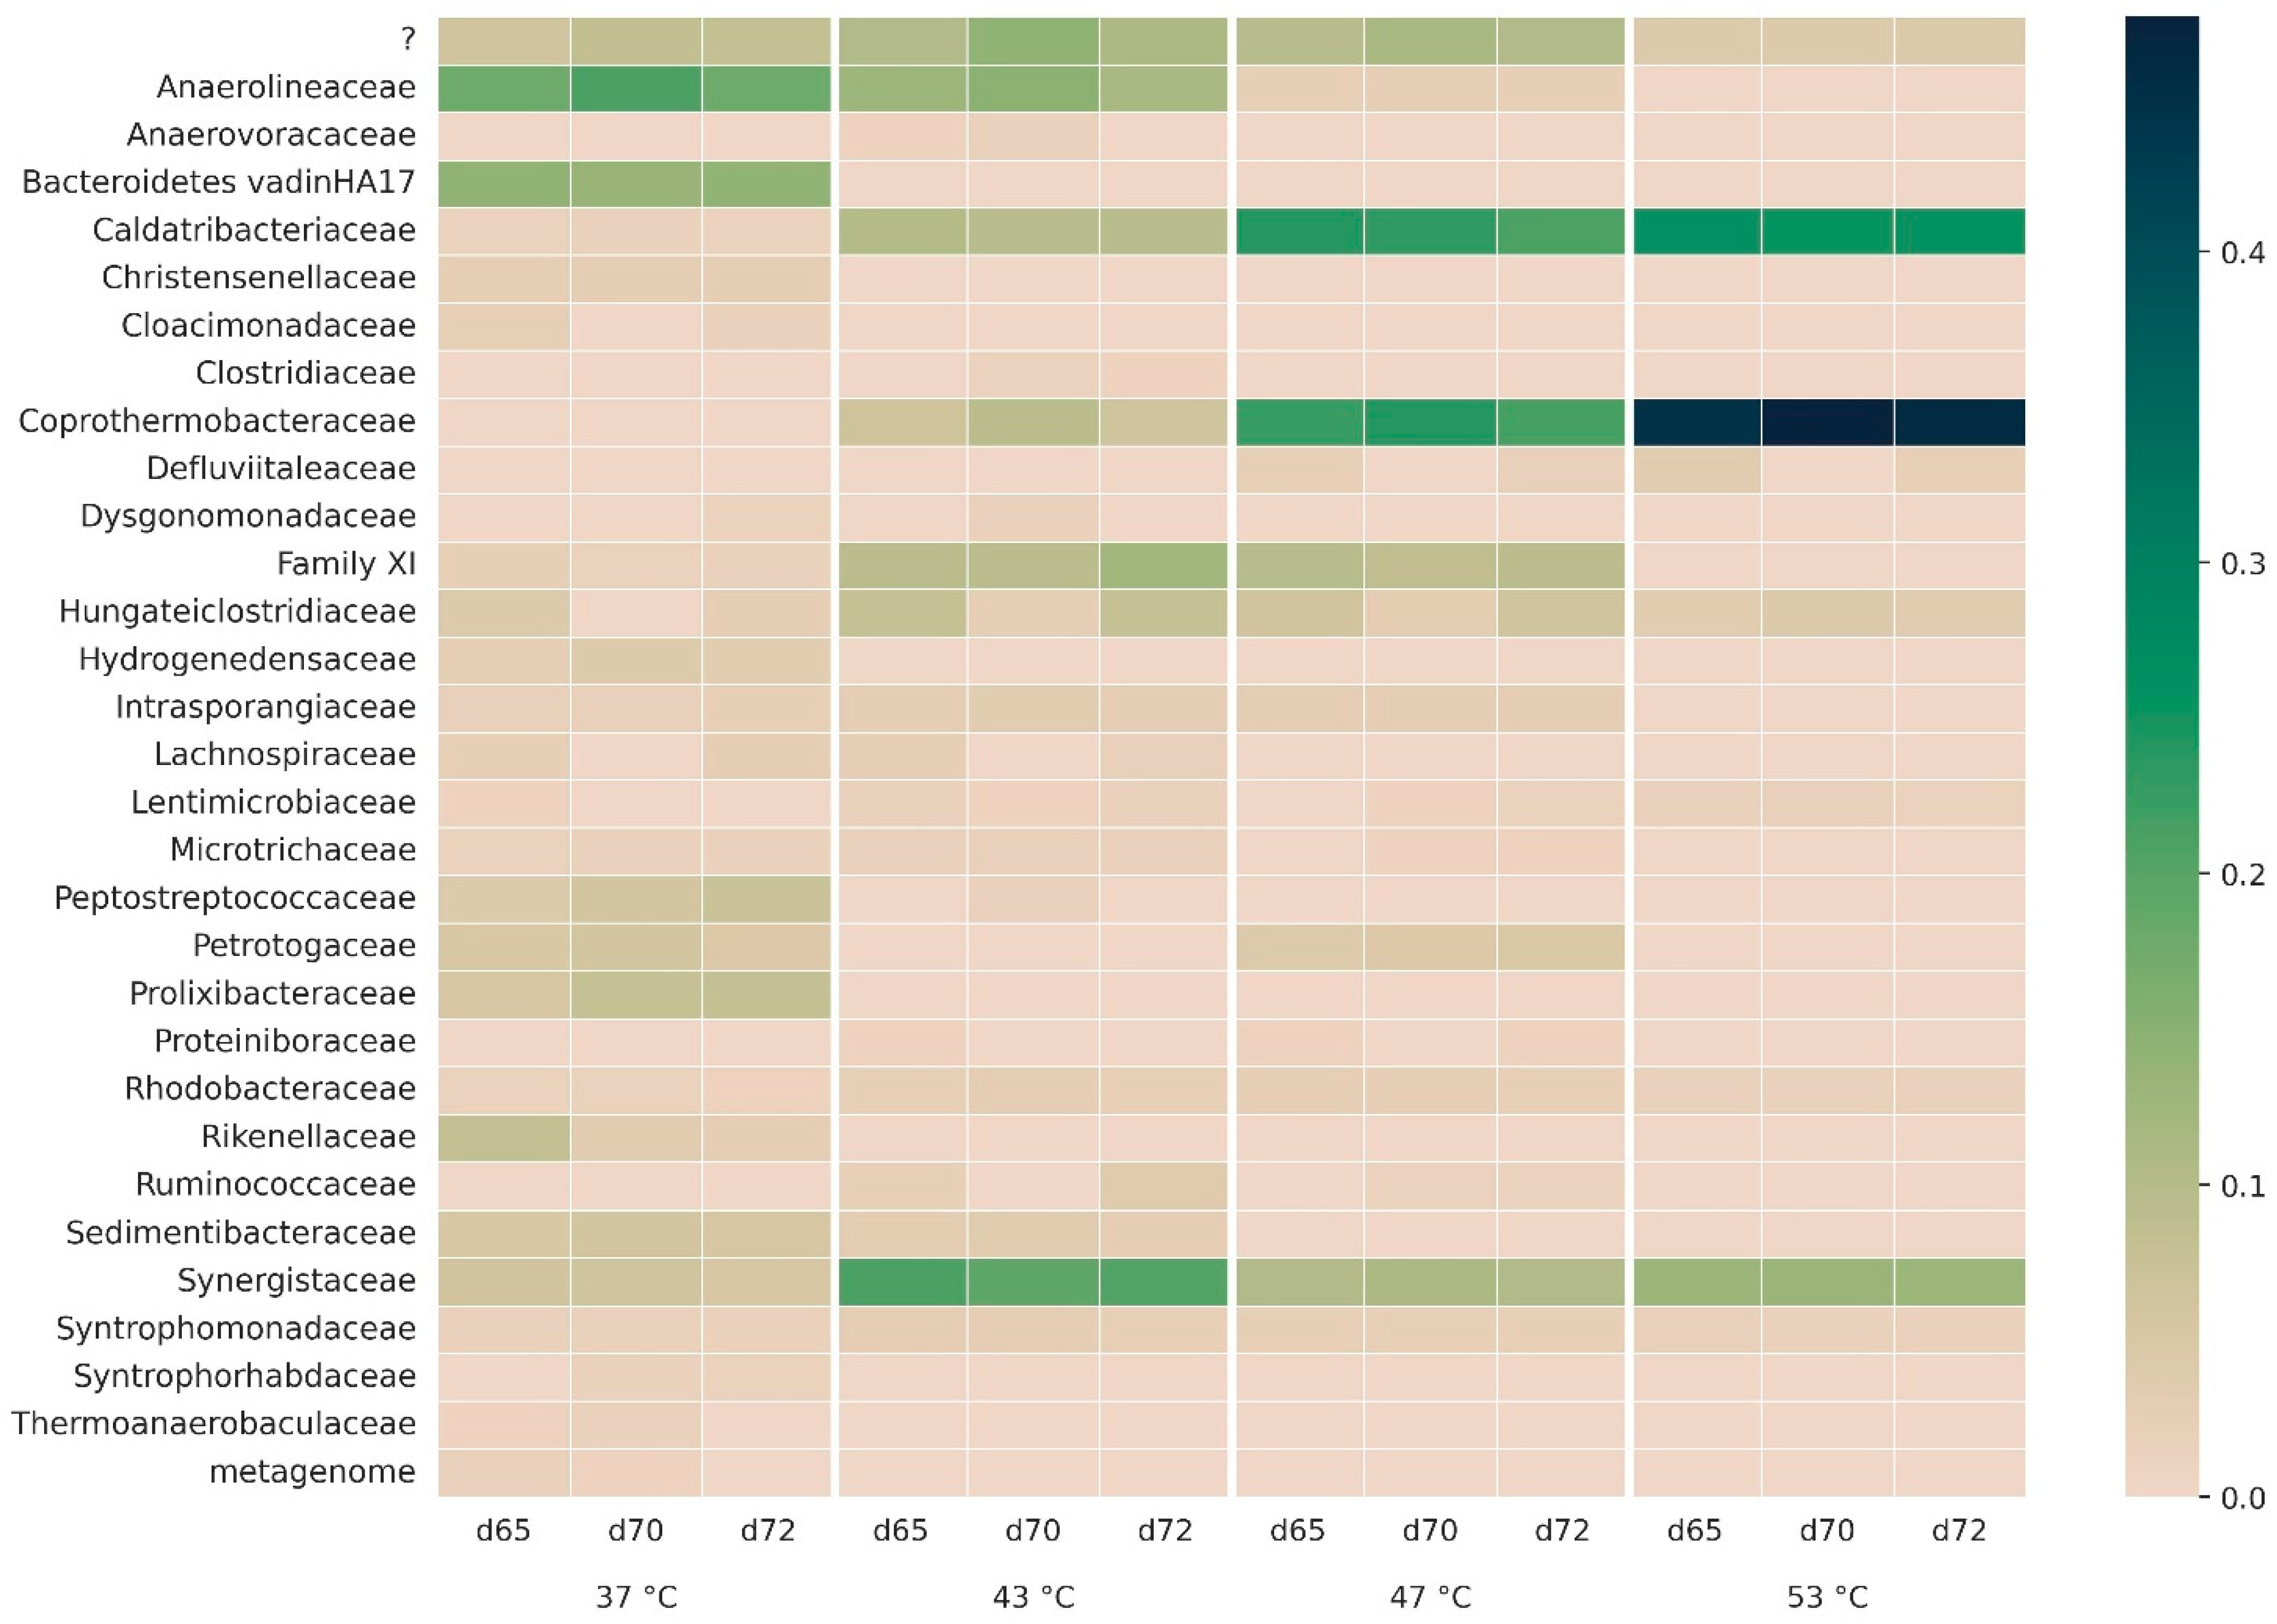
3.2.3. Bacterial Taxonomy
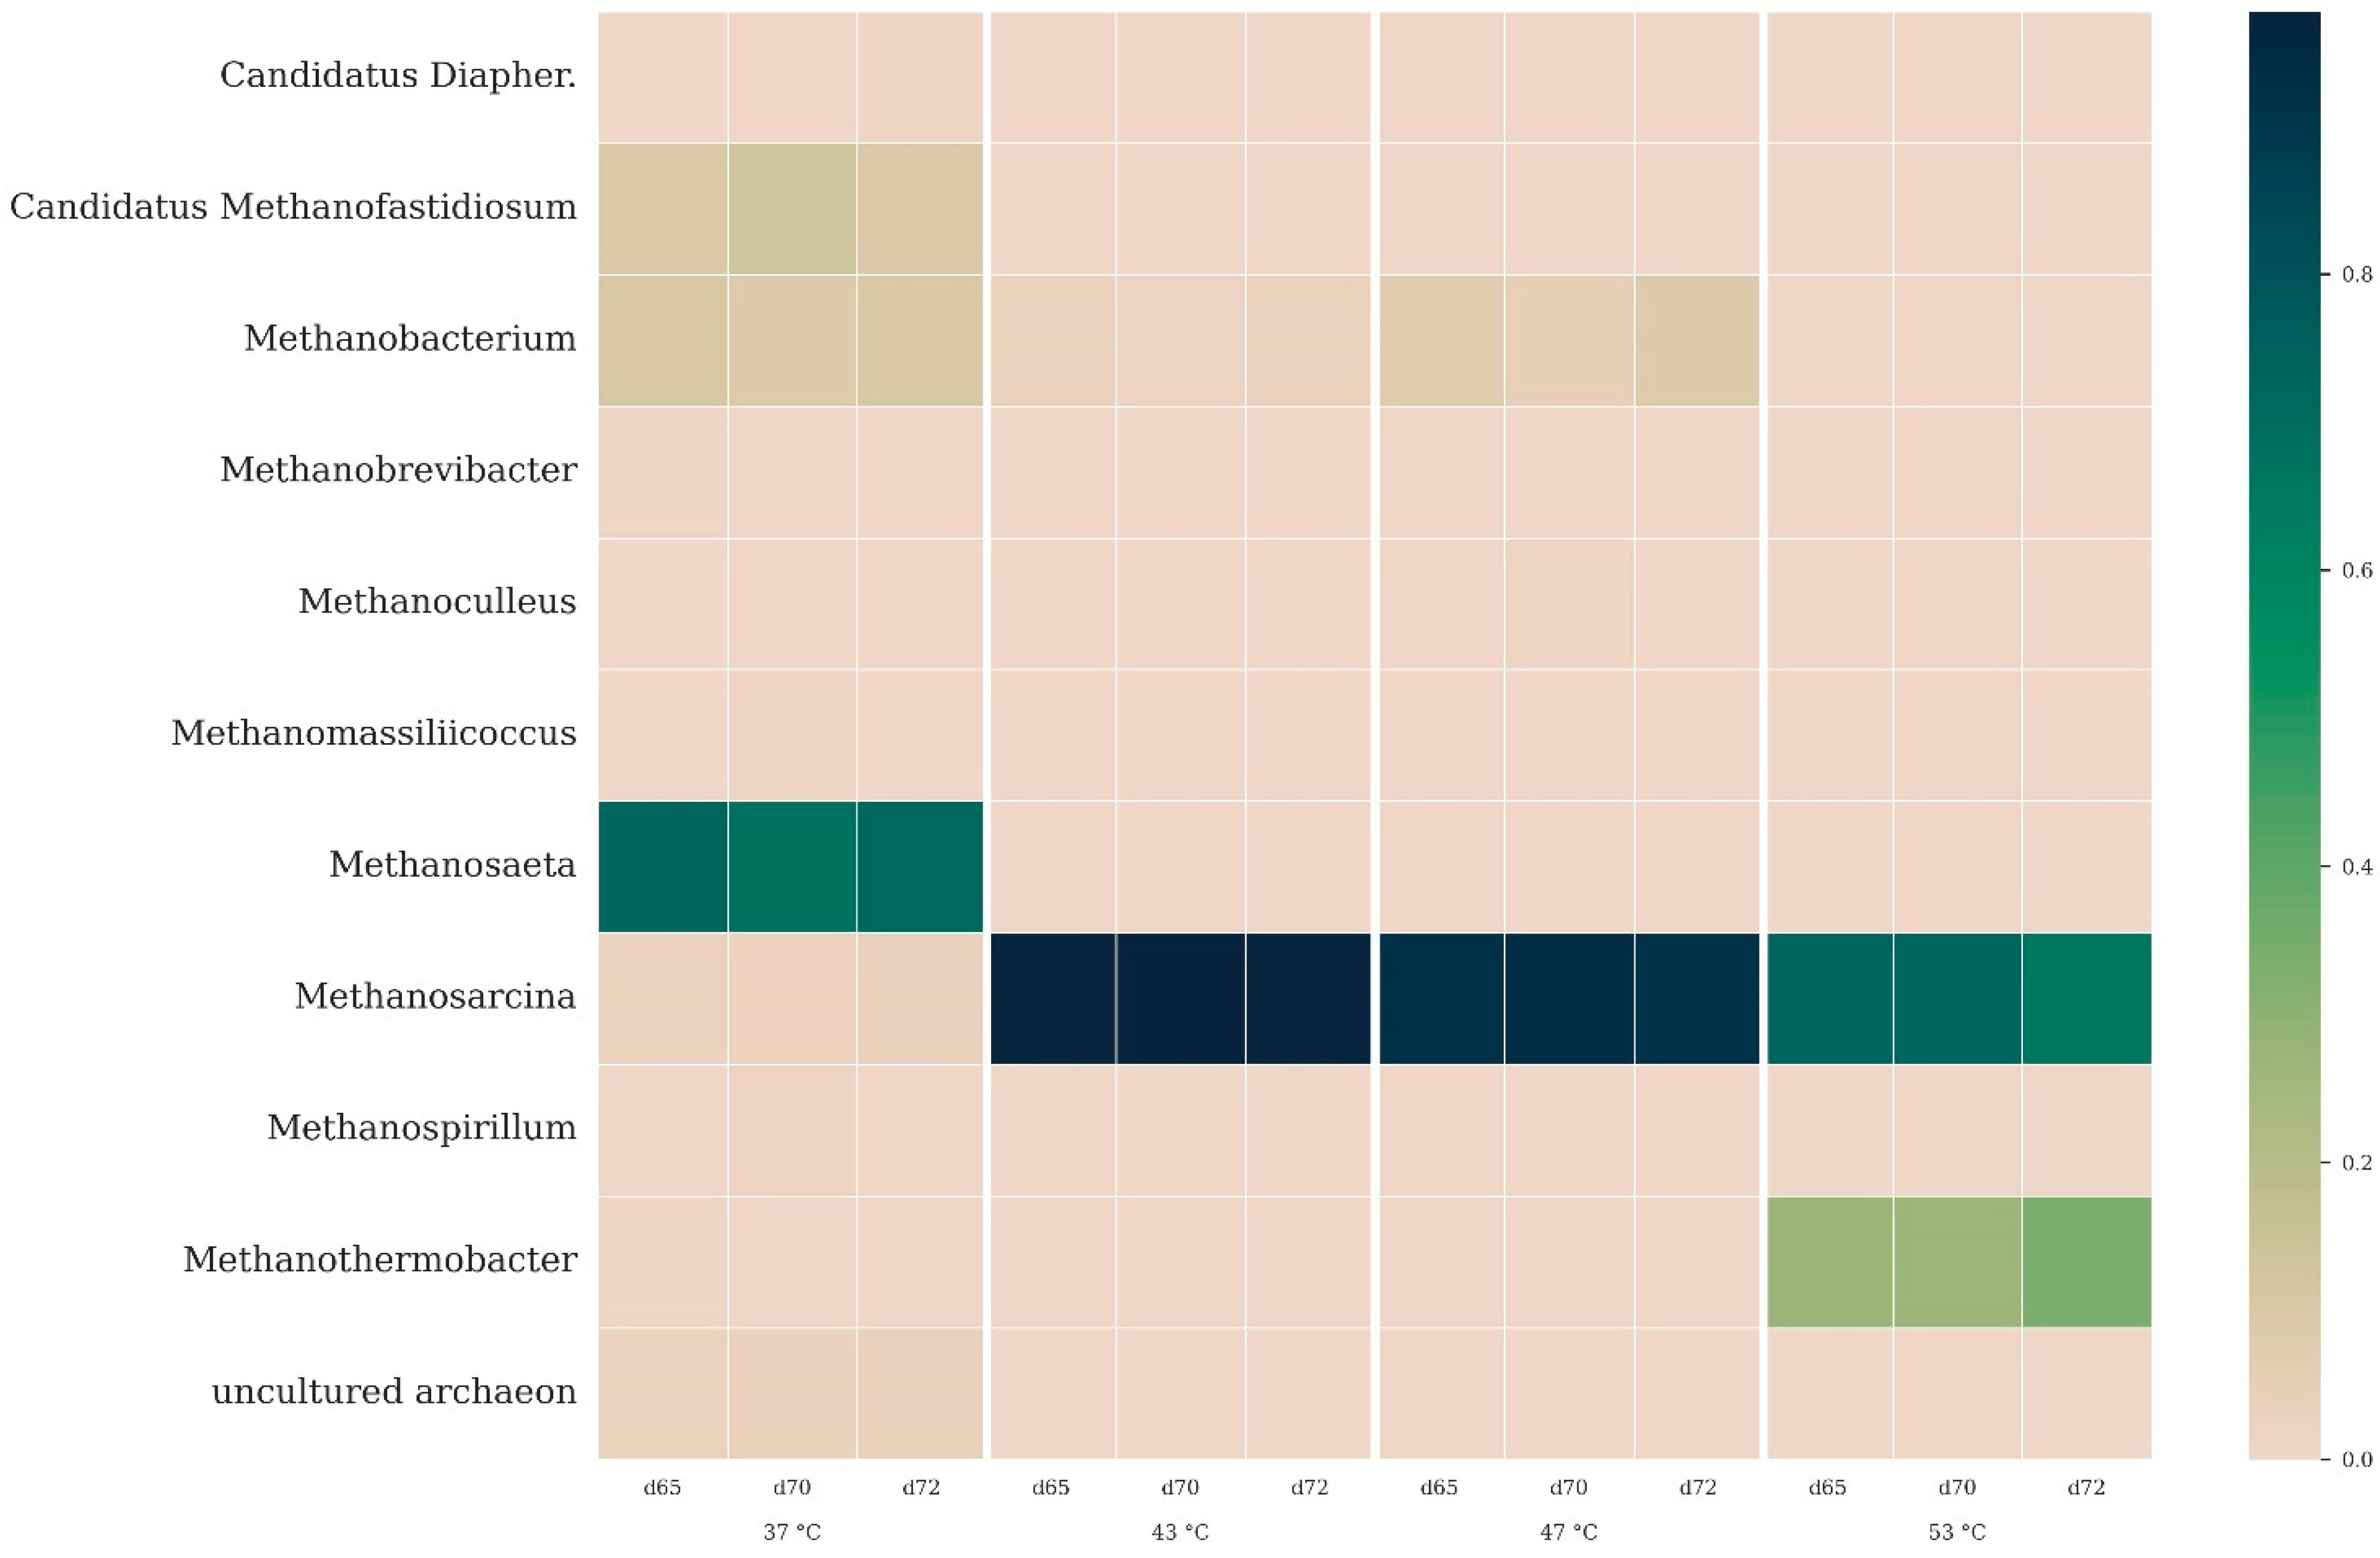
3.2.4. Archaeal Taxonomy
3.2.5. Process Stability
4. Relevance of Application
5. Conclusions
Supplementary Materials
Author Contributions
Funding
Institutional Review Board Statement
Informed Consent Statement
Data Availability Statement
Acknowledgments
Conflicts of Interest
Abbreviations
| AD | anaerobic digestion; | |
| ASV | amplicon sequence variant; | |
| CODS | soluble chemical oxygen demand | mg/L; |
| CODT | total chemical oxygen demand | mg/L; |
| FOS | volatile fatty acids (titration) | mg/L; |
| GC | gas chromatography; | |
| HRT | hydraulic retention time; | |
| OLR | organic loading rate | g CODdegraded/(L·d); |
| PCoA | principal coordinate analysis; | |
| PE | population equivalent; | |
| PS:SS | mixture of primary and secondary sludge; | |
| SAOB | syntrophic acetate-oxidizing bacteria; | |
| TAC | total alkalinity | mg/L; |
| TKN | total Kjeldahl-nitrogen | mg/L; |
| TS | total solids | %; |
| TVS | total volatile solids | %; |
| VFAs | volatile fatty acids (GC) | mg/L (acetic acid equivalents); |
| WRRF | water resource recovery facility. |
References
- DWA. Merkblatt DWA-M 368–Biologische Stabilisierung von Klärschlamm; Deutsche Vereinigung für Wasserwirtschaft; Abwasser und Abfall e. V.: Hennef, Germany, 2014. [Google Scholar]
- Tchobanoglous, G. Wastewater Engineering: Treatment and Resource Recovery, 5th ed.; International Student Edition; McGraw-Hill: New York, NY, USA, 2014. [Google Scholar]
- Lin, Q.; He, G.; Rui, J.; Fang, X.; Tao, Y.; Li, J.; Li, X. Microorganism-regulated mechanisms of temperature effects on the performance of anaerobic digestion. Microb. Cell Factories 2016, 15, 96. [Google Scholar] [CrossRef]
- Nie, E.; He, P.; Zhang, H.; Hao, L.; Shao, L.; Lü, F. How does temperature regulate anaerobic digestion? Renew. Sustain. Energy Rev. 2021, 150, 111453. [Google Scholar] [CrossRef]
- Hupfauf, S.; Winkler, A.; Wagner, A.O.; Podmirseg, S.M.; Insam, H. Biomethanation at 45 °C offers high process efficiency and supports hygienisation. Bioresour. Technol. 2020, 300, 122671. [Google Scholar] [CrossRef]
- Temper, U. Methangärung von Klärschlamm und Anderen Komplexen Substraten bei Mesophilen und Thermophilen Temperaturen. Ph.D. Thesis, Fakultät für Biologie, Ludwig-Maximilians-Universität München, München, Germany, 1983. [Google Scholar]
- Wilson, C.A.; Murthy, S.M.; Fang, Y.; Novak, J.T. The effect of temperature on the performance and stability of thermophilic anaerobic digestion. Water Sci. Technol. 2008, 57, 297–304. [Google Scholar] [CrossRef] [PubMed]
- Lüdtke, M.; Baresel, C.; Nordberg, A.; Witkiewicz, A.; Thunberg, A. Impact of Temperature-Dependent Reaction Rates on Methane Yields in Intermittently Fed Mesophilic Sludge Digestion. J. Environ. Eng. 2018, 144, 04017085. [Google Scholar] [CrossRef]
- Mieske, R. Anaerobe Schlammstabilisierung bei Faultemperaturen unter 35 °C: Erweiterung Deutscher Bemessungsregeln; Veröffentlichung des Institutes für Siedlungswasserwirtschaft der Technischen Universität Braunschweig: Braunschweig, Germany, 2018. [Google Scholar]
- Steiniger, B.; Hubert, C.; Schaum, C. Digesters as Heat Storage–Effects of the Digester Temperature on the Process Stability, Sludge Liquor Quality and the Dewaterability. Water Environ. Res. 2023, e10918. [Google Scholar] [CrossRef] [PubMed]
- Langhans, G.; Scholwin, F.; Nelles, M. Handbuch zur Bilanzierung von Biogasanlagen für Ingenieure–Band I. Grundlagen und Methoden für die Bewertung und Bilanzierung in der Praxis; Springer Vieweg: Wiesbaden, Germany, 2020. [Google Scholar]
- Duan, N.; Kougias, P.G.; Campanaro, S.; Treu, L.; Angelidaki, I. Evolution of the microbial community structure in biogas reactors inoculated with seeds from different origin. Sci. Total Environ. 2021, 773, 144981. [Google Scholar] [CrossRef]
- Liu, W.; Sun, C.; Li, W.; Li, T.; Chen, Z.; Wang, J.; Ren, Z.; Wen, X. Sludge composition and characteristics shaped microbial community and further determined process performance: A study on full-scale thermal hydrolysis-anaerobic digestion processes. J. Environ. Sci. 2024, 137, 96–107. [Google Scholar] [CrossRef]
- Van, D.P.; Fujiwara, T.; Tho, B.L.; Toan, P.P.S.; Minh, G.H. A review of anaerobic digestion systems for biodegradable waste: Configurations, operating parameters, and current trends. Environ. Eng. Res. 2019, 25, 1–17. [Google Scholar] [CrossRef]
- Blair, E.M.; Dickson, K.L.; O’malley, M.A. Microbial communities and their enzymes facilitate degradation of recalcitrant polymers in anaerobic digestion. Curr. Opin. Microbiol. 2021, 64, 100–108. [Google Scholar] [CrossRef]
- Madigan, M.; Martinko, J.; Stahl, D.; Clark, D. Brock Biology of Microorganisms, 13th ed.; Global Edition; Pearson: London, UK, 2010. [Google Scholar]
- Westerholm, M.; Isaksson, S.; Karlsson Lindsjö, O.K.; Schnürer, A. Microbial community adaptability to altered temperature conditions determines the potential for process optimisation in biogas production. Appl. Energy 2018, 226, 838–848. [Google Scholar] [CrossRef]
- Chen, M. Adaptation of mesophilic anaerobic sewage fermentor populations to thermophilic temperatures. Appl. Environ. Microbiol. 1983, 45, 1271–1276. [Google Scholar] [CrossRef]
- Zhu, X.; Kougias, P.G.; Treu, L.; Campanaro, S.; Angelidaki, I. Microbial community changes in methanogenic granules during the transition from mesophilic to thermophilic conditions. Appl. Microbiol. Biotechnol. 2016, 101, 1313–1322. [Google Scholar] [CrossRef] [PubMed]
- Hupfauf, S.; Plattner, P.; Wagner, A.O.; Kaufmann, R.; Insam, H.; Podmirseg, S.M. Temperature shapes the microbiota in anaerobic digestion and drives efficiency to a maximum at 45 °C. Bioresour. Technol. 2018, 269, 309–318. [Google Scholar] [CrossRef]
- Karakashev, D.; Batstone, D.J.; Angelidaki, I. Influence of Environmental Conditions on Methanogenic Compositions in Anaerobic Biogas Reactors. Appl. Environ. Microbiol. 2005, 71, 331–338. [Google Scholar] [CrossRef] [PubMed]
- De Vrieze, J.; Saunders, A.M.; He, Y.; Fang, J.; Nielsen, P.H.; Verstraete, W.; Boon, N. Ammonia and temperature determine potential clustering in the anaerobic digestion microbiome. Water Res. 2015, 75, 312–323. [Google Scholar] [CrossRef]
- Kirkegaard, R.H.; McIlroy, S.J.; Kristensen, J.M.; Nierychlo, M.; Karst, S.M.; Dueholm, M.S.; Albertsen, M.; Nielsen, P.H. The impact of immigration on microbial community composition in full-scale anaerobic digesters. Sci. Rep. 2017, 7, 9343. [Google Scholar] [CrossRef]
- Komemoto, K.; Lim, Y.G.; Nagao, N.; Onoue, Y.; Niwa, C.; Toda, T. Effect of temperature on VFA’s and biogas production in anaerobic solubilization of food waste. Waste Manag. 2009, 29, 2950–2955. [Google Scholar] [CrossRef] [PubMed]
- de Lemos Chernicharo, C. Anaerobic Reactors; IWA Publishing: London, UK, 2007; Volume 4. [Google Scholar]
- Zinder, S.H. Physiological ecology of methanogens. In Methanogenesis–Ecology, Physicology; Biochemistry & Genetics; Chapman & Hall: London, UK, 1993; pp. 128–206. [Google Scholar]
- Demirel, B.; Scherer, P. The roles of acetotrophic and hydrogenotrophic methanogens during anaerobic conversion of biomass to methane: A review. Rev. Environ. Sci. Bio/Tech. 2008, 7, 173–190. [Google Scholar] [CrossRef]
- Pap, B.; Györkei, Á.; Boboescu, I.Z.; Nagy, I.K.; Bíró, T.; Kondorosi, É.; Maróti, G. Temperature-dependent transformation of biogas-producing microbial communities points to the increased importance of hydrogenotrophic methanogenesis under thermophilic operation. Bioresour. Technol. 2015, 177, 375–380. [Google Scholar] [CrossRef] [PubMed]
- Mladenovska, Z.; Ahring, B.K. Growth kinetics of thermophilic Methanosarcina spp. isolated from full-scale biogas plants treating animal manures. FEMS Microbiol. Ecol. 2000, 31, 225–229. [Google Scholar] [CrossRef] [PubMed]
- Van Lier, J.B.; Martin, J.L.S.; Lettinga, G. Effect of temperature on the anaerobic thermophilic conversion of volatile fatty acids by dispersed and granular sludge. Water Res. 1996, 30, 199–207. [Google Scholar] [CrossRef]
- Ahring, B.K.; Sandberg, M.; Angelidaki, I. Volatile acids as indicators of process imbalance in anaerobic digestors. Appl. Microbiol. Biotech. 1995, 43, 559–565. [Google Scholar] [CrossRef]
- van Lier, J.B.; Rebac, S.; Lettinga, G. High-rate anaerobic wastewater treatment under psychrophilic and thermophilic conditions. Water Sci. Technol. 1997, 35, 199–206. [Google Scholar] [CrossRef]
- Chachkhiani, M.; Dabert, P.; Abzianidze, T.; Partskhaladze, G.; Tsiklauri, L.; Dudauri, T.; Godon, J.J. 16S rDNA characterisation of bacterial and archaeal communities during start-up of anaerobic thermophilic digestion of cattle manure. Bioresour. Technol. 2004, 93, 227–232. [Google Scholar] [CrossRef]
- Steiniger, B.; Hubert, C.; Schaum, C. Digesters as Heat Storage–Energetic Assessment of Flexible Variation of Digester Temperature. Chem. Eng. Technol. 2021, 45, 144–151. [Google Scholar] [CrossRef]
- Hubert, C.; Steiniger, B.; Schaum, C.; Michel, M.; Spallek, M. Variation of the digester temperature in the annual cycle–using the digester as heat storage. Water Pract. Technol. 2019, 14, 471–481. [Google Scholar] [CrossRef]
- VDI. VDI 4630: Vergärung organischer Substratcharakterisierung, Probenahme, Stoffdatenerhebung, Gärversuche; Verein deutscher Ingenieure (VDI). In VDI Handbuch Energietechnik; Beuth Verlag GmbH: Berlin, Germany, 2016. [Google Scholar]
- Caporaso, J.G.; Lauber, C.L.; Walters, W.A.; Berg-Lyons, D.; Lozupone, C.A.; Turnbaugh, P.J.; Fierer, N.; Knight, R. Global patterns of 16S rRNA diversity at a depth of millions of sequences per sample. Proc. Natl. Acad. Sci. USA 2011, 108 (Suppl. 1), 4516–4522. [Google Scholar] [CrossRef] [PubMed]
- Hupfauf, S.; Etemadi, M.; Juárez, M.F.-D.; Gómez-Brandón, M.; Insam, H.; Podmirseg, S.M. CoMA–an intuitive and user-friendly pipeline for amplicon-sequencing data analysis. PLoS ONE 2020, 15, e0243241. [Google Scholar] [CrossRef]
- Astals, S.; Esteban-Gutiérrez, M.; Fernández-Arévalo, T.; Aymerich, E.; García-Heras, J.L.; Mata-Alvarez, J. Anaerobic digestion of seven different sewage sludges: A biodegradability and modelling study. Water Res. 2013, 47, 6033–6043. [Google Scholar] [CrossRef] [PubMed]
- WEF. Design of Water Resource Recovery Facilities, 6th ed.; McGraw-Hill Education: New York, NY, USA, 2018. [Google Scholar]
- Buffière, P.; Choo-Kun, M.; De Backer, M.; Conteau, D.; Camacho, P.; Dauthuille, P.; Gourdon, R. Kinetics of Primary Sludge Digestion at Various Temperatures. In Proceedings of the 13th IWA World Congress on Anaerobic Digestion, Santiago de Compostela, Spain, 25–28 June 2013. [Google Scholar]
- Buhr, H.O.; Andrews, J.F. The thermophilic anaerobic digestion process. Water Res. 1977, 11, 129–143. [Google Scholar] [CrossRef]
- Donoso-Bravo, A.; Retamal, C.; Carballa, M.; Ruiz-Filippi, G.; Chamy, R. Influence of temperature on the hydrolysis, acidogenesis and methanogenesis in mesophilic anaerobic digestion: Parameter identification and modeling application. Water Sci. Technol. 2009, 60, 9–17. [Google Scholar] [CrossRef]
- Bouskova, A.; Persson, E.; Jansen, J.L.C.; Dohanyos, M. The effect of operational temperature on dewatering characteristics of digested sludge. J. Residuals Sci. Tech. 2006, 3, 43–49. [Google Scholar]
- Chen, Y.; Cheng, J.J.; Cheng, J.J.; Creamer, K.S. Inhibition of anaerobic digestion process: A review. Bioresour. Technol. 2008, 99, 4044–4064. [Google Scholar] [CrossRef]
- Zeig, C. Stoffströme der Co-Vergärung in der Abwasserwirtschaft; Verein zur Förderung des Instituts IWAR der TU Darmstadt e.V.; Schriftenreihe: Darmstadt, Germany, 2013; Volume 226. [Google Scholar]
- Tezel, U.; Tandukar, M.; Hajaya, M.G.; Pavlostathis, S.G. Transition of municipal sludge anaerobic digestion from mesophilic to thermophilic and long-term performance evaluation. Bioresour. Technol. 2014, 170, 385–394. [Google Scholar] [CrossRef] [PubMed]
- Sánchez-Ramírez, J.E.; Pastor, L.; Martí, N.; Claros, J.; Doñate, S.; Bouzas, A. Analysis of uncontrolled phosphorus precipitation in anaerobic digesters under thermophilic and mesophilic conditions. Environ. Technol. 2019, 42, 1836–1845. [Google Scholar] [CrossRef]
- Song, Y.-C.; Kwon, S.-J.; Woo, J.-H. Mesophilic and thermophilic temperature co-phase anaerobic digestion compared with single-stage mesophilic- and thermophilic digestion of sewage sludge. Water Res. 2004, 38, 1653–1662. [Google Scholar] [CrossRef] [PubMed]
- De la Rubia, M.A.; Riau, V.; Raposo, F.; Borja, R. Thermophilic anaerobic digestion of sewage sludge: Focus on the influence of the start-up. A review. Crit. Rev. Biotechnol. 2012, 33, 448–460. [Google Scholar] [CrossRef]
- Zickefoose, C.; Hayes, R.B.J. Operations Manual–Anaerobic Sludge Digestion; Office of Water Program Operations, US Environmental Protection Agency: Washington, DC, USA, 1976. [Google Scholar]
- Chen, H.; Huang, R.; Wu, J.; Zhang, W.; Han, Y.; Xiao, B.; Wang, D.; Zhou, Y.; Liu, B.; Yu, G. Biohythane production and microbial characteristics of two alternating mesophilic and thermophilic two-stage anaerobic co-digesters fed with rice straw and pig manure. Bioresour. Technol. 2021, 320, 124303. [Google Scholar] [CrossRef]
- Liu, Y.; Wang, T.; Xing, Z.; Ma, Y.; Nan, F.; Pan, L.; Chen, J. Anaerobic co-digestion of Chinese cabbage waste and cow manure at mesophilic and thermophilic temperatures: Digestion performance, microbial community, and biogas slurry fertility. Bioresour. Technol. 2022, 363, 127976. [Google Scholar] [CrossRef]
- Gunnigle, E.; Siggins, A.; Botting, C.H.; Fuszard, M.; O’Flaherty, V.; Abram, F.; Sauer, M. Low-temperature anaerobic digestion is associated with differential methanogenic protein expression. FEMS Microbiol. Lett. 2015, 362, fnv059. [Google Scholar] [CrossRef] [PubMed]
- Battin, T.J.; Besemer, K.; Bengtsson, M.M.; Romaní, A.M.; Packmann, A.I. The ecology and biogeochemistry of stream biofilms. Nat. Rev. Microbiol. 2016, 14, 251–263. [Google Scholar] [CrossRef] [PubMed]
- Tian, G.; Yang, B.; Dong, M.; Zhu, R.; Yin, F.; Zhao, X.; Wang, Y.; Xiao, W.; Wang, Q.; Zhang, W.; et al. The effect of temperature on the microbial communities of peak biogas production in batch biogas reactors. Renew. Energy 2018, 123, 15–25. [Google Scholar] [CrossRef]
- Tonanzi, B.; Gallipoli, A.; Gianico, A.; Montecchio, D.; Pagliaccia, P.; Rossetti, S.; Braguglia, C.M. Elucidating the key factors in semicontinuous anaerobic digestion of urban biowaste: The crucial role of sludge addition in process stability, microbial community enrichment and methane production. Renew. Energy 2021, 179, 272–284. [Google Scholar] [CrossRef]
- Jiang, L.; Dang, Q.; Zhao, X.; Zhang, C.; Tan, X.; Yan, Q. Mechanism of microbial involvement in nitrogen conversion affecting methane production in dry anaerobic digestion. J. Clean. Prod. 2022, 369, 133324. [Google Scholar] [CrossRef]
- Wang, J.; Lou, Y.; Ma, D.; Feng, K.; Chen, C.; Zhao, L.; Xing, D. Co-treatment with free nitrous acid and calcium peroxide regulates microbiome and metabolic functions of acidogenesis and methanogenesis in sludge anaerobic digestion. Sci. Total Environ. 2023, 870, 161924. [Google Scholar] [CrossRef] [PubMed]
- Li, Z.-Y.; Inoue, D.; Ike, M. Mitigating ammonia-inhibition in anaerobic digestion by bioaugmentation: A review. J. Water Process Eng. 2023, 52, 103506. [Google Scholar] [CrossRef]
- Zhang, H.; Li, W.; Zhou, C.; Zhang, J.; Pei, Y.; Zang, L. Comparison of cobalt ferrate-based nanoparticles for promoting biomethane evolution from lactic acid anaerobic digestion. Bioresour. Technol. 2022, 347, 126689. [Google Scholar] [CrossRef]
- Sun, L.; Müller, B.; Westerholm, M.; Schnürer, A. Syntrophic acetate oxidation in industrial CSTR biogas digesters. J. Biotechnol. 2014, 171, 39–44. [Google Scholar] [CrossRef]
- Qin, Y.; Huang, L.; Jiang, Q.; Lu, T.; Xin, Y.; Zhen, Y.; Liu, J.; Shen, P. Anaerobic co-digestion of molasses vinasse and three kinds of manure: A comparative study of performance at different mixture ratio and organic loading rate. J. Clean. Prod. 2022, 371, 133631. [Google Scholar] [CrossRef]
- Khoei, S.; Stokes, A.; Kieft, B.; Kadota, P.; Hallam, S.J.; Eskicioglu, C. Biochar amendment rapidly shifts microbial community structure with enhanced thermophilic digestion activity. Bioresour. Technol. 2021, 341, 125864. [Google Scholar] [CrossRef] [PubMed]
- Zhu, R.; Wang, D.-H.; Zheng, Y.; Zou, H.; Fu, S.-F. Understanding the mechanisms behind micro-aeration to enhance anaerobic digestion of corn straw. Fuel 2022, 318, 123604. [Google Scholar] [CrossRef]
- Li, X.; Deng, L.; Li, F.; Zheng, D.; Yang, H. Effect of air mixing on high-solids anaerobic digestion of cow manure: Performance and mechanism. Bioresour. Technol. 2023, 370, 128545. [Google Scholar] [CrossRef]
- He, J.; Zheng, W.; Tao, C.; Guo, H.; Xue, Y.; Zhao, R.; Yao, W. Heat stress during late gestation disrupts maternal microbial transmission with altered offspring’s gut microbial colonization and serum metabolites in a pig model. Environ. Pollut. 2020, 266, 115111. [Google Scholar] [CrossRef]
- Jiang, J.; Wu, P.; Sun, Y.; Guo, Y.; Song, B.; Huang, Y.; Xing, T.; Li, L. Comparison of microbial communities during anaerobic digestion of kitchen waste: Effect of substrate sources and temperatures. Bioresour. Technol. 2020, 317, 124016. [Google Scholar] [CrossRef] [PubMed]
- Liczbiński, P.; Borowski, S.; Cieciura-Włoch, W. Anaerobic co-digestion of kitchen waste with hyperthermophilically pretreated grass for biohydrogen and biomethane production. Bioresour. Technol. 2022, 364, 128053. [Google Scholar] [CrossRef] [PubMed]
- Ollivier, B.M.; Mah, R.A.; Ferguson, T.J.; Boone, D.R.; Garcia, J.L.; Robinson, R. Emendation of the Genus Thermobacteroides: Thermobacteroides proteolyticus sp. nov., a Proteolytic Acetogen from a Methanogenic Enrichment. Int. J. Syst. Evol. Microbiol. 1985, 35, 425–428. [Google Scholar] [CrossRef]
- Pavan, M.E.; Pavan, E.E.; Glaeser, S.P.; Etchebehere, C.; Kämpfer, P.; Pettinari, M.J.; López, N.I. Proposal for a new classification of a deep branching bacterial phylogenetic lineage: Transfer of Coprothermobacter proteolyticus and Coprothermobacter platensis to Coprothermobacteraceae fam. nov., within Coprothermobacterales ord. nov., Coprothermobacteria classis nov. and Coprothermobacterota phyl. nov. and emended description of the family Thermodesulfobiaceae. Int. J. Syst. Evol. Microbiol. 2018, 68, 1627–1632. [Google Scholar] [CrossRef]
- Tandishabo, K.; Nakamura, K.; Umetsu, K.; Takamizawa, K. Distribution and role of Coprothermobacter spp. in anaerobic digesters. J. Biosci. Bioeng. 2012, 114, 518–520. [Google Scholar] [CrossRef]
- Pavan, M.E.; Pavan, E.E.; Kämpfer, P.; Pettinari, M.J.; López, N.I. Coprothermobacter. In Bergey’s Manual of Systematics of Archaea and Bacteria; John Wiley & Sons Inc.: Hoboken, NJ, USA, 2019; pp. 1–11. [Google Scholar]
- Nobu, M.K.; Narihiro, T.; Kuroda, K.; Mei, R.; Liu, W.-T. Chasing the elusive Euryarchaeota class WSA2: Genomes reveal a uniquely fastidious methyl-reducing methanogen. ISME J. 2016, 10, 2478–2487. [Google Scholar] [CrossRef]
- Boone, D.R. Methanobacterium. In Bergey’s Manual of Systematics of Archaea and Bacteria; John Wiley & Sons Inc.: Hoboken, NJ, USA, 2015; pp. 1–8. [Google Scholar]
- Stams, A.J.M.; Teusink, B.; Sousa, D.Z. Ecophysiology of acetoclastic methanogens. In Biogenesis of Hydrocarbons; Springer: Cham, Switzerland, 2019; pp. 109–121. [Google Scholar]
- Dworkin, M.; Falkow, S.; Rosenberg, E.; Schleifer, K.H.; Stackebrandt, E. The Prokaryotes: Volume 3: Archaea. Bacteria: Firmicutes, Actinomycetes; Springer: New York, NY, USA, 2006; pp. 843–933. [Google Scholar]


| Aspect | Parameter | Unit | Period I (PS: SS #1) | Period II (PS: SS #2) |
|---|---|---|---|---|
| Digester operation | HRT | d | 20 | 20 |
| Temperature | °C | 37, 43, 47, 53 | 37, 43, 47, 53 | |
| Substrate | Feeding period | d | 27 | 75 |
| TS | % | 5.4 ± 0.1 | 4.5 ± 0.1 | |
| TVS | % | 81.0 ± 2.0 | 84.0 ± 2.0 | |
| CODT | mg/L | 60,800 ± 2430 | 52,800 ± 2110 | |
| CODT/TS | g COD/kg TS | 1126 ± 55 | 1173 ± 59 | |
| TKN | mg/L | 2730 ± 136 | 2290 ± 115 | |
| TKN/TS | g TKN/kg TS | 51 ± 3 | 51 ± 3 |
| Period | Parameter | Unit | Temperature in °C | |||
|---|---|---|---|---|---|---|
| 37 | 43 | 47 | 53 | |||
| I | specific methane yield | LN CH4/kg CODadded | 207 | 212 | 215 | 211 |
| LN CH4/kg CODdegraded | 325 | 358 | 357 | 352 | ||
| methane content (a) | % | 61.2 | 61.4 | 61.0 | 61.5 | |
| COD degradation rate | % | 64.1 | 62.6 | 63.6 | 63.0 | |
| OLR | g CODdeg/(L·d) | 1.7 | 1.5 | 1.6 | 1.6 | |
| HRT | d | 20 | 20 | 20 | 20 | |
| II | specific methane yield | LN CH4/kg CODadded | 212 | 222 | 226 | 223 |
| LN CH4/kg CODdegraded | 351 | 360 | 357 | 356 | ||
| methane content (a) | % | 62.6 | 62.1 | 61.6 | 62.1 | |
| COD degradation rate | % | 63.4 | 65.5 | 67.0 | 66.1 | |
| OLR | g CODdegraded/(L·d) | 1.5 | 1.5 | 1.5 | 1.5 | |
| HRT | d | 20 | 20 | 20 | 20 | |
| Period | Parameter | Unit | Temperature [°C] | |||
|---|---|---|---|---|---|---|
| 37 | 43 | 47 | 53 | |||
| I | VFAs (a) | mg/L | 16 ± 3 | 26 ± 9 | 29 ± 7 | 42 ± 16 |
| FOS (b) | mg/L | 450 | 614 | 651 | 792 | |
| TAC (b) | mg/L | 4340 | 5040 | 5360 | 5170 | |
| FOS/TAC (b) | - | 0.10 | 0.12 | 0.12 | 0.15 | |
Disclaimer/Publisher’s Note: The statements, opinions and data contained in all publications are solely those of the individual author(s) and contributor(s) and not of MDPI and/or the editor(s). MDPI and/or the editor(s) disclaim responsibility for any injury to people or property resulting from any ideas, methods, instructions or products referred to in the content. |
© 2023 by the authors. Licensee MDPI, Basel, Switzerland. This article is an open access article distributed under the terms and conditions of the Creative Commons Attribution (CC BY) license (https://creativecommons.org/licenses/by/4.0/).
Share and Cite
Steiniger, B.; Hupfauf, S.; Insam, H.; Schaum, C. Exploring Anaerobic Digestion from Mesophilic to Thermophilic Temperatures—Operational and Microbial Aspects. Fermentation 2023, 9, 798. https://doi.org/10.3390/fermentation9090798
Steiniger B, Hupfauf S, Insam H, Schaum C. Exploring Anaerobic Digestion from Mesophilic to Thermophilic Temperatures—Operational and Microbial Aspects. Fermentation. 2023; 9(9):798. https://doi.org/10.3390/fermentation9090798
Chicago/Turabian StyleSteiniger, Bettina, Sebastian Hupfauf, Heribert Insam, and Christian Schaum. 2023. "Exploring Anaerobic Digestion from Mesophilic to Thermophilic Temperatures—Operational and Microbial Aspects" Fermentation 9, no. 9: 798. https://doi.org/10.3390/fermentation9090798