Article

Solid-State Fermentation of Green Tea Residues as Substrates for Tannase Production by Aspergillus niger TBG 28A: Optimization of the Culture Conditions

by
Erick M. Peña-Lucio
1,
Mónica L. Chávez-González
1,*,
Liliana Londoño-Hernandez
2,
Héctor A. Ruiz
3,
José L. Martínez-Hernandez
1,
Mayela Govea-Salas
1,
Pradeep Nediyaparambil Sukumaran
4,
Sabu Abdulhameed
5 and
Cristóbal N. Aguilar
1,*
1
Bioprocess and Bioproducts Research Group, Food Research Department, School of Chemistry, Autonomous University of Coahuila, Saltillo 25280, Mexico
2
BIOTCS Group, School of Basic Sciences, Technology, and Engineering, Universidad Nacional Abierta y a Distancia—UNAD, Palmira 763531, Colombia
3
Biorefinery Group, Food Research Department, School of Chemistry, Autonomous University of Coahuila, Saltillo 25280, Mexico
4
KSCSTE-Malabar Botanical Garden and Institute for Plant Sciences, Calicut 673014, Kerala, India
5
Department of Biotechnology and Microbiology, Kannur University, Kannur 670567, Kerala, India
*
Authors to whom correspondence should be addressed.
Fermentation 2023, 9(9), 781; https://doi.org/10.3390/fermentation9090781
Submission received: 19 July 2023 / Revised: 12 August 2023 / Accepted: 15 August 2023 / Published: 23 August 2023
(This article belongs to the Section Fermentation Process Design)

Abstract

:
Tea (Camellia sinensis) is an evergreen shrub that is recognized worldwide for its functional properties. The current global production of green tea is approximately 5.3 million tons per year. Green tea processing has severely affected the generation of agro-industrial waste. One strategy for reducing waste accumulation is the revalorization of agro-industrial wastes via solid-state fermentation (SSF). The aim of this study was to valorize green tea processing residues to produce tannase under SSF using an endemic strain from Western Ghats, Aspergillus niger TBG 28A. SSF was performed in Erlenmeyer flasks with spent green tea leaves inoculated with spores of A. niger TBG 28A. Bioprocess optimization was carried out by employing the Box–Benkhen experimental design, achieving a high enzymatic yield of 246.82 (U/g). The present study shows the complexity of the degradation of tannins and the different patterns of expression of fungal tannase obtained from A. niger TBG 28 A. The enzyme was further purified to obtain a fold purification of 16.35% and a molecular mass of 150 kDa. Producing tannase with a novel strain of A. niger TBG 28A is an interesting strategy to revalorize green tea waste.

1. Introduction

Tannin-acyl hydrolase (E.C. 3.1.1.20) catalyzes the hydrolysis of the ester bonds present in complex tannins, releasing gallic acid and glucose [1]. Tannase is an inducible enzyme that hydrolyzes ester and depside bonds in hydrolysable tannins [2]. Applications of tannase in the industry have increased in recent years [3]. Tannase is important to reduce the load of tannins and remove undesirable properties from beverages [3]. TAH is widely used in the food and pharmaceutical industries, for example, as a beverage clarifier and food preservative to obtain gallic acid, which is widely used as a necessary intermediary in the synthesis of trimethoprim with sulfamethoxazole [1]. Additionally, tannase is relevant in the production of animal feed and grape wine [4]. Tannins are phenolic compounds of a complex nature capable of precipitating alkaloids, albuminoids, and gelatin [5]. Tannins are classified into four groups: gallotannins, ellagitannins, condensed tannins, and complex tannins [6]. Gallotannins and ellagitannins are classified as hydrolysable tannins and are found in tea stalks [7]. Additionally, tea residues contain 20–30% polyphenols, 4–5% caffeine, and 2–4% sugars [8].
The use of agro-industrial wastes has been a focus of interest in the biotechnology sector because of their multipurpose applications in circular economy and biorefinery concepts. It is undeniable that each type of agro-industrial waste contains chemical elements that can be extracted or separated, allowing us to revalue it and therefore justify the design of a bioprocess or technological strategy to obtain its compounds [9]. Agro-industrial residues, such as coffee by-products [10], sugar cane bagasse [11], and pomegranate peels [12], are important sources of nutrients that promote microbial growth and the production of enzymes. Earlier studies have reported the use of tea stalks as novel agro-residues to produce tannase under solid-state fermentation (SSF) [7]. The production of tannase from agro-industrial residues is a promising biotechnology due to its low production costs [13].
The SSF process has been defined as a bioprocess that is performed in the absence of free water; however, the solid matrix must possess sufficient moisture to support the growth and metabolic activity of microorganisms [14]. Some bacteria and fungi have been described as microbial sources of tannase [15], for example, bacteria of the genera Lactobacillus [16], Sthapylococcus [17], and Streptococcus [18]; however, it has been reported that some fungal microorganisms, such as Aspergillus spp. [19], Penicillum spp. [20], Fusarium spp. [21], and Trichoderma spp. [21], can excrete tannases. It has been reported that strains of the genus Aspergillus can degrade complex and condensed tannins [19]. Endemical strains could present greater genetic variability and better adaptation strategies for survival than conventional species. For this reason, it would be interesting to evaluate new fungal strains from high-biodiversity ecosystems.
The application of statistical models, such as Box–Benkhen and Hunter and Hunter, is significant for optimizing the operating conditions of biotechnological processes [20]. In addition, these designs have been applied to obtain the optimal production yields of some enzymes [20]. Viswanath et al. [22] reported a 3-fold increase in tannase production by A. niger MTCC 5898 using the Box–Benkhen model.
The aim of the present study was to produce a novel tannase from an endemic fungal strain, A. niger TBG 28A, with an enhanced potential to degrade tannins under SSF. Spent green tea leaves were used as the culture medium to induce fungal growth. Process optimization was conducted by employing a strategic methodology of two sequential statistical designs: Hunter and Hunter (exploratory) and Box–Benkhen. The tannase enzyme produced in SSF by a novel strain of A. niger TBG 28A showed great potential for hydrolyzing tannins and is plausible for application in some industrial food processes. The produced enzyme was purified, and the molecular weight of the tannase was determined. Tannase activity was confirmed using a zymogram analysis.

2. Materials and Methods

2.1. Microorganism

A. niger TBG 28A is a novel species, and it was isolated and shared by the Research Institute of Kerala as part of the ongoing India–Mexico bilateral research program. The selected strains were maintained on a potato dextrose agar medium (PDA), and slants were prepared by transferring the spore solution followed by incubation for 10 days at 30 °C. For spore collection, 5 mL of a Tween solution (0.1%) was added, and the plates were agitated for 15 min. Afterwards, the spore solution was transferred to Eppendorf vials, and the spore count was performed using a Neubauer camera. Finally, the spore inoculum was adjusted according to the required concentration (1 × 10⁶, 1 × 10⁷, and 1 × 10⁸ spores/mL). The strain was cryopreserved in glycerol (10%) by freezing at −40 °C in sealed ampoules (Vacuette)(Thermo Fisher Scientific ©, Whaltam, CA, USA) [23].

2.2. Substrate and Pretreatment

Green tea was purchased from a local supermarket in Saltillo, Coahuila, Mexico. The green tea was boiled at 60 °C for 3 min and then dried on a stove for 24 h at 60 °C. After processing, the spent green tea leaves were ground to a particle size of 1 mm using a cutting mill (SM100). Then, 100 g of the material was packed in black polyethylene bags and stored at 5 °C [24].

2.3. Operational Conditions for SSF System

SSF was performed in a closed system over a period of 96 h. The relative moisture in the growth chamber (80%) was adjusted using a humidifier system. The experiments were carried out in 250 mL Erlenmeyer sterile flasks. The flasks were inoculated with inoculum sizes of 1 × 10⁶, 1 × 10⁷, and 1 × 10⁸ (depending on the matrix of the experiment) of A. niger TBG 28A. The experiments were performed in triplicate using three Erlenmeyer flasks at each time point. All analyses were performed on three independently collected samples. Each Erlenmeyer flask contained 5 g of substrate. The moisture content was calculated on a dry basis using a thermobalance (OHAUS MB 23). To calculate the moisture content, 1 g of substrate was heated at 100 °C to a constant weight, and the value was estimated on a dry basis (g moisture/g dry solids).

2.4. Determination of Fungal Biomass

To calculate the fungal biomass, the colorimetric method of glucosamine was used according to the protocol described by Medina-Morales [25]. The analysis was carried out using three independently removed samples. In the first step, hydrolysis was performed to release glucosamine from the cell wall and the mixture with acetylacetone to obtain a pyloric compound that reacts with p-dimethylaminobenzaldehyde (PDBA), which is red in color. Finally, the biomass was determined spectrophotometrically via the formation of a red adduct at an absorbance of 530 nm. A standard glucosamine curve (0–200 µg/mL) was used.

2.5. Enzyme Assay

In total, 25 mL of citrate buffer (0.1 M, pH 5.0) was added to the fermented matter and incubated in an incubator shaker at 25 °C and 180 rpm for 1 h. The fermented matter was collected from three independent Erlenmeyer flasks. It was then filtered through a Whatman® filter paper (90 mm). Tannase activity (TA) was assayed according to the modified method of Sharma et al. [26], which makes use of the rhodanine reagent that allows for the detection of gallic acid by measuring the absorbance at 520 nm. Initially, five solutions were prepared: citrate buffer 50 nM at pH 5.0, methyl gallate 0.01 M in citrate buffer, rhodanine 0.667% w/v in methanol, KOH 0.5 N, and gallic acid 100 ppm. Test tubes were labeled as sample and control. The control tubes contained 0.25 mL of 0.01 M methyl-galate and 0.25 mL of citrate buffer. The test tube contained 0.25 mL of 0.01 M methyl-galate, 0.25 mL of citrate buffer, and 0.25 mL of enzymatic extract. The test tubes were incubated for 5 min at 30 °C. Three replicates were used per treatment. After incubation, 0.3 mL of methanolic rhodanine (0.667% w/v) was added and incubated at 30 °C for 5 min. Then, 0.2 mL of potassium hydroxide (0.5 N) was added and incubated for another 5 min. Then, 4 mL of distilled water was added, the tubes were shaken, and they were incubated for 10 min at 30 °C. Absorbance was read at 520 nm on a spectrophotometer. The calibration curve was performed with gallic acid (0–100 ppm). One unit of tannase was defined as the amount of enzyme that released 1 µmol of gallic acid per minute under standard assay conditions.

2.6. Determination of Hydrolysable and Condensed Tannins, Sugar Totals, and Soluble Protein

Three independently collected samples were used for the following determinations: The hydrolysable tannin content was measured according to the Folin–Ciocalteu method [27]. In total, 20 µL of the sample was placed in a microplate well, and 20 µL of Folin–Ciocalteu’s reagent was added, mixed well, and allowed to stand for 5 min. Subsequently, 20 µL of sodium carbonate (0.01 M) was added and allowed to react for 5 min. Finally, absorbance was measured at 790 nm using a Tecan Sunrise microplate reader [27]. Sugar totals were determined using 0.5 mL samples according to the protocol described by Medina-Morales et al. [25]. It was added 250 µL of 5% phenol. The solution was stirred in a vortex and colocalized in an ice bath for 5 min. Then, 1000 μL of sulfuric acid was added, and the mixture was boiled at 100 °C for 5 min. The total sugar concentration was measured using a spectrophotometer (Thermo Fisher Scientific ©, Whaltam, CA, USA at 530 nm. Values were calculated using a calibration curve prepared with dextrose (0–200 ppm) [25]. Soluble protein was determined using the Bradford method [28]. The assay reagent was made by dissolving 100 mg of Coomassie blue G250 in 50 mL of 95% ethanol. Triplicate samples (containing between 1 and 10 µg) in a total volume of 140 µL were added into 1.5 mL polyethylene microfuge tubes. Consequently, 140 mL of Bradford reagent was added.The solution was mixed, and stirred. The absorbance of each sample at 595 nm was measured 60 min after the addition of the protein reagent. For the calibration curve, duplicate volumes of 10, 20, 40, 60, 80, and 100 µL of 100 µg/µL γ-globulin standard solution were pipetted into microfuge tubes.

2.7. Optimization of Tannase Production by Statistical Design

An exploratory experimental design, Hunter and Hunter, was employed to evaluate the effect of selected variables on tannase activity. Three variables were evaluated at two levels (+1/−1): temperature (35 °C and 25 °C), inoculum size (1 × 10⁶ and 1 × 10⁸), and moisture (80 and 70%). Treatments were assigned according to the experimental matrix design provided by the software (Table 1).
Bioprocess optimization was performed using a Box–Benkhen (BB) experimental design. The studied variables were evaluated at three levels (+1, 0, and −1): temperature (25, 30, and 35 °C), moisture (70, 75, and 80%), and inoculum size (1 × 10⁶, 1 × 10⁷, and 1 × 10⁸ spores/mL).

2.8. Statistical Analysis

Statistica® software version 7.0 was used to select the variables that were significant in the response. The data were analyzed with a significance level of 0.05. Three independent samples per treatment were used for each experiment. The quadratic model regression analysis defines response in terms of the independent variables. It was used a second-order polynomial equation. The second-order equation is expressed as follows (Equation (1)):
Y = βo + β₁X₁ + β₂X₂ + β3X3 + β₁X21+ β₂X22 + β₂X23 + β₁X₁X₂ + β₂X₁X3 + β3X2X3
The equation was interpreted in the following order:
Y is the predicted response; βο is the intercept; βι1 β2, and β3 are the regression coefficients. X1, X2, and X3 are the evaluated variables.

2.9. Purification of the Enzyme

Purification was performed according to the methodology reported by Chaitanyakumar et al. [17]. The volume obtained at each purification step was measured to calculate the enzyme extract yield. Purification was performed in two steps, dialysis and ultrafiltration. The extract was dissolved in acetate buffer (0.01 M), pH 5.5 (with 5 mM EDTA), and dialyzed against acetate buffer 0.01 M (pH 5.5). Dialysis was performed with a cellulose tubular membrane (Interchim ©, Montuclon, FRA) (MWCO 600–800 kDa). The dialyzed enzyme extract was concentrated using a lyophilizer (Labconco, FreeZone 4.5 Liter Benchtop Freeze Dry System, serial number:7750020) for 48 h at −50 °C and 0.120 Ba. In the final step, the enzyme extract was ultracentrifuged using a microcon centrifugal filter (Thermo Fisher Scientific©, Waltham, MA, USA) (molecular weight cutoff of 150 kDa) at 15,000 rpm for 5 min at 4 °C. The supernatant was collected. Consequently, tannase activity was determined according to a previously described protocol [26]. The enzyme extract yield was calculated in relation to the initial volume obtained and the final volume after the enzyme extract purification steps.

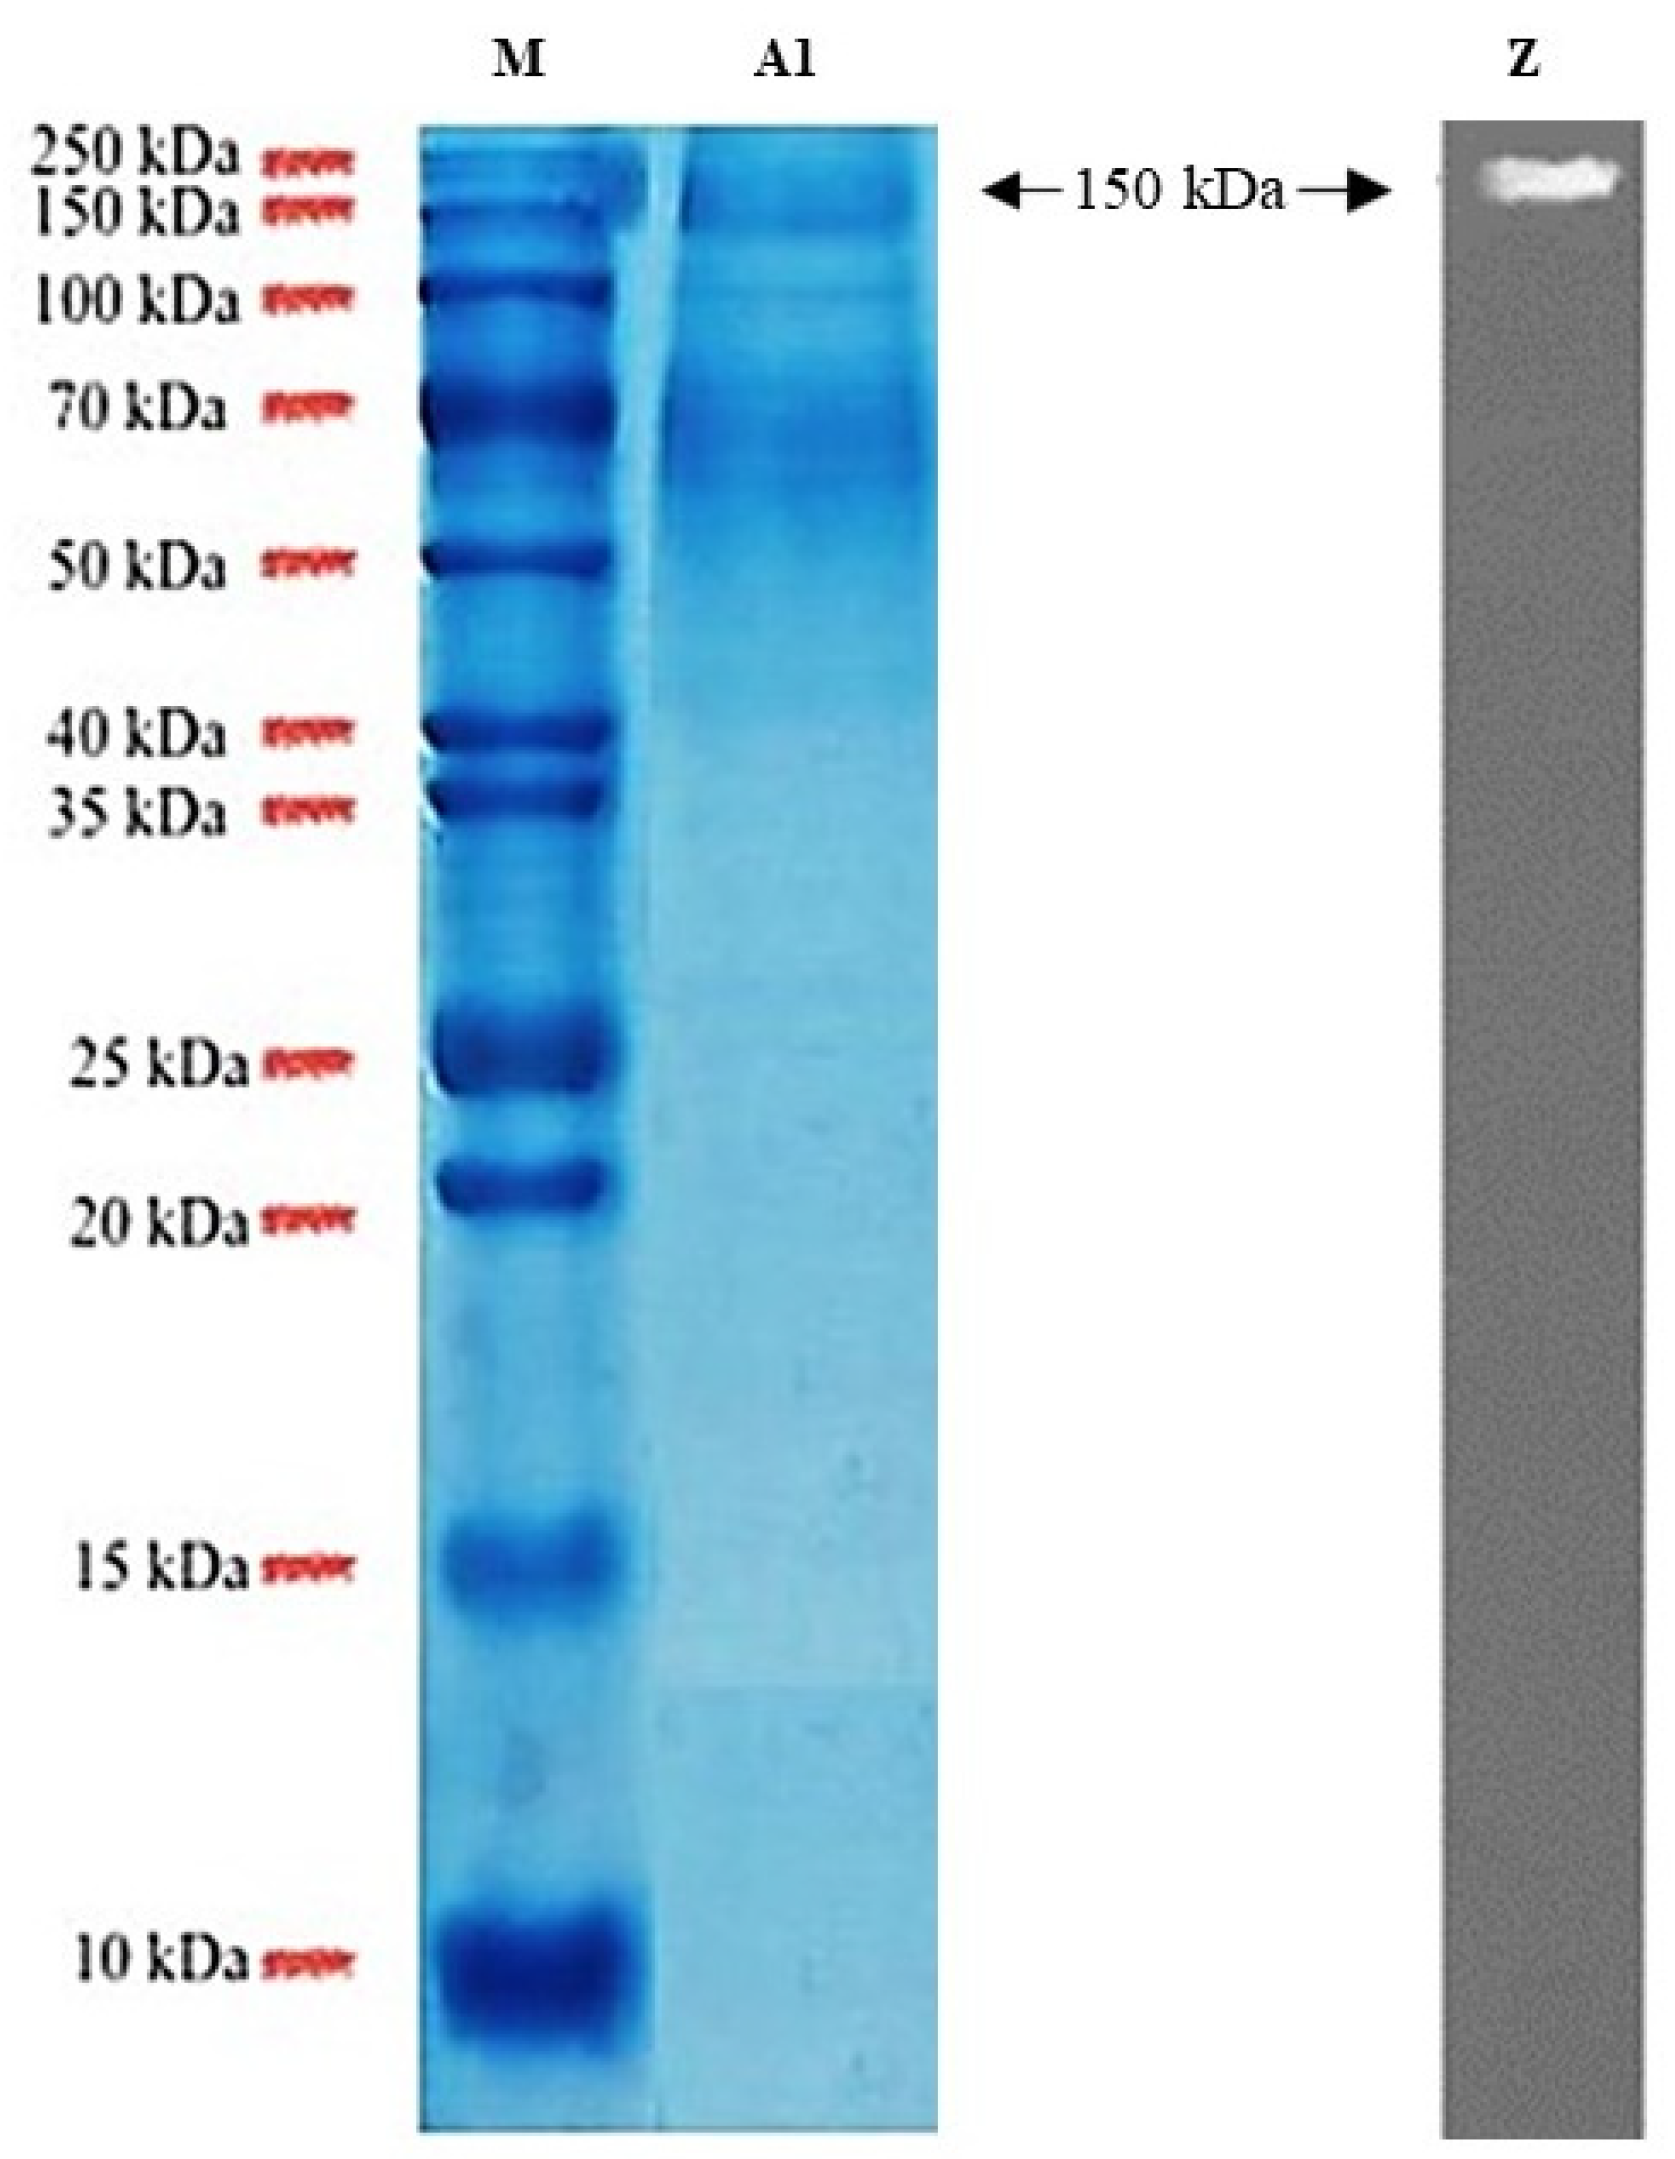
2.10. Determination of Molecular Weight via Sodium Dodecyl Sulfate Polyacrylamide Gel Electrophoresis (SDS-PAGE)

Electrophoresis was performed in a Mini-PROTEAN Tetra Vertical Electrophoresis Cell (Bio-Rad®, Hercules, CA, USA filled with a Tris–glycine buffer solution at pH 8.3 using a concentration of 12% (acrylamide/bisacrylamide). Samples were prepared at a concentration of 20 mg/mL. The loading buffer containing SDS (2% w/v), β-mercaptoethanol (5% v/v), glycerol (1% v/v), and bromophenol blue (0.001% w/v) was mixed with protein concentrate samples (4:1 ratio). The resulting solution was heated to 95 °C for 5 min in a temperature-controlled water bath to promote protein denaturation. The operating conditions were 120 V and 400 mA for two h. The gels were stained with Coomassie Brilliant Blue R-250 (Sigma Aldrich®, Burllington, MA, USA). The standard marker (Bio-Basic®, Toronto, CA) prestained protein ladder (molecular weight ranging from 10 to 250 kDa) was used to identify the sample by its molecular weight.

2.11. Zymogram Analysis

The analysis was performed using the methodology reported by Raaman et al. [29], which consisted of the confirmation of the presence of the tannase enzyme band on a gel of tannic acid. The formation of the colored bands was performed using the fraction obtained from Sodium Dodecyl Sulfate Polyacrylamide Gel Electrophoresis (SDS-PAGE) and agarose gel electrophoresis with tannic acid (0.1%). The electrophoresis gel was washed with distilled water for 2 h at 30 °C followed by 30 min washes with constant shaking, then the electrophoresis gel was incubated for 24 h with agarose gel composed of tannic acid (0.04%) and citrate buffer (pH 5.0), and the gels were left in interaction in a humid chamber with constant agitation. Finally, the gel was stained with the ruthenium red dye for 2 h and incubated at 25 °C.

3. Results and Discussion

3.1. Proximal Characterization of the Spent Green Tea Leaves

The results of the concentrations of total sugars and hydrolysable and condensed tannins in spent green tea leaves are shown in Table 2. The analysis showed that the residues had a total sugar content of 120 mg/g (Table 2). Previous reports have described that green tea leaves contain approximately 72 mg/g of total sugar [30]. The material contained approximately 242.05 mg/g (Table 2), and several reports have indicated that tea leaves contain approximately 240 mg/g of hydrolysable tannins [31]. The concentration of condensed tannins was 209.05 mg/g (Table 2), whereas other studies have reported a concentration of approximately 150 mg/g [31]. These data suggest that the support used for SSF contains essential requirements for the growth of fungal microorganisms. In addition, the production of the tannase enzyme in our system, with titers of approximately 178.70 (U/g), was enhanced by the high content of hydrolysable tannins in the spent green tea leaves. In previous reports, tannase was described as an inducible enzyme produced on tannin-rich substrates using the fungal strain A. niger GH1 [6].

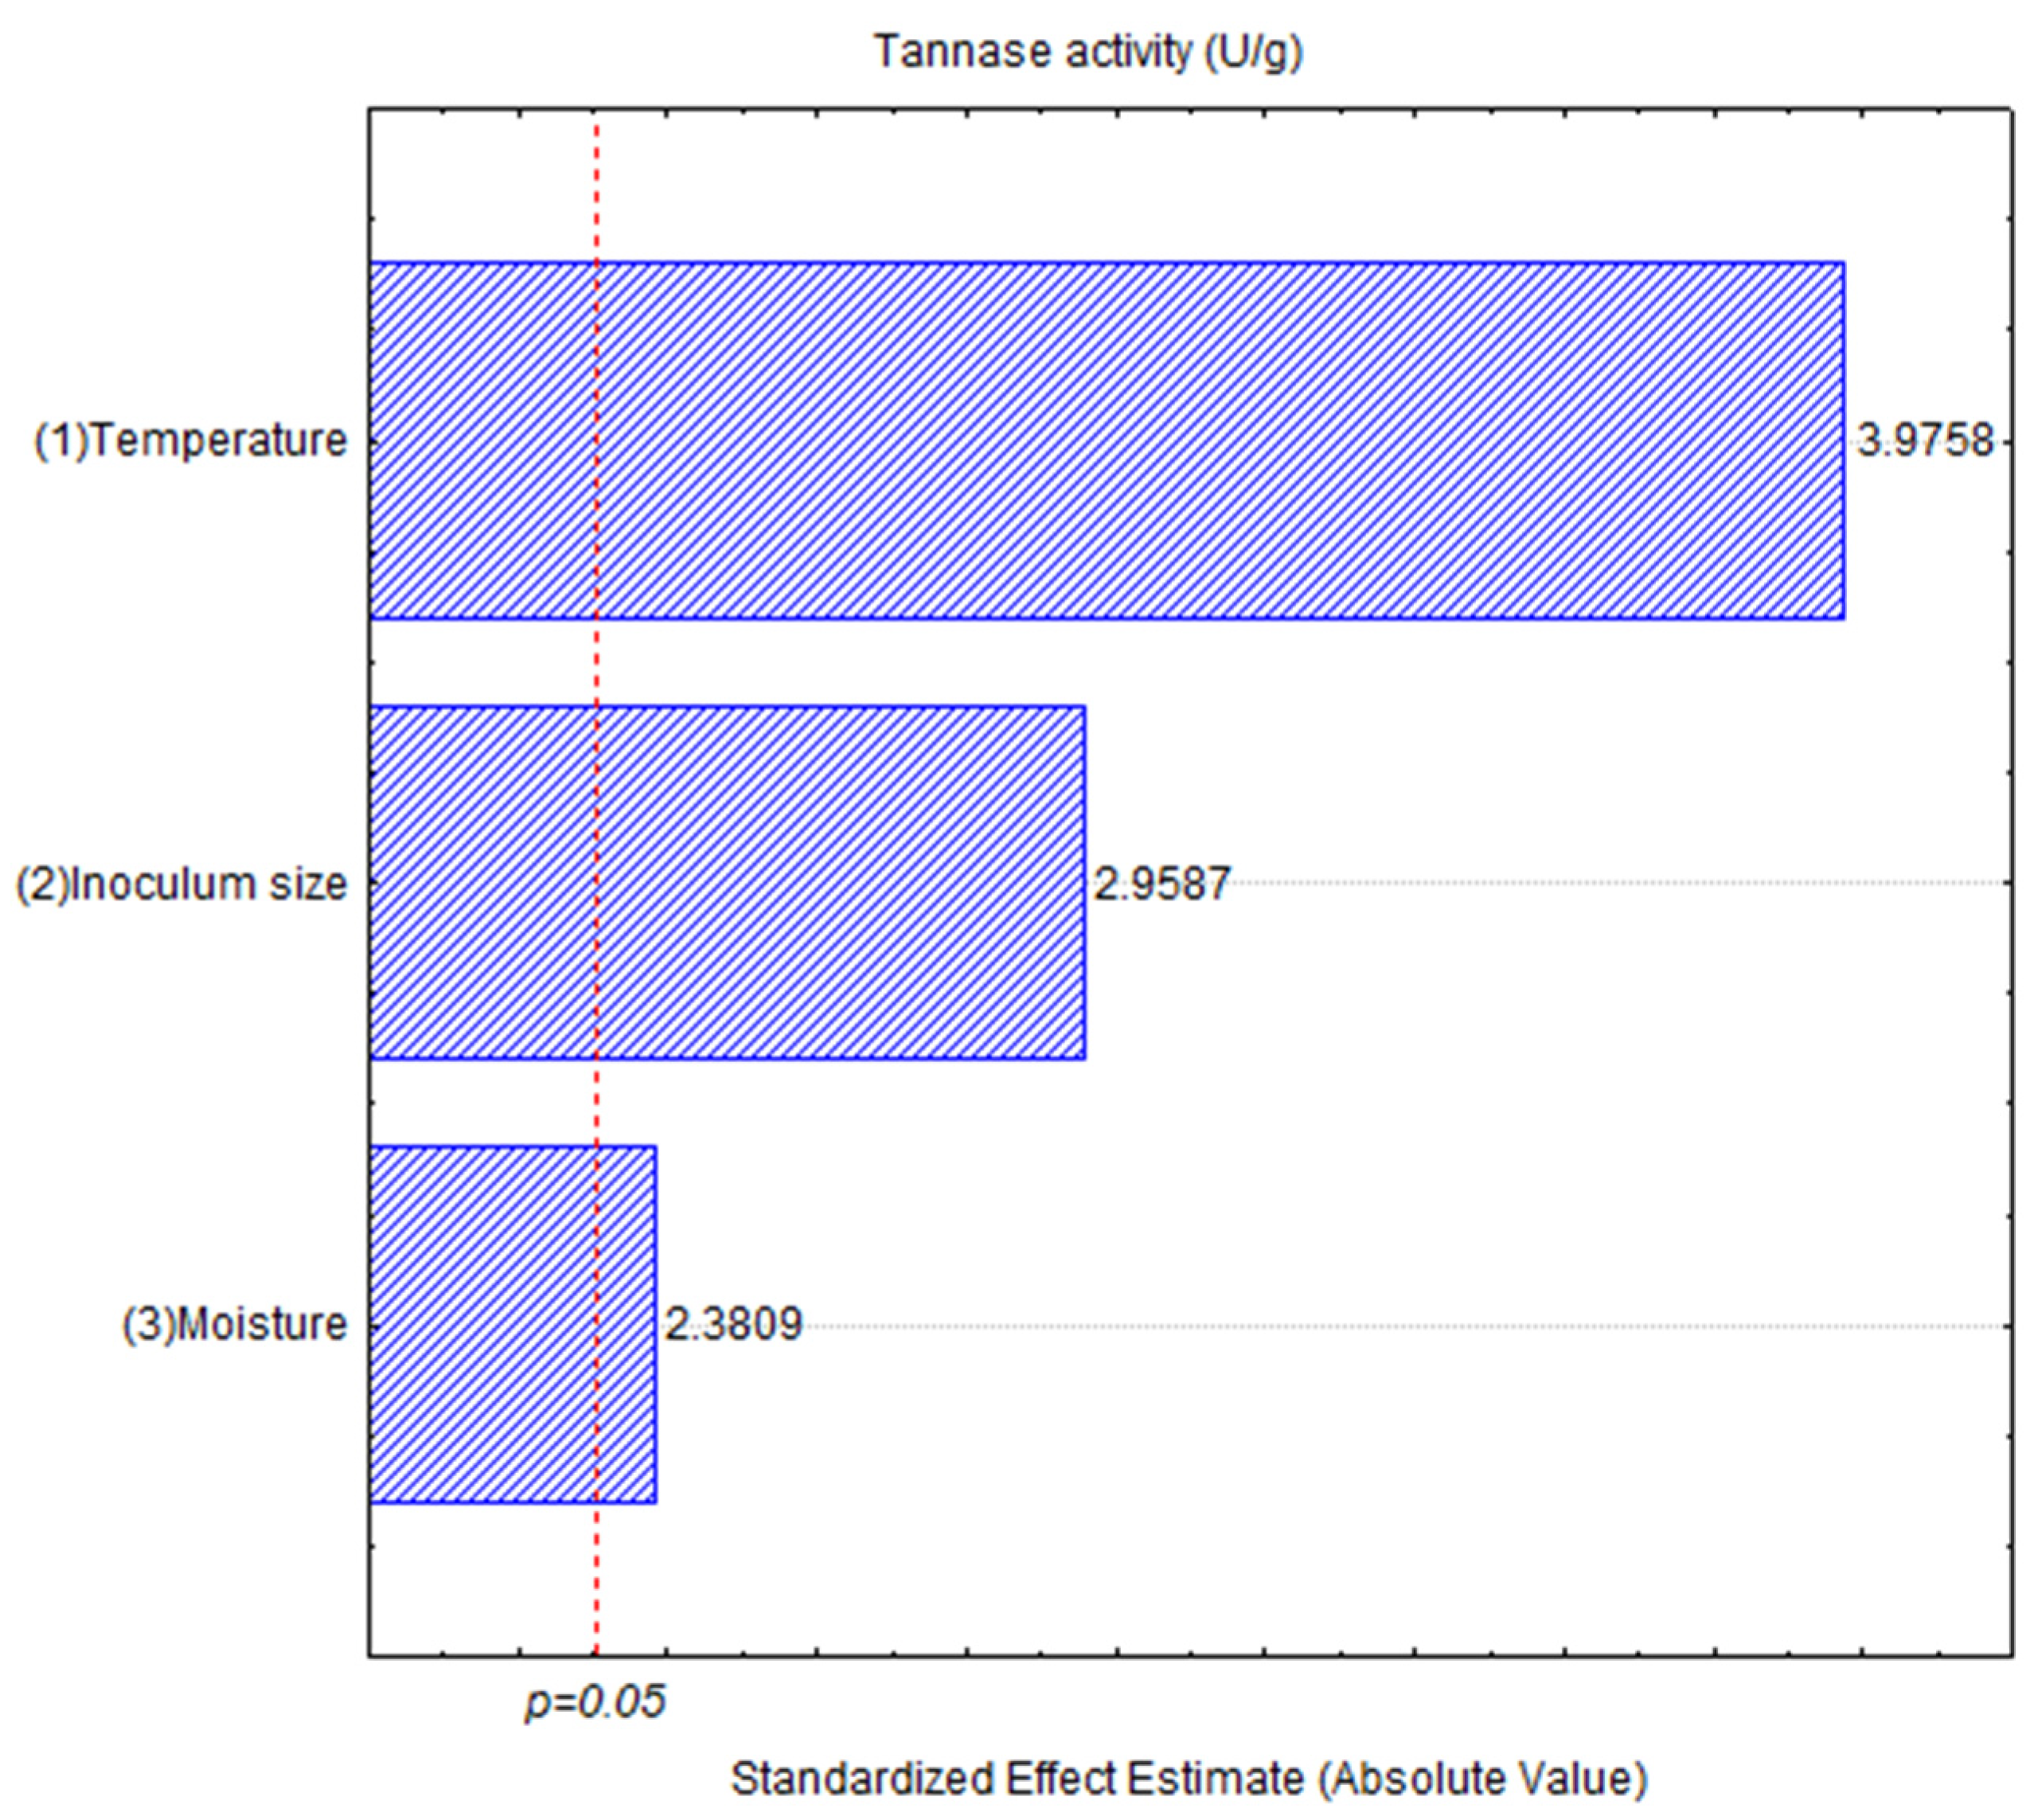
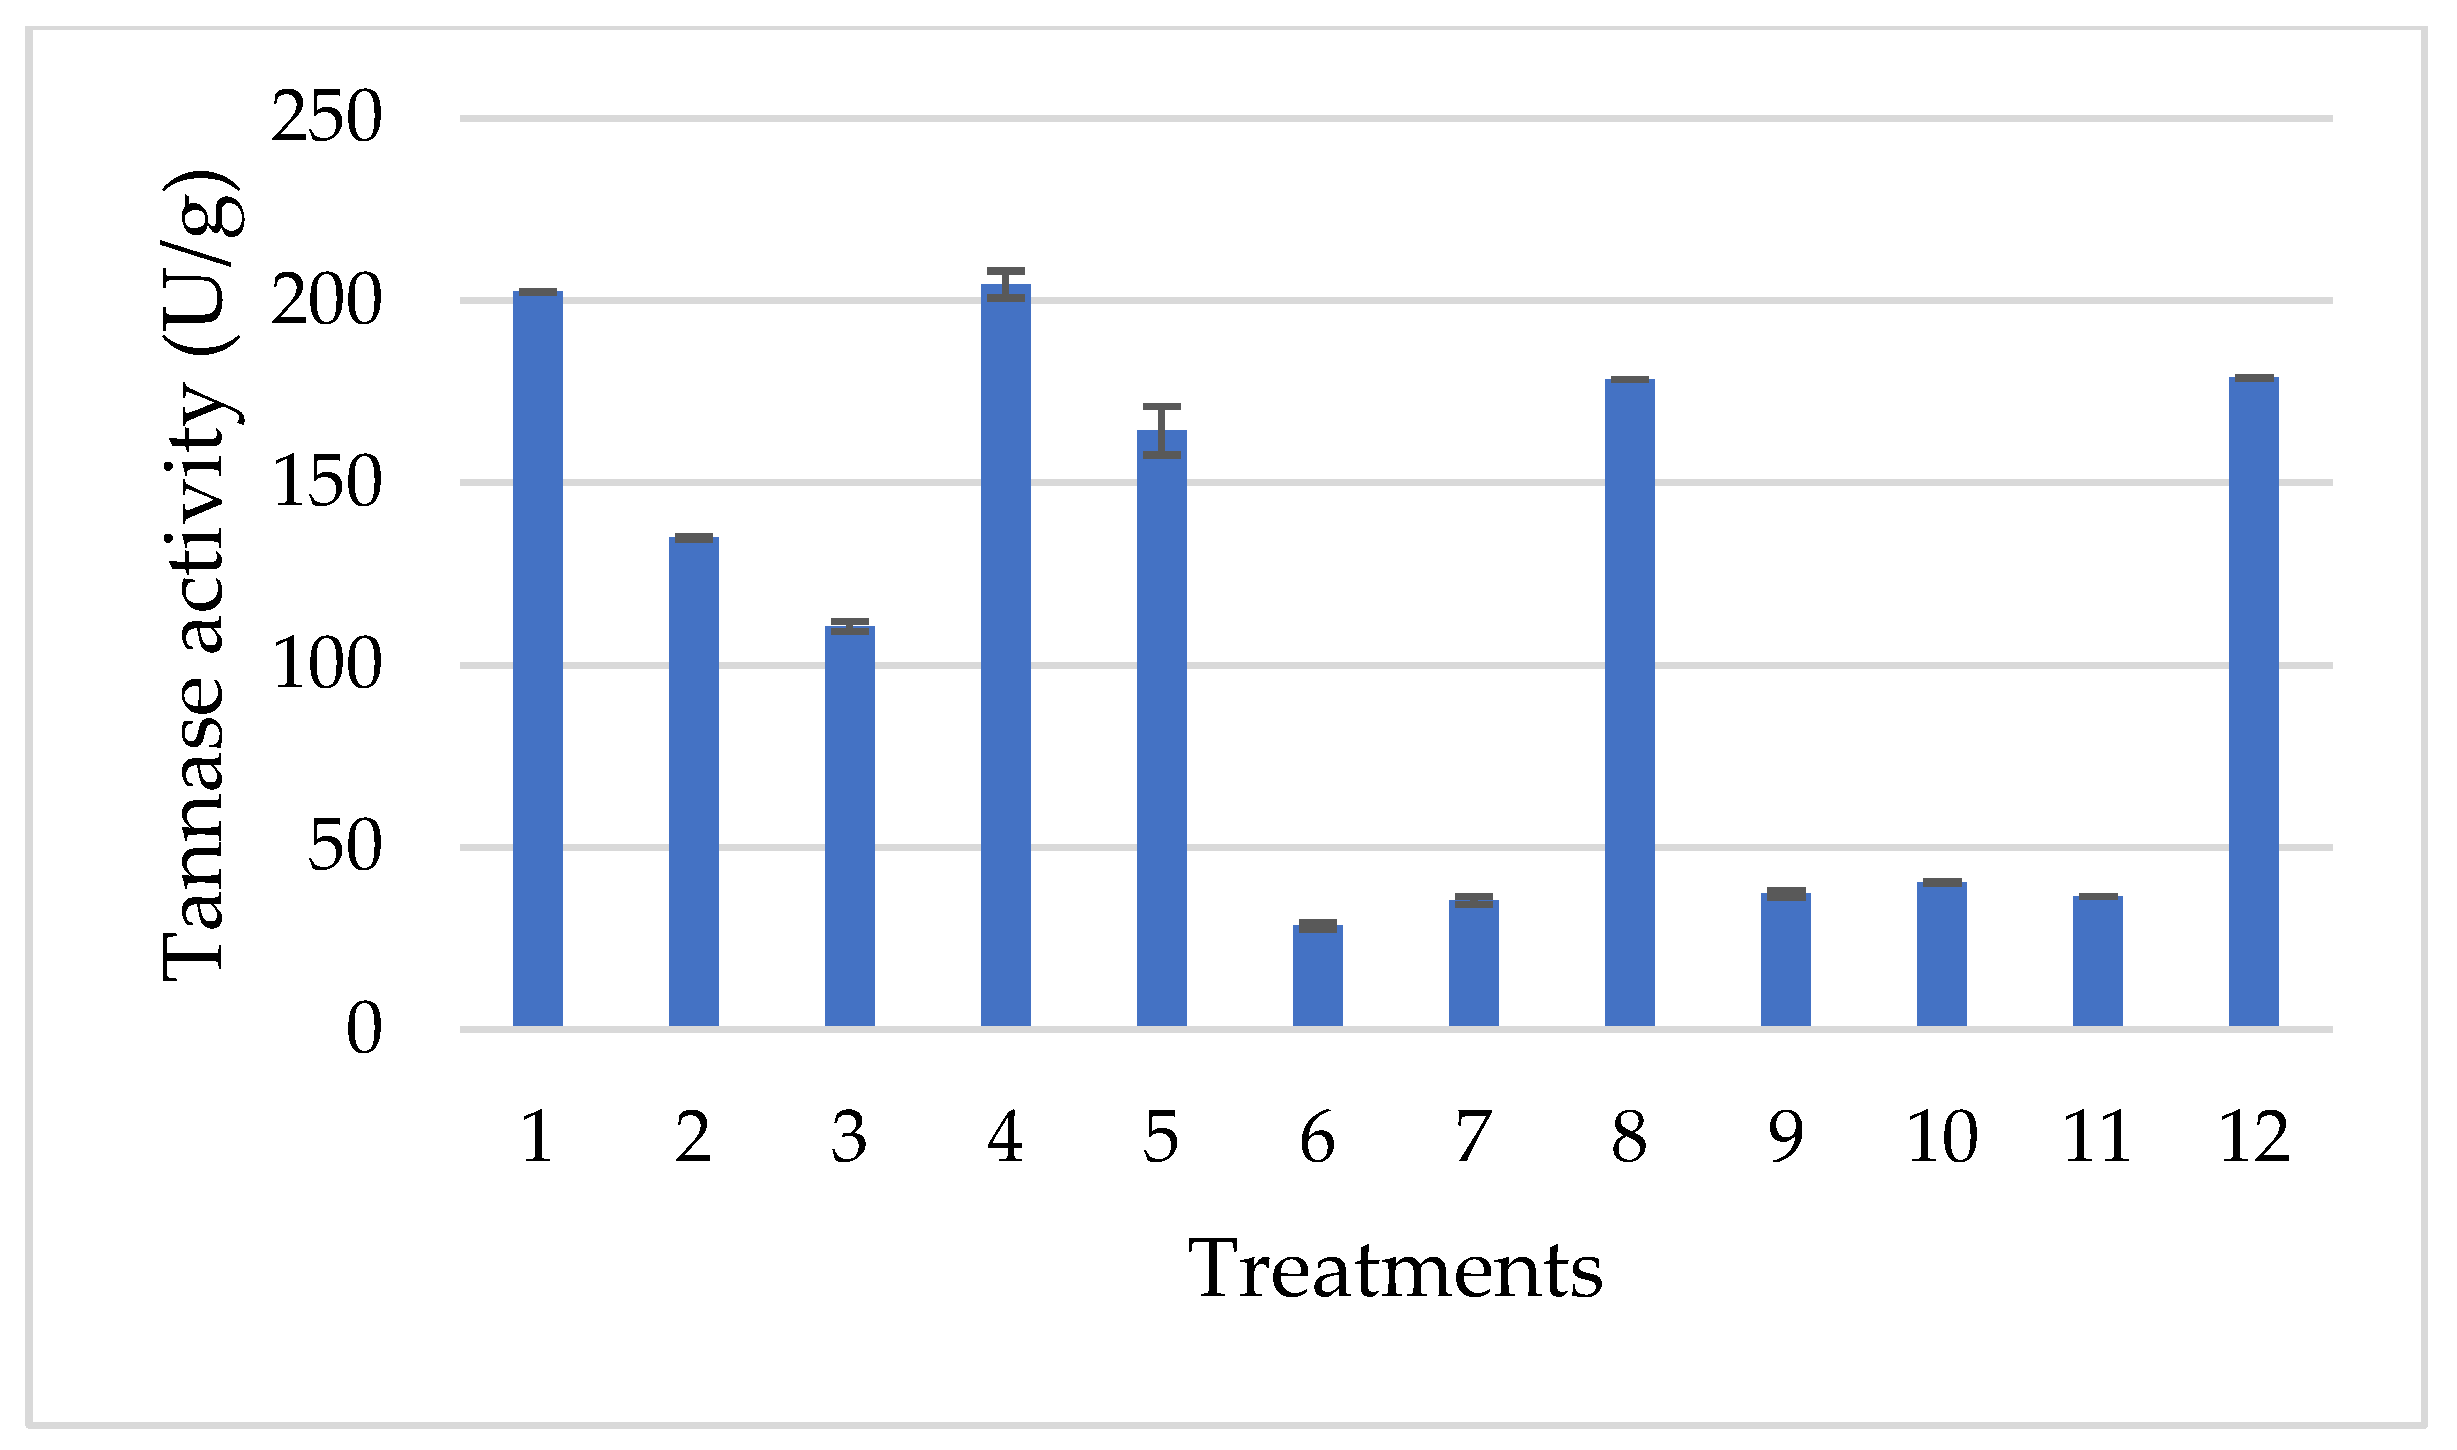
3.2. Exploratory Hunter and Hunter Design

This is the first report of tannase production by A. niger TBG 28 A, an endemic strain from the “Western Ghats”. Interestingly, this fungus produces tannase through solid-state fermentation using tea leaves as a substrate. The influence of several parameters (moisture, inoculum size, and temperature) on the enzymatic production of tannase via solid-state fermentation was evaluated. The objective of this study was to determine the parameters that influence tannase production. The Pareto chart shows that moisture, inoculum size, and temperature influenced the production of tannase (Figure 1). The best tannase production achieved was 205 (U/g) (Figure 2) at a temperature of 30 °C, moisture of 80%, and inoculum size of 1 × 10⁸ spores/mL. Aguilar et al. [32] reported that temperature and moisture are important parameters for improving tannase production. Dalsenter et al. [33] described that, even if the temperature in the system is regulated, it is difficult to control the temperature in a bioreactor because the generated heat is not dissipated, which affects the microorganism. Another study demonstrated that the moisture percentage influences fungal growth because low levels inhibit fungal growth, while high levels can induce sporulation and diminish enzymatic production [31]. Boithe and Murthy [34] reported that a moisture level of approximately 50% favored a reduction in porosity and decreased oxygen transfer. Commonly, a high inoculum level favors the degradation of antiphysiological compounds, such as alkaloids and complex tannins [35].

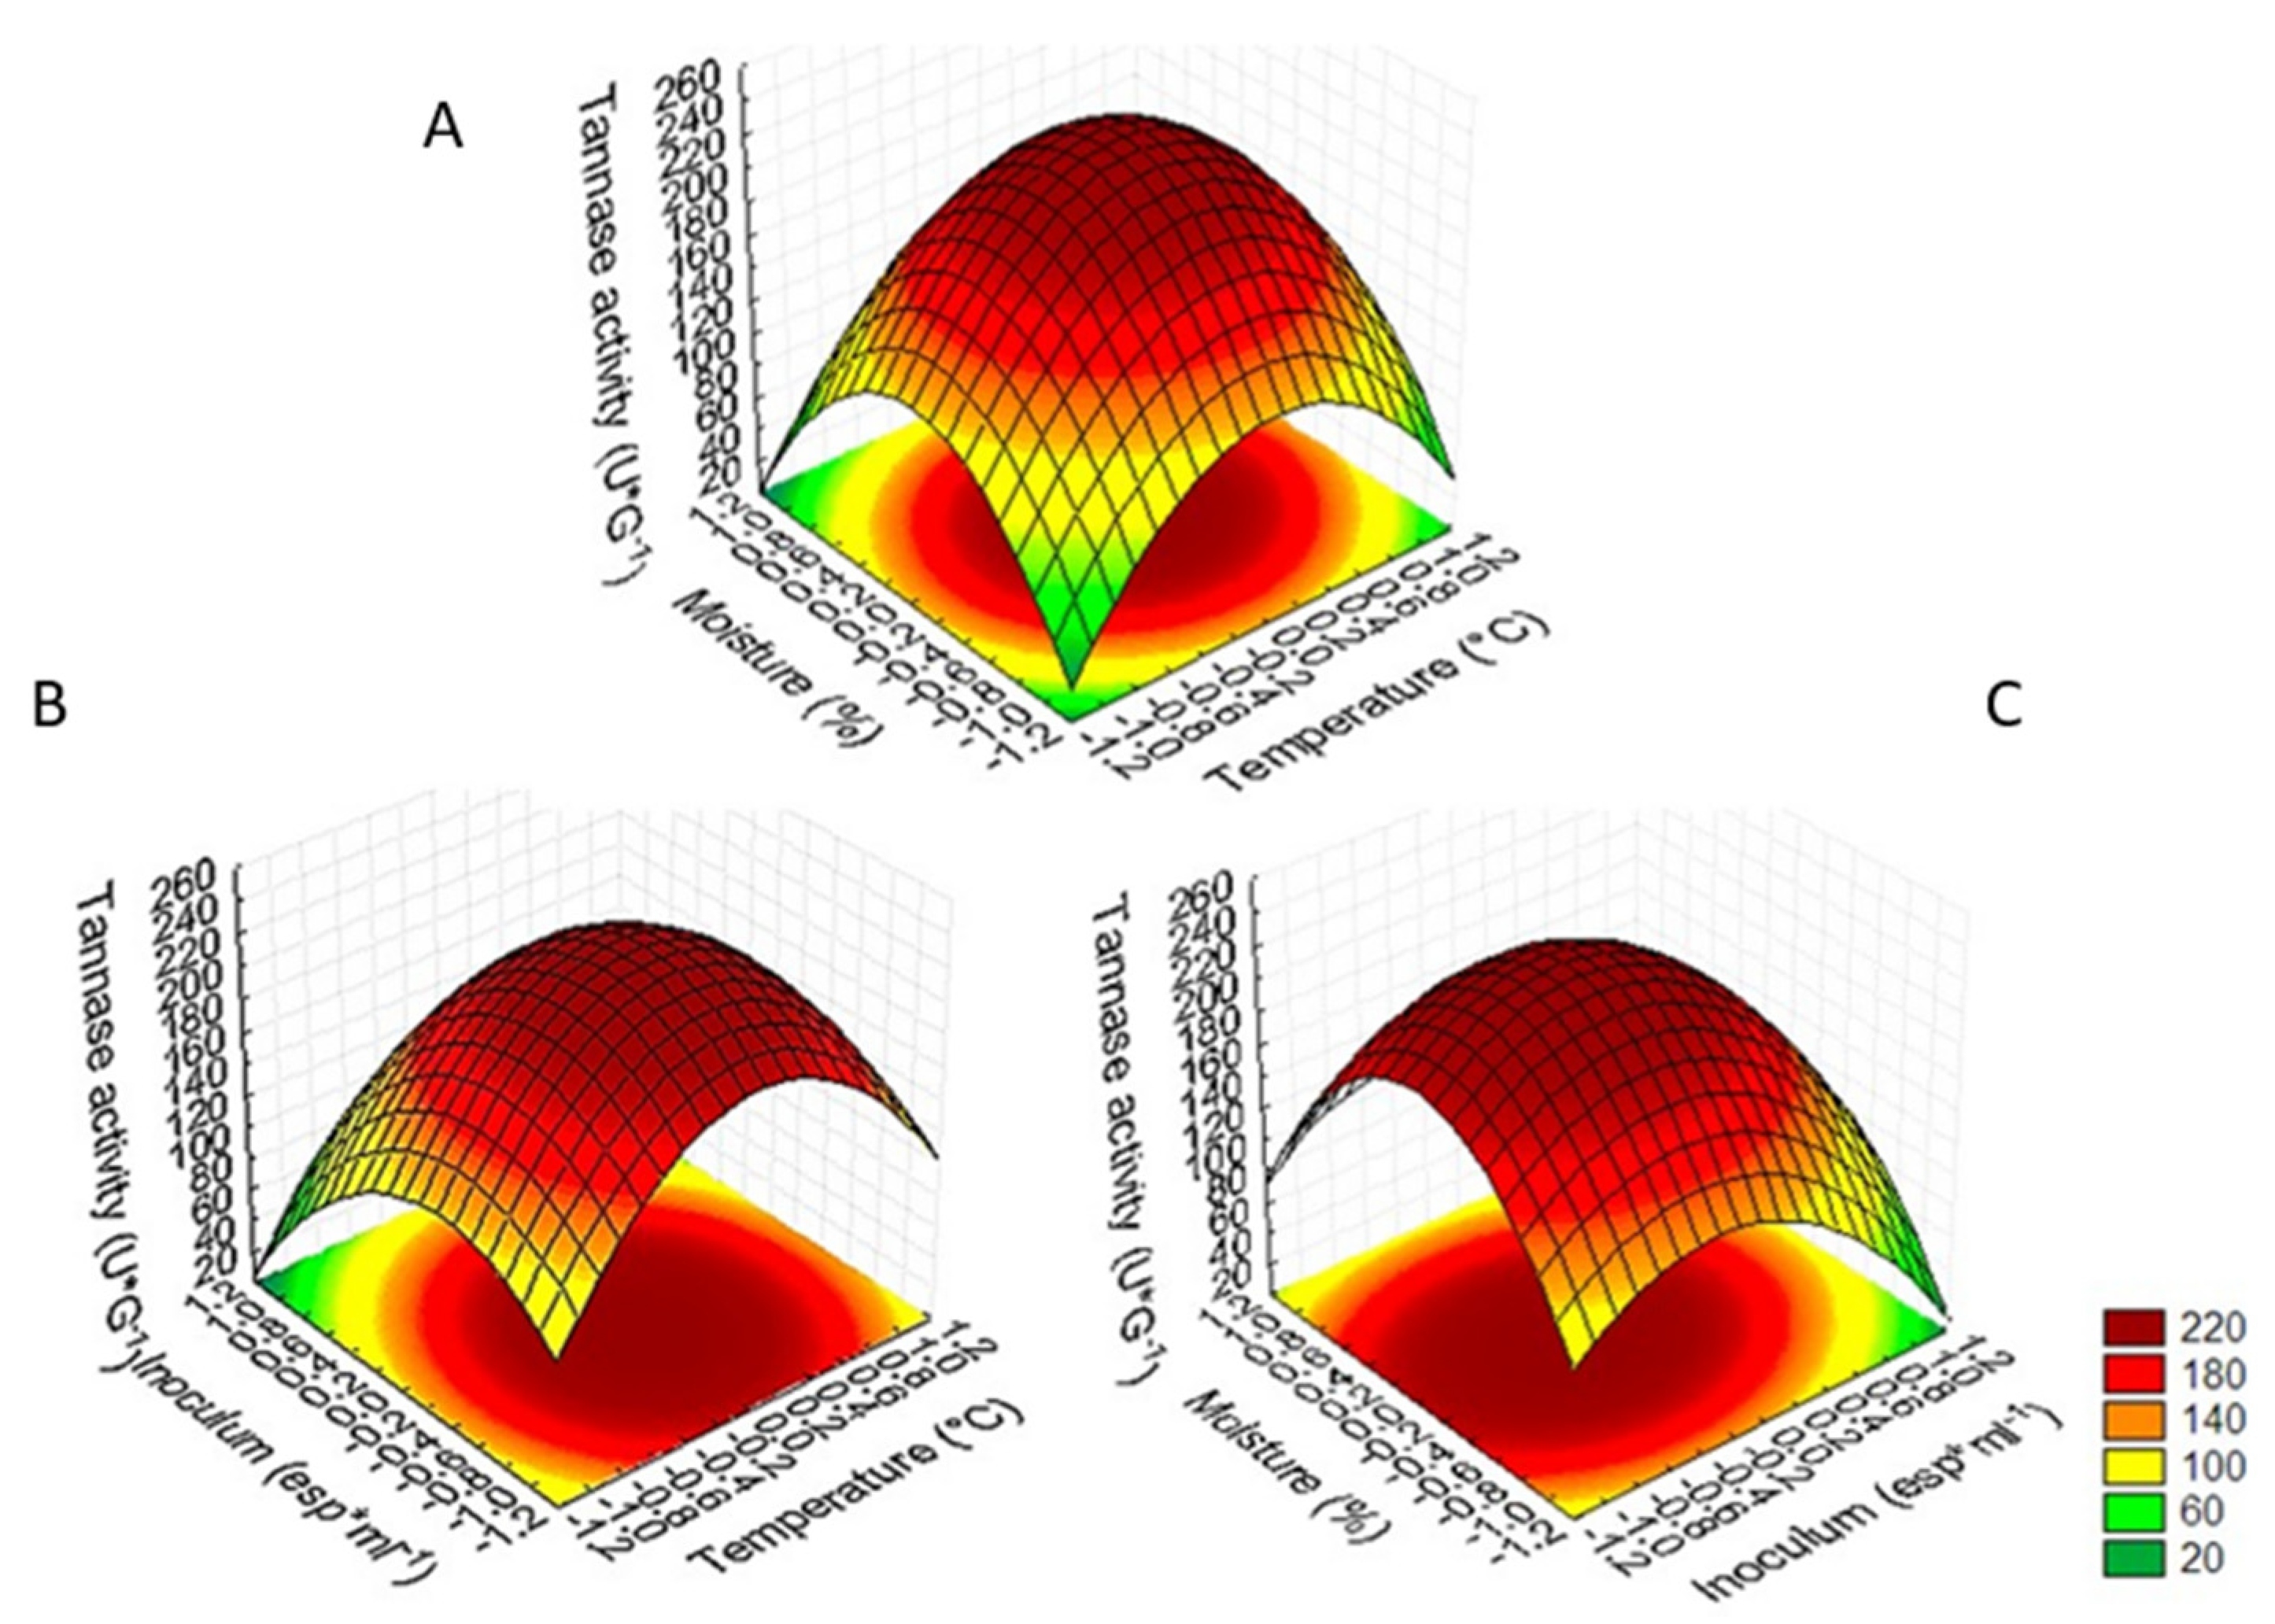
3.3. Optimization of Tannase Production

A temperature of 30 °C, moisture of 70%, and inoculum size of 1 × 10⁸ spores/mL had a significant effect on tannase yield, achieving a high enzymatic yield of 246.82 (U/g). Kumar et al. [36] reported that enzymatic production was maximized by optimizing some parameters, such as temperature, incubation time, and pH. Under optimized conditions, the experimental result of 246.82 (U/g) was very close to the theoretical value (240.33 U/g), which validates the experimental design (Equation (2)). A 9.67-fold increase in tannase production was achieved upon optimization with response surface methodology. In another study, the substrate was supplemented with 0.2% tannic acid, and a 3.25-fold increase in tannase production was reported [36]. These results suggest that supplementation with additional sources of nitrogen and carbon improves tannase production [36]. The ANOVA results of the Box–Benkhen design indicated its statistical significance with an F value of 1.12 and p-value < 0.05 (Table 3), where temperature (A), moisture (B), and inoculum size (C) presented a statistically significant linear effect with 95% confidence level. Furthermore, the following mathematical model was obtained (Equation (2)):
Y = 240.35 + 169.77 × A − 2.81 × B + 472.95 × C − 2.65A × B + 6.51 A × C + 68.01 B × C + 3.17 × A2 + 54.79 × B2 + 48.40C2
Xiao et al. [35], who used spent green tea leaves in SSF, reported a tannase activity value of 24.26 (U/g). In another report carrying out SSF using the fungal strain A. niger ATTC 16620, a tannase value of 43.1 (U/L) was obtained [37]. Bhoite and Murthy [34] found that, at pH 5.0, 50% moisture was the parameter that optimized the bioprocess, and they reported a tannase enzyme production of 107 (U/g). The mean values used for optimization were the optimal values (30 °C, 75%, and 1 × 10⁷ spores/mL). The coefficient of determination (R2 = 0.9410) indicated that only 94.1% of the observed variations in the model could be interpolated. All evaluated variables (temperature, moisture, and inoculum size) had values of p < 0.05.
The response surface diagram (Figure 3) is convex in shape, indicating that optimum process conditions were achieved. Figure 3A shows the interaction between some variables; a temperature of 30 °C and a moisture content of 75% promoted high tannase production.
In another study on Lactobacillus plantarum, the optimal tannase activity was achieved at temperatures between 30 °C and 40 °C [38]. Rodríguez-Duran et al. [39] reported a maximum tannase production of 7.95 U/L by A. niger in a solid-state packed-bed bioreactor with an incubation temperature of 30 °C and an initial pH of 4.0.
Figure 3B shows that a temperature level of 30 °C and an inoculum size of 1 × 10⁷ spores/mL improved tannase production and had a significant effect on the response (p < 0.05). Castro et al. [40] reported that a temperature level of 30 °C and an inoculum size of 1 × 10⁶ (spores/g) were optimal for improving the production of tannase. Renovato et al. [41] reported a maximum level of tannase production of 14.76 in SSF with a level of temperature of 50 °C. Figure 3C shows that the interaction between moisture (70%) and inoculum size (1 × 10⁷ spores/mL) enhanced tannase production. Another study reported a fungal spore inoculum of 5 × 10⁷ spores/mL as optimal for tannase production [42]. It has been reported that the moisture content in fermentation systems is a critical factor for the growth of microorganisms because the level of moisture could affect the solubility of nutrients [43], and a high inoculum size improves the growth rate and reduces the adaptation phase [21].

3.4. Production of Tannase, Biomass, and Soluble Protein in SSF

Agro-industrial residues have been widely used in SSF because of their capacity to support the growth of several microorganisms [44]. Tannase production was achieved via SSF using spent green tea leaves, obtaining a tannase activity of 246.83 (U/g) (Table 4). In another study, spent green tea leaves were applied as a support for fermentation, and an enzymatic yield of 65 U/g was reported [45]. Several microsystems have been used to evaluate the production of tannase during fermentation processes. Moreover, it has been reported that bacteria of the genus Lactobacillus spp. produce tannase; however, their production levels were found to be low. It has been reported that Lactobacillus plantarum CECT 748 T attains a production level of 6.26 U/mL [46]. In another study using Enterobacter cloacae strain 41, the production level was 2.81 U/mL [1]. However, it has been pointed out that some yeasts such as Kluyveromyces marxianus are sources of tannase, giving an enzymatic yield of 102. 6 U/g [47]. Filamentous fungi of the Aspergillus and Penicillium genus are tannase producers [48,49]. Fungi of the genus Penicillium sp. are tannase producers [48] with an enzymatic yield of 31.1 U/mL. Similarly, tannase from A. niger and A. japonicus reported production yields of 29.13 and 25.6 (U/mL), respectively [49]. Interestingly, the yields of enzymatic production using a novel strain of A. niger TBG 28 A were higher than those of traditional strains.
Biomass production increased from 24 to 48 h of fermentation (p < 0.05) (Table 3). However, it began to decrease after 72 h. It has been described that fungal biomass exhibits exponential growth between 0 and 36 h because the main transformation of the substrate and fungal cells takes place undergo primary metabolism [50]. The maximum levels of biomass correlated with maximal tannase production (246 U/g) (p < 0.05). Another study carried out on Penicillium verrucosum showed that the highest tannase activity occurred between 24 and 36 h [34]. The invasion of fungal biomass is an excellent index for evaluating the efficiency of different bioprocesses, as well as for analyzing cell growth and enzymatic synthesis [50]. In addition, the content of soluble protein was also measured (Table 4), and it was observed that the highest concentration of soluble protein was registered at 48 h (60.04 mg/g) (p < 0.05), showing a similar behavior to enzymatic activity (Table 4). The soluble protein concentration changes during the fermentation process because several processes that occur during microbial metabolism affect the soluble protein content, and fungi can release enzymes, which can release tannins or other compounds [51]. Beltran et al. [52] reported that protein dissociation is correlated with enzymatic production because enzymes increase their activity depending on their level of dissociation.

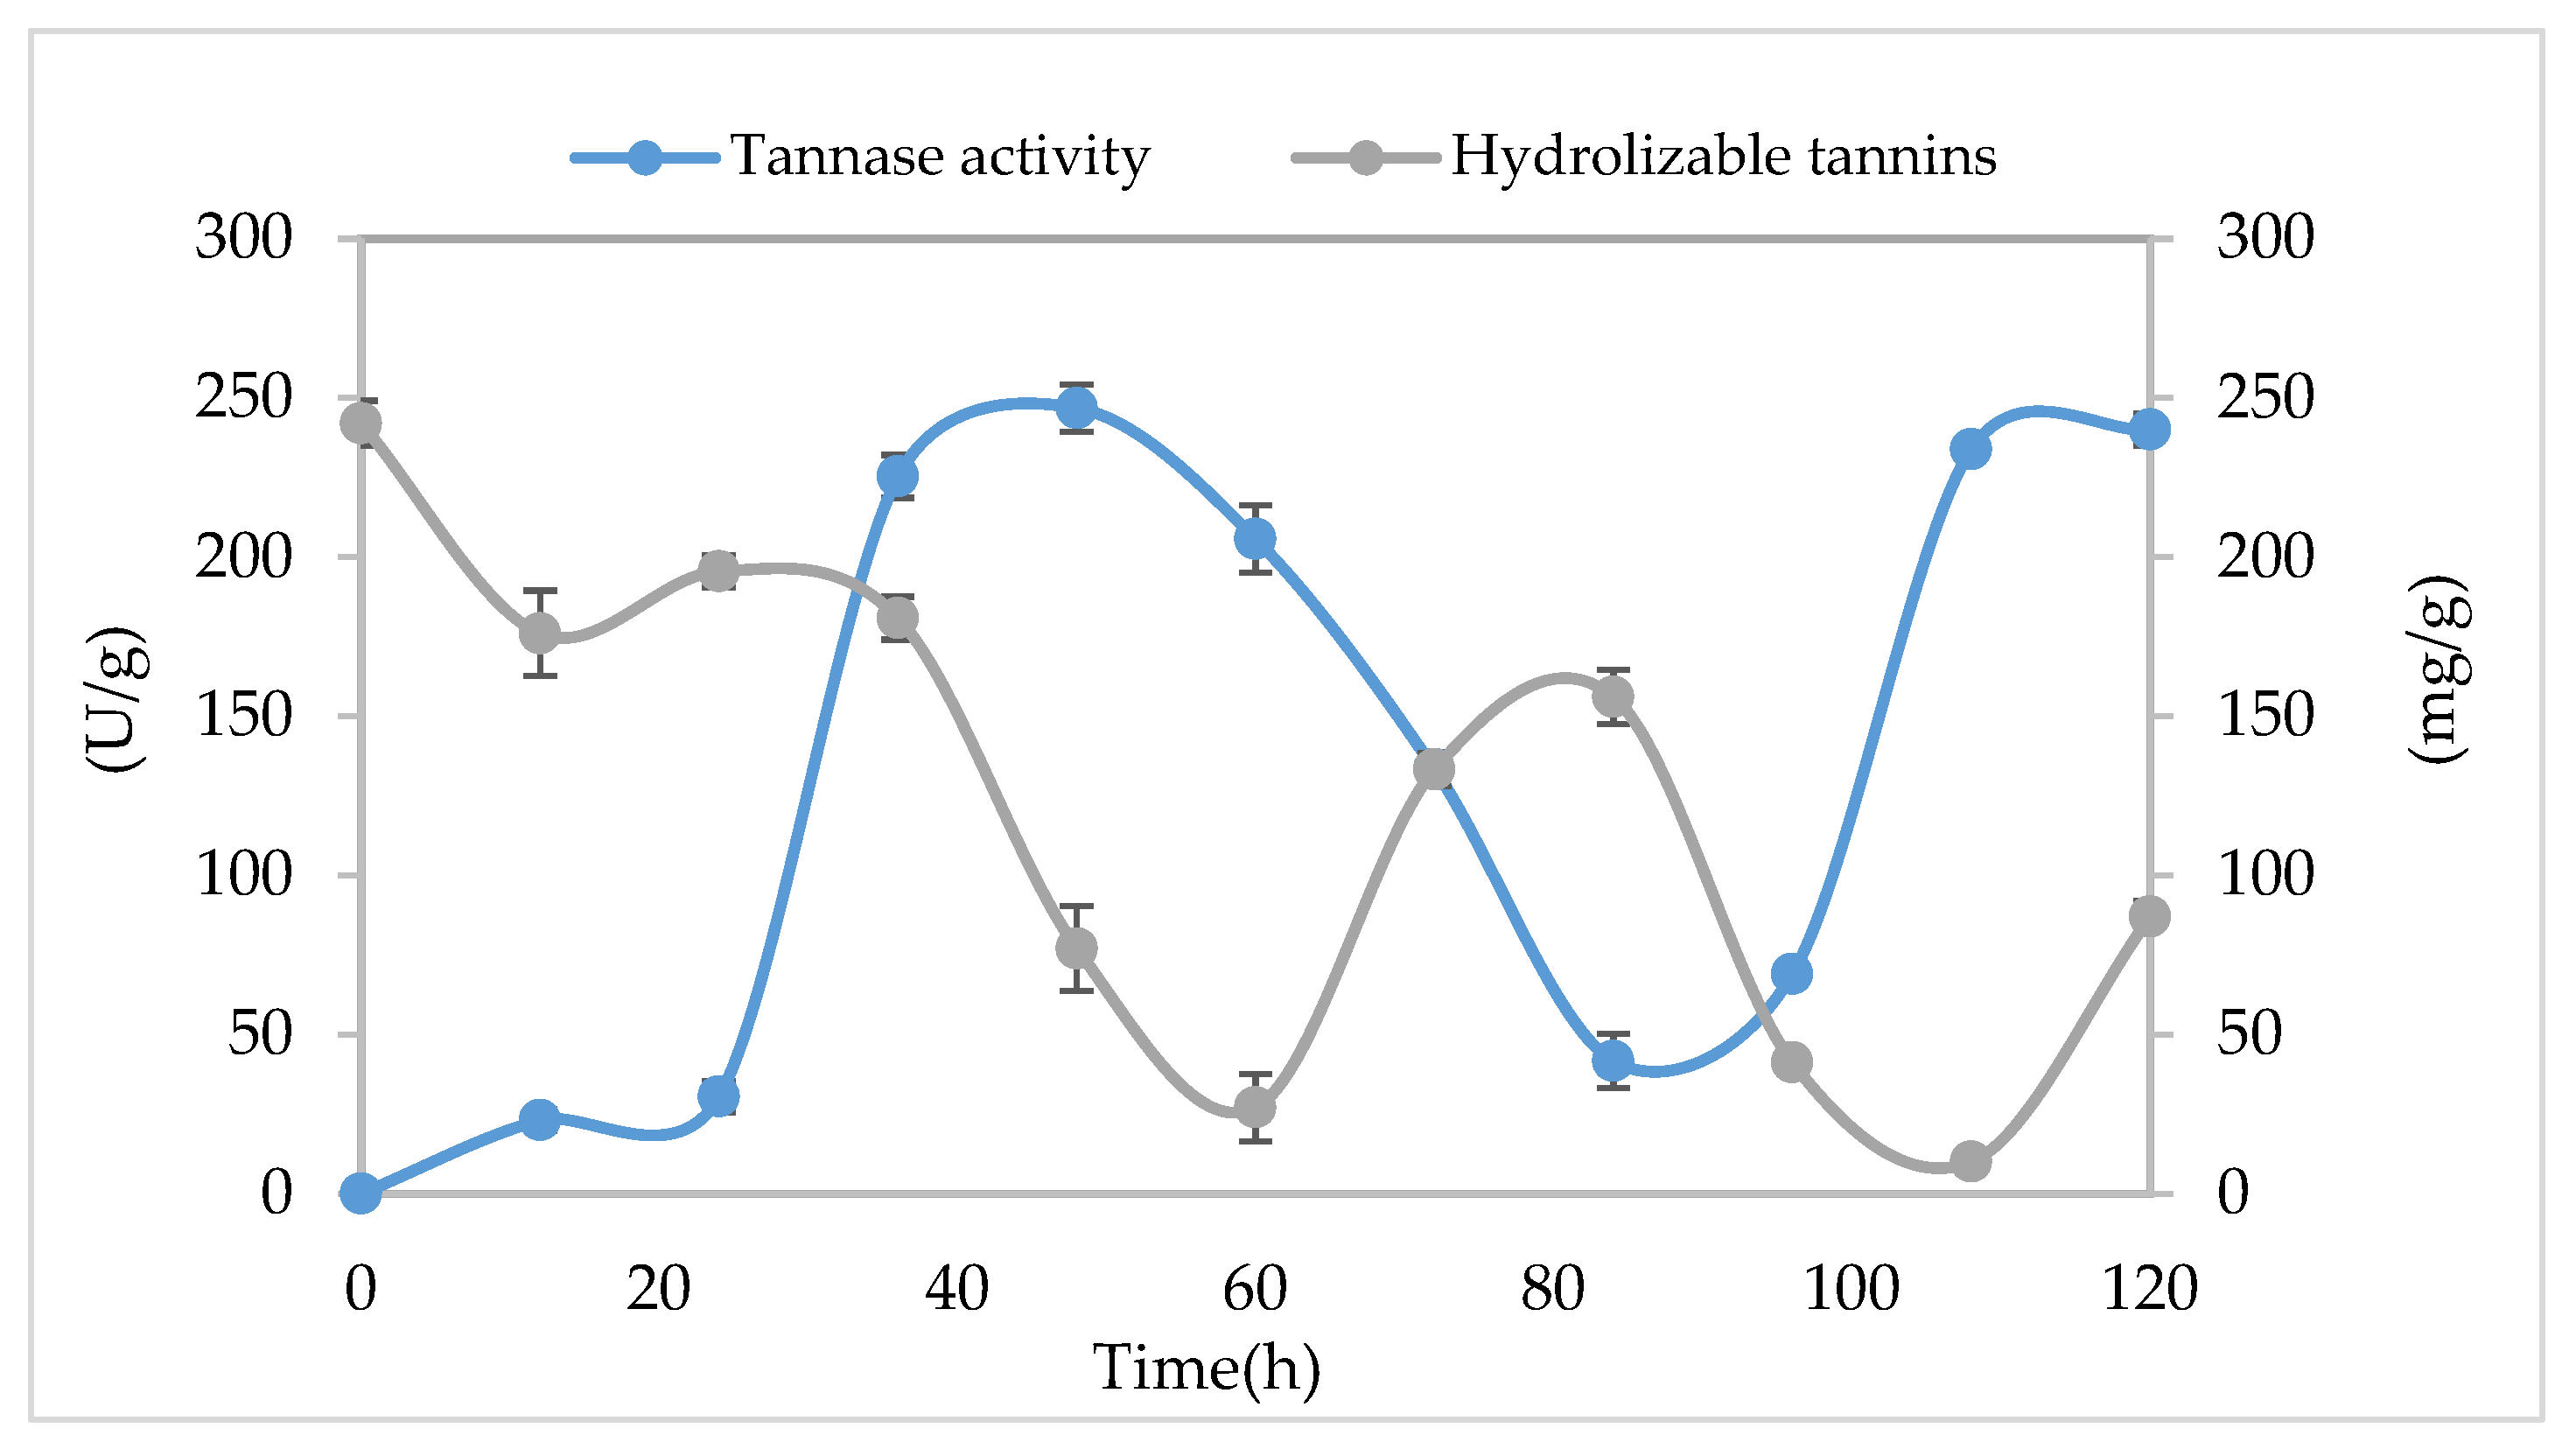
3.5. Kinetical Behavior of Tannase Enzyme in SSF

Tannase activity exhibited an exponential behavior from 12 to 48 h. The maximum tannase activity yield was achieved at 48 h (246.82 U/g). Subsequently, the enzyme activity began to decrease (Figure 4). A decrease in tannase activity could be associated with a lack of nutrients during the fermentation process [53]. Additionally, tannase production in Penicillium and Aspergillus was found to be rapid in the presence of carbon supplements [53]. During the last hours of fermentation (from 96 to 120 h), tannase activity increased. Lekshmi et al. [12] studied the production of tannase by Bacillus velezensis TA3 under SSF and found that 57 h of fermentation was the optimum value for tannase production. Different patterns of enzymatic activity in SSF have been correlated with the formation of concentration gradients [54], aggravating the accumulation of products in SSF, which may induce repressor and inducer effects and, consequently, affect enzymatic production [55]. Similarly, in another study, tannase exhibited a decrease in activity [56]. The behavior of tannase through fermentation kinetics is not fully understood [57]. Some typical behaviors of tannase activity have been reported in previous studies, indicating that tannase activity exhibits an exponential behavior and then starts to decrease [57]. Enzymatic activity has been correlated with the content of hydrolysable tannins; hence, tannase is known as an inducible enzyme [58]. Its activity can be influenced by the phenolic compound content [58]. The differences in tannase activity could be associated with the degradation of phenolic compounds during fermentation [59].
It was observed that there was a reduction in tannin content at 24 h (Figure 4). The level of hydrolysable polyphenols at the start of the fermentation was 232.05 (mg/g). After 24 h, the hydrolysable polyphenol content decreased. Previous studies have reported that the binding protein effect can diminish polyphenol content [32]. In addition, the SSF process showed a high production of tannase activity (246.82 U/g) and a reduction in the hydrolysable tannin content (77.05 mg/g) after 48 h. Conversely, Mohan et al. [60] reported an incubation time of 96 h as the optimum for enhanced tannase production from Aspergillus foetidus MTCC 3557. However, after 72 h, the hydrolysable tannin content increased. This behavior can be associated with the high polydispersity of galloyl glucose derivatives [55]. Tannin degradation in fungal systems is complex [55], and the production of gallic acid is the major prooduct [55]. Kumar et al. [61] described the degradation pathway of gallotannins in Citrobacter freundii and reported the production of gallic acid and glucose in the final time of the fermentation periods. The conversion of higher-molecular-mass compounds, such as hepta-, hexa-, and penta-galloyl glucose in tri- and di-galloyl glucose and gallic acid, is mediated by tannase enzymatic catalysis [62]. Additionally, the presence of different galloyl groups in the kinetics of fermentation has been reported [55].

3.6. Purification of Tannase and Molecular Mass Determination

Tannase purification was performed using a two-step purification process consisting of dialysis and ultracentrifugation. The crude enzyme extract had a total activity of 247.12 (U/g), with a specific activity of 0.5 (U/mg). The crude enzyme extract was dialyzed against 0.01 M citrate buffer (pH 5.5), and the enzyme was purified 9.66-fold with a specific activity of 25.30 (U/mg) and recovery of 67.99%. The dialyzed enzyme was purified through ultrafiltration with a centrifugal filter of 150 MWCO (molecular weight cutoff), and the enzyme was purified 12.60-fold with a specific activity of 8.55 (U/mg) and recovery of 16.35% (Table 5).
Sivashanmugam and Jayaraman [63] recovered 23.7% of Klebsiella pneumoniae MTCC 7162 tannase with a lower specific activity of 0.547 U/mg. Beniwal et al. [64] purified tannase from Enterobacter cloacae through ultrafiltration with 100 MWCO (molecular weight cutoff) and reported 1.78-fold purification with 37.1% recovery. Kumar et al. [60] reported 8.55-fold purification with a specific activity of 2.31 (U/mg). In another study conducted in Aspergillus phoenicis, a purification fold of 25% and specific activity of 10 (U/mg) were reported [65]. SDS-polyacrylamide gel electrophoresis showed protein bands of 150 kDa, 100 kDa, and 70 kDa (Figure 5). Variations in molecular weight are associated with different isoforms of the tannase enzyme [66]. Chaitanyakumar et al. [17] reported tannases with molecular weights of 185 kDa and 186 kDa. In another study conducted on Verticillium sp., tannase enzymes with a molecular weight of 154.5 kDa were obtained. The formation of a 150 kDa band in the agarose gel confirmed the hydrolytic activity of tannase against tannic acid (Figure 5). Rodriguez et al. [67] reported a tannase molecular mass of 186 kDa. Through a zymogram analysis, Angelova et al. [68] also reported the presence of a band of a hydrolytic enzyme using Aspergillus spp.

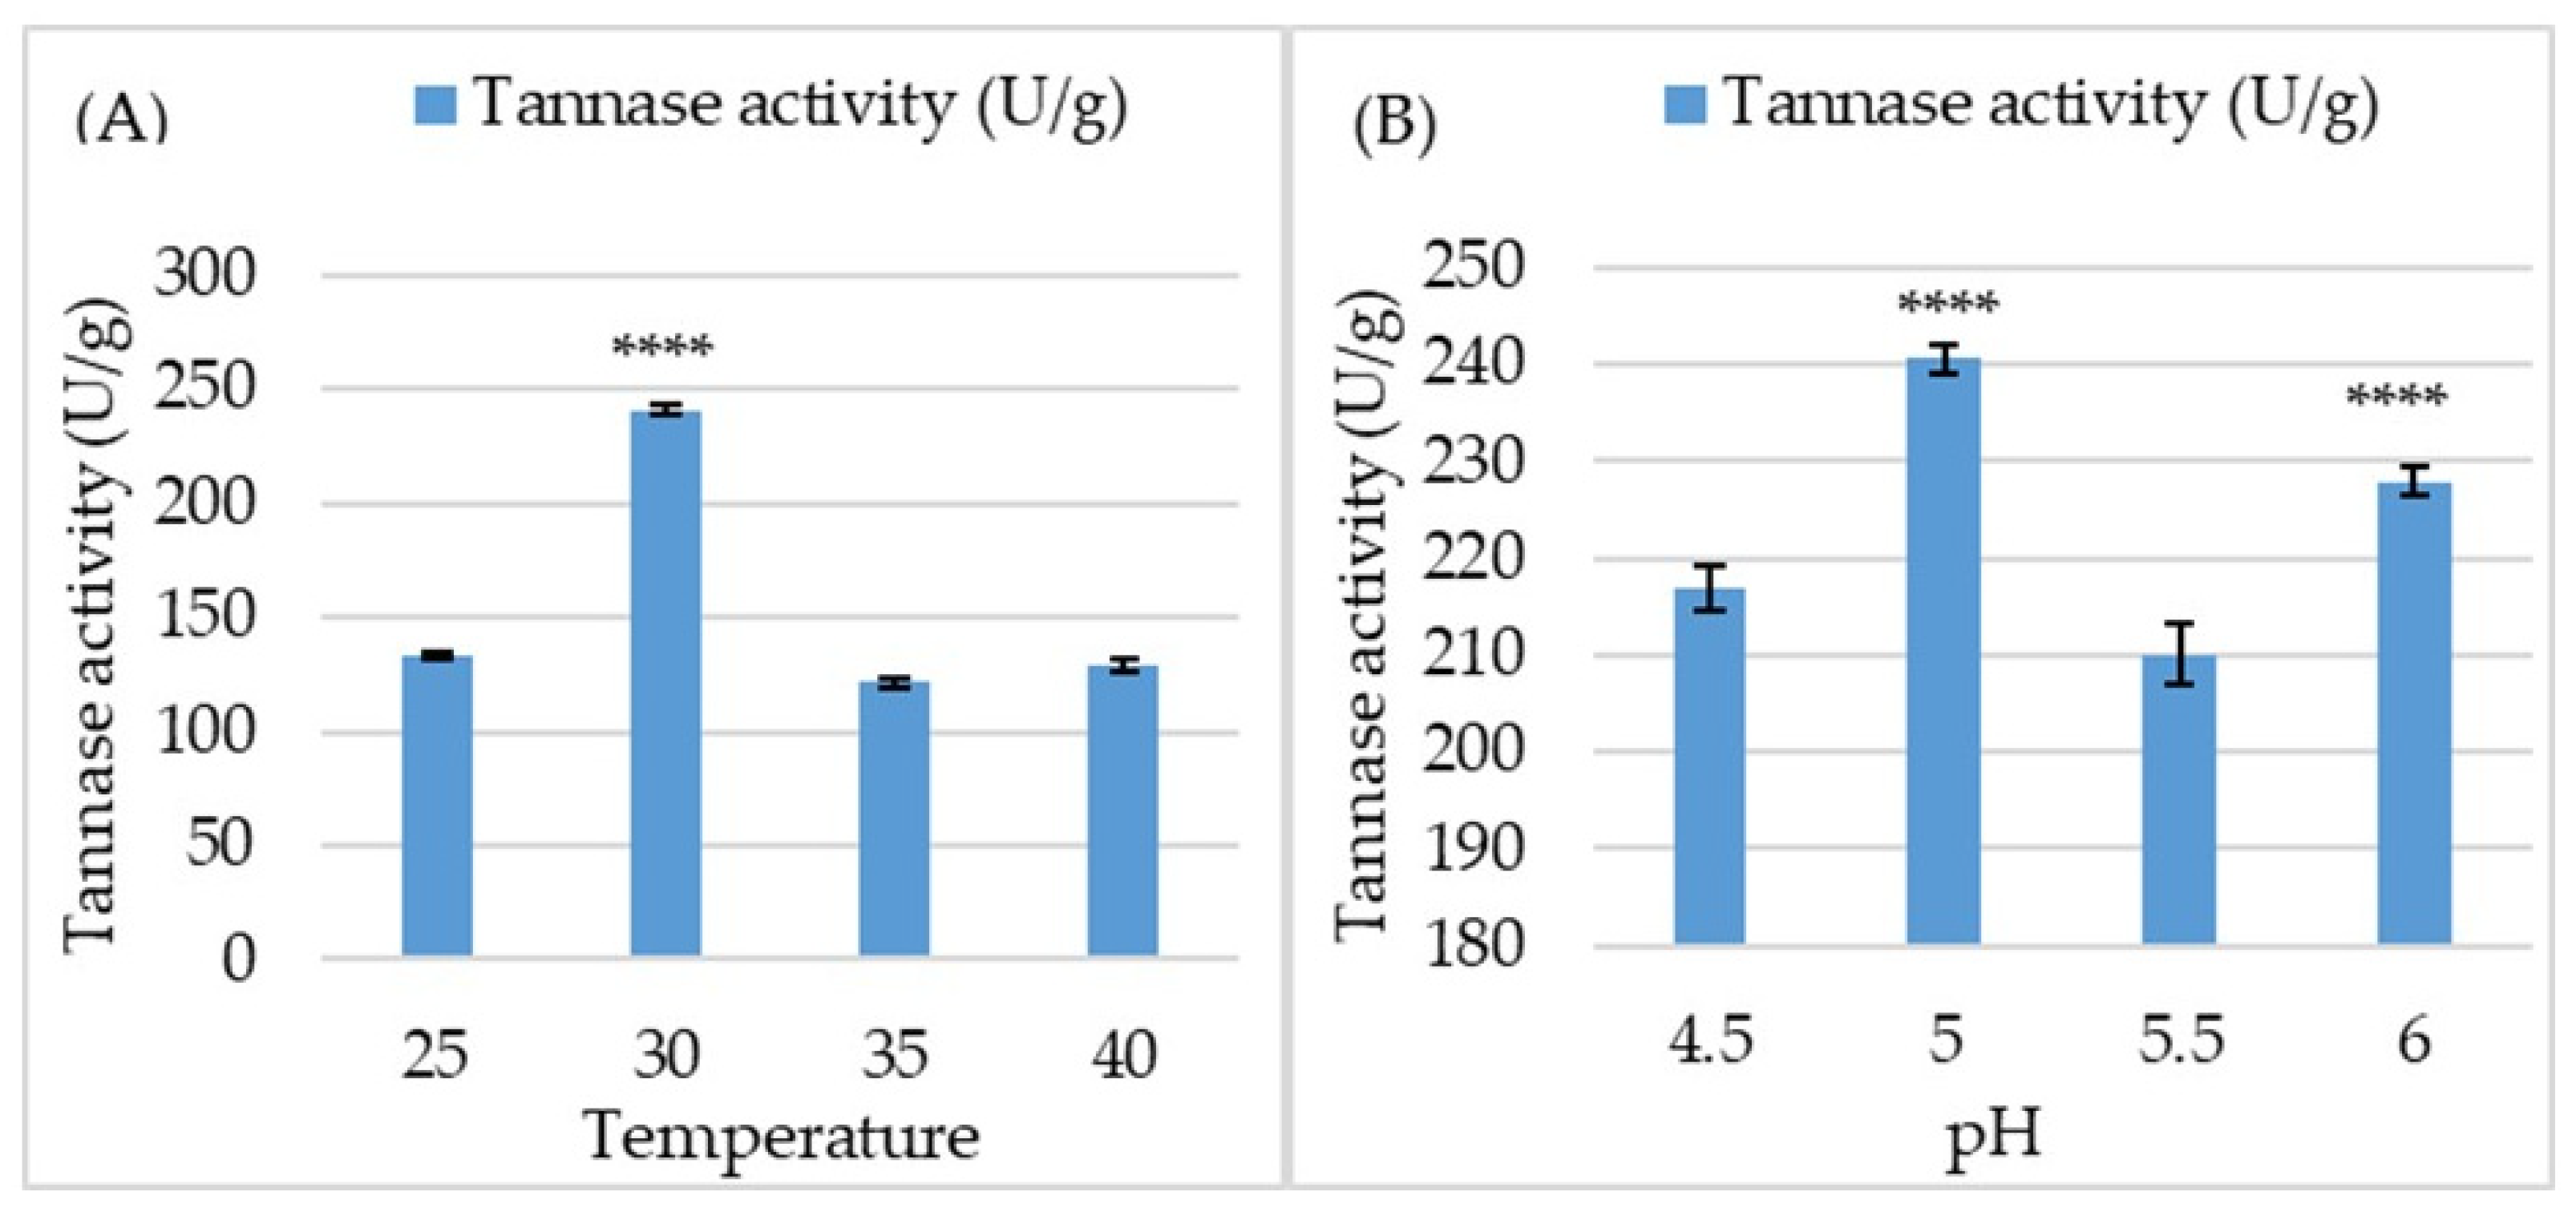
3.7. Biochemical Characterization of the Purified Tannase

The purified enzyme was characterized in terms of its temperature, pH, and metal ion concentration. The optimum temperature for tannase was 30 °C, and the activity level obtained was 240.36 (U/g) (Figure 6). Similarly, tannase from Aspergillus oryzae exhibited maximum tannase activity at a temperature level of 30° C [69]. However, temperatures around 35 °C and 40 °C decreased the enzymatic activity yield with titers of activity of 127.20 and 139.74 (U/g), respectively. Belmares et al. [11] reported that tannase from Aspergillus strains showed optimal temperatures of 35 °C to 40 °C. Battestin and Macedo et al. [70] reported that fungal tannase from Paecilomyces variotii has an optimal temperature between 30 and 40 °C. Mahmoud et al. [47] reported a maximum tannase activity of 102.61 U/g at a temperature level of 35 °C. Another study observed maximal tannase activity (71.6 U/g) at a temperature level of 40 °C [17]. Optimal activity at 30 °C has been reported for tannase from Selenomonas ruminantium [71]. Samu et al. [72] noticed the major stability of the tannase activity of Penicillium notatum at 50 °C. Different behaviors in thermostability from tannase are associated with changes in the conformational structure of the proteins [64].
The results show that the enzyme exhibited major levels of activity at pH 5.0, obtaining enzyme activity titers around 240.36 (U/g) (Figure 6); however, levels of 5.5 and 6.0 did not enhance the yields of enzymatic activity (206.18 and 224 U/g, respectively). This result is consistent with that in previous reports by Belmares et al. [11], who found an optimum pH of 5.0. The pH value influences the catalytic efficiency and stability of the enzyme because it affects the protonation and deprotonation of the amino acids in the active site [73]. Kumar et al. [57] reported major titers of enzymatic activity with a level of pH 5.5. Kasieczka-Burnecka et al. [74] observed that an acidic pH favored tannase activity. Sharma et al. [75] reported optimal pH values in a pH range of 4.5–5.5. Riul et al. [65] observed an increase in the activity at pH 5.0; however, at neutral pH (7.0), tannase activity decreased due to changing pH conditions affecting protein structure [66].
The presence of different metallic ions induces or inhibits conformational changes in the enzymes [55]. The metal ions Mg2+, Cu2+, and Fe3+ enhanced tannase activity (119.93, 112.52, and 102.63%, respectively) (Table 6). In contrast, Mn2+, Ca2+, Na+, and Zn2+ inhibited tannase activity (2.33, 5.89, 26.75, and 43.35%, respectively) (Table 6). Belmares et al. [11] reported that one mM Mg2+ or Hg2+ activated tannase activity. In contrast, Ca2+ and Na+ completely inhibited tannase activity [55]. Mata et al. [42] detected an inhibitory effect when Zn2+, K+, Mn2+, and Hg2+ were evaluated in extracellular tannase from Verticillum sp. Kumar et al. [57] reported an inhibitory effect when the metal ions Zn2+ and Mn2+ were evaluated. Chhokar et al. [76] reported that Mg2+, Mn2+, Ca2+, Na+, and K+ induced tannase activity; however, Cu2+, Fe3+, and Co2+ inhibited tannase activity from Aspergillus awamori MTC 9299. The inactivation of tannase activity in the presence of divalent cations can be attributed to the non-specific binding or aggregation of tannase [1].

3.8. Applications of Tannase in Food Processing

Tannase is important for several industrial processes. Tannase is extensively used in the food, animal feed, pharmaceutical, beverage, and chemical industries [2]. Tannase hydrolyzes the ester bonds of tannic acid, releasing gallic acid and glucose [77]. Gallic acid is important in the food industry because it is an intermediary in the synthesis of propyl gallate, a potent antioxidant used in beverages [77]. It has been reported that this enzyme is used to break down the tannins present in tannery effluents [78]. This enzyme can eliminate undesirable effects in beverages such as iced tea, beer, wine, and fruit juices [79]. Das Mohapatra et al. [80] reported that tannase is used in the clarification of beer and fruit juices. Madeira et al. [81] noticed that tannase improves the flavor of grape wine. Reports have shown that tannins are responsible for anti-nutrition factors in foods and beverages [82]. Besides tannins being responsible for reducing digestive proteins because of their effect on the digestive enzyme [82], the application of tannase can diminish the negative impact of tannins by reducing tannin contents and increasing antioxidant and antimicrobial activity in beverages [75].
The tannase produced in SSF by A. niger TBG 28A demonstrated interesting and potential properties to hydrolyze tannins with activity titers of 247.12 (U/g). Additionally, biochemical characterization showed that optimal activity is achieved at pH 5.0 and a temperature of 30° C. This enzyme is a potential candidate for food processing. Additional studies are required to complement the characterization of this enzyme. Although we did not evaluate any mechanistic properties in this study, it would be important to evaluate its hydrolytic efficiency in some industrial food processes, such as the clarification of wine drinks and the addition of tannase to green tea to improve its antioxidant potential.

4. Conclusions

The valorization of green tea leaves is an interesting alternative to producing enzymes, such as tannase, via SSF. The application of A. niger TBG 28A to obtain tannase is a promising biotechnological opportunity to increase tannase production. Among the selected variables, temperature, inoculum size, and moisture content had the greatest influence on tannase activity. The optimized conditions of the fermentation process resulted in a 9.67-fold increase in tannase yield compared with that in previous reports. The specific activity of the enzyme was increased via purification techniques, and the molecular weight of the novel fungal tannase was partially determined. Tannase showed the best activity at 30 °C and pH 5.0 and with the metal ions Mg2+, Cu2+, and Fe3+. Further studies are necessary to determine the application of this enzyme in the food industry. Additionally, they are important for determining Michaelis–Menten kinetic parameters and evaluating other purification techniques.

Author Contributions

Conceptualization, M.L.C.-G. and C.N.A.; methodology, E.M.P.-L. and M.G.-S.; software, E.M.P.-L.; validation, M.L.C.-G., L.L.-H. and C.N.A.; formal analysis, E.M.P.-L., M.G.-S. and H.A.R. investigation, H.A.R.; resources, J.L.M.-H.; data curation, H.A.R., P.N.S. and S.A.; writing—original draft preparation, E.M.P.-L.; writing—review and editing, M.L.C.-G., L.L.-H., P.N.S. and C.N.A.; visualization, L.L.-H.; supervision, M.L.C.-G. and C.N.A.; project administration, C.N.A.; funding acquisition, C.N.A. All authors have read and agreed to the published version of the manuscript.

Funding

This work was supported by the National Council of Humanities, Sciences, Technologies, and Innovation (CONAHCYT, Mexico). E.M.P.L thanks CONAHCYT for the financial support (scholarship number: 929044). This proyect was conducted in the framework of the Mexico–India bilateral project FONCICYT-CONACYT C0013-2015-03-266614. The postgraduate program (Master) in Food Science Technology offered by the University Autonomous of Coahuila, México.

Institutional Review Board Statement

Not applicable.

Informed Consent Statement

Not applicable.

Data Availability Statement

Data will be shared upon request.

Acknowledgments

Postgraduate students of Food Science and Technology, School of Chemistry Autonomous University of Coahuila, Saltillo Campus, México. Author E.M. Peña-Lucio thanks CONAHCYT.

Conflicts of Interest

The authors declare no conflict of interest.

References

  1. Govindarajan, R.K.; Krishnamurthy, M.; Neelamegam, R.; Shyu, D.J.H.; Muthukalingan, K.; Nagarajan, K. Purification, structural characterization, and biotechnological potential of tannase enzyme produced by Enterobacter cloacae strain 41. Process Biochem. 2018, 77, 37–47. [Google Scholar] [CrossRef]
  2. Yao, J.; Guo, G.S.; Ren, G.H.; Liu, Y.H. Production, characterization and applications of tannase. J. Mol. Catal. B Enzym. 2014, 101, 137–147. [Google Scholar] [CrossRef]
  3. Madeira, J.V., Jr.; Ferreira, L.R.; Macedo, J.A.; Macedo, G.A. Efficient tannase production using Brazilian citrus residues and potential application for orange juice valorization. Biocat. Agricult. Biotechnol. 2015, 4, 91–97. [Google Scholar] [CrossRef]
  4. Govindarajan, R.K.; Revathi, S.; Rameshkumar, N.; Krishnan, M.; Kayalvizhi, N. Microbial tannase: Current perspectives and biotechnological advances. In Biocatalysis and Agricultural Biotechnology; Elsevier Ltd.: Amsterdam, The Netherlands, 2016; Volume 6, pp. 168–175. [Google Scholar] [CrossRef]
  5. Coello, C.L. Tannins in commercial poultry feed. Braz. Anim. Sci. 2006, 1, 5–22. Available online: https://revistas.ufg.br/vet/article/view/242 (accessed on 1 July 2023).
  6. Chávez-González, M.; Rodríguez-Durán, L.V.; Balagurusamy, N.; Prado-Barragán, A.; Rodríguez, R.; Contreras, J.C.; Aguilar, C.N. Biotechnological Advances and Challenges of Tannase: An Overview. Food Bioprocess Technol. 2012, 5, 445–459. Available online: http://link.springer.com/10.1007/s11947-011-0608-5 (accessed on 1 July 2023). [CrossRef]
  7. Wang, F.; Ni, H.; Cai, H.; Xiao, A. Tea stalks—A novel agro-residue for the production of tannase under solid-state fermentation by Aspergillus niger. Ann. Microbiol. 2013, 63, 897–904. [Google Scholar] [CrossRef]
  8. Sharma, N.K.; Beniwal, V.; Kumar, N.; Kumar, S.; Pathera, A.K.; Ray, A. Production of tannase under solid-state fermentation and its application in detannification of guava juice. Prep. Biochem. Biotechnol. 2014, 44, 281–290. [Google Scholar] [CrossRef] [PubMed]
  9. Graminha, E.B.N.; Goncalves, A.Z.L.; Pirota, R.D.P.B.; Balsalobre, M.A.A.; da Silva, R.; Gomes, E. Enzyme production by solid-state fermentation: Application to animal nutrition. Anim. Feed Sci. Technol. 2008, 144, 1–22. [Google Scholar] [CrossRef]
  10. Ibrahim, S.; Yunus Shukor, M.; Arif Syed, M.; Arina Ab Rahman, N.; Abdul Khalil, K.; Khalid, A.; Aqlima Ahmad, S.; Author, C. Bacterial Degradation of Caffeine: A Review. Asian J. Plant Biol. 2014, 2, 19–28. [Google Scholar] [CrossRef]
  11. Belmares, R.; Contreras-Esquivel, J.C.; Rodríguez-Herrera, R.; Coronel, A.R.; Aguilar, C.N. Microbial production of tannase: An enzyme with potential use in food industry. LWT-Food Sci. Technol. 2004, 37, 857–864. [Google Scholar] [CrossRef]
  12. Lekshmi, R.; Arif Nisha, S.; Kaleeswaran, B.; Alfarhan, A.H. Pomegranate peel is a low-cost substrate to produce tannase by Bacillus velezensis TA3 under solid state fermentation. J. King Saud Univ.-Sci. 2020, 32, 1831–1837. [Google Scholar] [CrossRef]
  13. Liu, T.P.S.L.; Brandão Costa, R.M.P.; de Vasconcelos Freitas, D.J.; Oliveira Nacimento, C.; de Souza Motta, C.M.; Bezerra, R.P.; Nunes Herculano, P.; Porto, A.L.F. Tannase from Aspergillus melleus improves the antioxidant activity of green tea: Purification and biochemical characterisation. Int. J. Food Sci. Technol. 2017, 52, 652–661. [Google Scholar] [CrossRef]
  14. Thomas, L.; Larroche, C.; Pandey, A. Current developments in solid-state fermentation. Biochem. Eng. J. 2013, 81, 146–161. [Google Scholar] [CrossRef]
  15. de Las Rivas, B.; Rodríguez, H.; Anguita, J.; Muñoz, R. Bacterial tannases: Classification and biochemical properties. Appl. Microbiol. Biotechnol. 2019, 103, 603–623. [Google Scholar] [CrossRef] [PubMed]
  16. Ueda, S.; Nomoto, R.; Yoshida, K.I.; Osawa, R. Comparison of three tannases cloned from closely related Lactobacillus species: L. Plantarum, L. Paraplantarum, and L. Pentosus. BMC Microbiol. 2014, 14, 87. [Google Scholar] [CrossRef] [PubMed]
  17. Chaitanyakumar, A.; Anbalagan, M. Expression, purification, and immobilization of 768 tannase from Staphylococcus lugdunensis MTCC 3614. Appl. Microb. Biotech. Express 2016, 6, 89. [Google Scholar] [CrossRef]
  18. Jiménez, N.; Barcenilla, J.M.; López de Felipe, F.; de las Rivas, B.; Muñoz, R. Characterization of a bacterial tannase from Streptococcus gallolyticus UCN34 810 suitable for tannin biodegradation. Appl. Microbiol. Biotechnol. 2014, 98, 6329–6337. [Google Scholar] [CrossRef]
  19. Beena, P.S.; Basheer, S.M.; Bhat, S.G. Propyl Gallate Synthesis Using Acidophilic Tannase and Simultaneous Production of Tannase and Gallic Acid by Marine Aspergillus awamori BTMFW032. Appl. Biochem. Biotechnol. 2011, 164, 612–628. [Google Scholar] [CrossRef]
  20. Mannan, S.; Fakhrul-Razi, A.; Alam, M.Z. Optimization of process parameters for the bioconversion of activated sludge by Penicillium corylophilum, using response surface methodology. J. Environ. Sci. 2007, 19, 23–28. [Google Scholar] [CrossRef]
  21. Bajpai, B.; Patil, S. Tannin acyl hydrolase activity (EC 3.1.1.20) of Aspergillus, Penicillium, Fusarium and Trichoderma. World J. Microbiol. Biotechnol. 1996, 12, 217–220. [Google Scholar] [CrossRef]
  22. Viswanath, V.; Leo, V.V.; Prabha, S.S.; Potty, V.P.; Jisha, M.S. Optimized Production of Tannase from Cashew Testa using Aspergillus niger MTCC 5898. Food Biotechnol. 2016, 30, 249–262. [Google Scholar] [CrossRef]
  23. Daryoush Davoudi, O.; Neslihan, B.; Ellidokuz, H.; Özlem, Y. Evaluation of different cryoprotective agents in maintenance of viability of helicobacter pylori in stock culture media. Braz. J. Microbiol. 2010, 90, 1038–1046. [Google Scholar] [CrossRef]
  24. Nava Villagómez, J.I. Fermentation of Coffee Pulp with Penicillium commune at the Laboratory Level and Semi-Pilot. Master´s Thesis, Autonomous Metropolitan University, Mexico City, Mexico, 2003; pp. 33–35. Available online: http://148.206.53.233/tesiuami/UAMI11058.pdf (accessed on 1 July 2023).
  25. Medina-Morales, M.; Rojas-Molina, R.; Rodríguez-Herrera, R.; Aguilar-Gonzalez, C.N. Manual of Laboratory Methods of the Department of Food Research of the Autonomous, 1st ed.; University of Coahuila: Saltillo, Mexico, 2012. [Google Scholar]
  26. Sharma, S.; Bhat, T.K.; Dawra, R.K. A Spectrophotometric Method for Assay of Tannase Using Rhodanine. Anal. Biochem. 2000, 89, 85–89. [Google Scholar] [CrossRef] [PubMed]
  27. Galvão, M.A.M.; Arruda, A.O.; de Bezerra, I.C.F.; Ferreira, M.R.A.; Soares, L.A.L. Evaluation of the Folin-Ciocalteu Method and Quantification of Total Tannins in Stem Barks and Pods from Libidibia ferrea (Mart. ex Tul) L. P. Queiroz. Braz. Arch. Biol. Technol. 2018, 61, 1–20. [Google Scholar] [CrossRef]
  28. Kruger, N. The Bradford Method for Protein Quantitation. Methods Mol. Biol. 1994, 32, 9–15. [Google Scholar] [CrossRef] [PubMed]
  29. Raaman, N.; Mahendran, B.; Jaganathan, C.; Sukumar, S.; Chandrasekaran, V. Optimization of extracellular tannase production from Paecilomyces variotii. World J. Microbiol. Biotechnol. 2010, 26, 1033–1039. [Google Scholar] [CrossRef]
  30. Aguirre, N.; Cancelado Vergara, D. Evaluation of the green tea extract Camellia sinensis as an antioxidant agent in the preparation of Frankfourt sausage. Bachelor’s Thesis, La Salle University, Faculty of Engineering, Bogota, Colombia, 2016. Available online: https://ciencia.lasalle.edu.co/ing_alimentos/13 (accessed on 1 July 2023).
  31. Ni, H.; Chen, F.; Jiang, Z.D.; Cai, M.Y.; Yang, Y.F.; Xiao, A.F.; Cai, H.N. Biotransformation of tea catechins using Aspergillus niger tannase prepared by solid state fermentation on tea byproduct. LWT-Food Sci. Technol. 2015, 60, 1206–1213. [Google Scholar] [CrossRef]
  32. Aguilar-gonzález, C.; Viniegra-gonzález, G. Culture Conditions Dictate Protease and Tannase Production in Submerged and Solid-State Cultures of Aspergillus niger Aa-20. Int. J. Biotechnol. Appl. Biochem. 2002, 102, 407–414. [Google Scholar] [CrossRef]
  33. Dalsenter, F.D.H.; Viccini, G.; Barga, M.C.; Mitchell, D.A.; Krieger, N. A mathematical model describing the effect of temperature variations on the kinetics of microbial growth in solid-state culture. Process Biochem. 2005, 40, 801–807. [Google Scholar] [CrossRef]
  34. Bhoite, R.N.; Murthy, P.S. Biodegradation of coffee pulp tannin by Penicillium verrucosum for production of tannase, statistical optimization and its application. Food Bioprod. Process. 2015, 94, 727–735. [Google Scholar] [CrossRef]
  35. Xiao, A.; Huang, Y.; Ni, H.; Cai, H.; Yang, Q. Statistical optimization for tannase production by Aspergillus tubingensis in solid-state fermentation using tea stalks. Electron. J. Biotechnol. 2015, 18, 143–147. [Google Scholar] [CrossRef]
  36. Kumar, M.; Rana, S.; Beniwal, V.; Salar, R.K. Optimization of tannase production by a novel Klebsiella pneumoniae KP715242 using central composite design. Biotechnol. Rep. 2015, 7, 128–134. [Google Scholar] [CrossRef] [PubMed]
  37. Sabu, A.; Kiran, G.S.; Pandey, A. Purification and characterization of tannin acyl hydrolase from Aspergillus niger ATCC 16620. Food Technol. Biotechnol. 2005, 43, 133–138. [Google Scholar]
  38. Curiel, J.A.; Rodriguez, H.; Acebron, I.; Mancheno, J.M.; Rivas de las, B.; Munoz, R. Production and physicochemical properties of recombinant Lactobacillus plantarum tannase. J. Agric. Food Chem. 2009, 57, 6224–6230. [Google Scholar] [CrossRef]
  39. Rodríguez-Durán, L.V.; Contreras-Esquivel, J.C.; Rodríguez, R.; Prado-Barragán, L.A.; Aguilar, C.N. Optimization of tannase production by Aspergillus niger in solid-state packed-bed bioreactor. J. Microbiol. Biotechnol. 2011, 21, 960–967. [Google Scholar] [CrossRef] [PubMed]
  40. Castro, R.J.S.; Sato, H.H. Synergistic effects of agroindustrial wastes on simultaneous production of protease and α-amylase under solid state fermentation using a simplex centroid mixture design. Ind. Crops Prod. 2013, 49, 813–821. [Google Scholar] [CrossRef]
  41. Renovato, J.; Gutiérrez-Sánchez, G.; Rodríguez-Durán, L.V.; Bergman, C.; Rodríguez, R.; Aguilar, C.N. Differential Properties of Aspergillus niger Tannase Produced Under Solid-State and Submerged Fermentations. Appl. Biochem. Biotechnol. 2011, 165, 382–395. [Google Scholar] [CrossRef] [PubMed]
  42. Marco, M.G.; Rodríguez, L.v.; Ramos, E.L.; Renovato, J.; Cruz-Hernández, M.A.; Rodríguez, R.; Contreras, J.; Aguilar, C.N. A novel tannase from the xerophilic fungus Aspergillus niger GH1. J. Microbiol. Biotechnol. 2009, 19, 987–996. [Google Scholar] [CrossRef]
  43. Khanahmadi, M.; Arezi, I.; Amiri, M.s.; Miranzadeh, M. Bioprocessing of agro-industrial residues for optimization of xylanase production by solid-state fermentation in flask and tray bioreactor. Biocatal. Agric. Biotechnol. 2017, 13, 272–282. [Google Scholar] [CrossRef]
  44. Amorim, G.M.; Oliveira, A.C.; Gutarra, M.L.E.; Godoy, M.G.; Freire, D.M.G. Solid-state fermentation as a tool for methylxanthine reduction and simultaneous xylanase production in cocoa meal. Biocatal. Agric. Biotechnol. 2017, 11, 34–41. [Google Scholar] [CrossRef]
  45. Wu, C.; Zhang, F.; Li, L.; Jiang, Z.; Ni, H.; Xiao, A. Novel optimization strategy for tannase production through a modified solid-state fermentation system. Biotechnol. Biofuels 2018, 11, 92. [Google Scholar] [CrossRef] [PubMed]
  46. Rozes, N.; Peres, C. Effects of phenolic compounds on the growth and the fatty acid composition of Lactobacillus plantarum. Appl. Microbiol. Biotechnol. 1998, 49, 108–111. [Google Scholar] [CrossRef]
  47. Mahmoud, A.E.; Fathy, S.A.; Rashad, M.M.; Ezz, M.K.; Mohammed, A.T. Purification and characterization of a novel tannase produced by Kluyveromyces marxianus using olive pomace as solid support, and its promising role in gallic acid production. Int. J. Biol. Macromol. 2018, 107 Pt B, 2342–2350. [Google Scholar] [CrossRef]
  48. Selwal, K.K. High-level tannase production by Penicillium atramentosum KM using agro residues under submerged fermentation. Ann. Microbiol. 2012, 62, 139–148. [Google Scholar] [CrossRef]
  49. Bradoo, S.; Gupta, R.; Saxena, R.K. Screening of extracellular tannase- producing fungi: Development of a rapid and simple plate assay. J. Gen. Appl. Microbiol. 1996, 42, 325–329. [Google Scholar] [CrossRef]
  50. Walker, G.M.; White, N.A. Introduction to fungal physiology. Fungi Biol. Appl. 2017, 3, 1–35. [Google Scholar] [CrossRef]
  51. Rojas, J.U.; Verreth, J.A.J.; Amato, S.; Huisman, E.A. Biological treatments affect the chemical composition of coffee pulp. Bioresour. Technol. 2003, 89, 267–274. [Google Scholar] [CrossRef] [PubMed]
  52. Beltran, J.G.; Leask, R.L.; Brown, W.A. Activity and stability of caffeine demethylases found in Pseudomonas putida IF-3. Biochem. Eng. J. 2006, 31, 8–13. [Google Scholar] [CrossRef]
  53. Saxena, R.K.; Sharmila, P.; Singh, V.P. Microbial degradation of tannins. In Biotransformation: Microbial Degradation of Health risk Compounds Progress in Industrial Microbiology (Singh VP); Elsevier Science Publishers: Amsterdam, The Netherlands, 1995; Volume 32, pp. 259–270. [Google Scholar]
  54. Aguilar, C.N.; Gutierrez-Sanchez, G. Review: Sources, Properties, Applications and Potential uses of Tannin Acyl Hydrolase. Food Sci. Technol. Int. 2001, 7, 373–382. [Google Scholar] [CrossRef]
  55. Chávez-González, M.L.; Guyot, S.; Rodríguez-Herrera, R.; Prado-Barragán, A.; Aguilar, C.N. Production profiles of phenolics from fungal tannic acid biodegradation in submerged and solid-state fermentation. Process Biochem. 2014, 49, 541–546. [Google Scholar] [CrossRef]
  56. Lekha, P.K.; Lonsane, B.K. Production and application of tannin acyl hydrolase: State of the art. Adv. Appl. Microbiol. 1997, 44, 215–260. [Google Scholar] [CrossRef] [PubMed]
  57. Kumar, M.; Beniwal, V.; Kumar, R. Purification and characterization of a thermophilic tannase from Klebsiella pneumoniae KP715242. Biocatal. Agric. Biotechnol. 2015, 4, 745–751. [Google Scholar] [CrossRef]
  58. Jana, A.; Maity, C.; Halder, S.K.; Das, A.; Pati, B.R.; Mondal, K.C.; Mohapatra, P.K.D. 369 Structural characterization of thermostable, solvent tolerant, cytosafe tannase from 370 Bacillus subtilis PAB2. Biochem. Eng. J. 2013, 77, 161–170. [Google Scholar] [CrossRef]
  59. Mingshu, L.; Kai, Y.; Qiang, H.; Dongying, J. Biodegradation of gallotannins and ellagitannins. J. Basic Microbiol. 2006, 46, 68–84. [Google Scholar] [CrossRef] [PubMed]
  60. Mohan, S.K.; Viruthagiri, T.; Arunkumar, C. Application of response surface methodology for the maximum production of tannase using Aspergillus foetidus (MTCC 3557). Int. Pharm. Dev. Technol. 2015, 4, 151–156. [Google Scholar]
  61. Kumar, R.A.; Gunasekaran, P.; Lakshman, M. Biodegradation of tannic acid by Citrobacter freundii isolated from a tannery effluent. J. Basic Microbiol. 1999, 39, 161–168. [Google Scholar] [CrossRef]
  62. Hiura, T.; Hashidoko, Y.; Kobayashi, Y.; Tahara, S. Effective degradation of tannic acid by immobilized rumen microbes of a sika deer (Cervus nippon yesoensis) in winter. Anim. Feed Sci. Technol. 2010, 155, 1–8. [Google Scholar] [CrossRef]
  63. Sivashanmugam, K.; Jayaraman, G. Production and partial purification of extracellular tannase by Klebsiella pneumoniae MTCC 7162 isolated from tannery effluent. Afr. J. Biotechnol. 2011, 10, 1364–1374. [Google Scholar]
  64. Beniwal, V.; Kumar, A.; Goel, G.; Chhokar, V. A novel low molecular weight acido-thermophilic tannase from Enterobacter cloacae MTCC 9125. Biocat. Agric. Biotechnol. 2013, 2, 132–137. [Google Scholar] [CrossRef]
  65. Riul, A.J.; Goncalves, H.B.; Jorge, J.A.; Guimarães, L.H.S. Characterization of a glucose-and solvent-tolerant extracellular tannase from Aspergillus phoenicis. J. Mol. Catal. B Enzym. 2013, 85–86, 126–133. [Google Scholar] [CrossRef]
  66. Sharma, K.P.; John, P.J. Purification, and characterization of tannase and tannase gene 367 from Enterobacter sp. Process Biochem. 2011, 46, 240–244. [Google Scholar] [CrossRef]
  67. Rodríguez, H.; de las Rivas, B.; Gómez-Cordovés, C.; Muñoz, R. Characterization of tannase activity in cell-free extracts of Lactobacillus plantarum CECT 748T. Int. J. Food Microbiol. 2008, 121, 92–98. [Google Scholar] [CrossRef] [PubMed]
  68. Angelova, M.B.; Pashova, S.B.; Slokoska, L.S. Comparison of antioxidant enzyme biosynthesis by free and immobilized Aspergillus niger cells. Enzyme. Microb. Tech. 2000, 26, 544–549. [Google Scholar] [CrossRef] [PubMed]
  69. Mizuno, T.; Shiono, Y.; Koseki, T. Biochemical characterization of Aspergillus oryzae native tannase and the recombinant enzyme expressed in Pichia pastoris. J. Biosci. Bioeng. 2014, 118, 392–395. [Google Scholar] [CrossRef] [PubMed]
  70. Battestin, V.; Macedo, G.A. Tannase production by Paecilomyces variotii. Bioresour. Technol. 2007, 98, 1832–1837. [Google Scholar] [CrossRef] [PubMed]
  71. Skene, I.K.; Brooker, J.D. Characterization of tannin acyl hydrolase activity in the ruminal bacterium Selenomonas ruminantium. Anaerobe 1995, 1, 321–327. [Google Scholar] [CrossRef] [PubMed]
  72. Gayen, S.; Ghosh, U. Purification and characterization of tannin acyl hydrolase produced by mixed solid-state fermentation of wheat bran and marigold flower by Penicillium notatum NCIM 923. Biomed. Res. Int. 2013, 2013, 596380. [Google Scholar] [CrossRef]
  73. Lekshmi, R.; Arif Nisha, S.; Thirumalai Vasan, P.; Kaleeswaran, B. A comprehensive review on tannase: Microbes associated production of tannase exploiting tannin rich agro-industrial wastes with special reference to its potential environmental and industrial applications. Environ. Res. 2021, 201, 111625. [Google Scholar] [CrossRef]
  74. Kasieczka-Burnecka, M.; Kuc, K.; Kalinowska, H.; Knap, M.; Turkiewicz, M. Purification and characterization of two cold-adapted extracellular tannin acylhydrolases from an Antarctic strain Verticillium sp. P9. Appl. Microbiol. Biotechnol. 2007, 77, 77–89. [Google Scholar] [CrossRef]
  75. Al-Mraai, S.T.Y.; Al-Fekaiki, D.F.; Al-Manhel, A.J.A. Purification and characterization of tannase from the local isolate of Aspergillus niger. J. Appl. Biol. Biotechnol. 2019, 7, 29–34. [Google Scholar] [CrossRef]
  76. Chhokar, V.; Sangwan, M.; Beniwal, V.; Nehra, K.; Nehra, K.S. Effect of additives on the activity of tannase from Aspergillus awamori MTCC9299. Appl. Biochem. Biotechnol. 2010, 160, 2256–2264. [Google Scholar] [CrossRef] [PubMed]
  77. Aithal, M.; Belur, P.D. Enhancement of propyl gallate yield in nonaquous medium using novel cell-associated tannase of Bacillus massiliensis. Prep. Biochem. Biotechnol. 2013, 43, 445–455. [Google Scholar] [CrossRef] [PubMed]
  78. Belur, P.D.; Mugeraya, G. Microbial production of Tannase: State of art. Res. J. Microbiol. 2011, 6, 25–40. [Google Scholar] [CrossRef]
  79. Nuero, O.M.; Reyes, F. Enzymes for animal feeding from Penicillium chrysogenum mycelial wastes from penicillin manufacture. Lett. Appl. Microbiol. 2002, 34, 413–416. [Google Scholar] [CrossRef]
  80. Das Mohapatra, P.K.; Maity, C.; Rao, R.S.; Pati, B.R.; Mondal, K.C. Tannase production by Bacillus licheniformis KBR6: Optimization of submerged culture conditions by Taguchi DOE methodology. Food Res. Int. 2009, 42, 430–435. [Google Scholar] [CrossRef]
  81. Madeira, J.V., Jr.; Macedo, J.A.; Macedo, G.A. Detoxification of castor bean residues and the simultaneous production of tannase and phytase by solid-state fermentation using Paecilomyces variotii. Bioresour. Technol. 2011, 102, 7343–7348. [Google Scholar] [CrossRef] [PubMed]
  82. Kumari, M.; Jani, S. Tannins: Antinutrient with positive effect to Manage diabetes. J. Recent Sci. 2012, 1, 70–73. [Google Scholar]
Figure 1. Pareto chart of the effects of Hunter and Hunter design experiment for tannase production in fermented tea leaves by A. niger TBG 28A. The data are the mean of three independent readings with a significance of p < 0.05.
Fermentation 09 00781 g001
Figure 2. Evaluation of the production of tannase by A. niger TBG 28 A in SSF according to the Hunter and Hunter design experiment. Error bars indicate standard deviation ± SD from triplicate determinations.
Fermentation 09 00781 g002
Figure 3. Response surface diagram showing the interactive effect of (A) temperature and moisture, (B) inoculum size and temperature, and (C) moisture and inoculum size on tannase activity.
Fermentation 09 00781 g003
Figure 4. Kinetical behavior of tannase activity and hydrolysable tannin concentration using A. niger TBG 28A in SSF. Error bars indicate standard deviation ± SD from triplicate determinations.
Fermentation 09 00781 g004
Figure 5. SDS-PAGE and zymogram analysis of purified tannase from A. niger TBG 28A, where M—marker proteins (BZ0010R, BIOBASIC), Lane A1—purified tannase extract (20 mg/mL), and Z—zymogram.
Fermentation 09 00781 g005
Figure 6. Effect of (A) temperature and (B) pH on tannase from A. niger TBG 28A. Error bars indicate standard deviation from triplicate determinations. Asterisks indicate significance at p ≤ 0.001 (****) according to one-way ANOVA test.
Fermentation 09 00781 g006
Table 1. Experimental matrix of Hunter and Hunter exploratory design for tannase production in SSF by A. niger TBG 28 A.
TreatmentsTemperatureInoculum SizeMoisture
1−1.00000−1.000001.00000
21.00000−1.00000−1.00000
3−1.000001.00000−1.00000
41.000001.000001.00000
5−1.00000−1.000001.00000
61.00000−1.00000−1.00000
7−1.000001.00000−1.00000
81.000001.000001.00000
9−1.00000−1.000001.00000
101.00000−1.00000−1.00000
11−1.000001.00000−1.00000
121.000001.000001.00000
Table 2. Proximal analysis of the concentrations of sugar totals and condensed and hydrolysable tannins in spent green tea leaves.
AnalysisConcentration (mg/g)Standard Deviation
Sugar totals120 *±0.05
Condensed tannins209.05 *±0.012
Hydrolysable tannins242.05 *±0.014
* Values represent means of ±SD (standard deviation) of three replicates.
Table 3. ANOVA (analysis of variance) for response surface diagram for optimization of tannase production of A. niger TBG 28A.
SourceSum of SquaresdfMean SquareF Valuep-Value < 0.05
Temperature294.821294.8201.127110.0399640
Inoculum3292.4613292.45712.587230.071079
Moisture8415.9118415.90832.174430.029703
Error523.142261.571
Total SS16,409.038
Table 4. Kinetic parameter analysis of tannase activity, biomass, and soluble protein parameters using A. niger TBG 28A in SSF.
Time (h)Tannase Activity (U/g)Biomass
(mg/g)
Soluble Protein (mg/g)
00.00 ± 0.000.00 ± 0.0044.21 ± 4.22
2430.51 ± 1.770.41 ± 0.0545.11 ± 1.17 **
48246.83 ± 0.67 **0.51 ± 0.01 **60.04 ± 3.43 **
72133.38 ± 1.06 **0.20 ± 0.08 **42.19 ± 1.76
9669.01 ± 2.830.31 ± 0.0343.65 ± 1.96
Statistical significance is indicated by asterisks (**) in the same group (p < 0.05) according to one-way ANOVA analysis.
Table 5. Purified tannase isolated from A. niger TBG 28A under SSF.
StageVolume (mL)Total Activity (U) 1Total Protein (mg) 1Specific Activity (U/mg Protein) 1Yield (%) 1
Crude Extract250247.12 ± 0.53487 ± 0.350.5 ± 0.21100
Dialysis
(Membrane 10 kDa)
170168.04 ± 0.106.64 ± 0.1525.30 ± 0.1967.99
Ultracentrifugation
(Microcon)
4040.40 ± 0.124.72 ± 0.038.55 ± 0.5016.35
1 Total activity: activity (U) × total volume (mL). Specific activity: total activity (U)/total protein (mg). Yield: [total activity (U)/initial total activity in the crude extract (U)] × 100. One unit of tannase (U) was defined as the amount of enzyme that released 1 µmol of gallic acid per minute. Data indicate standard deviation ± SD from triplicate determinations.
Table 6. Effect of metal ions on tannase from A. niger TBG 28A.
Metal IonsConcentration (5 mM)
% Relative Activity% Inhibition
Control100-
ZnCl298.671.33
MgSO4119.93-
CuSO4112.52-
FeCl3102.63-
CaCl274.1526.85
NaCl94.115.89
MnCl256.6543.35
Disclaimer/Publisher’s Note: The statements, opinions and data contained in all publications are solely those of the individual author(s) and contributor(s) and not of MDPI and/or the editor(s). MDPI and/or the editor(s) disclaim responsibility for any injury to people or property resulting from any ideas, methods, instructions or products referred to in the content.

