Article

Enhanced CO2 Reduction by Electron Shuttle Molecules via Coupling Different Electron Transport Processes in Microbial Electrosynthesis

1
School of Environmental and Civil Engineering, Jiangnan University, Wuxi 214122, China
2
Jiangsu Collaborative Innovation Center of Technology and Material of Water Treatment, Suzhou University of Science and Technology, Suzhou 215009, China
3
School of Environmental Science and Engineering, Suzhou University of Science and Technology, Suzhou 215009, China
*
Authors to whom correspondence should be addressed.
Fermentation 2023, 9(7), 679; https://doi.org/10.3390/fermentation9070679
Submission received: 20 June 2023 / Revised: 14 July 2023 / Accepted: 16 July 2023 / Published: 19 July 2023

Abstract

:
Electron shuttling molecules (ESMs) have been proven to accelerate the electron transfer from the electrode to the electroactive microorganism in microbial electrosynthesis (MES) for higher CO2 reduction or chemical production rate. However, the microbial electron acceptors of electroactive microorganisms and their responses to different electron shuttling molecules in MES were still unknown. In this study, three kinds of ESMs, e.g., riboflavin (B2), methyl viologen (MV) and neutral red (NR) were applied in the MES for acetate production to explore the mechanism of different ESMs on microbial interactions. The acetate concentrations were 41% and 51% higher than that of the control in B2 and NR addition. The acetogens relative abundances of control, B2, MV and NR were 0.29%, 5.68%, 22.78% and 42.89%, respectively. The microbial function profile of the microbial community on the biocathodes indicated that the performance of acetate production was more closely related to the expression of electron transport. The B2 was coupled with the NADH complex and hydrogenase, while MV and NR were coupled with the Rnf complex to support electron transfer and energy conversion via various electron transfer pathways. The study revealed that the ESMs coupled with different electron transport complexes of microorganisms to achieve electron transfer, resulting in product changes.

1. Introduction

Global warming induced by the accumulation of greenhouse gas is becoming a severe problem. CO2 represents the majority of greenhouse gas (GHG) emissions (63% CO2, 24% CH4 and 3% N2O) and the main contributor to global warming [1]. For reducing CO2 emissions and alleviating global warming, the development and application of efficient CO2 capture technologies are urgently imperative. Microbial electrosynthesis (MES) is a novel technology for CO2 capture by reducing CO2 to chemicals, such as acetate, ethanol and butyrate [2,3,4,5,6,7], based on a biocathode as the key functional component. Acetate is the primary product of MES through the Wood–Ljungdahl (WL) pathway, as the WL pathway is the most energy-efficient carbon fixation pathway [8]. Owing to the relatively high added value of the chemical production and the attractive potential of CO2 capture, MES has drawn great attention from scholars. However, currently, the low performance of MES for CO2 capture is still far from industrial competitiveness [9]. One of the main constraining factors for the reduction of CO2 and the production of chemicals in the MES is the low efficiency of electron transfer [10,11,12,13]. To tackle this problem, electrode modification and electrode biofilm acclimation, which can improve the capacity of electron supply and enhance the utilization of the electrons by functional microorganisms, respectively, are two proposed improvement measures and have been investigated by quite a few studies [14,15]. However, studies on how to enhance electron transfer efficiency from the electrode surface to the microorganism is still a key bottleneck question for the chemical production and CO2 capture in MES.
Recently, the application of electron shuttling molecules (ESMs) has been proposed to enhance electron transfer and then improve the performance of MES [16]. The ESMs are natural and artificial redox mediators, such as riboflavin [17], cysteine [18] and anthraquinone-2-carboxylic acid (AQC) [19], which can be oxidized and reduced reversibly, thereby serving as electron shuttles in redox reactions. Enhancement of redox reaction by promotion of extracellular electron transfer (EET) with ESMs addition has been reported, for example, the improved reduction of Fe(III) by G. uraniireducens with riboflavin served as the election shuttle [20]. The ESMs can also promote electron transfer between the electrode and microorganisms. For instance, electricity generation was accelerated by ESMs addition in a microbial fuel cell with Shewanella putrefaciens 200 as the functional microorganism [21].
ESMs-mediated electron transfer is affected by many factors, such as chemical types, concentrations, redox activity and electron transfer ability [22,23]. During these factors, the redox potential of the ESMs was considered a key factor directly related to electron transfer mediation performance [24]. Different electron-receiving acceptors, including hydrogenase, the NADH complex and cytochromes, couple various energy states in the microbes. With different redox potentials, various ESMs may be coupled with various intracellular electron transfer mechanisms, increasing the efficiency of electron transfer to various degrees. The relationship between ESMs and microbes in reducing CO2 to acetate and product synthesis efficiency must therefore be clarified through investigation of the combination of ESMs and microbial transmembrane and intracellular electron transfer forms. However, the relationship between the ESMs and the efficiency of performance improvement of the MES, as well as the related mechanism, has not been fully revealed.
Therefore, the objectives of this study include: (1) to investigate the efficiency of three ESMs with different redox potentials for improving the CO2 reduction and acetate production; (2) to clarify the shift of microbial community on the response of three ESMs; and (3) to explore the mechanism of different ESMs on microbial interactions. For this purpose, riboflavin (B2), methylviologen (MV) and neutral red (NR) with a redox potential of −176 mM, −550 mM and −325 mM, respectively, were adopted as the electron shuttles for the MES. The acetate production of the MES was evaluated and the mechanisms of the ESMs on acetate production in MES were investigated by redox properties analysis of the ESMs, comprehensive analysis of microbial community, and functional prediction. This study will enhance the understanding of the interaction mechanism between ESMs and microorganisms in MES for acetate production.

2. Materials and Methods

2.1. Startup and Operation Phase

The reactor was configured in an H-type with a proton exchange membrane (PEM) (Nafion 117, Dupont, Wilmington, DE, USA) separating the anode and cathode (Figure S1). Each chamber was operated with a working volume of 300 mL and a headspace volume of 10 mL. The electrodes were carbon fiber brushes (7.5 cm length, 5.5 cm diameter). Basic medium for acetate microbial electrosynthesis was as follows: 0.3 g/L NH4Cl, 0.3 g/L KH2PO4, 0.2 g/L MgSO4·7H2O, 0.02 g/L CaCl2·2H2O, 2.5 g/L NaHCO3, 100 mg/L yeast powder, 10 mL/L trace element solution (DSMZ-Medium 141), and 10 mL/L vitamin solution (DSMZ-Medium 141). For inhibiting methane production, 10 mM sodium 2-bromoethanesulfonate (NaBES) was added into the medium during acetate microbial electrosynthesis.
A total of 8 reactors were constructed. The reactors were operated in batch mode, with a cycle every 10 days. The inoculum used was the microorganisms recovered from the effluent of an acetate synthesis MES by centrifugation [25]. The inoculum was inoculated into the cathode chamber achieving the OD600 of 0.5 at the beginning of the first three cycles, for the startup of the biocathodes. Subsequently, the reactors were operated for another three cycles for further acclimatization and stabilization of the biocathodes. The potential of the cathodes was controlled at −1.0 V vs. SCE with a potentiostat (CHI1030C, CH Instruments Inc., China). The reactors were separated into four groups, with two parallel reactors each. One group was the control without the addition of ESMs. The other three groups were supplemented with B2, MV, and NR, respectively. In the ESMs-added reactors, the concentrations of each ESM were 0.4 mM to investigate the effects of the ESMs on the performance of MES. The operation lasted for 2 cycles, the first cycle was to acclimate the microorganisms to adapt to the ESMs concentration, and the second cycle was used to evaluate the performance of the MES. All MES reactors were operated under 37 ± 0.5 °C, with the pH in the cathode chamber controlled at 7.0 ± 0.2 by adjustment with 2 M HCl every 12 h. Synthesized VFAs in the liquid were analyzed every two days.

2.2. Electrochemical Analyses

The electron transfer capacity (ETC) of each ESM was measured by chronoamperometry (CA) according to a previous study [22]. Briefly, the CA was performed at applied potentials of −1.2 and 0 V vs. SCE, respectively, to evaluate the electron-donating capacity (EDC) and electron-accepting capacity (EAC) of the ESMs, under the concentration of the ESMs of 0.2 mmol/L, using an electrochemical workstation (CHI600E, CH Instruments Inc., China). The working electrode for CA measurement was a platinum electrode (1 cm × 1 cm). Cyclic voltammetry (CV) was performed in a scan window of −1.4 to −0.2 V vs. SCE at a scan rate of 1 mV/s, using the same electrochemical workstation. For cyclic voltammetry analysis, carbon fibers from the cathode were used as the working electrode, and the platinum electrode was used as the counter electrode. For CA and CV detection, 100 mM PBS served as the electrolyte. All solutions were purged with oxygen-free N2 for 15 min before the electrochemical measurements. EAC and EDC of the ESMs were tested using chronoamperometry after three successive cycles of electrochemical reduction at a potential of −1.2 V and reoxidation at a potential of 0 V (vs. Hg/HgCl).

2.3. Analyses Methods

To collect the gas produced by the cathode, the air bag was replaced after each cycle. The composition of gas and VFAs were analyzed using gas chromatography (GC9790II, FuLi, China) and gas chromatography (GC-2010, Shimadzu, Japan), respectively, as described previously [25]. Scanning electron microscopy (SEM) analysis was conducted using a Gemini 300 microscope (ZEISS, Germany).

2.4. Calculations

The electron recovery (ERE) of the products was calculated using Equation (1):
T h e   E R E   i n % = n t × f e × F 0 t I   d t
where nt is the number of moles of product analyzed at time t, fe represents electron equivalent per mol of product, e.g., hydrogen (2e), acetate (8e), ethanol (12e), and butyrate (20e); F is the Faraday constant (96,485 C mol−1 electron) and I is current (A).
The carbon conversion rate from NaHCO3 to products was calculated using Equation (2):
P = Σ n t × N c × 12 M t × 12
where nt is the number of moles of product analyzed at time t, Nc represents the number of carbon atoms per molecule for product, and Mt is the number of moles of NaHCO3 consumed in the catholyte at time t.

2.5. High-Throughput Sequencing of 16S rRNA Gene

The attached microorganisms on the cathode were removed from the carbon brush by ultrasound and collected by filtration through a 0.22 μm membrane, and DNA was extracted from the collected samples with a DNeasy Power Soil Kit (Qiagen, Germany) according to the manufacturer’s protocol. The microbial community was analyzed with high-throughput sequencing of the 16S rRNA gene. The V3-V4 hypervariable regions of the bacterial 16S rRNA gene were amplified with primers of 338F and 806R by a thermocycler PCR system (GeneAmp 9700, ABI, USA). The thermal program of the amplification reaction was according to the following program: 3 min of denaturation at 95 °C, 27 cycles of 30 s at 95 °C, 30 s for annealing at 55 °C, and 45 s for elongation at 72 °C and final extension at 72 °C for 10 min. PCR reactions were performed in a triplicate 20 μL mixture containing 4 μL of 5 × FastPfu Buffer, 2 μL of 2.5 mM dNTPs, 0.8 μL of each primer (5 μM) and 0.4 μL of FastPfu Polymerase and 10 ng of template DNA. The PCR products were further gel purified using an AxyPrep DNA Gel Extraction Kit (Axygen Biosciences, Union City, CA, USA) and quantified using a QuantiFluor ™-ST (Promega, USA). Purified amplicons were pooled in equimolar and paired-end sequenced on an Illumina MiSeq platform (Illumina, San Diego, CA, USA) according to the standard protocols by Majorbio Bio-Pharm Technology Co., Ltd. (Shanghai, China). Microbial composition analysis and functional prediction by Tax4Fun were conducted based on the I-Sanger platform (Majorbio, Shanghai, China).

2.6. Tax4Fun Application for Predicting Functional Classification

The prediction of functional classification of the microbial community was performed by Tax4Fun based on 16S rRNA gene sequences as described previously [25]. The 16S rRNA gene sequencing libraries were first subsampled to achieve an even sequencing depth prior to the Tax4Fun analysis. Subsequently, the OTU table was used as the input file for the metagenome imputation of each microbial community. The functional genes probably contained in the samples were predicted with Tax4Fun, and the functional classification of the predicted gene was analyzed based on the Kyoto Encyclopedia of Genes and Genomes (KEGG) orthology. The predicted functional composition profiles were compared at functional categories (level 1), subcategories (level 2) and individual pathways (level 3).

2.7. Real-Time Quantitative PCR

Real-time quantitative PCR (qPCR) was performed using a TB Green® Premix Ex Taq™ II (TaKaRa, Japan) according to the manufacturer’s instructions. Forward primer 341F(5′-CCTACGGGAGGCAGCAG-3′) and reverse primer 534R(5′-ATTACCGCGGCTGCTGG-3′) were used to quantify bacterial 16S rRNA genes to evaluate the abundance of bacteria [26]. The thermal protocol was 95 °C for 5 min, followed by 40 cycles of denaturation at 95 °C for 45 s, annealing at 55 °C for 45 s, elongation at 72 °C for 45 s and a final extension at 72 °C for 5 min. The copy number of the fhs gene, encoding 10-formyltetrahydrofolate synthetase (FTHFS), was analyzed by qPCR to characterize the abundance of acetogens, using forward primer (5′-GTWTGGGAAAAGGYGGMGAAGG-3′) and reverse primer (5′-GTATTGDGTYTTRGCCATACA-3′), and thermal program as described previously [27].

3. Results and Discussion

3.1. Electron Transfer Capacity and Redox Potential of the ESMs

Since the electron accepting capacity (EAC) and donating capacity (EDC) are important factors affecting the electron transfer performance of ESMs in MES. The two indexes of the used ESMs were measured by CA analysis (Figure 1). The EAC values of B2, MV and NR were 482.11 ± 2.83 mmole−/molESM, 361.12 ± 9.53 mmole−/molESM, and 534.87 ± 4.40 mmole−/molESM, respectively, and the EDC values were 421.04 ± 3.33 mmole−/molESM, 290.32 ± 7.07 mmole−/molESM, and 424.47 ± 6.75 mmole−/molESM, respectively. Compared with B2 and MV, NR showed relatively higher electron transfer capability.
Besides the electron transfer capability, the redox range of ESMs also determined the redox reactions in the electroactive microorganisms. As shown in Figure 2, the redox behavior of the ESMs was investigated with CV analysis. Redox peaks appeared in all the cyclic voltammograms of ESMs. The reduction peaks of B2 and NR were −480 mV and −621 mV and the oxidation potentials of B2 and NR were −429 mV and −560 mV. There were two pairs of redox peaks of MV, which were two redox reactions of MV [28]. The development of biocathodes encouraged the rise in hydrogen evolution potential, which favored the advancement of hydrogen evolution reactions. However, there was also no significant redox peak observed at the biocathode. There was a redox peak at the biocathode concurrent with the addition of ESMs in the MES. The reduction peaks of B2, MV and NR were −510 mV, −730 mV and −644 mV, respectively. The oxidation peaks of B2, MV and NR were −416 mV, −640 mV and −551 mV, respectively. The peak separation (ΔE = Eox − Ered) was larger than the theoretical value of 0 mV in Table S1, indicating that the redox processes of the ESMs were quasi-reversible [21,22]. The redox potential of the majority of anaerobic microbial growth and metabolism was covered by the three ESMs. Meanwhile, the redox range of ESMs affected the thermodynamics of microorganisms that capture electrons through ESM. According to the redox range, MV had the highest thermodynamic susceptibility to oxidation reaction among the three ESMs. The reduction potentials of ESMs decreased, indicating that the redox performance of cathodes was changed with the addition of ESMs. A possible explanation for this might be that the ESMs were coupled with microbial surface proteins to form a new complex, which changes the original redox properties of the electron shuttles.

3.2. Chemicals Production with the Addition of ESMs in MES Reactors

The chemical production was determined in the biocathode chamber of MES. As shown in Figure 3, ethanol and acetate were detected in all MES reactors. The ethanol concentration remained at a relatively stable level in the study, and the addition of electron shuttles had no direct influence on the production of ethanol. The cumulative acetate concentration in the control was 86.77 mg/L and in the reactors with B2 or NR 121.96 mg/L and 130.72 mg/L, which was 41% and 51% higher than the control, respectively. Previous studies have shown the importance of ESMs in promoting electron transport and increasing product synthesis [13,22,24,29]. However, in the MES with MV addition, acetate concentration was lower than that of control with only 51.63 mg/L, indicating the MV addition inhibited the biosynthesis of acetate. While in the MES with MV and NR additions, butyrate was also detected with concentrations of 18.08 mg/L and 14.15 mg/L, respectively. The different redox potentials of ESMs modified the thermodynamic basis of the product synthesis in the biocathode, which modified the concentration and composition of the products. Hydrogen was only detected in the MV-added MES with the concentration of 14.5 ± 2.1 mL and no hydrogen was detected under B2 and NR addition, indicating that the addition of MV was beneficial to the production of hydrogen [20]. Hydrogen accumulation influenced the transfer of electrons from the cathodes to the acetate production, which was also consistent with the decreased acetate concentration in the same MES reactor. The absence of hydrogen in the B2 and NR reactors could be explained by the fact that their redox potentials were lower than the potential for hydrogen evolution, which was incompatible with hydrogen synthesis. Moreover, the addition of MV and NR favored the synthesis of butyrate.
During cathodic synthesis reactions, carbon in the substrate is converted to biomass, carboxylic acids, alcohol and other intermediate products. The carbon conversion from inorganic carbon to various products was shown in Table 1. The amounts of inorganic carbon consumption were 81.5 mg/L (control), 60.9 mg/L (B2), 70.8 mg/L (MV) and 112.8 mg/L (NR), respectively. The inorganic carbon was converted into different chemicals in MES reactors, such as ethanol, acetate and butyrate. Acetate was the primary form of carbon recovery in all MES reactors. The carbon concentrations of acetate were 34.7 mg/L (control), 48.8 mg/L (B2), 20.7 mg/L (MV) and 52.3 mg/L (NR). The carbon conversion efficiency increased after the ESMs addition. The carbon conversion efficiency of B2 was 94.3%, which was the highest in all MES reactors. With an increase in the redox potential of ESMs, the carbon conversion efficiency rises, indicating that more carbon could be converted to acetate and ethanol in the liquid phase under high redox potential.

3.3. Electron Conversion Efficiency of Different ESMs

The ability of cathode microorganisms to capture and utilize electrons is defined by electron conversion efficiency. Using the data on chemical production in MES, the electron conversion efficiency of each product was analyzed (Figure 4). The electron conversion efficiency was 43.8% (control), 31.3% (B2), 29.7% (MV) and 67.3% (NR), respectively. The NR showed the highest electron conversion efficiency of products, while the B2 and MV showed a decreased electron conversion efficiency compared to the control. Acetate was the primary form of electron recovery in all MES reactors. The electron conversion efficiency of acetate was 42.1% (control), 30.5% (B2), 21.0% (MV) and 64.4% (NR), respectively. The best performance of acetate synthesis was observed in MES with NR addition.

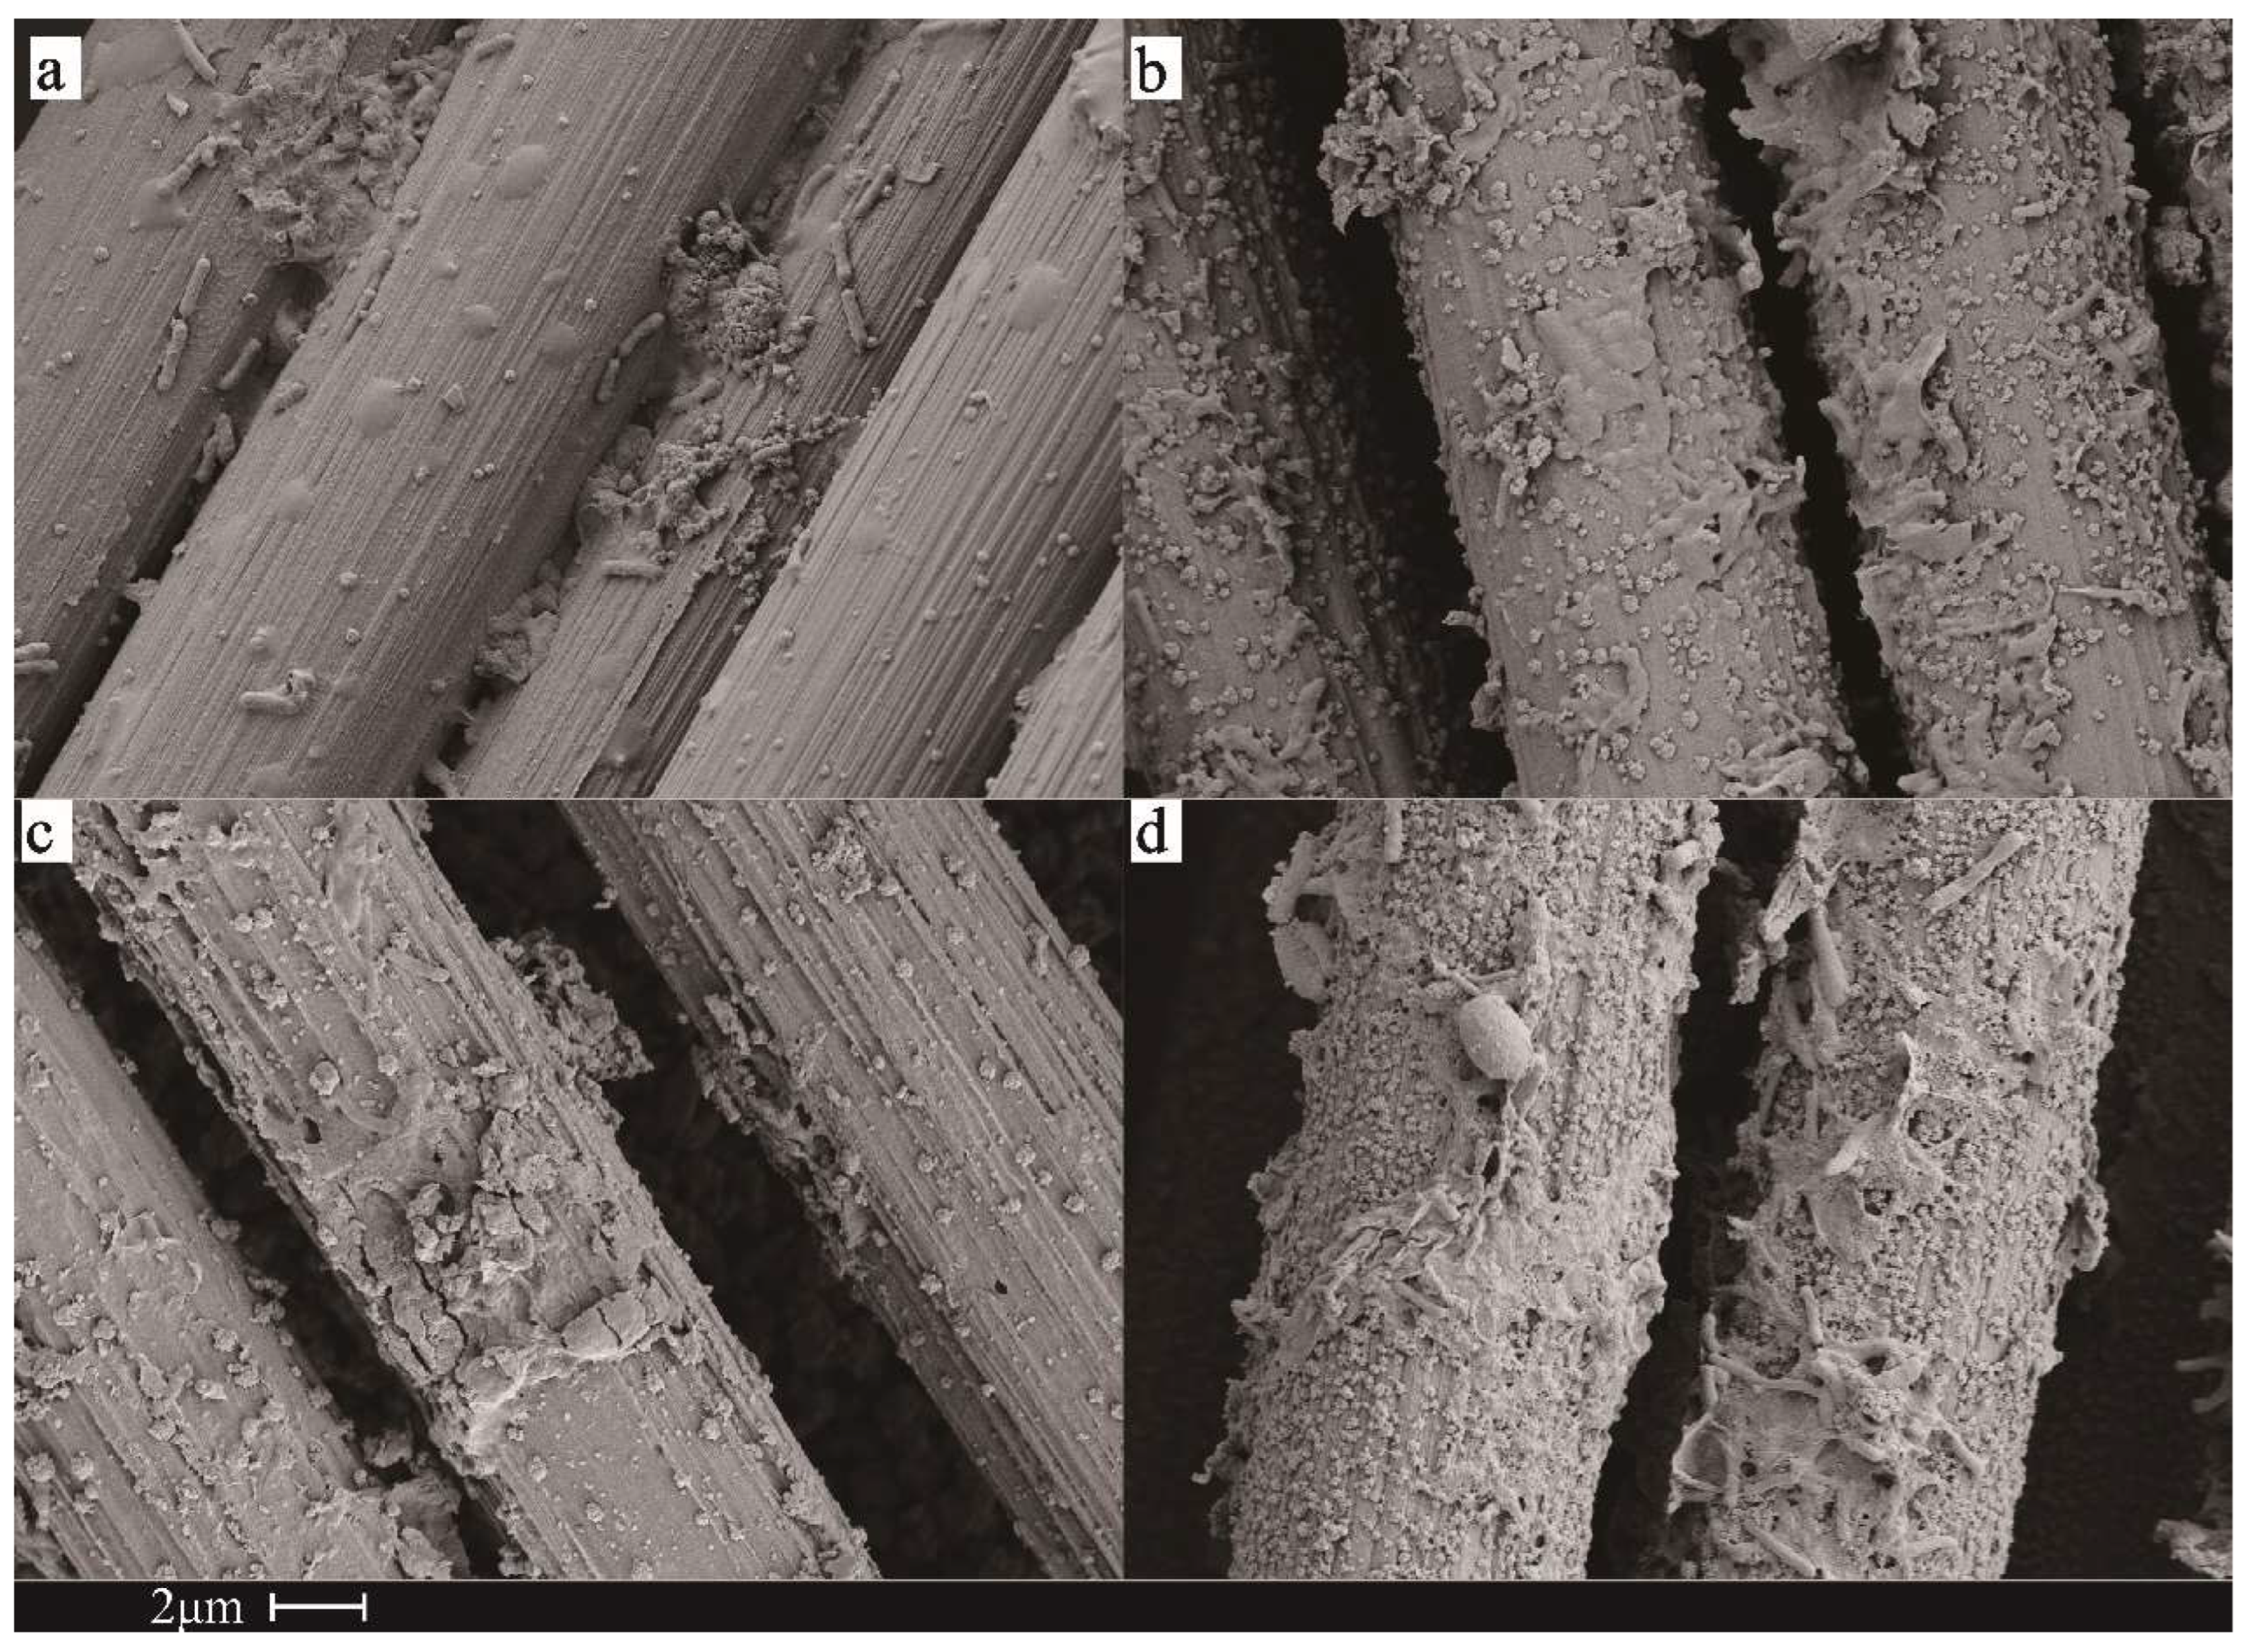
3.4. Morphology of Biocathode Biofilm and Biomass Measurement

In order to explore the impact of ESMs on the microbes on the cathode, the microscopic morphology of the biocathodes was observed based on SEM (Figure 5). As shown in Figure 5, rod-shaped microorganisms gathered on the surface of all cathodes. In the control (Figure 5a), a thin layer of extracellular polymers (EPS) was formed on the electrode surface. With the ESMs addition (Figure 5b–d), especially in the NR, more microorganisms and EPS were observed on the surface of the cathode and the biofilms were well developed. It can be deduced that the ESMs increased the acquisition of electrons by the microorganisms and benefited the growth and metabolism of the microorganisms, thus achieving a thicker biofilm. An appropriate amount of EPS could facilitate the attachment of microorganisms and be conducive to the electron transfer between the electrode and functional microbes [13].
It is well known that the acetate was produced from CO2 based on the WL pathway by the acetogens, in which the Formyltetrahydrofolate Synthetase Gene (FTHFS) encoding functional gene, fhs, is one of the key functional genes for the acetate synthesis and is frequently used as a biomarker for acetogens quantification [27]. Based on qPCR analysis, the total copy number of 16S rRNA and fhs gene on the biocathodes were detected (shown in Table 2). The total copy number of 16S rRNA and fhs gene in the ESMs-added reactors was higher than those in the control, proving that the ESMs were conducive to the growth of cathode microorganisms. The total gene copy of 16S rRNA and fhs gene on the biocathode of NR were 1.00 × 10¹⁰ copy and 5.86 × 10⁶ copy, respectively, which were the highest among all the reactors. This was consistent with the highest acetate concentration in the NR reactor. Except for the B2 reactor, the fhs/16S rRNA gene ratios of MV and NR added reactors were higher than that of the control, which indicated that MV and NR improved the proportion of acetogens in the microbial community.

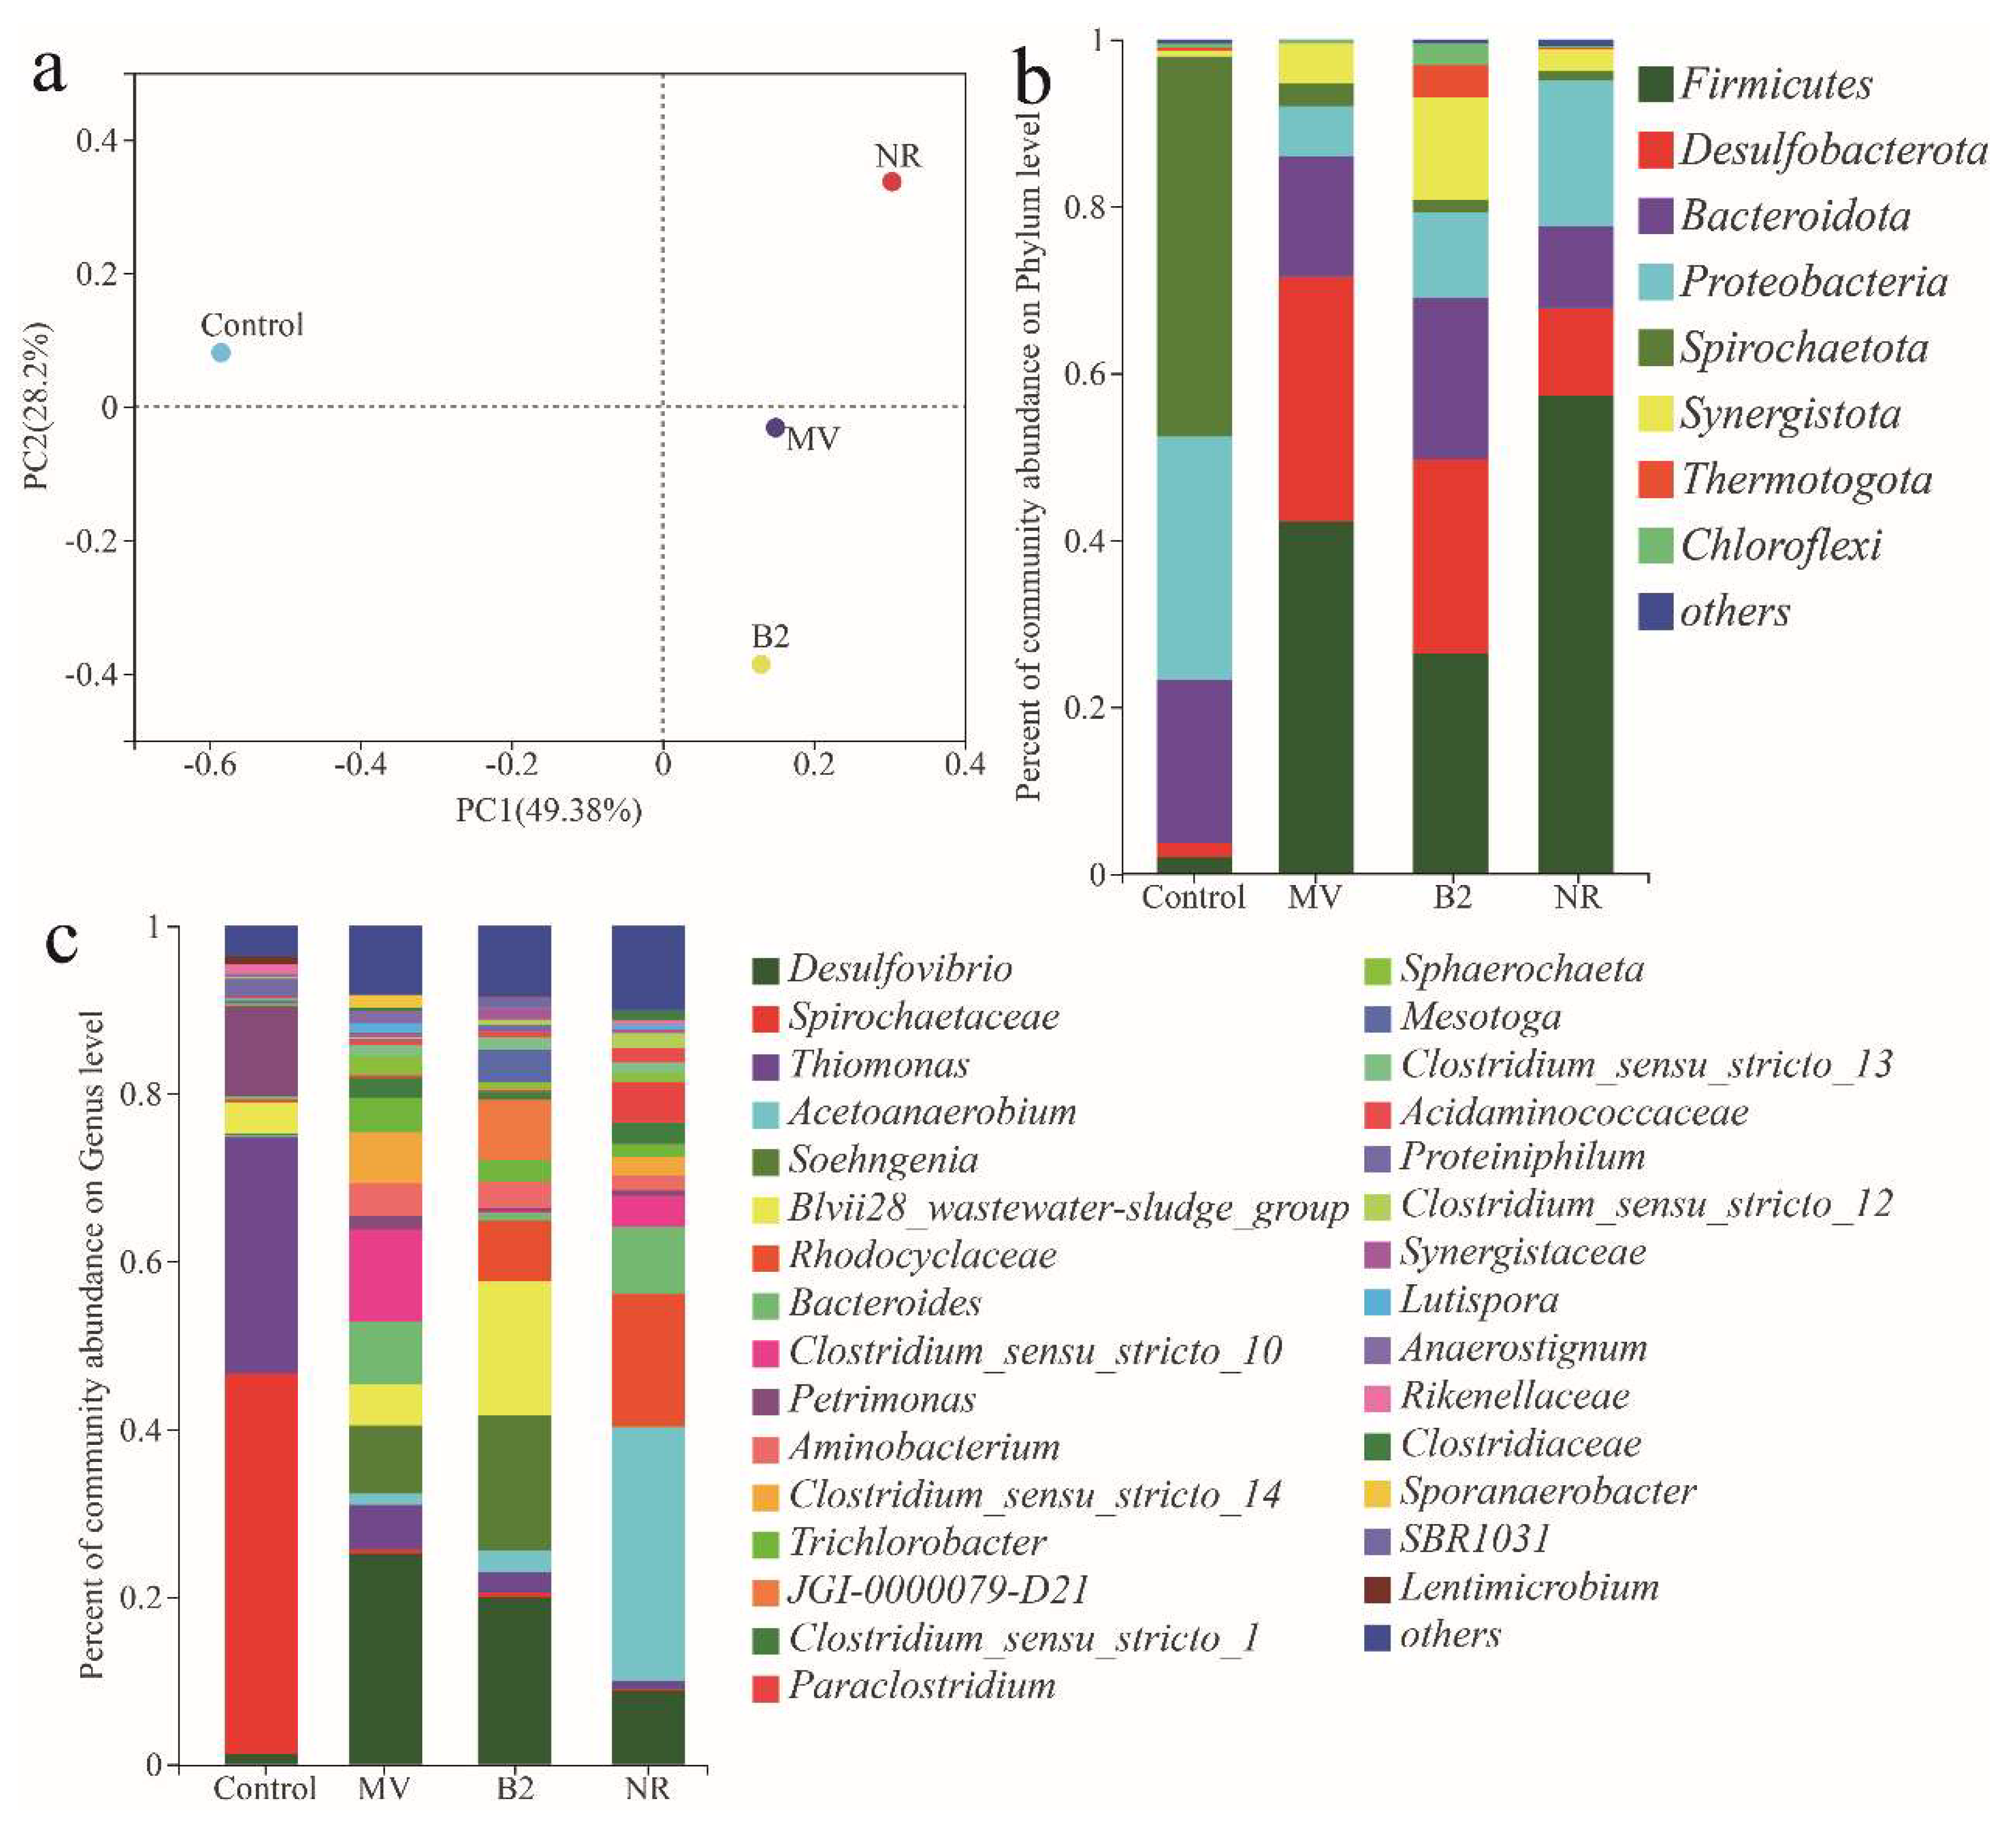
3.5. The 16S rRNA Gene Analysis of Microbial Community of Biocathode

The microbial community in the MES reactors was analyzed based on 16S rRNA gene high-throughput sequencing after operation. The indexes of the sequencing libraries were shown in Table 3. The Shannon index and the Simpson index showed that the microbial diversity of the biocathodes was B2 > MV > NR > control, indicating that the ESMs promoted the diversity of the microbial community of the biocathodes.
The microbial community of the biocathodes revealed by Illumina sequencing is shown in Figure 6. PCoA (Figure 6a) showed that the microbial community of the control was quite different from the ESM-added reactors, indicating that the ESMs affected the microbial community of biocathode in MES. While, the B2, MV and NR were not clustered in a small area, but separated by a certain distance, indicating moderate differences in the microbial community among the ESMs-added reactors. As shown in Figure 6b, Spirochaetota, Proteobacteria, and Bacteroidetes were the three dominant phyla in the control, which accounted for 93.1% of the microbial community. Firmicutes and Desulfobacterota only accounted for 1.3% and 0.1%, respectively, in the control. However, with ESMs addition, the relative abundance of Firmicutes and Desulfobacterota increased to 26.4–57.4% and 10.5–29.3%, respectively, and became two of the dominant phyla in the ESMs-added reactors. The addition of NR was beneficial for the enrichment of Firmicutes, in which the relative abundance was increased to 57.4%, and most of the acetogens were Firmicutes [30]. The Desulfobacterota was aided by the addition of MV, with the most notable relative abundance increase reaching 29.3%, suggesting that the production of hydrogen was related to the increased abundance of Desulfobacterota [31].
As the differences in microbial community composition among the three ESMs-added reactors, the microbial communities were further compared at the genus level (Figure 6c). The total relative abundance of Clostridium and Acetoanaerobium in B2, MV and NR were 5.68%, 22.78% and 42.89%, respectively. The functional genera of Clostridium and Acetoanaerobium were typical Firmicutes, which were reported that could generate acetate and butyrate through the Wood–Ljungdahl pathway [32,33,34]. In the ESMs reactors, the relative abundance of the above-mentioned acetogens was significantly increased compared with the control, in which the relative abundance of the acetogens was only 0.29%. The enrichment of acetogens was limited in B2 addition. The redox range of B2 was −175~−269 mV (vs. SHE) [35,36], which increased microorganisms on the cathode but failed to enrich acetogens. The redox potential range of MV was the lowest, and acetogens could flourish in MES. However, low redox potential interfered with normal redox parallelism within cells, making microorganisms toxic and impeding their normal metabolic processes [37]. NR addition improved most in acetogens proportion, which was consistent with the most produced organic acid products in the NR group. The redox range of NR was −310~−403 mV (vs. SHE), which was the best potential range for acetate synthesis and the growth environment of acetogens [38]. The addition of NR increased the diversity of microorganisms and the abundance of acetogens in the biocathode, which was beneficial for acetate synthesis. In addition, the detected genera of Desulfovibrio, Thiomonas and Rhodocyclaceae were typical H2-producing microorganisms. The produced H2 could serve as the electron donor to reduce CO2 to acetate [31,39,40], which may affect the production of acetate. However, the total relative abundance of H2-producing microorganisms in the control, B2, MV, and NR were 29.70%, 29.59%, 30.60% and 25.49%, respectively, which were very close to the ESMs-added reactors. The addition of ESMs increased the abundance of acetogens, which was advantageous for increasing the efficiency of acetate synthesis.

3.6. Predicted Functions of the Microbial Community on Biocathodes

The microbial function profile of the microbial community on the biocathodes was analyzed with Tax4Fun and compared with the KEGG database. The conversion of CO2 to acetate in microorganisms occurred via the WL pathway. The abundance of functional genes for the Wood–Ljungdahl (WL) pathway was shown in Figure 7 [41]. The predicted functional genes for the WL pathway showed that the relative abundance of acetyl-CoA decarbonylase (K00194/K00197/K00198) and formate dehydrogenase beta subunit (K15022) encoding gene in ESMs-added reactors were higher than that of the control. However, the relative abundance of formate dehydrogenase alpha subunit (K05299) was suppressed by the addition of ESMs. According to this finding, the expression of acetyl-CoA decarbonylase, the first functional enzyme of the carboxyl branch, may be more easily facilitated by the addition of ESMs. However, the relative abundance of acetyl-CoA decarbonylase (K00194/K00197/K00198) was low, which means that the effect of ESM on the WL pathway was minimal. In addition, the butyrate synthesis was the condensation of two acetyl CoA for the carbon chain and related to “Fatty acid metabolism”, which is part of “liquid metabolism”. The abundance of functional genes for fatty acid elongation was shown in Figure S2. The relative abundance of acetyl-CoA/propionyl-CoA carboxylase (K11263), 3-oxoacyl-(acyl-carrier-protein) synthase I (K00647), enoyl-(acyl-carrier protein) reductase III (K10780) were higher in NR and MV reactors than that of the control, consistent with the butyrate production under NR/MV added conditions. The activity of “Fatty acid metabolism” was elevated to facilitate butyrate synthesis in the NR/MV added reactors.
The acetate production performance of the MES was the process in which the electrons transfer from the cathode to the microorganisms for acetate synthesis via the WL pathway. The electron transfer mechanism typically involved the conservation of energy in acetogens. The mode of energy conservation contained NADH complex, hydrogenase, Rnf complex and ATP synthase (ATPase), which transported electrons from the outside to the inside of the cell or the other way around [30,41,42]. The predicted functional genes for the electron transfer are shown in Figure 8. The NADH-quinone oxidoreductase subunit was a typical energy conversion, coupled with NAD(P)+/NAD(P)H and a part of “Energy metabolism”. The relative abundance of NADH-quinone oxidoreductase subunit A-N (K00330-00343) encoding gene on the biocathode of B2 was higher than that of the control, and the increased range of NADH-quinone oxidoreductase subunit A-N was 1.2–4.1-fold. The relative abundance of NADH-quinone oxidoreductase subunit F (K00335) was the highest on the biocathode of B2, which was 4.1-fold higher than that of the control. However, the relative abundance of ferredoxin/flavodoxin-NADP+ reductase (K00528), NADH:quinone reductase (K03885) and NADH-quinone oxidoreductase subunit C/D (K13378) were increased and the other KO of NADH complexes were decreased than that of the control in NR/MV added reactors. The results showed that the addition of B2 promoted the relative abundance of NADH-quinone oxidoreductase and increased energy conversion via NADH complexes. Hydrogenase was an electron transfer complex that accepted electrons through direct or indirect electron transfer, which was coupled with Fd/Fd2− and NAD+/NADH [43,44]. The relative abundance of most hydrogenases increased in the B2 dosing group, and the increased range of hydrogenases (K00437, K00534, K03605, K03618, K03620, K04651, K04652, K04653, K04654, K04655, K04656, K05587, K05911, K05922, K06281, K06282, K06441, and K12140) were 1.7–498.8-fold. Moreover, the relative abundance of partial hydrogenases increased in the MV dosing group, and the increased range of hydrogenases (K00437, K00534, K03605, K03618, K03620, K04651, K04652, K04653, K04654, K04655, K04656, K05911, K05922, K06281, K06282, K06441, K12140, K12141, and K14088) were 1.2–40.9-fold. The relative abundance of K00437, K03605, K03618, K03620, K04651, K04652, K04654, K04655, K04656, K05922 and K06441 increased in the NR dosing group, and the increased range of hydrogenases were 1.0–1.6-fold. Compared with MV and NR reactors, B2 was beneficial to the increase in abundance of hydrogenases, suggesting that B2 has more affinity with hydrogenase than MV and NR. The function of the Rnf complex was an energy conservation-associated sodium ion/proton pump during acetogens, which was coupled with NAD+/NADH. The relative abundance of the Rnf complex is shown in Figure 8c. The relative abundance of the Rnf complex increased in the MV and NR dosing groups, while the addition of B2 only promoted the relative abundance of K03612, K03614 and K03615. The relative abundance of the Rnf complex in the NR dosing group was 1.4–2.3 times greater than the MV dosing group, suggesting that the addition of NR may help with the expression of the Rnf complex and the synthesis of NADH [45]. ATP synthases catalyze the synthesis of ATP utilizing the energy of an electrochemical H+ gradient generated by electron transport [41,46]. The relative abundance of the ATPase shown in Figure 8d, and the addition of ESMs had little effect on the relative abundance of ATP synthase.
WL pathway and energy conversion were two important processes for acetate production in MES. ESMs could improve the WL pathway-related genes (e.g., K01938, K00198 and K15022), which were coupled with energy conversion. In addition, the mode of energy conservation was increased by the addition of ESMs. The acetate concentrations were 41% and 51% higher than that of the control in the B2 and NR addition since the energy conversion was improved by the ESMs addition. Energy conversion was a crucial step in the synthesis of acetate in MES. The NADH-quinone oxidoreductase, hydrogenase and RNF complex were typical energy conversion complexes, which coupled with the endergonic reduction of ferredoxin (Fd) or the exergonic reduction of NAD [41].
The B2 was composed of flavin mononucleotide (FMN) and flavin adenine dinucleotide (FAD) [47]. The reduction potential of B2 was the highest in the three ESMs, which could not directly reduce hydrogenase for energy conversion, indicating that energy conversion was possible through electron bifurcation when B2 and hydrogenase were combined [48]. Meanwhile, the NADH-quinone oxidoreductase and hydrogenase contained iron–sulfur clusters and flavin [41,44,49], indicating that the B2 coupled with NADH-quinone oxidoreductase and hydrogenase (Figure 9). These results suggested that B2 could couple better with NADH-quinone oxidoreductase and hydrogenase.
Moreover, the relative abundance of NADH-quinone oxidoreductase was inhibited in the MV and NR dosing group, and the expression of hydrogenase was only slightly impacted by the addition of NR and MV (Figure 8a,b). The relative abundance of the Rnf complex was inhibited in the B2 dosing group and the addition of NR or MV increased the relative abundance of the Rnf complex (Figure 8c). The relative abundance of the RNF complex was most significantly impacted by the addition of NR among the ESMs, suggesting that the NR dosing encouraged the synthesis of NADH via the Rnf complex. The reduction of NR was coupled with NAD+/NADH (E0ʹ = −280 mV) and NADP+/NADPH (E0ʹ = −370 mV), and the concentration of NR influenced the amount of NAD(P)+ reduced. The higher NAD(P)H reductase activity was conducive to the production of butyrate.
MV had little effect on typical energy conversion complexes. One possible implication of this is that the standard redox potential (E0ʹ) of MV was −460 mV (vs. NHE), and the reduction of MV was coupled with ferredoxin (E(Fd/Fd2−) = −450 mV) [11,41,50]. The reduced ferredoxin was a high-energy intermediate, which provides the amount of ATP for redox reactions (e.g., CO2/formate, crotonyl-CoA/butyryl-CoA) though on consumption reduced ferredoxin in acetogens [41]. A possible explanation might be that the redox potential of the MV was low, which was conducive to the production of butyrate [11,37]. Meanwhile, the lower reduction potential caused microbial activity to be inhibited, which was toxic to microorganisms.

4. Conclusions

This study explored the influence of ESMs on the reduction of CO2 to acetate by MES. The enhancement of electron transfer from the electrode to the microorganism by ESMs addition was revealed. The addition of B2 and NR promoted the production of acetate, and the addition of MV and NR was conducive to the production of butyrate. The increase in acetate production in the B2 dosing group might be owing to the enhanced electron transfer through B2 coupling with NADH and hydrogenase. The addition of NR/MV probably facilitated the synthesis of NADH by coupling electron transfer with the Rnf complex, which was advantageous for the production of acetate and butyrate. One of the more significant findings to emerge from this study is that the products of the cathode were related to the redox ability of microbial electron acceptors. These findings enhance the understanding of the mechanism by which the redox properties of electron shuttle-coupled microbial electron acceptors affect the products. Microorganisms were unable to acquire sufficient electrons because of the limited contact they have with electrodes, and the addition of ESMs made it possible to scale up and industrialize MES.

Supplementary Materials

The following supporting information can be downloaded at: https://www.mdpi.com/article/10.3390/fermentation9070679/s1, Table S1: The redox potential of the ESMs; Figure S1: The schematic diagram of the MES reactors used in this study; Figure S2: Distribution pattern of KEGG-assigned functional genes for “Fatty acid biosynthesis” in the samples; Figure S3: The chronoamperometry of the ESMs; Figure S4: The current-time profiles for the electrosynthesis experiments.

Author Contributions

J.Z.: Conceptualization, Methodology, Data Curation, Investigation, Formal Analysis, Visualization and Writing—Original Draft; H.L.: Funding Acquisition, Resources, Project administration and Writing—Review and Editing; Y.Z.: Conceptualization, Data Analysis, Formal Analysis and Writing—Original Draft; B.F.: Methodology, Formal Analysis and Writing—Review and Editing; C.Z.: Data Analysis, Formal Analysis and Software; M.C.: Investigation, Formal Analysis and Writing—Review and Editing; P.W.: Investigation, Formal Analysis and Validation, C.C.: Investigation, Formal Analysis and Validation. All authors have read and agreed to the published version of the manuscript.

Funding

This study was supported by the Jiangsu Collaborative Innovation Center of Technology and Material of Water Treatment, Suzhou University of Science and Technology, 215009 (NO. XTCXSZ2022-15).

Institutional Review Board Statement

This article does not contain any studies with human participants or animals performed by any of the authors.

Informed Consent Statement

Not applicable.

Data Availability Statement

The datasets generated during and/or analyzed during the current study are available from the corresponding author upon reasonable request.

Conflicts of Interest

The authors declare no conflict of interest.

References

  1. ElMekawy, A.; Hegab, H.M.; Mohanakrishna, G.; Elbaz, A.F.; Bulut, M.; Pant, D. Technological advances in CO2 conversion electro-biorefinery: A step toward commercialization. Bioresour. Technol. 2016, 215, 357–370. [Google Scholar] [CrossRef]
  2. Ammam, F.; Tremblay, P.-L.; Lizak, D.M.; Zhang, T. Effect of tungstate on acetate and ethanol production by the electrosynthetic bacterium Sporomusa ovata. Biotechnol. Biofuels 2016, 9, 163. [Google Scholar] [CrossRef] [Green Version]
  3. Batlle-Vilanova, P.; Ganigué, R.; Ramió-Pujol, S.; Bañeras, L.; Jiménez, G.; Hidalgo, M.; Balaguer, M.D.; Colprim, J.; Puig, S. Microbial electrosynthesis of butyrate from carbon dioxide: Production and extraction. Bioelectrochemistry 2017, 117, 57–64. [Google Scholar] [CrossRef]
  4. Martens, J.A.; Bogaerts, A.; De Kimpe, N.; Jacobs, P.A.; Marin, G.B.; Rabaey, K.; Saeys, M.; Verhelst, S. The Chemical Route to a Carbon Dioxide Neutral World. Chemsuschem 2016, 10, 1039–1055. [Google Scholar] [CrossRef]
  5. Mohanakrishna, G.; Vanbroekhoven, K.; Pant, D. Impact of dissolved carbon dioxide concentration on the process parameters during its conversion to acetate through microbial electrosynthesis. React. Chem. Eng. 2018, 3, 371–378. [Google Scholar] [CrossRef]
  6. Fontmorin, J.-M.; Izadi, P.; Li, D.; Lim, S.S.; Farooq, S.; Bilal, S.S.; Cheng, S.; Yu, E.H. Gas diffusion electrodes modified with binary doped polyaniline for enhanced CO2 conversion during microbial electrosynthesis. Electrochim. Acta 2021, 372, 137853. [Google Scholar] [CrossRef]
  7. Tahir, K.; Miran, W.; Jang, J.; Woo, S.H.; Lee, D.S. Enhanced product selectivity in the microbial electrosynthesis of butyrate using a nickel ferrite-coated biocathode. Environ. Res. 2021, 196, 110907. [Google Scholar] [CrossRef]
  8. Saini, R.; Kapoor, R.; Kumar, R.; Siddiqi, T.; Kumar, A. CO2 utilizing microbes—A comprehensive review. Biotechnol. Adv. 2011, 29, 949–960. [Google Scholar] [CrossRef]
  9. Luan, L.; Ji, X.; Guo, B.; Cai, J.; Dong, W.; Huang, Y.; Zhang, S. Bioelectrocatalysis for CO2 reduction: Recent advances and challenges to develop a sustainable system for CO2 utilization. Biotechnol. Adv. 2023, 63, 108098. [Google Scholar] [CrossRef]
  10. Steinbusch, K.J.J.; Hamelers, H.V.M.; Schaap, J.D.; Kampman, C.; Buisman, C.J.N. Bioelectrochemical Ethanol Production through Mediated Acetate Reduction by Mixed Cultures. Environ. Sci. Technol. 2009, 44, 513–517. [Google Scholar] [CrossRef]
  11. Choi, O.; Um, Y.; Sang, B.-I. Butyrate production enhancement by Clostridium tyrobutyricum using electron mediators and a cathodic electron donor. Biotechnol. Bioeng. 2012, 109, 2494–2502. [Google Scholar] [CrossRef]
  12. Huang, B.; Gao, S.; Xu, Z.; He, H.; Pan, X. The Functional Mechanisms and Application of Electron Shuttles in Extracellular Electron Transfer. Curr. Microbiol. 2017, 75, 99–106. [Google Scholar] [CrossRef]
  13. Wu, Y.; Luo, X.; Qin, B.; Li, F.; Häggblom, M.M.; Liu, T. Enhanced Current Production by Exogenous Electron Mediators via Synergy of Promoting Biofilm Formation and the Electron Shuttling Process. Environ. Sci. Technol. 2020, 54, 7217–7225. [Google Scholar] [CrossRef]
  14. Aryal, N.; Ammam, F.; Patil, S.A.; Pant, D. An overview of cathode materials for microbial electrosynthesis of chemicals from carbon dioxide. Green Chem. 2017, 19, 5748–5760. [Google Scholar] [CrossRef]
  15. Chatterjee, P.; Dessì, P.; Kokko, M.; Lakaniemi, A.-M.; Lens, P. Selective enrichment of biocatalysts for bioelectrochemical systems: A critical review. Renew. Sustain. Energy Rev. 2019, 109, 10–23. [Google Scholar] [CrossRef]
  16. Song, Y.E.; Mohamed, A.; Kim, C.; Kim, M.; Li, S.; Sundstrom, E.; Beyenal, H.; Kim, J.R. Biofilm matrix and artificial mediator for efficient electron transport in CO2 microbial electrosynthesis. Chem. Eng. J. 2021, 427, 131885. [Google Scholar] [CrossRef]
  17. Marsili, E.; Baron, D.B.; Shikhare, I.D.; Coursolle, D.; Gralnick, J.A.; Bond, D.R. Shewanella secretes flavins that mediate extracellular electron transfer. Proc. Natl. Acad. Sci. USA 2008, 105, 3968–3973. [Google Scholar] [CrossRef]
  18. Kaden, J.; Galushko, A.S.; Schink, B. Cysteine-mediated electron transfer in syntrophic acetate oxidation by cocultures of Geobacter sulfurreducens and Wolinella succinogenes. Arch. Microbiol. 2002, 178, 53–58. [Google Scholar] [CrossRef] [Green Version]
  19. Wolf, M.; Kappler, A.; Jiang, J.; Meckenstock, R.U. Effects of Humic Substances and Quinones at Low Concentrations on Ferrihydrite Reduction by Geobacter metallireducens. Environ. Sci. Technol. 2009, 43, 5679–5685. [Google Scholar] [CrossRef]
  20. Huang, L.; Tang, J.; Chen, M.; Liu, X.; Zhou, S. Two Modes of Riboflavin-Mediated Extracellular Electron Transfer in Geobacter uraniireducens. Front. Microbiol. 2018, 9, 2886. [Google Scholar] [CrossRef]
  21. Wu, Y.D.; Liu, T.X.; Li, X.M.; Li, F.B. Exogenous Electron Shuttle-Mediated Extracellular Electron Transfer of Shewanella putrefaciens 200: Electrochemical Parameters and Thermodynamics. Environ. Sci. Technol. 2014, 48, 9306–9314. [Google Scholar] [CrossRef]
  22. Liang, T.; Zhou, L.; Irfan, M.; Bai, Y.; Liu, X.; Zhang, J.; Wu, Z.; Wang, W.; Liu, J.; Cheng, L.; et al. Assessment of Five Electron-Shuttling Molecules in the Extracellular Electron Transfer of Electromethanogenesis by using Methanosarcina barkeri. Chemelectrochem 2020, 7, 3783–3789. [Google Scholar] [CrossRef]
  23. Gemünde, A.; Lai, B.; Pause, L.; Krömer, J.; Holtmann, D. Redox Mediators in Microbial Electrochemical Systems. Chemelectrochem 2022, 9, e202200216. [Google Scholar] [CrossRef]
  24. Kracke, F.; Virdis, B.; Bernhardt, P.V.; Rabaey, K.; Krömer, J.O. Redox dependent metabolic shift in Clostridium autoethanogenum by extracellular electron supply. Biotechnol. Biofuels 2016, 9, 249. [Google Scholar] [CrossRef] [PubMed] [Green Version]
  25. Zhang, J.; Liu, H.; Zhang, Y.; Wu, P.; Li, J.; Ding, P.; Jiang, Q.; Cui, M.-H. Heterotrophic precultivation is a better strategy than polarity reversal for the startup of acetate microbial electrosynthesis reactor. Biochem. Eng. J. 2022, 179, 108319. [Google Scholar] [CrossRef]
  26. He, S.; Gall, D.L.; McMahon, K.D. “Candidatus Accumulibacter” Population Structure in Enhanced Biological Phosphorus Removal Sludges as Revealed by Polyphosphate Kinase Genes. Appl. Environ. Microbiol. 2007, 73, 5865–5874. [Google Scholar] [CrossRef] [Green Version]
  27. Xu, K.W.; Liu, H.; Du, G.C.; Chen, J. Real-time PCR assays targeting formyltetrahydrofolate synthetase gene to enumerate acetogens in natural and engineered environments. Anaerobe 2009, 15, 204–213. [Google Scholar] [CrossRef]
  28. Peguin, S.; Delorme, P.; Goma, G.; Soucaille, P. Enhanced alcohol yields in batch cultures of Clostridium acetobutylicum using a three-electrode potentiometric system with methyl viologen as electron carrier. Biotechnol. Lett. 1994, 16, 269–274. [Google Scholar] [CrossRef]
  29. Paiano, P.; Menini, M.; Zeppilli, M.; Majone, M.; Villano, M. Electro-fermentation and redox mediators enhance glucose conversion into butyric acid with mixed microbial cultures. Bioelectrochemistry 2019, 130, 107333. [Google Scholar] [CrossRef]
  30. Nevin, K.P.; Hensley, S.A.; Franks, A.E.; Summers, Z.M.; Ou, J.H.; Woodard, T.L.; Snoeyenbos-West, O.L.; Lovley, D.R. Electrosynthesis of Organic Compounds from Carbon Dioxide Is Catalyzed by a Diversity of Acetogenic Microorganisms. Appl. Environ. Microbiol. 2011, 77, 2882–2886. [Google Scholar] [CrossRef] [PubMed] [Green Version]
  31. Jourdin, L.; Freguia, S.; Donose, B.C.; Keller, J. Autotrophic hydrogen-producing biofilm growth sustained by a cathode as the sole electron and energy source. Bioelectrochemistry 2015, 102, 56–63. [Google Scholar] [CrossRef] [PubMed]
  32. Aryal, N.; Tremblay, P.-L.; Lizak, D.M.; Zhang, T. Performance of different Sporomusa species for the microbial electrosynthesis of acetate from carbon dioxide. Bioresour. Technol. 2017, 233, 184–190. [Google Scholar] [CrossRef] [PubMed]
  33. Aklujkar, M.; Leang, C.; Shrestha, P.M.; Shrestha, M.; Lovley, D.R. Transcriptomic profiles of Clostridium ljungdahlii during lithotrophic growth with syngas or H2 and CO2 compared to organotrophic growth with fructose. Sci. Rep. 2017, 7, 13135. [Google Scholar] [CrossRef] [PubMed] [Green Version]
  34. Bes, M.; Merrouch, M.; Joseph, M.; Quemeneur, M.; Payri, C.; Pelletier, B.; Ollivier, B.; Fardeau, M.L.; Erausol, G.; Postec, A. Acetoanaerobium pronyense sp nov., an anaerobic alkaliphilic bacterium isolated from a carbonate chimney of the Prony Hydrothermal Field (New Caledonia). Int. J. Syst. Evol. Microbiol. 2015, 65, 2574–2580. [Google Scholar] [CrossRef] [Green Version]
  35. Hatti-Kaul, R.; Mattiasson, B. Anaerobes in Industrial- and Environmental Biotechnology. In Anaerobes in Biotechnology; Hatti-Kaul, R., Mamo, G., Mattiasson, B., Eds.; Springer International Publishing: Cham, Switzerland, 2016; pp. 1–33. [Google Scholar]
  36. Rodrigues, T.D.C.; Rosenbaum, M.A. Microbial Electroreduction: Screening for New Cathodic Biocatalysts. Chemelectrochem 2014, 1, 1916–1922. [Google Scholar] [CrossRef]
  37. Peguin, S.; Soucaille, P. Modulation of metabolism of Clostridium acetobutylicum grown in chemostat culture in a three-electrode potentiostatic system with methyl viologen as electron carrier. Biotechnol. Bioeng. 1996, 51, 342–348. [Google Scholar] [CrossRef]
  38. Barton, L.L. Microbial Ecology; John Wiley & Sons, Incorporated: Newark, NJ, USA, 2011. [Google Scholar]
  39. Perona-Vico, E.; Feliu-Paradeda, L.; Puig, S.; Bañeras, L. Bacteria coated cathodes as an in-situ hydrogen evolving platform for microbial electrosynthesis. Sci. Rep. 2020, 10, 19852. [Google Scholar] [CrossRef]
  40. Xiang, Y.; Liu, G.; Zhang, R.; Lu, Y.; Luo, H. Acetate production and electron utilization facilitated by sulfate-reducing bacteria in a microbial electrosynthesis system. Bioresour. Technol. 2017, 241, 821–829. [Google Scholar] [CrossRef]
  41. Schuchmann, K.; Müller, V. Autotrophy at the thermodynamic limit of life: A model for energy conservation in acetogenic bacteria. Nat. Rev. Genet. 2014, 12, 809–821. [Google Scholar] [CrossRef]
  42. Hirose, A.; Kasai, T.; Aoki, M.; Umemura, T.; Watanabe, K.; Kouzuma, A. Electrochemically active bacteria sense electrode potentials for regulating catabolic pathways. Nat. Commun. 2018, 9, 1083. [Google Scholar] [CrossRef] [Green Version]
  43. Schut, G.J.; Adams, M.W.W. The Iron-Hydrogenase of Thermotoga maritima Utilizes Ferredoxin and NADH Synergistically: A New Perspective on Anaerobic Hydrogen Production. J. Bacteriol. 2009, 191, 4451–4457. [Google Scholar] [CrossRef] [PubMed] [Green Version]
  44. Schuchmann, K.; Müller, V. A Bacterial Electron-bifurcating Hydrogenase. J. Biol. Chem. 2012, 287, 31165–31171. [Google Scholar] [CrossRef] [PubMed] [Green Version]
  45. Biegel, E.; Schmidt, S.; González, J.M.; Müller, V. Biochemistry, evolution and physiological function of the Rnf complex, a novel ion-motive electron transport complex in prokaryotes. Cell. Mol. Life Sci. 2010, 68, 613–634. [Google Scholar] [CrossRef]
  46. Müller, V. Energy Conservation in Acetogenic Bacteria. Appl. Environ. Microbiol. 2003, 69, 6345–6353. [Google Scholar] [CrossRef] [Green Version]
  47. Edel, M.; Sturm, G.; Sturm-Richter, K.; Wagner, M.; Ducassou, J.N.; Couté, Y.; Horn, H.; Gescher, J. Extracellular riboflavin induces anaerobic biofilm formation in Shewanella oneidensis. Biotechnol. Biofuels 2021, 14, 130. [Google Scholar] [CrossRef] [PubMed]
  48. Buckel, W.; Thauer, R.K. Flavin-Based Electron Bifurcation, Ferredoxin, Flavodoxin, and Anaerobic Respiration With Protons (Ech) or NAD+ (Rnf) as Electron Acceptors: A Historical Review. Front. Microbiol. 2018, 9, 401. [Google Scholar] [CrossRef] [Green Version]
  49. Velazquez, I.; Nakamaru-Ogiso, E.; Yano, T.; Ohnishi, T.; Yagi, T. Amino acid residues associated with cluster N3 in the NuoF subunit of the proton-translocating NADH-quinone oxidoreductase from Escherichia coli. FEBS Lett. 2005, 579, 3164–3168. [Google Scholar] [CrossRef] [Green Version]
  50. Beckmann, S.; Welte, C.; Li, X.; Oo, Y.M.; Kroeninger, L.; Heo, Y.; Zhang, M.; Ribeiro, D.; Lee, M.; Bhadbhade, M.; et al. Novel phenazine crystals enable direct electron transfer to methanogens in anaerobic digestion by redox potential modulation. Energy Environ. Sci. 2015, 9, 644–655. [Google Scholar] [CrossRef] [Green Version]
Figure 1. Electron transfer capacity values of the ESMs.
Fermentation 09 00679 g001
Figure 2. The cyclic voltammograms of the ESMs (scanning speed: 1 mV/s, electrolytes: 100 mM PBS).
Fermentation 09 00679 g002
Figure 3. The concentration of the produced VFAs in MES reactors.
Fermentation 09 00679 g003
Figure 4. The electron recovery of the products in MES reactors.
Fermentation 09 00679 g004
Figure 5. Scanning electron microscope images of control (a), B2 (b), MV (c), and NR (d).
Fermentation 09 00679 g005
Figure 6. Microbial community analysis based on Illumina sequencing of 16S rRNA genes from the biocathodes. (a) The PCoA of OTU level. (b) Relative abundance of bacterial community at the phylum level. (c) Relative abundance of bacterial community at the genus level.
Fermentation 09 00679 g006
Figure 7. Distribution pattern of KEGG-assigned functional genes in the samples. (a) WL pathway; and (b) the KO of the WL pathway.
Fermentation 09 00679 g007
Figure 8. Distribution pattern of KEGG-assigned functional genes in the samples. (a) The KOs of NADH complex. (b) The KOs of hydrogenase. (c) The KOs of Rnf complex. (d) The KOs of ATPase.
Fermentation 09 00679 g008
Figure 9. Mechanism of ESMs coupling with cellular proteins.
Fermentation 09 00679 g009
Table 1. Inorganic carbon conversion.
ReactorsInorganic Carbon Consumption (mg/L)Carbon Concentration of VFAs (mg/L)Carbon Conversion Efficiency (%)
EthanolAcetateButyrate
control81.5 ± 1.278.6 ± 0.0834.7 ± 0.98-53.2
B260.9 ± 0.428.7 ± 0.0448.8 ± 0.86-94.3
MV70.8 ± 1.708.2 ± 0.2220.7 ± 0.789.9 ± 0.4754.7
NR112.8 ± 2.556.6 ± 0.1752.3 ± 1.087.7 ± 0.7659.1
Table 2. Total gene copy of fhs and its relative abundance in the community.
ESMs16S rRNA Gene (Copy)fhs (Copy)fhs/16S rRNA Gene
control1.80 × 1094.13 × 1052.29 × 10−4
B27.81 × 1095.82 × 1057.45 × 10−5
MV7.56 × 1095.17 × 1066.84 × 10−4
NR1.00 × 10105.86 × 1065.86 × 10−4
Table 3. The microbial sequencing diversity of different ESMs.
ShannonSimpsonAceChaoCoverage
control2.000.25137.78138.090.99
B23.090.08178.43187.000.99
MV3.070.09179.58179.400.99
NR2.880.13179.36181.910.99
Disclaimer/Publisher’s Note: The statements, opinions and data contained in all publications are solely those of the individual author(s) and contributor(s) and not of MDPI and/or the editor(s). MDPI and/or the editor(s) disclaim responsibility for any injury to people or property resulting from any ideas, methods, instructions or products referred to in the content.

