Article

Disinfection of Digestate Effluents Using Photocatalytic Nanofiltration

by
Afroditi G. Chioti
1,
Georgia Sarikaki
1,
Vasiliki Tsioni
1,
Eleni Kostopoulou
1,
George Em. Romanos
2,
Polycarpos Falaras
2 and
Themistoklis Sfetsas
1,*
1
QLAB Private Company, Research & Development, Quality Control and Testing Services, 57008 Thessaloniki, Greece
2
Institute of Nanoscience and Nanotechnology, National Center of Scientific Research “Demokritos”, Agia Paraskevi, 15310 Athens, Greece
*
Author to whom correspondence should be addressed.
Fermentation 2023, 9(7), 662; https://doi.org/10.3390/fermentation9070662
Submission received: 27 May 2023 / Revised: 5 July 2023 / Accepted: 12 July 2023 / Published: 14 July 2023
(This article belongs to the Section Industrial Fermentation)

Abstract

:
The disinfection properties of photocatalysis on liquid digestate derived from biogas plants have been investigated for the first time. The study presents the physiological characteristics of liquid digestate retrieved from various biogas plants based in northern Greece, revealing the heterogeneity of this matrix. Preliminary photocatalysis experiments conducted on inoculated liquid digestate samples showed that disinfection was possible when a pre-treated digestate underwent a combination of centrifuge–flocculation–μfiltration after 5.5 h with 0.7 g/L suspended TiO2 under UVA illumination. To explore the feasibility of an industrial application based on this concept, a novel design photocatalytic nanofiltration reactor was implemented for disinfection experiments on pre-treated liquid digestate. The synergistic action of photocatalysis during nanofiltration alleviated the leakage phenomena, and both the retentate and permeate effluents had lower concentrations of pathogens by approximately 1–2 log10 cfu/mL. This work sets out the basis for the efficient operation and engineering application of collaborative technology, with photocatalysis as the final step for liquid digestate sanitation and reusable water recovery.

1. Introduction

Anaerobic digestion (AD) is a biochemical process conducted in an anaerobic digester, wherein a diverse community of microorganisms converts complex organic matter (OM) into biogas and digestate under controlled conditions without the presence of oxygen [1]. AD serves as a widely employed technique for effectively diminishing the volume of various biomass sources, including the organic fraction of industrial waste, energy crops, agricultural residues, and forestry remnants, while simultaneously recovering renewable energy [2,3]. Despite being recognized as a highly favorable waste treatment technology, particularly from an environmental standpoint, AD does not achieve complete waste stabilization [4].
Pathogenic microorganisms including Escherichia coli, Enterococcus faecalis, Salmonella spp., Listeria monocytogenes, and Clostridium perfringens, and zoonotic viruses like porcine parvovirus, which are generally not problematic during the AD of animal wastes (i.e., cattle, pig, poultry, and sheep manure) [5,6,7], they have the ability to survive the digestion process and persist in the Whole Digestate (WD), especially in mesophilic conditions [8]. As WD can serve as a potential vehicle for pathogen transmission from agricultural land to humans through the food chain, it is crucial to ensure proper sanitation practices. Different pre-treatment methods, such as pasteurization [9], chlorine treatment, UV-light exposure, ozone treatment [10], and high-pressure treatment within a vessel [11], can be employed to reduce the pathogen load in the final WD effluent.
The primary objective of effective WD sanitation is to achieve a reduction in the concentration of Enterococcus faecalis or Salmonella senftenberg by a factor of 5 log10 and thermal-resistant viruses by a factor of 3 log10. Enterococcus faecalis (a Gram-positive bacterium) and Escherichia coli (a Gram-negative bacterium) are commonly used as indicator microorganisms to evaluate the efficacy of the sanitation process. Enterococcus faecalis has also been selected as an indicator bacterium according to EU regulation No. 142/2011 [12]. While the thermal inactivation of pathogens has been extensively studied on a laboratory scale, caution must be exercised when extrapolating the results to large-scale systems. Factors such as uneven heating, fluctuating temperatures, and the shielding properties of solids can affect the required exposure time for pathogen inactivation. Therefore, further investigation is necessary to transfer the laboratory findings to full-scale systems [13].
Apart from conventional thermal pasteurization technologies, alternative methods, such as electro-technology, microwave treatment, pressurization, ultrasound treatment, and chemical treatments have the potential to significantly reduce bacterial populations and simultaneously increase methane (CH4) yield. However, the performance of these alternative technologies varies depending on the type of waste, operational parameters, and energy input [14]. It should be noted that certain spore-forming bacteria, such as Clostridium spp. and Bacillus spp., which are less sensitive to heat, may not be effectively reduced [8,15,16,17]. This was also demonstrated in a study investigating the hygiene aspects of WD, where elevated levels of Bacillus spp. were detected, suggesting that neither the sanitation treatment nor the subsequent AD process affected the abundance of Bacillus spp. [18]. Another study examined liquid manures and WD from five biogas plants in France to assess the contamination by both sporulating (Clostridium perfringens, Clostridioides difficile, and Clostridium botulinum) and non-sporulating (Escherichia coli, Enterococci, Salmonella spp., Campylobacter, and Listeria monocytogenes) bacterial species. The authors concluded that spore-forming bacteria, as well as Listeria monocytogenes, Salmonella spp., and Enterococci, can persist during AD; however, the concentration of these pathogens in WD was similar to or lower than that in liquid manures [19]. Finally, as WD is often stored prior to application on agricultural land or distribution, there is a possibility of pathogen regrowth during storage [20]. Therefore, further treatment of WD is recommended to achieve more efficient pathogen reduction.
A highly efficient method known as advanced oxidation processes (AOPs) has emerged as a promising solution for eliminating organic pollutants from various sources, including water, on a large scale. AOPs facilitate the conversion of organic compounds into harmless by-products, such as CO2 and H2O, thereby ensuring their safe removal [21,22]. By generating intermediate radicals, notably the hydroxyl radical (radical ·OH), AOPs exhibit exceptional reactivity, thus enabling them to effectively oxidize a wide range of organic molecules [23]. Commonly employed AOPs include ozonation, Fenton and photo-Fenton processes, photolysis, photocatalysis, and electrochemical methods, each offering distinct advantages [24,25,26]. Notably, photocatalysis has garnered significant attention due to its economical, efficient, environmentally friendly nature, coupled with its moderate reaction conditions. Because of its excellent catalytic reactivity, robust physical and chemical stability, non-toxic nature, and cost-effectiveness, the semiconductor TiO2 has found extensive application as a photocatalyst [27,28]. Nevertheless, only a few research teams have explored the application of photocatalysis on liquid digestate (LD).
In particular, Wang et al., (2021, 2023) explored the effect of photocatalysis on the physicochemical properties of LD and the photocatalytic degradation of tetracyclines. They found that under a high pressure mercury lamp and under the optimum conditions (TiO2 of 1.0 g/L, LD depth of 20 mm and photocatalytic time of 120 min), the removal of tetracycline reached 94.99, 88.92, and 95.52%, respectively. LD from swine manure and 10% wastewater, was used after centrifugation. [29]. In a more recent study, the results showed minor effects on major nutrients, an increase in tryptophan substances, soluble microbial by-products, and a decrease in humic substances. Bacterial community richness, diversity, and evenness decreased, with a shift from Firmicutes to Proteobacteria after 2 h of photocatalysis [30]. In these studies, the application of flocculation pre-treatment proved effective for that matter.
Yin et al. (2021) treated WD with a combination of membrane separation and photocatalysis for antibiotic removal [31]. Jin et al. (2019) found that the photocatalytic degradation efficiency of norfloxacin for N-doped TiO2 is approximately 11 mg/g [32]. The aim of this study was to serve as a reference for the use of combined membrane filtration technologies with additional treatment systems to treat antibiotic-containing wastes. Nevertheless, antibiotics were incompletely removed at each step of the membrane process. However, P25 was highly effective in removing the antibiotics. Similar results were obtained for CIP, ENR, TE, and OTC [33,34,35] in deionized water, ultrapure water, or urban wastewater at the concentration of 5–10 mg/L. Therefore, photocatalysis is considered the best method combined with each stage of membrane filtration.
The application of photocatalysis for WD sanitation has not been studied yet. The high total solid content in matrices like WD can pose challenges for photocatalysis, due to factors such as reduced light penetration, hindered photocatalyst, contact with target pathogens, and potential catalyst fouling [36]. However, researchers have been investigating methods to overcome these challenges and optimize photocatalytic disinfection in such complex matrices [37,38,39].
Membrane technology can be employed to attenuate solids, thereby enhancing light transmission, and facilitating the feasibility of photocatalysis. The main drawbacks include the high upfront costs [40] and the tendency for membrane fouling and clogging, which can lead to decreased performance and significant operational expenses [41]. Comprehensive exploration has been conducted on a wide range of membrane processes for the treatment of WD: microfiltration [40,42], ultrafiltration [43,44], nanofiltration [45,46], reverse osmosis [45,46], and forward osmosis [41]. However, membrane technology generates a retentate with a higher concentration of pollutants and pathogens compared to the original material that will also need special management before disposal. In contrast, photocatalysis is commonly employed as ultrathin photocatalytic coatings supported on transparent substrates and integrated into continuous flow systems. When photocatalytic coatings are utilized, limitations in mass transfer, inadequate mixing, and brief contact times contribute to a moderate level of photocatalytic degradation performance. Additionally, an inherent drawback of stand-alone photocatalysis is the competitive interaction with organic matter, whether of natural or synthetic origin, which typically exists in WD and occupies the active adsorption sites on the surface of the photocatalyst. Therefore, novel, more advanced solutions that could effectively sanitize WD are needed [47].
In this context, a patented lab-scale reactor was configured for LD treatment [48], integrating photocatalysis and filtration in one reactor module. The efficiency of the hybrid photocatalytic nanofiltration reactor (PNFR) relied on several factors: (a) its ability to simultaneously irradiate numerous photocatalytic surfaces within the photocatalytic-membrane reactor module, while implementing the tangential flow–filtration process; (b) the disinfection capabilities achieved through the utilization of titania (TiO2) photocatalysts and the photoinduced radical mechanism triggered by the appropriate wavelength light illumination [49]; and (c) the concurrent retention of micropollutants by the nanoporous membranes [50], as described [51].
In this study, we tested PNFR for the first time, a novel method where nanofiltration and photocatalysis act simultaneously and in a synergetic way, to disinfect LD. Moreover, we used photocatalysis against common pathogens in LD, which, to the best of our knowledge has never been tested before due to light penetration problems. We present the physicochemical characteristics of LD retrieved from various biogas plants based in northern Greece. Prior to PNFR usage, preliminary photocatalysis disinfection experiments were carried out on this matrix to explore the optimum process parameters, including the optimal pre-treatment process of LD, TiO2 concentration, and retention time. This work sets the basis for the efficient operation and engineering application of a technology collaboration with photocatalysis as the final step for LD sanitation and reusable water recovery.

2. Materials and Methods

2.1. Liquid Digestate Origin, Photocatalyst and Pure Cultures

LD was collected from various biogas plants, mostly sited in northern Greece, using various types of feedstocks over the last three years. The majority of these plants used cow manure as their main feedstock comprising 70–80% of the whole. The photocatalyst used was P25 TiO2 (Degussa-Hüls AG, Frankfurt, Germany). Pathogens were added in the form of acclimatized pure cultures from certified reference materials (Sigma-Aldrich, Burlington, MA, USA) that were rehydrated in Maximum Recovery Diluent (Oxoid, Wesel, Germany), incubated overnight at 37 °C to reach maximum density and acclimatized another 24–48 h at 37 °C in the LD material in use.

2.2. Determination of Physical and Chemical Parameters

The quantification of the physicochemical parameters involved several analytical methods and instruments. Total solids (TS) were determined weighing a 2–5 g sample in a dried and pre-weighed dish. The dish was placed in a drying oven at 105 °C overnight. After cooling in a desiccator to ambient temperature, it was weighed. The method was based on the total solids dried at 103–105 °C methodology: APHA 2540-B [52]. Τotal suspended solids (TSS), and total dissolved solids (TDS) were determined by subjecting the samples to drying at 103 ± 2 °C and 180 ± 2 °C, respectively, employing total suspended solids APHA 2540-D and total dissolved solids APHA 2540-C [52]. Volatile solids (VS), which represent the portion of suspended or dissolved solids lost from a sample upon ignition at a specified temperature for a specified duration, were determined following method APHA 2540-E. The sample was dried before being placed in the muffle furnace; the dish with the sample was weighed and ignited at 550 °C for 4 h. Then it was cooled in a desiccator and weighed [52].
COD refers to the amount of oxygen required for the chemical oxidation of organic constituents by a specific oxidant (dichromate ion, Cr2O72-) under controlled conditions and is expressed as oxygen equivalence. Analysis of COD was conducted using a commercial spectrometer, HACH DR 3900 (HACH, Loveland, CO, USA), as described [53]. Briefly, a volume of sample (2 mL) was transferred in a COD test tube, homogenized if necessary, and after proper agitation it was transferred to the pre-heated digester at 150 ± 2 °C for 2 h. After completion of the reaction, when the test tubes had a temperature < 120 °C, the samples were measured spectrophotometrically at 448 nm (COD: 15–150 mg/L) and 605 nm (COD: 100–2000 mg/L) with the appropriate dilution.
pH values were measured electrometrically using a Jenway 3520 instrument (Cole-Parmer Ltd., Vernon Hills, IL, USA) equipped with a universal pH measuring electrode (924 001) and a temperature measuring electrode (027 500), following the APHA 4500-H+ method [54]. Before each measurement, the pH meter was adjusted. The electrode was gently cleaned with absorbent paper and rinsed with deionized water before every measurement. The device adjusts for the pH level at 25 °C.
EC determination was based on EN 13038 Standard determination of electrical conductivity. Firstly, the sample was diluted with deionized water and then was measured using HQ30D digital multimeter kit, conductivity electrode (HACH Model 230 HQ30D).
Turbidity was analyzed using a UV–vis spectrophotometer, specifically the COD3 Plus Colorimeter (LaMotte, Chestertown, MD, USA), according to APHA method 2540-E [52]. Total phosphorus (TP) was determined using the molybdovanadate method and Hach reagents, employing the HACH DR3900 spectrophotometer. Nitrite–nitrogen (N-NO2) concentration was determined spectrophotometrically at 543 nm using a JASCO V-630 Spectrophotometer (JASCO, Inc., Tokyo, Japan). Nitrate–nitrogen (N-NO3) concentration was determined based on the APHA 4500-NO3- ultraviolet spectrophotometric screening method, with measurements taken at 220 nm using a JASCO V-630 spectrophotometer [55]. Ammonium–nitrogen (N-NH4) concentration was determined photometrically at 420 nm using a JASCO V-630 spectrophotometer according to the nitrogen (ammonia) APHA 4500-NH3 B and C methods [56]. For the determination of macro-elements and trace metals, an Agilent 7850 ICP-MS (Agilent Technologies, Santa Clara, CA, USA) equipped with the ORS4 collision cell and SPS 4 autosampler was used for the analysis of macro-elements and trace metals; a sample introduction ISIS 3 system and Mass Hunter 5.1 software for data acquisition and processing were employed, following the procedures outlined in ISO 17294 Parts I and II and APHA 3125 [57,58]. The IntelliQuant function in the ICP-MS MassHunter 5.1 software gives the capability of a full mass-spectrum scan with only two seconds additional measurement time; nevertheless the samples were quantitated by internal standard seven-point calibration. The samples were prepared for analysis according to the digestion procedure outlined in ISO 17294 Parts I and II and APHA 3125 [57,58]. Finally, the K, Ca, Mg, and Fe, were analyzed by flame photometry using an AA-7000 atomic absorption spectrophotometer (Shimadzu, Kyoto, Japan).

2.3. Microbiological Analyses of Indicator Pathogens

Each sample (25 g) was homogenized in sterile buffered peptone water (Biokar Diagnostics, Allonne, France) using a Stomacher BagMixer 400 P (Interscience, Saint-Nom-la-Bretèche, France). Serial dilutions were prepared and inoculated in triplicate on tryptic soy agar (TSA, Biokar Diagnostics) to enumerate mesophilic counts after incubation at 37 °C for 24 h. The enumeration of Enterococcus faecalis is based on a combination of ISO 7899-2:2000—detection and enumeration of Enterococci in water and CEN-TR 16193:2013—detection and quantification of Escherichia coli in sewage sludge, treated biowaste and soil. The initial dilution was prepared by weighing 10 g (wet weight) and adding an appropriate amount of peptone saline solution (Biokar Diagnostics, Allonne, France) so that the final volume was 100 g. The material was then mixed in the homogenizer (Stomacher BagMixer 400 P, Interscience, Saint-Nom-la-Bretèche, France) for 90 s. The material was aliquoted into containers and centrifuged (1600 rpm, 3 min, 10 ± 1 °C). The supernatant (1 mL) was aseptically vacuum filtered through a 0.45 μm Whatman membrane (Whatman, Maidstone, UK) and the membrane was placed in a Slanetz and Bartley (SB, Biokar Diagnostics) plate. The plates were incubated inverted at 36 ± 2 °C for 44 ± 4 h. Decimal dilutions of the samples were filtered accordingly. After incubation, if typical colonies (brown-red color) had developed, the membrane was transferred to bile esculin azide agar medium (Biokar Diagnostics), which had been preheated to 44 ± 0.5 °C, as a confirmatory step. Black color development on bile esculin azide agar after 2 h at 44 ± 0.5 °C indicates E. faecalis colony. Method efficiency (precision and trueness) testing was performed by measurements on laboratory inoculated suspension material containing the certified reference material Enterococcus faecalis WDCM 00,009 Vitroids (Sigma-Aldrich). Samples were enumerated for Escherichia coli bacterial colonies (test portion = 1 mL) by method ISO 16193: 2013—E. coli in sludge (cultivation in membrane lactose glucoronide Agar, MLGA, medium) and method ISO 9308-1:2014—E. coli in liquid waste (cultivation in coliforms chromogenic agar, CCA, medium). For the detection of the Salmonella spp., the ISO 6579-1:2017 method was used (test portion = 25 mL, pre-enrichment with buffered peptone water, BPW, and culture in xylose lysine deoxycholate agar, XLD, nutrient selective medium). Colonies with typical Salmonella morphology were confirmed with real-time PCR after DNA extraction from the suspected colonies (StarPrep One kit, Salmonella Detection Lyokit, Biotecon Diagnostics). For the detection of Listeria monocytogenes, the ISO 11290-1:2017 standard was used (test portion = 25 g sample, pre-enrichment in Fraser Broth half concentration at 30 °C for 24 h, second enrichment in Fraser Base Broth (Oxoid, Wesel, Germany) at 30 °C for 24 h, and inoculation on Listeria Palcam Agar Base and ALOA Agar (Oxoid, Wesel, Germany). Colonies with typical Listeria morphology were confirmed as L. monocytogenes by real-time PCR after DNA extraction from the suspected colonies (StarPrep Two kit, L. monocytogenes Detection Lyokit, Biotecon Diagnostics). The results of Salmonella spp. and L. monocytogenes contamination were expressed as the presence/absence of pathogens. The enumeration of Clostridium perfringens performed according to ISO 7937:2004 on tryptose sulfite cycloserine agar (TSC, BIOKAR Diagnostics) after anaerobic incubation at 42 °C for 24 h. Three to five suspected colonies (Gram-negative, catalase-negative) were confirmed with a reverse CAMP test. Briefly, cultures were inoculated at right angles within 1–2 mm of a β-hemolytic group B Streptococcus streak on sheep blood agar plates (Biolife, Milan, Italy). After anaerobic incubation (37 °C for 18–24 h), a positive reverse CAMP test showed a “bow-tie” or “reverse arrow” pattern of hemolysis at the junction of the two cultures. Porcine parvovirus testing was performed by virus DNA extraction with QIAamp DNA Mini kit (QIAGEN, Hilde, Germany) and quantification with the ViroReal Kit Porcine Parvovirus (Ingenetix, Wien, Austria), according to the manufacturers’ instructions.

2.4. Pre-Treatment of LD

LD was cool centrifuged (4 °C) for 20 min at 3900 g with an Eppendorf 5810R (Eppendorf, Hamburg, Germany). Flocculants FeCl2 (Ferrosol 90) or FeCl3 (Ferrisol 100) or FeClSO4 (Ferrisol 123) were added into the centrifuged samples at dosages of 3.5 g/L. The mixed samples were placed on a magnetic stirrer (HJ-6A, Jintan Kexi Instrument Co., Ltd., Changzhou, China), stirred at a speed of 500 r/min for 3 min, and then stirred at a speed of 60 r/min for 20 min. After standing for 2 h, vacuum filtration using glass fiber filters was carried out, using the grades GF-3 and GF-5 (CHMLAB Group, Barcelona, Spain).

2.5. Photocatalysis Experiments

Lab scale experiments were conducted as described elsewhere [59] with minor modifications. Briefly, as shown in Figure 1A, a 1 L jacketed 5340-18 beaker (Ace Glass, Inc., Vineland, NJ, USA) with an internal diameter of 91 mm, and internal height of 175 mm, was filled with 500 mL material and was placed on the magnetic stirrer. A radiation source (OSRAM DULUX BLUE UVA 78 COLOR, 9W) was immersed using a quartz tube (35 mm diameter) in the middle of the beaker (approximately 22 mm from the bottom). Slurry reactor experiments with various concentrations of the photocatalyst in the range of 0.3–1.2 g/L were performed and the disinfection rate was defined through measurements of the irradiation density using a UVA light meter. A polypropylene cap was specially designed to hold the quartz tube in place. The cooling circulating pump was connected to the double-layer beaker to maintain a constant temperature at 25 ± 1 °C. Then, the device was placed in a dark box.
The lab scale PNFR used in this study was described in detail previously [60,61]. This reactor consisted of one coated monolith and was equipped with appropriate flow and pressure control and illumination systems (Figure 1B). The transformation of the membrane monolith to photocatalytic membrane monolith was achieved by employing a simple and scalable wash-coating technique, which was based on a previously described method, adapted to our needs, and optimized via slight modifications [62]. In brief, 30 mmol of titanium (IV) isopropoxide (TTIP) was slowly added to 0.4 L of double-distilled water, at 40 °C. Then, concentrated HNO3 (15 mmol) was added dropwise under vigorous stirring at 80 °C to catalyze the TTIP hydrolysis and obtain a transparent TiO2 colloidal solution after 16 h. Hence, the overall reaction, including the hydrolysis and condensations steps of the titanium precursor (TTIP) for TiO2 production, is summarized by the following equation:
Ti(OCH(CH3)2)4 → TiO2 + 4CH3CH2CH2OH
Once the solution was cooled down to room temperature, the commercial titania photocatalyst Evonik P25 Aeroxide (20 g) was gradually added, and the resulting suspension was stirred overnight until homogenization. Finally, the membranes’ modification was performed via the monolith immersion into the photocatalyst’s slurry for 10 min and a subsequent annealing step at 150 °C overnight, employing custom-made lab furnaces.
To investigate if the thermal treatment at 150 °C sufficed to generate an all-anatase phase TiO2 coating on the external surface and the pores of the monolith, two powdered samples were prepared from two different stages of the wash coating slurry synthesis. One was obtained by drying a fraction of the gel under the aforementioned heating conditions, before addition of the P25 particles. The other sample, most representative of the structure of the layer deposited on the monolith walls, was obtained from the thermal treatment of the slurry after addition of the P25 catalyst. Both were subjected to Raman analysis (Figure 2).
The results of Raman analysis indicated the existence of the (A1g/B1g) unresolved doublet of anatase at about 519 cm−1 and of a second anatase phase band at 400 cm−1 in all the examined samples. In this context, the drying of the hydrolyzed TTIP gel at 150 °C is enough to produce TiO2 powder of the anatase phase. The other peaks at approximately 640 cm−1, 200 cm−1 and 150 cm−1 corresponded to both the anatase and brookite phases. TiO2 Degussa (Evonik) P25 is a mixture of anatase-rutile. The Raman spectra clearly showed the presence of a shoulder at 446 cm−1 attributed to rutile phase. This was present also in the dried samples (slurry and gel) [63,64,65]

3. Results and Discussion

3.1. Characterization of LD

Table 1 presents the main LD characteristics obtained after AD of various feedstocks. The table shows that the main WD parameters can vary greatly, depending on both the type of substrate used in the anaerobic fermentation and AD process conditions. Especially, these variations are related to the input materials, which are usually classified as agri-food and livestock waste. In addition, the origin and the season of the input material could be important because, for example, the aerial deposition of heavy metals is usually higher in urban environments than in rural regions, while the deposition of heavy metals tends to peak in winter [49].

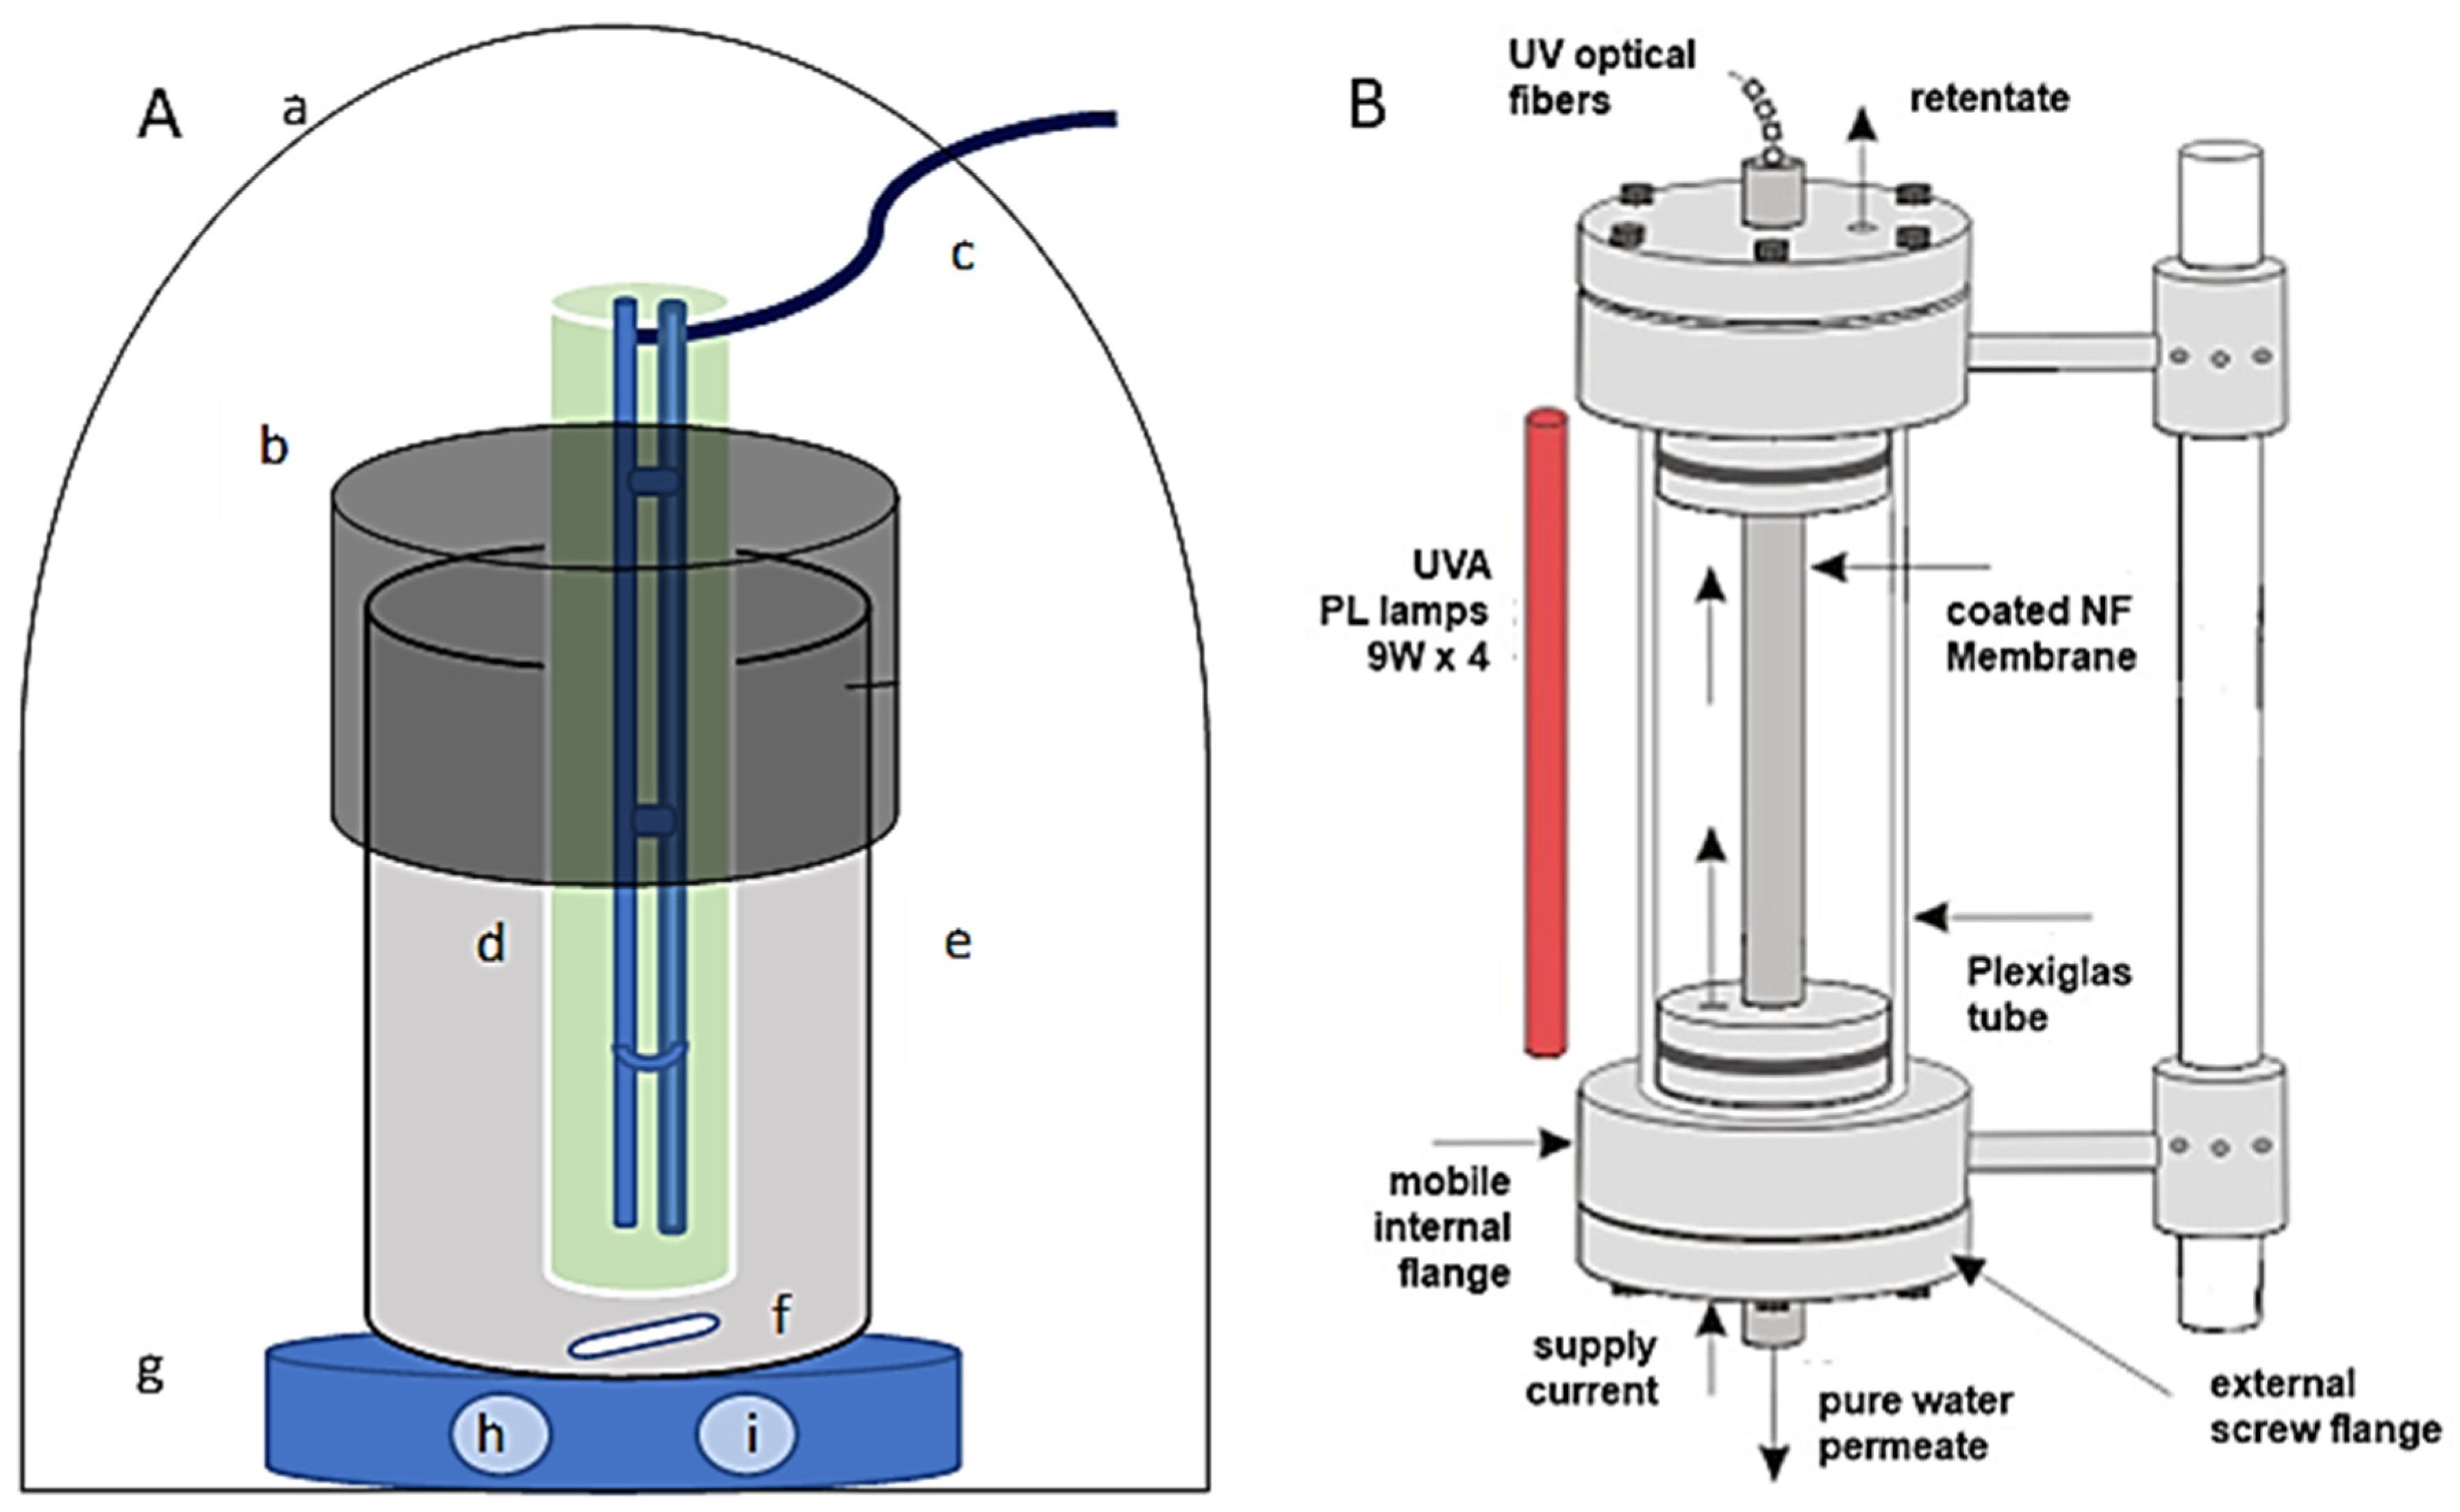
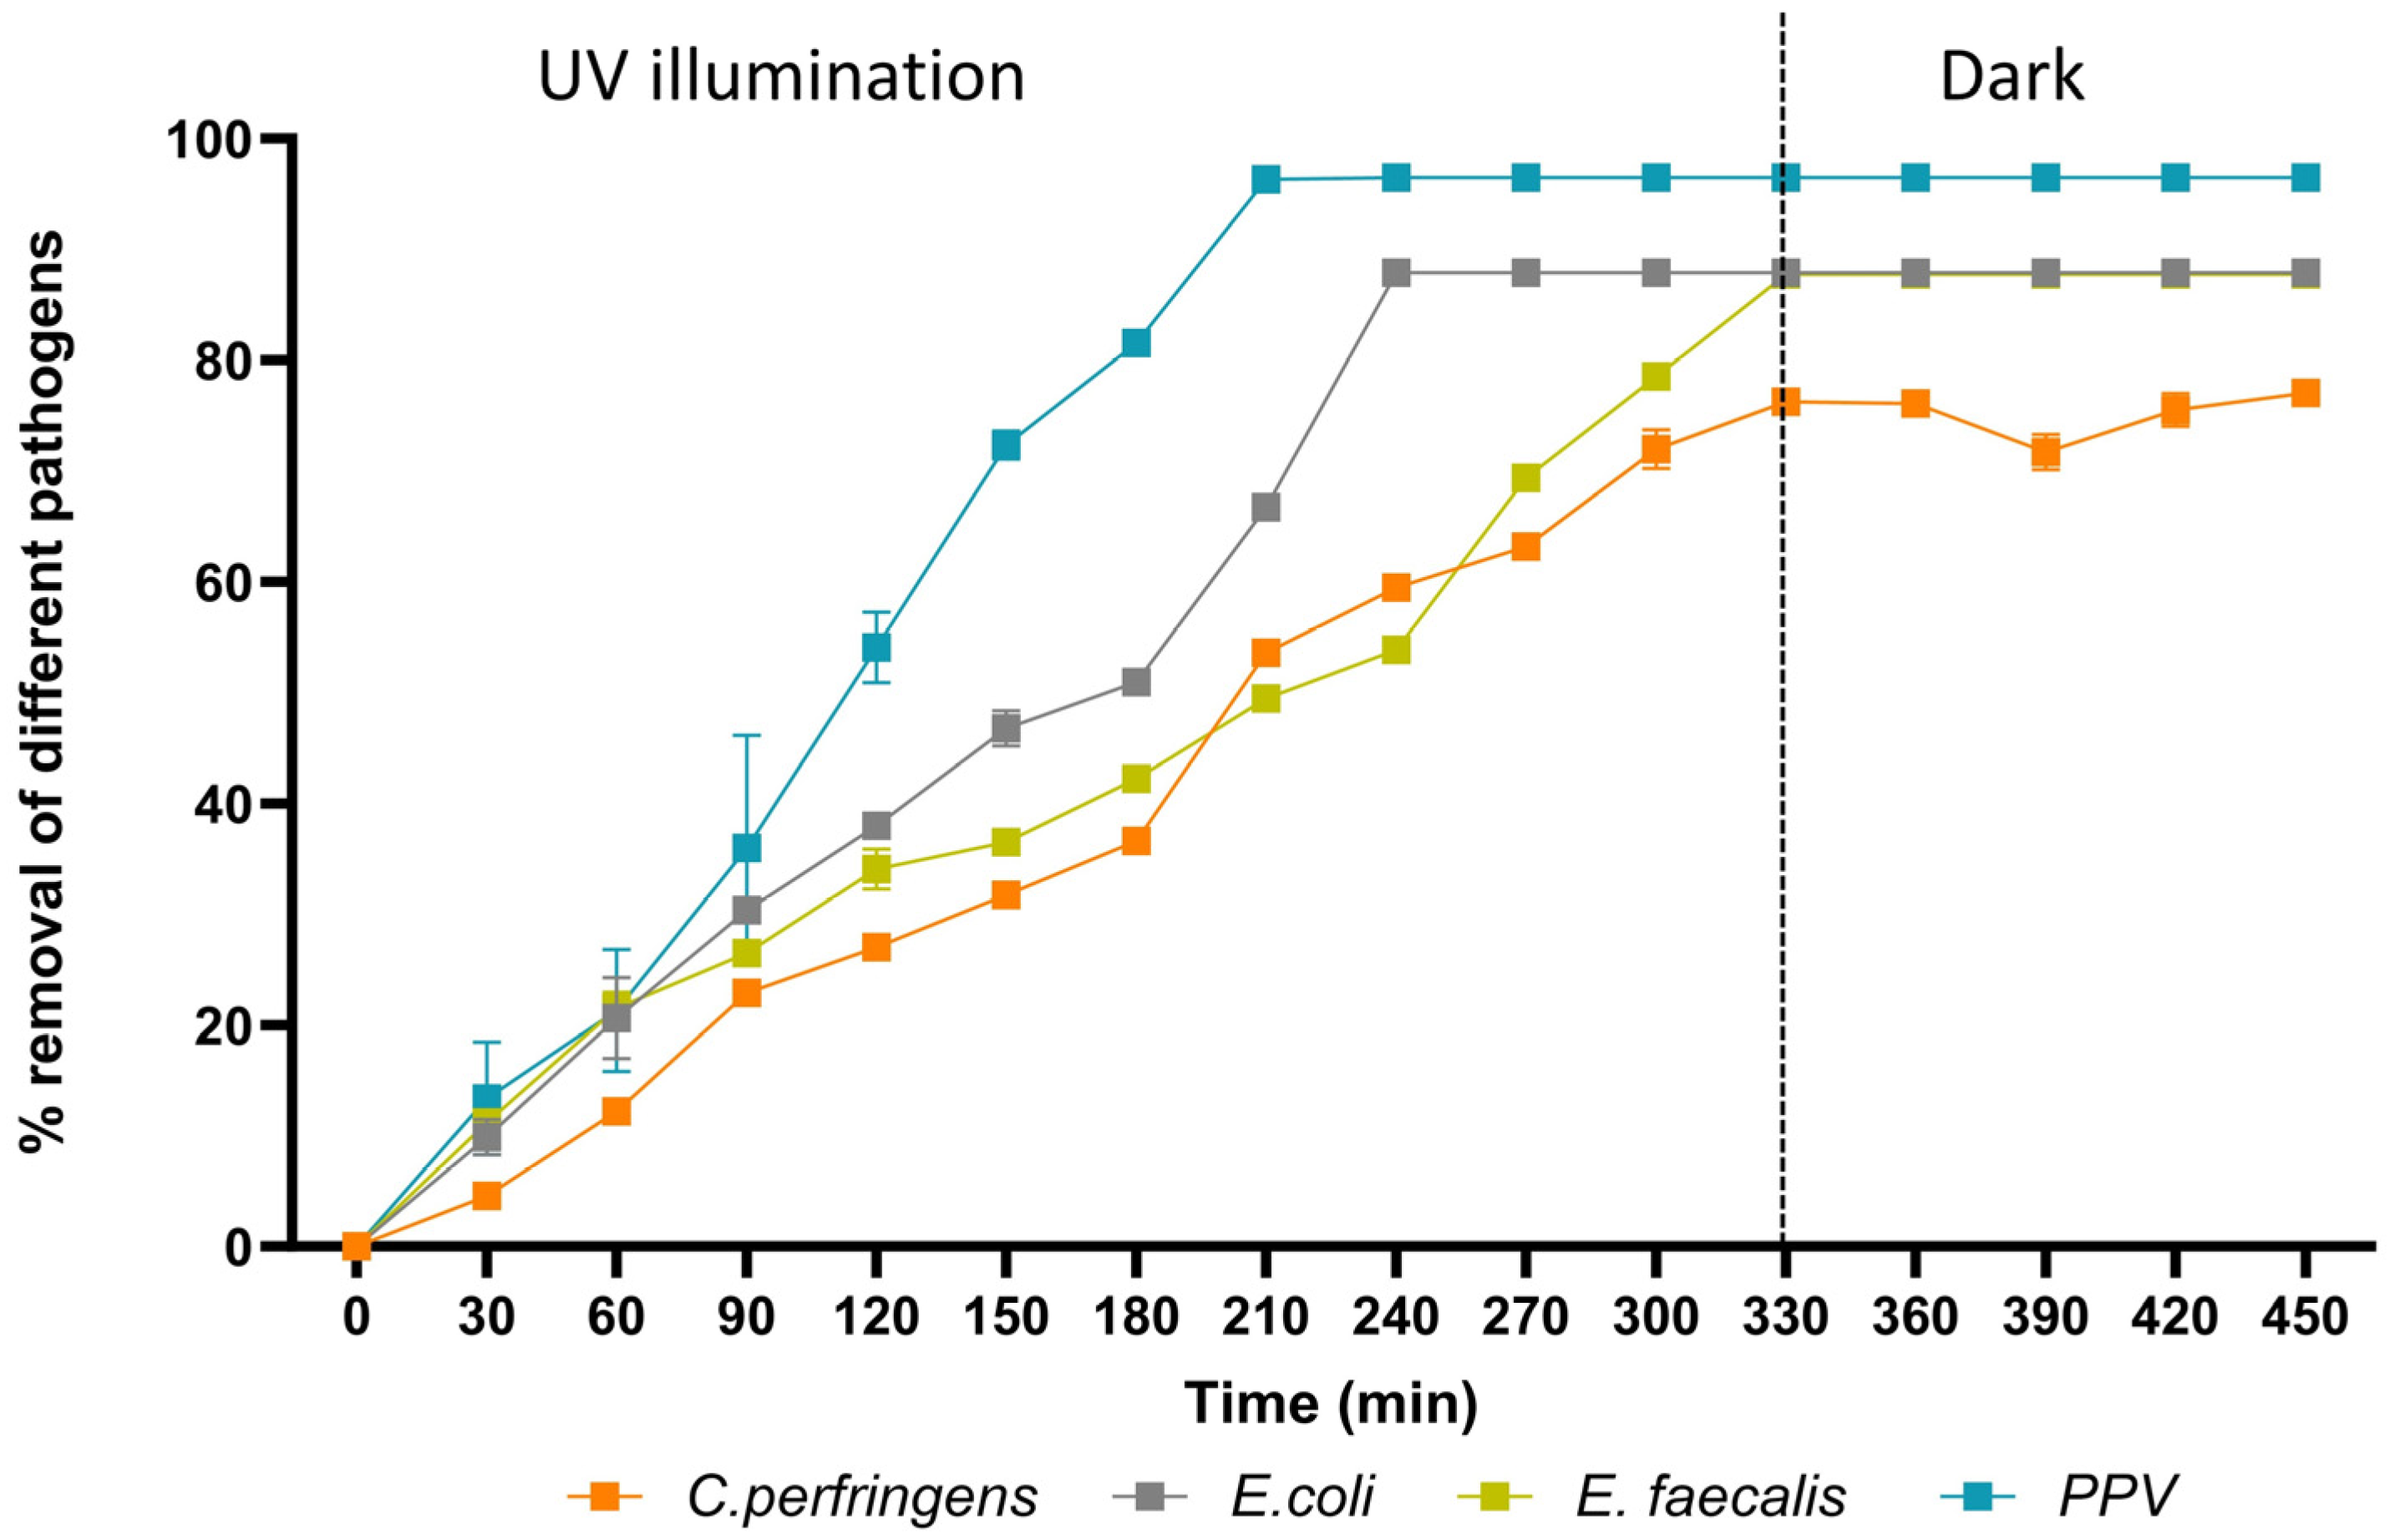
3.2. Configuration of Photocatalytic Disinfection

After confirming the effectiveness of the photocatalytic arrangements with inoculated water samples (Figure 3), we proceeded with various experiments to find out the working concentration of TiO2 and the best pre-treatment approach. To be precise, we used varying concentrations of the photocatalyst in the range of 0.3–1.2 g/L. Untreated LD was disinfected after 70 h of photocatalysis whereas 1:10 diluted WD was disinfected after approximately 30 h (data not shown). None of the above results seems to be industrially applicable. The long disinfection time is attributed to the nature of the material as the light could not be transmitted effectively. In contrast, further dilution conflicts with the purpose of the technology, which is to retrieve clean water and enhance the circular economy of the biogas operation. Thus, we engaged technologies that are industrially applicable trying to remove the excess of total solid content and make the LD translucent. Table 2 summarizes the physicochemical properties of the LD after each stage of selected pre-treatment (A–C) and the treatments (Di–Diii).
Figure 4A illustrates the disinfection rates in the pre-treated LD (see Table 2-C) that was inoculated with pure, fully developed culture of E. faecalis previously acclimatized in the material, using different TiO2 concentrations and different retention times under UVA illumination. A sample without photocatalyst added served as control. The indicator organism used for preliminary experiments was E. faecalis which was found to be a constant and persistent pathogen in digestate samples.
By increasing the dosage of TiO2, more reactive species were produced, and pathogen removal was enhanced. However, when using higher TiO2 dosages of 1 and 1.2 g/L, the disinfection rate declined, due to poor penetration of UV light attributed to reflectance and scattering phenomena caused by the high density of the slurry and the aggregation of particles. In addition, the agglomeration of particles at high dosage interferes with the homogeneous structure of the suspension and, as a result, the number of active sites on TiO2 is decreased [66]. Based on these results, for all subsequent experiments, a TiO2 concentration of 0.7 g/L was selected. During these trials, in the PNFR reactor, the irradiation density on both surfaces of the monolith was measured using a UVA light meter, with the probe placed exactly at the positions where the photocatalytic surfaces are located inside the reactor. The measurements showed a light intensity of 2.1 mW/cm2 on the shell surface of the monolith (near-UV radiation (315–380 nm) with a peak at 365 nm) and 0.5 mW/cm2 on the lumen surface of the monolith (near-UV radiation (360–420 nm) with a peak at 383–392 nm). This concentration achieved sanitation to the maximum extent that could be measured by the selected method, which was 87.8% in 5.5 h, better than others implemented (p < 0.001). It is worth noting that the removal of pathogens increased to 46.2% after 2 h, when the TiO2 concentration increased to 2.0 g/L but dropped to 18.8% at the third hour. This can be attributed to the increase in available adsorption of pathogens by TiO2 [32]. The pre-treatment dynamics on photocatalytic disinfection using 0.7 g/L TiO2 under UVA illumination is shown in Figure 4B. LD samples were used as indicated in Table 2 (A) untreated, (B) centrifuged, and (C) flocculated and μfiltrated. As expected, further pre-treatment enhances the disinfection effect.
There is a significant debate regarding the specific processes or the combination of processes responsible for the death of microorganisms when they are exposed to photocatalytic action [67]. In general, the generated reactive oxygen species (ROS), particularly hydroxyl radicals, exhibit strong oxidative power. They can attack the cellular components of pathogens, including lipids, proteins, and DNA. The ROS induce oxidative stress, leading to the destruction of the pathogens’ cell membrane, the inactivation of enzymes, and damage to genetic material. These processes disrupt the vital functions of the microorganisms and, ultimately, lead to their death or inability to replicate. The majority of the literature agrees that inactivation starts with and requires cell membrane degradation [68,69]. However, injured bacteria may be temporarily inactivated. If bacteria are not completely harmed, they may enter a state where they are still viable but unable to grow in culture, and they can regain their ability to grow under more favorable conditions in the absence of light [70,71]. To assess the impact of photocatalysis on common digestate pathogens, we conducted viability measurements of the pathogens after a 2 h period in darkness to ensure the absence of regrowth and to verify the efficacy of our system in achieving a sanitized material (Figure 5).
Clostridium perfringens, a spore-forming bacterium, was found to be more resistant to photocatalysis compared to the others examined. Porcine parvovirus (PPV) was found more susceptible to the process compared to others, followed by E. coli and E. faecalis. The qualitative results of Salmonella spp. and L. monocytogenes showed the absence of these pathogens after 5.5 h (data not shown). Listeria monocytogenes is generally considered more resistant to photocatalysis compared to other bacteria, due to its ability to survive in harsh environmental conditions and its capacity to form biofilms [72]. All experiments were conducted under a stable temperature of 25 ± 1 °C using a cooling system and temperature monitoring. Further evaluation of additional pathogens, such as Clostridium botulinum, Clostridium tetani, Clostridioides difficile, Bacillus anthracis, and Bacillus cereus, is needed. These microorganisms are frequently encountered in manure and are able to sporulate, exhibiting remarkable resilience, as they are resistant to a range of physical, chemical, and biological treatment methods [73].

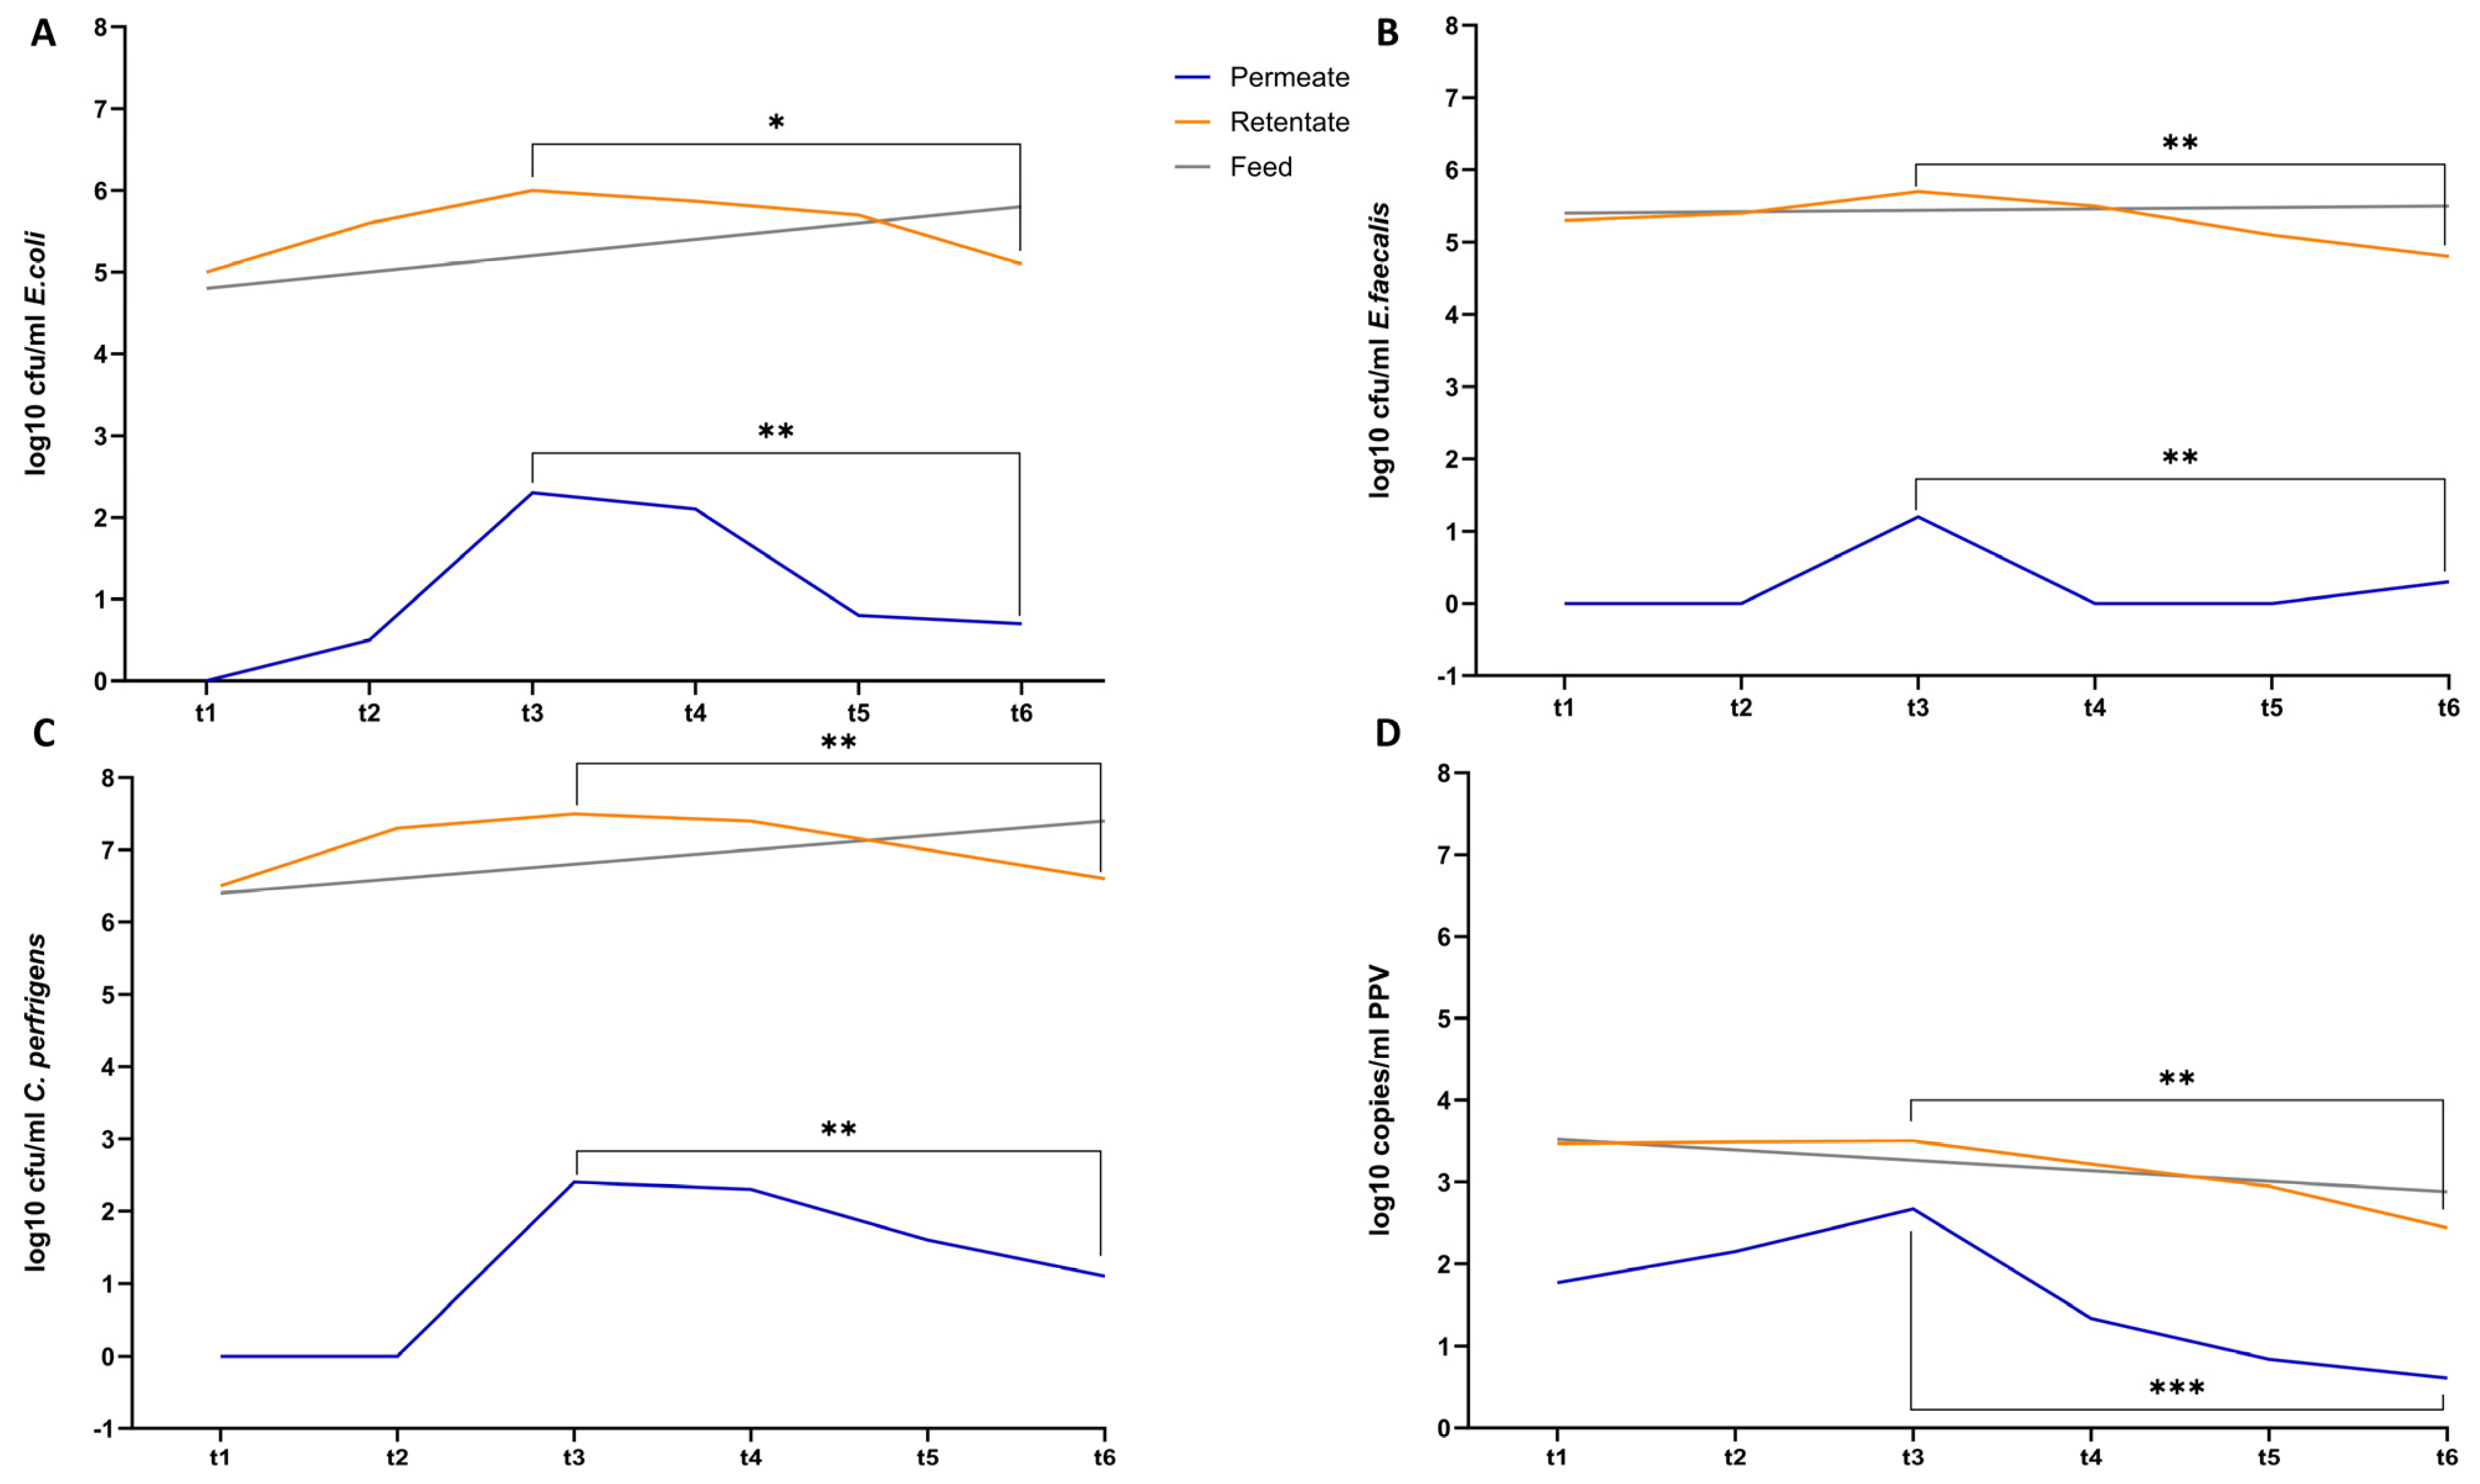
3.3. PNFR Implementation

Inoculated pre-treated LD with acclimatized, full-grown cultures of pathogens were passed through PNFR (Figure 6). In order to execute the experimental procedure, a continuous operation for a duration of 8 h was required. The laboratory reactor was subjected to an influx of 600 mL of feed over a time period of 40 min, followed by the generation of approximately 40 mL of filtrate within 30 min, while being exposed to pressure conditions of 8 bar. The time intervals labeled as t1–t3 correspond to experimental conditions conducted in the absence of light, using the coated nanofiltration monolith. The observed reductions in microbial populations during these intervals can be attributed to the adsorption of microbes onto the membrane and nanofiltration mechanisms based on membrane porosity. The retentate line represents the concentrated fraction that did not pass through the membrane, while the permeate line represents the filtered fraction. In contrast, intervals t4–t6 represent the results obtained when photocatalysis was employed, where the reactor operated under UV irradiation. It can be observed that, starting from interval t4, there was a decrease in microbial load, as well as in the concentrated fraction. This outcome verifies the effectiveness of the photocatalytic reactor as an environmentally friendly solution for waste treatment.
According to Hellenic Joint Ministerial Decision 145116/02-02-2011 (Official Government Gazette B 354/2011) (19), the final effluent met the criteria for pathogen decontamination and total nitrogen and phosphorus limits. However, the turbidity of the effluent, as indicated in Table 2 (Diii), exceeded the limits of the regulation and failed to meet global water quality standards. Nevertheless, PNFR should be further optimized to treat LD, as we observed leakage phenomena attributed to chemical interactions with the membrane material and possibly to the existence of defects on the nanofiltration layer. Mitigating or preventing membrane leakage is a significant concern in membrane-based technologies, and efforts are being made to optimize membrane materials, design, and operating conditions to minimize or eliminate unintended substance transport across the membrane.
It is important to note that the synergistic action of photocatalysis during nanofiltration alleviates the aforementioned leakage phenomena and both the retentate and permeate effluents become less concentrated in pathogens. This comes as a result of the existence of photocatalytic surfaces on the shell (feed side) and lumen (permeate side) sides of the nanofiltration membrane. The lumen photocatalytic layer, in particular, is responsible for the effective disinfection of the permeate effluent since the pathogens passing through the defects of the nanofiltration monolith are further subjected to photocatalytic degradation during the slippage of the permeate water layer on the lumen photocatalytic surface of the monolith.
It is noteworthy that the need to irradiate both surfaces of the membrane with UV radiation adds an additional energetic cost to the overall process. Hence, compared to a conventional nanofiltration process, where the main energy consumption results from conveying the feed water to the membrane module at pressures up to 10 bar, there is an additional cost of powering up the UV sources and LEDs, of approximately +50%. However, the resulting benefits counterbalance this additional energy cost and in addition, there are many opportunities for further mitigation of the energy expense during the scale-up of the PNFR. For instance, a smart design of the PNFR’s internals, especially regarding the relative position of the monoliths and UV sources, can significantly reduce the number of UV lamps required to achieve effective irradiation of the photocatalytic surfaces. Moreover, with the emergence of vis-light active photocatalysts and the rapid enhancement of their performance, there is the possibility of eliminating the need for artificial light sources, exploiting solar light to remotely irradiate the PNFR’s internal photocatalytic surfaces. Apart from the benefits related to performance, benefits also arise in relation to the lifetime of the membranes and the frequency of cleaning. The time intervals for cleaning with alkaline/chlorine solutions are expected to expand owing to the photocatalytic action on the shell surface of the membranes that inhibits the deposition of organic foulants and pathogens. Therefore, the period until the occurrence of irreversible fouling which demands the membranes’ replacement is also expected to expand significantly.

4. Conclusions

The primary objectives of WD treatment encompass two key aspects: (i) the reduction in volume to enhance manageability and lower transportation costs, and (ii) the extraction of nutrients in a concentrated form. In general, WD treatment methods can be categorized into two distinct approaches: (a) partial treatment, which focuses on reducing the volume or segregating it into solid and liquid components that are easier to handle or store. This step is typically undertaken as the initial phase of WD treatment, and it demands less energy and is comparatively more cost-effective than (b) complete purification. In the case of complete purification, valuable constituents are isolated and concentrated, while the remaining liquid fraction is purified to enable reuse in the AD process or direct discharge into a water body. In this research endeavor, our objective was to achieve the retention of pure water from liquid digestate, while simultaneously ensuring effective disinfection of the remaining material using photocatalysis. Though the utilization of suspensions exhibits efficacy at the laboratory scale, its industrial application is not feasible. Prior treatment of the material to eliminate solid content is essential, and a minimum duration of 5 h is required for efficient disinfection. Furthermore, it is crucial to ascertain the optimal concentration to prevent any adverse impact on light transmission within the solution. The results obtained from the inactivation tests with TiO2 suspensions conducted on pre-treated and inoculated liquid digestate demonstrated a significant 5 log reduction in common pathogens within the initial 5 h period, with no regrowth of pathogens observed.
To explore a possible industrial application for this purpose, additional experimentation was carried out using a patented photocatalytic nanofiltration reactor. The anticipated outcome was the reduction in the microbial load in the filtrate fraction of the photocatalytic reactor, as the modified nanofiltration monolith alone, without the application of photocatalysis, is theoretically adequate for pathogen removal. A noteworthy finding from the experiments conducted in the photocatalytic reactor was the reduction in the microbial load in the concentrate fraction, an outcome not observed in the absence of photocatalysis. This particular innovation of the photocatalytic reactor allows the extraction of two purified fractions instead of the conventional membrane waste treatment protocols that yield only a single purified fraction. Nevertheless, further research is needed for the optimization of the photocatalytic nanofiltration membranes for liquid digestate purification.

Author Contributions

Conceptualization, T.S., P.F., G.E.R. and A.G.C.; methodology, P.F., G.E.R., T.S. and A.G.C.; software, A.G.C.; validation, T.S., A.G.C.; formal analysis, A.G.C.; investigation, A.G.C., E.K., V.T.; resources, T.S.; data curation, A.G.C., T.S. and E.K.; writing—original draft preparation, A.G.C. and G.S.; writing—review and editing, A.G.C., T.S., G.E.R., V.T., E.K. and P.F.; visualization, A.G.C.; supervision, T.S., G.E.R. and P.F.; project administration, T.S.; funding acquisition, T.S. All authors have read and agreed to the published version of the manuscript.

Funding

This research was co-funded by the European Regional Development Fund of the European Union and Greek national funds through the Operational Program Competitiveness, Entrepreneurship, and Innovation, under the call RESEARCH-CREATE-INNOVATE (project code: T2EDK-04043).

Institutional Review Board Statement

Not applicable.

Informed Consent Statement

Not applicable.

Data Availability Statement

The data presented in this study are available, upon request, from the corresponding author.

Acknowledgments

The authors wish to acknowledge Biogas Lagada S.A. and Bioenergy Nigrita S.A., that provided the liquid digestate to be used for experimentations. The authors also wish to acknowledge all staff members of Qlab P.C. for their individual roles that contributed to the implementation of this study; thank you, Eleni Anna Economou, Ioanna Dalla, Nikoleta Prokopidou, Anastasia Manavi, Georgia Dimitropoulou, Ifigeneia Grigoriadou, Ioanna Christoforidou and Panagiotis Pantazis.

Conflicts of Interest

The authors declare that they have no known competing financial interests or personal relationships that could have appeared to influence the work reported in this paper.

References

  1. Saravanan, A.; Kumar, P.S.; Nhung, T.C.; Ramesh, B.; Srinivasan, S.; Rangasamy, G. A review on biological methodologies in municipal solid waste management and landfilling: Resource and energy recovery. Chemosphere 2022, 309, 136630. [Google Scholar] [CrossRef] [PubMed]
  2. Pasalari, H.; Gholami, M.; Rezaee, A.; Esrafili, A.; Farzadkia, M. Perspectives on microbial community in anaerobic digestion with emphasis on environmental parameters: A systematic review. Chemosphere 2021, 270, 128618. [Google Scholar] [CrossRef]
  3. Uzinger, N.; Szecsy, O.; Szucs-Vasarhelyi, N.; Padra, I.; Sandor, D.B.; Loncaric, Z.; Draskovits, E.; Rekasi, M. Short-Term Decomposition and Nutrient-Supplying Ability of Sewage Sludge Digestate, Digestate Compost, and Vermicompost on Acidic Sandy and Calcareous Loamy Soils. Agronomy 2021, 11, 2249. [Google Scholar] [CrossRef]
  4. Kovacic, D.; Loncaric, Z.; Jovic, J.; Samac, D.; Popovic, B.; Tisma, M. Digestate Management and Processing Practices: A Review. Appl. Sci. 2022, 12, 9216. [Google Scholar] [CrossRef]
  5. Peng, W.; Lu, F.; Hao, L.P.; Zhang, H.; Shao, L.M.; He, P.J. Digestate management for high-solid anaerobic digestion of organic wastes: A review. Bioresour. Technol. 2020, 297, 122485. [Google Scholar] [CrossRef]
  6. Hutchison, M.L.; Walters, L.D.; Avery, S.M.; Synge, B.A.; Moore, A. Levels of zoonotic agents in British livestock manures. Lett. Appl. Microbiol. 2004, 39, 207–214. [Google Scholar] [CrossRef]
  7. Johansson, M.; Emmoth, E.; Salomonsson, A.C.; Albihn, A. Potential risks when spreading anaerobic digestion residues on grass silage crops—Survival of bacteria, moulds and viruses. Grass Forage Sci. 2005, 60, 175–185. [Google Scholar] [CrossRef]
  8. Goberna, M.; Podmirseg, S.M.; Waldhuber, S.; Knapp, B.A.; Garcia, C.; Insam, H. Pathogenic bacteria and mineral N in soils following the land spreading of biogas digestates and fresh manure. Appl. Soil Ecol. 2011, 49, 18–25. [Google Scholar] [CrossRef]
  9. Smith, S.R.; Lang, N.L.; Cheung, K.H.M.; Spanoudaki, K. Factors controlling pathogen destruction during anaerobic digestion of biowastes. Waste Manag. 2005, 25, 417–425. [Google Scholar] [CrossRef]
  10. Sfetsas, T.; Patsatzis, S.; Chioti, A.; Kopteropoulos, A.; Dimitropoulou, G.; Tsioni, V.; Kotsopoulos, T. A review of advances in valorization and post-treatment of anaerobic digestion liquid fraction effluent. Waste Manag. Res. 2022, 40, 1093–1109. [Google Scholar] [CrossRef]
  11. Erickson, M.C.; Ortega, Y.R. Inactivation of protozoan parasites in food, water, and environmental systems. J. Food Prot. 2006, 69, 2786–2808. [Google Scholar] [CrossRef] [PubMed]
  12. Liu, X.J.; Lendormi, T.; Lanoiselle, J.L. Conventional and Innovative Hygienization of Feedstock for Biogas Production: Resistance of Indicator Bacteria to Thermal Pasteurization, Pulsed Electric Field Treatment, and Anaerobic Digestion. Energies 2021, 14, 1938. [Google Scholar] [CrossRef]
  13. Seruga, P.; Krzywonos, M.; Paluszak, Z.; Urbanowska, A.; Pawlak-Kruczek, H.; Niedzwiecki, L.; Pinkowska, H. Pathogen Reduction Potential in Anaerobic Digestion of Organic Fraction of Municipal Solid Waste and Food Waste. Molecules 2020, 25, 275. [Google Scholar] [CrossRef] [Green Version]
  14. Liu, X.J.; Lendormi, T.; Lanoiselle, J.L. Overview of hygienization pretreatment for pasteurization and methane potential enhancement of biowaste: Challenges, state of the art and alternative technologies. J. Clean. Prod. 2019, 236, 117525. [Google Scholar] [CrossRef]
  15. Froschle, B.; Heiermann, M.; Lebuhn, M.; Messelhausser, U.; Plochl, M. Hygiene and Sanitation in Biogas Plants. In Biogas Science and Technology; Guebitz, G.M., Bauer, A., Bochmann, G., Gronauer, A., Weiss, S., Eds.; (Advances in Biochemical Engineering-Biotechnology); Springer: Berlin/Heidelberg, Germany, 2015; Volume 151, pp. 63–99. [Google Scholar]
  16. Golovko, O.; Ahrens, L.; Schelin, J.; Sorengard, M.; Bergstrand, K.J.; Asp, H.; Hultberg, M.; Wiberg, K. Organic micropollutants, heavy metals and pathogens in anaerobic digestate based on food waste. J. Environ. Manag. 2022, 313, 114997. [Google Scholar] [CrossRef] [PubMed]
  17. Lin, M.; Wang, A.J.; Ren, L.J.; Qiao, W.; Wandera, S.M.; Dong, R.J. Challenges of pathogen inactivation in animal manure through anaerobic digestion: A short review. Bioengineered 2022, 13, 1149–1161. [Google Scholar] [CrossRef]
  18. Bagge, E.; Persson, M.; Johansson, K.E. Diversity of spore-forming bacteria in cattle manure, slaughterhouse waste and samples from biogas plants. J. Appl. Microbiol. 2010, 109, 1549–1565. [Google Scholar] [CrossRef]
  19. Le Marechal, C.; Druilhe, C.; Reperant, E.; Boscher, E.; Rouxel, S.; Le Roux, S.; Poezevara, T.; Ziebal, C.; Houdayer, C.; Nagard, B.; et al. Evaluation of the occurrence of sporulating and nonsporulating pathogenic bacteria in manure and in digestate of five agricultural biogas plants. Microbiologyopen 2019, 8, e872. [Google Scholar] [CrossRef] [Green Version]
  20. Pulvirenti, A.; Ronga, D.; Zaghi, M.; Tomasselli, A.R.; Mannella, L.; Pecchioni, N. Pelleting is a successful method to eliminate the presence of Clostridium spp. from the digestate of biogas plants. Biomass Bioenergy 2015, 81, 479–482. [Google Scholar] [CrossRef]
  21. Galedari, M.; Ghazi, M.M.; Mirmasoomi, S.R. Photocatalytic process for the tetracycline removal under visible light: Presenting a degradation model and optimization using response surface methodology (RSM). Chem. Eng. Res. Des. 2019, 145, 323–333. [Google Scholar] [CrossRef]
  22. Al-Hamdi, A.M.; Rinner, U.; Sillanpaa, M. Tin dioxide as a photocatalyst for water treatment: A review. Process Saf. Environ. Prot. 2017, 107, 190–205. [Google Scholar] [CrossRef]
  23. Rivera-Utrilla, J.; Sanchez-Polo, M.; Ferro-Garcia, M.A.; Prados-Joya, G.; Ocampo-Perez, R. Pharmaceuticals as emerging contaminants and their removal from water. A review. Chemosphere 2013, 93, 1268–1287. [Google Scholar] [CrossRef]
  24. Rimoldi, L.; Meroni, D.; Cappelletti, G.; Ardizzone, S. Green and low cost tetracycline degradation processes by nanometric and immobilized TiO2 systems. Catal. Today 2017, 281, 38–44. [Google Scholar] [CrossRef]
  25. Liu, Y.Q.; He, X.X.; Duan, X.D.; Fu, Y.S.; Fatta-Kassinos, D.; Dionysiou, D.D. Significant role of UV and carbonate radical on the degradation of oxytetracycline in UV-AOPs: Kinetics and mechanism. Water Res. 2016, 95, 195–204. [Google Scholar] [CrossRef]
  26. M’Arimi, M.M.; Mecha, C.A.; Kiprop, A.K.; Ramkat, R. Recent trends in applications of advanced oxidation processes (AOPs) in bioenergy production: Review. Renew. Sustain. Energy Rev. 2020, 121, 109669. [Google Scholar] [CrossRef]
  27. Wu, S.Q.; Hu, H.Y.; Lin, Y.; Zhang, J.L.; Hu, Y.H. Visible light photocatalytic degradation of tetracycline over TiO2. Chem. Eng. J. 2020, 382, 122842. [Google Scholar] [CrossRef]
  28. Wang, H.; Wang, H.L.; Jiang, W.F. Solar photocatalytic degradation of 2,6-dinitro-p-cresol (DNPC) using multi-walled carbon nanotubes (MWCNTs)-TiO2 composite photocatalysts. Chemosphere 2009, 75, 1105–1111. [Google Scholar] [CrossRef] [PubMed]
  29. Wang, P.P.; Yuan, Q.X. Photocatalytic degradation of tetracyclines in liquid digestate: Optimization, kinetics and correlation studies. Chem. Eng. J. 2021, 410, 128327. [Google Scholar] [CrossRef]
  30. Wang, P.P.; Xu, C.; Zhang, X.; Yuan, Q.X.; Shan, S.D. Effect of photocatalysis on the physicochemical properties of liquid digestate. Environ. Res. 2023, 223, 115467. [Google Scholar] [CrossRef] [PubMed]
  31. Yin, F.B.; Lin, S.Y.; Zhou, X.Q.; Dong, H.M.; Zhan, Y.H. Fate of antibiotics during membrane separation followed by physical-chemical treatment processes. Sci. Total Environ. 2021, 759, 143520. [Google Scholar] [CrossRef]
  32. Jin, X.D.; Zhou, X.Q.; Sun, P.; Lin, S.Y.; Cao, W.B.; Li, Z.F.; Liu, W.X. Photocatalytic degradation of norfloxacin using N-doped TiO2: Optimization, mechanism, identification of intermediates and toxicity evaluation. Chemosphere 2019, 237, 124433. [Google Scholar] [CrossRef]
  33. Hu, X.; Hu, X.J.; Peng, Q.Q.; Zhou, L.; Tan, X.F.; Jiang, L.H.; Tang, C.F.; Wang, H.; Liu, S.H.; Wang, Y.Q.; et al. Mechanisms underlying the photocatalytic degradation pathway of ciprofloxacin with heterogeneous TiO2. Chem. Eng. J. 2020, 380, 122366. [Google Scholar] [CrossRef]
  34. Huang, J.X.; Li, D.G.; Li, R.B.; Chen, P.; Zhang, Q.X.; Liu, H.J.; Lv, W.Y.; Liu, G.G.; Feng, Y.P. One-step synthesis of phosphorus/oxygen co-doped g-C3N4/anatase TiO2 Z-scheme photocatalyst for significantly enhanced visible-light photocatalysis degradation of enrofloxacin. J. Hazard. Mater. 2020, 386, 121634. [Google Scholar] [CrossRef] [PubMed]
  35. Espindola, J.C.; Cristovao, R.O.; Mendes, A.; Boaventura, R.A.R.; Vilar, V.J.P. Photocatalytic membrane reactor performance towards oxytetracycline removal from synthetic and real matrices: Suspended vs. immobilized TiO2-P25. Chem. Eng. J. 2019, 378, 122114. [Google Scholar] [CrossRef]
  36. Devi, M.; Praharaj, S.; Rout, D. 20—Industrial problems and solution towards visible light photocatalysis. In Nanostructured Materials for Visible Light Photocatalysis; Nayak, A.K., Sahu, N.K., Eds.; Elsevier: Amsterdam, The Netherlands, 2022; pp. 535–567. [Google Scholar]
  37. He, J.H.; Kumar, A.; Khan, M.; Lo, I.M.C. Critical review of photocatalytic disinfection of bacteria: From noble metals-and carbon nanomaterials-TiO2 composites to challenges of water characteristics and strategic solutions. Sci. Total Environ. 2021, 758, 143953. [Google Scholar] [CrossRef]
  38. Lofrano, G.; Ubaldi, F.; Albarano, L.; Carotenuto, M.; Vaiano, V.; Valeriani, F.; Libralato, G.; Gianfranceschi, G.; Fratoddi, I.; Meric, S.; et al. Antimicrobial Effectiveness of Innovative Photocatalysts: A Review. Nanomaterials 2022, 12, 2831. [Google Scholar] [CrossRef]
  39. Alrousan, D.M.A.; Dunlop, P.S.M.; McMurray, T.A.; Byrne, J.A. Photocatalytic inactivation of E. coli in surface water using immobilised nanoparticle TiO2 films. Water Res. 2009, 43, 47–54. [Google Scholar] [CrossRef] [PubMed]
  40. Fernandes, F.; Silkina, A.; Fuentes-Grunewald, C.; Wood, E.E.; Ndovela, V.L.S.; Oatley-Radcliffe, D.L.; Lovitt, R.W.; Llewellyn, C.A. Valorising nutrient-rich digestate: Dilution, settlement and membrane filtration processing for optimisation as a waste-based media for microalgal cultivation. Waste Manag. 2020, 118, 197–208. [Google Scholar] [CrossRef] [PubMed]
  41. Camilleri-Rumbau, M.S.; Soler-Cabezas, J.L.; Christensen, K.V.; Norddahl, B.; Mendoza-Roca, J.A.; Vincent-Vela, M.C. Application of aquaporin-based forward osmosis membranes for processing of digestate liquid fractions. Chem. Eng. J. 2019, 371, 583–592. [Google Scholar] [CrossRef]
  42. Camilleri-Rumbau, M.S.; Norddahl, B.; Wei, J.; Christensen, K.V.; Sotoft, L.F. Microfiltration and ultrafiltration as a post-treatment of biogas plant digestates for producing concentrated fertilizers. Desalination Water Treat. 2015, 55, 1639–1653. [Google Scholar] [CrossRef]
  43. Swiatczak, P.; Cydzik-Kwiatkowska, A.; Zielinska, M. Treatment of Liquid Phase of Digestate from Agricultural Biogas Plant in a System with Aerobic Granules and Ultrafiltration. Water 2019, 11, 104. [Google Scholar] [CrossRef] [Green Version]
  44. Yue, C.D.; Dong, H.M.; Chen, Y.X.; Shang, B.; Wang, Y.; Wang, S.L.; Zhu, Z.P. Direct Purification of Digestate Using Ultrafiltration Membranes: Influence of Pore Size on Filtration Behavior and Fouling Characteristics. Membranes 2021, 11, 179. [Google Scholar] [CrossRef]
  45. Adam, G.; Mottet, A.; Lemaigre, S.; Tsachidou, B.; Trouve, E.; Delfosse, P. Fractionation of anaerobic digestates by dynamic nanofiltration and reverse osmosis: An industrial pilot case evaluation for nutrient recovery. J. Environ. Chem. Eng. 2018, 6, 6723–6732. [Google Scholar] [CrossRef]
  46. Zhan, Y.H.; Yin, F.B.; Yue, C.D.; Zhu, J.; Zhu, Z.P.; Zou, M.Y.; Dong, H.M. Effect of Pretreatment on Hydraulic Performance of the Integrated Membrane Process for Concentrating Nutrient in Biogas Digestate from Swine Manure. Membranes 2020, 10, 249. [Google Scholar] [CrossRef] [PubMed]
  47. Oller, I.; Malato, S.; Sanchez-Perez, J.A. Combination of Advanced Oxidation Processes and biological treatments for wastewater decontamination-A review. Sci. Total Environ. 2011, 409, 4141–4166. [Google Scholar] [CrossRef] [PubMed]
  48. Falaras, P.; Romanos, G.; Aloupogiannis, P. Photocatalytic purification device. Application number EP10275076.7, 26 January 2012. [Google Scholar]
  49. Pelaez, M.; Nolan, N.T.; Pillai, S.C.; Seery, M.K.; Falaras, P.; Kontos, A.G.; Dunlop, P.S.M.; Hamilton, J.W.J.; Byrne, J.A.; O’Shea, K.; et al. A review on the visible light active titanium dioxide photocatalysts for environmental applications. Appl. Catal. B-Environ. 2012, 125, 331–349. [Google Scholar] [CrossRef] [Green Version]
  50. Athanasekou, C.P.; Romanos, G.E.; Katsaros, F.K.; Kordatos, K.; Likodimos, V.; Falaras, P. Very efficient composite titania membranes in hybrid ultrafiltration/photocatalysis water treatment processes. J. Membr. Sci. 2012, 392, 192–203. [Google Scholar] [CrossRef]
  51. Theodorakopoulos, G.V.; Arfanis, M.K.; Perez, J.A.S.; Aguera, A.; Aponte, F.X.C.; Markellou, E.; Romanos, G.E.; Falaras, P. Novel Pilot-Scale Photocatalytic Nanofiltration Reactor for Agricultural Wastewater Treatment. Membranes 2023, 13, 202. [Google Scholar] [CrossRef] [PubMed]
  52. 2540 SOLIDS. In Standard Methods for the Examination of Water and Wastewater; American Public Health Association: Washington, DC, USA, 2017.
  53. 5220 CHEMICAL OXYGEN DEMAND (COD). In Standard Methods for the Examination of Water and Wastewater; American Public Health Association: Washington, DC, USA, 2017.
  54. 4500-H+ pH. In Standard Methods for the Examination of Water and Wastewater; American Public Health Association: Washington, DC, USA, 2017.
  55. 4500-NO3 NITROGEN (NITRATE). In Standard Methods for the Examination of Water and Wastewater; American Public Health Association: Washington, DC, USA, 2017.
  56. 4500-NH3 NITROGEN (AMMONIA). In Standard Methods for the Examination of Water and Wastewater; American Public Health Association: Washington, DC, USA, 2017.
  57. British Standards Institution. BS ISO 17294-1. Water Quality. Application of Inductively Coupled Plasma Mass Spectrometry (ICP-MS); British Standards Institution: London, UK, 2022. [Google Scholar]
  58. Rice, E.W.; Baird, R.B. Methods for the Examination of Water and Wastewater. Am. Public Heal. Assoc. Am. Water Work. 2017, 23, 3–48. [Google Scholar]
  59. Bojinova, A.; Kralchevska, R.; Poulios, I.; Dushkin, C. Anatase/rutile TiO2 composites: Influence of the mixing ratio on the photocatalytic degradation of Malachite Green and Orange II in slurry. Mater. Chem. Phys. 2007, 106, 187–192. [Google Scholar] [CrossRef]
  60. Moustakas, N.G.; Katsaros, F.K.; Kontos, A.G.; Romanos, G.E.; Dionysiou, D.D.; Falaras, P. Visible light active TiO2 photocatalytic filtration membranes with improved permeability and low energy consumption. Catal. Today 2014, 224, 56–69. [Google Scholar] [CrossRef]
  61. Papageorgiou, S.K.; Katsaros, F.K.; Favvas, E.P.; Romanos, G.E.; Athanasekou, C.P.; Beltsios, K.G.; Tzialla, O.I.; Falaras, P. Alginate fibers as photocatalyst immobilizing agents applied in hybrid photocatalytic/ultrafiltration water treatment processes. Water Res. 2012, 46, 1858–1872. [Google Scholar] [CrossRef]
  62. Du, P.; Cameiro, J.T.; Moulijn, J.A.; Mul, G. A novel photocatalytic monolith reactor for multiphase heterogeneous photocatalysis. Appl. Catal. Gen. 2008, 334, 119–128. [Google Scholar] [CrossRef]
  63. Pelaez, M.; Falaras, P.; Kontos, A.G.; de la Cruz, A.A.; O’Shea, K.; Dunlop, P.S.M.; Byrne, J.A.; Dionysiou, D.D. A comparative study on the removal of cylindrospermopsin and microcystins from water with NF-TiO2-P25 composite films with visible and UV-vis light photocatalytic activity. Appl. Catal. B-Environ. 2012, 121, 30–39. [Google Scholar] [CrossRef]
  64. Hardcastle, F.D. Raman Spectroscopy of Titania (TiO2) Nanotubular Water-Splitting Catalysts. J. Ark. Acad. Sci. 2011, 65, 43–48. [Google Scholar] [CrossRef]
  65. Likodimos, V.; Chrysi, A.; Calamiotou, M.; Fernandez-Rodriguez, C.; Dona-Rodriguez, J.M.; Dionysiou, D.D.; Falaras, P. Microstructure and charge trapping assessment in highly reactive mixed phase TiO2 photocatalysts. Appl. Catal. B-Environ. 2016, 192, 242–252. [Google Scholar] [CrossRef]
  66. Bagge, E.; Sahlstrom, L.; Albihn, A. The effect of hygienic treatment on the microbial flora of biowaste at biogas plants. Water Res. 2005, 39, 4879–4886. [Google Scholar] [CrossRef]
  67. Mecha, A.C.; Onyango, M.S.; Ochieng, A.; Momba, M.N.B. UV and solar photocatalytic disinfection of municipal wastewater: Inactivation, reactivation and regrowth of bacterial pathogens. Int. J. Environ. Sci. Technol. 2019, 16, 3687–3696. [Google Scholar] [CrossRef]
  68. Wang, W.; Huang, G.; Yu, J.C.; Wong, P.K. Advances in photocatalytic disinfection of bacteria: Development of photocatalysts and mechanisms. J. Environ. Sci. 2015, 34, 232–247. [Google Scholar] [CrossRef]
  69. Reddy, P.V.L.; Kavitha, B.; Reddy, P.A.K.; Kim, K.-H. TiO2-based photocatalytic disinfection of microbes in aqueous media: A review. Environ. Res. 2017, 154, 296–303. [Google Scholar] [CrossRef]
  70. McCullagh, C.; Robertson, J.M.C.; Bahnemann, D.W.; Robertson, P.K.J. The application of TiO2 photocatalysis for disinfection of water contaminated with pathogenic micro-organisms: A review. Res. Chem. Intermed. 2007, 33, 359–375. [Google Scholar] [CrossRef]
  71. Mecha, A.C.; Onyango, M.S.; Ochieng, A.; Momba, M.N.B. Evaluation of synergy and bacterial regrowth in photocatalytic ozonation disinfection of municipal wastewater. Sci. Total Environ. 2017, 601, 626–635. [Google Scholar] [CrossRef]
  72. Liu, N.; Ming, J.; Sharma, A.; Sun, X.; Kawazoe, N.; Chen, G.P.; Yang, Y.N. Sustainable photocatalytic disinfection of four representative pathogenic bacteria isolated from real water environment by immobilized TiO2-based composite and its mechanism. Chem. Eng. J. 2021, 426, 131217. [Google Scholar] [CrossRef]
  73. Subirats, J.; Sharpe, H.; Topp, E. Fate of Clostridia and other spore-forming Firmicute bacteria during feedstock anaerobic digestion and aerobic composting. J. Environ. Manag. 2022, 309, 114643. [Google Scholar] [CrossRef]
Figure 1. (A) Graphical representation of the experimental photocatalysis setup (a) blackout cloth; (b) black plastic cap on which the quartz tube stands; (c) lamp, OSRAM DULUX BLUE UVA 78 COLOR, 9W; (d) quartz tube; (e) 1 L jacketed beaker; (f) stirring magnet; (g) magnetic stirrer with temperature stabilizer; (h) stirring intensity adjustment; (i) temperature adjustment. (B) Photocatalytic nanofiltration reactor arrangement.
Fermentation 09 00662 g001
Figure 2. Raman analysis of samples taken from the clear gel after TTIP hydrolysis (dried gel) and from the slurry after the addition of TiO2 P25 (dried slurry). The Raman analysis of the TiO2 P25 powder is included for comparison (Degussa P25).
Fermentation 09 00662 g002
Figure 3. (A) Disinfection rates of inoculated water samples using 0.1 g/L TiO2 under UVA illumination. Control A: inoculated water samples without the addition of TiO2 under UVA illumination. Control B: inoculated water samples using 0.1 g/L TiO2 under dark conditions. (B) PNFR implementation for disinfection of inoculated water samples with E. faecalis. **** p < 0.0001; *** p < 0.001; ** p < 0.01.
Fermentation 09 00662 g003
Figure 4. (A) Disinfection rates under different concentrations of TiO2 under UVA illumination. (B) Pre-treatment dynamics on photocatalytic disinfection. A, untreated; B, centrifuged; C, flocculated and μfiltrated. **** p < 0.0001; *** p < 0.001. n = 3.
Fermentation 09 00662 g004
Figure 5. Photocatalytic disinfection of various pathogens using 0.7 g/L TiO2 under UVA illumination. The efficacy of the disinfection process was confirmed by maintaining the pathogen-free state for a duration of 2 h in the absence of light.
Fermentation 09 00662 g005
Figure 6. PNFR implementation for disinfection of pre-treated LD. (A) E. coli; (B) E. faecalis; (C) C. perfringens; (D) PPV. *** p < 0.001; ** p < 0.01; * p < 0.05. n = 3.
Fermentation 09 00662 g006
Table 1. Main LD characteristics obtained after AD of different feedstocks.
ParameterUnitMin-Max ValuesAverageStandard Deviation
ECms/m318–1880650626
pH-7.9–8.68.20.2
TS%1.32–5.833.221.6
VS%0.65–5.721.91.6
CODmg/L21,333–42,61533,800809
TN%0.2–0.440.330.08
TP%0.01–0.140.040.05
N-NO3%0.002─0.010.0060.003
N-NH4%0.13–0.360.220.06
Ca%0.014–0.140.0440.05
K%0.12–0.350.240.08
Mg%0.007–5.10.041.9
Fe%0.004–0.0220.0080.007
Mn%0.00014–0.0020.00060.0007
Na%0.07–0.160.090.03
Cl%0.14–1.190.350.39
Cdmg/kg TS<0.3–0.40.340.05
Crmg/kg TS<8.3–14.67.53.8
Pbmg/kg TS<1–2.6<1-
Znmg/kg TS209–1220504374
Asmg/kg TS<3–15.15<3-
Cumg/kg TS59–449197135
Hgmg/kg TS-<0.02-
Nimg/kg TS11–30.317.17.1
E. colicfu/g<10–13,000--
E. faecaliscfu/g<10–250,000--
Table 2. Physicochemical and biological characteristics of LD, untreated (A), after centrifugation of A (B), after flocculation and μfiltration of B (C), after nanofiltration alone of C (Di), after 5.5 h photocatalysis with 0.7 g/L of C (Dii), and after PNFR of C (Diii).
A: UntreatedB: CentrifugedC: μFiltrationDi: nFiltrationDii: PhotocatalysisDiii: PNFR
ParameterUnitAverageSDAverageSDAverageSDAverageSDAverageSDAverageSD
pH-8.140.118.200.108.500.128.500.108.300.108.200.10
ECmS/m534185502664530415415202828427
TS%3.940.211.910.010.360.000.170.000.200.000.110.00
N-NH4mg N/L28812672151250<0.1n.a.<0.1n.a.<0.1n.a.<0.1n.a.
Ν%0.420.020.300.000.080.000.020.000.020.000.020.00
Clmg/L2941310390060774599672192520144481151
Salinity3.220.113.260.174.400.102.500.103.150.102.500.10
Ν-ΝO3mg N/L60.9312.9543.508.00<0.01n.a.<0.01n.a.<0.01n.a.<0.01n.a.
VS%2.430.160.920.030.10n.a.<0.1n.a.<0.1n.a.<0.1n.a.
Pg/kg0.610.000.110.00<0.1n.a.<0.1n.a.<0.1n.a.<0.1n.a.
CODmg O2/L33,750443114,28019661190190732354172029822
TSSmg/L28,0009528177515918033611.00331.2240.01
TurbidityNTUn.a. *n.a.80002441687321110020847713224875
E. colicfu/g32503718743405<10n.a.<10n.a.<10n.a.<10n.a.
E. faecaliscfu/g317332172390249241053<10n.a.<10n.a.<10n.a.
C. perfrigenscfu/g4440352632702873300130<10n.a.<10n.a.<10n.a.
* n.a., not applicable.
Disclaimer/Publisher’s Note: The statements, opinions and data contained in all publications are solely those of the individual author(s) and contributor(s) and not of MDPI and/or the editor(s). MDPI and/or the editor(s) disclaim responsibility for any injury to people or property resulting from any ideas, methods, instructions or products referred to in the content.

