Article

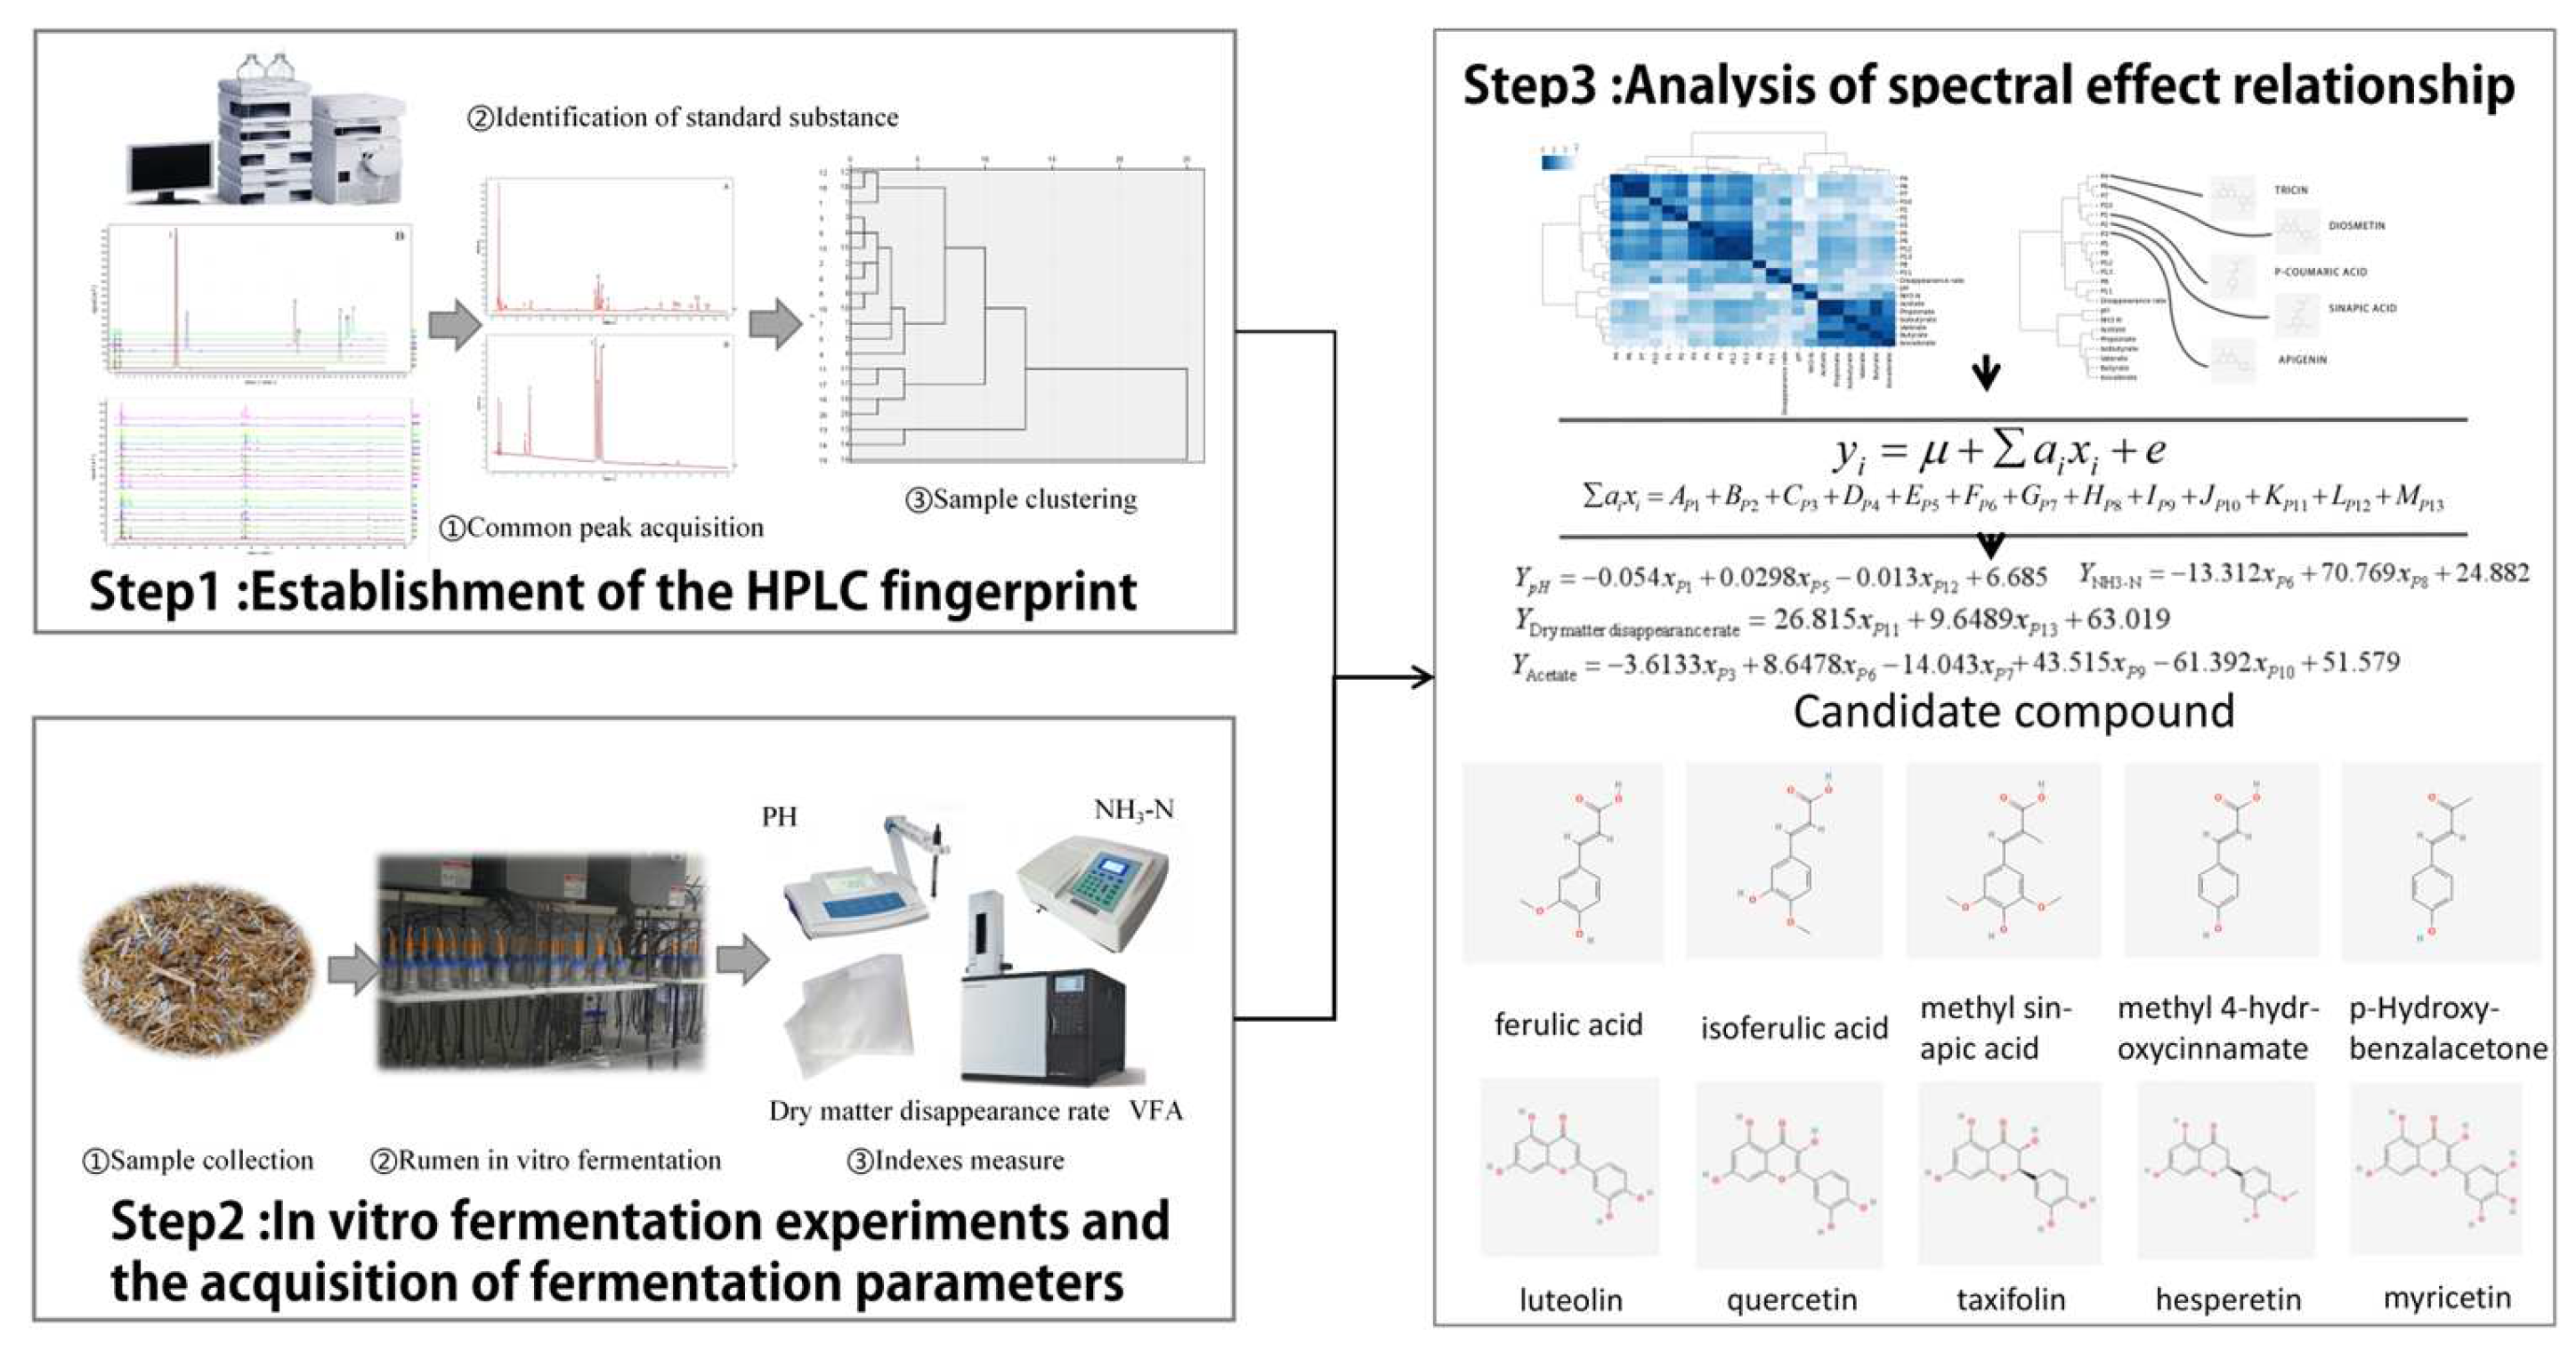
Establishment of Flavonoid Fingerprint of TMR Diet and Optimization Factor Analysis Strategy and In Vitro Fermentation Parameters Based on Spectrum–Effect Relationship

Beijing Key Laboratory for Dairy Cow Nutrition, Beijing University of Agriculture, Beijing 102206, China
*
Author to whom correspondence should be addressed.
Fermentation 2023, 9(6), 571; https://doi.org/10.3390/fermentation9060571
Submission received: 10 May 2023 / Revised: 9 June 2023 / Accepted: 12 June 2023 / Published: 16 June 2023
(This article belongs to the Section Industrial Fermentation)

Abstract

:
Nutricines, the nutritionally active substances in feed, play a vital role in enhancing immune function, antioxidant activity, and feed efficiency in dairy cows. Identifying nutricines in total mixed ration (TMR) provides insights into feed quality and their impact on dairy cow health. However, due to the structural diversity of nutricines, data mining using multivariate variable models faces challenges in exploring their relationships. To address this, this study established a hierarchical clustering and optimization factor strategy for 13 common flavonoid peaks detected using apparent data and HPLC-DAD. The establishment of the flavonoid fingerprint of TMR diet in dairy cows detected 13 common peaks, five of which were found using standard products: p-coumaric acid, sinapic acid, tricin, and diosmetin. In vitro fermentation results using different TMR samples in substrate fermentation indicated that the dry matter disappearance rate, NH3-N, acetate, propionate, butyrate, isovalerate, and valerate changes varied significantly (p < 0.05). In spectrum–activity relationship studies, P2, P6, P8, P9, P10, and P11 were all considered possible factors causing this effect. In the analysis of optimization factor strategy, the peak spectrum model of four fermentation parameters, i.e., pH, dry matter digestibility, NH3-N, and acetate, was constructed after optimization (p < 0.05), and the data model is listed in the main text. In structure–activity relationship studies, ferulic acid, isoferulic acid, methyl sinapic acid, methyl 4-hydroxycinnamate, and p-hydroxybenzalacetone may serve as candidate references for compound 10 and may play an important role in affecting the digestibility of dry matter in in vitro fermentation. These findings highlight the role of flavonoids in TMR feed as key factors in maintaining dairy cow health and differentiating nutritional value. This study proposes a novel method for future TMR diet formulation and quality evaluation, with potential implications for improving dairy cow health and performance. Further research is needed to validate these findings and elucidate the mechanisms underlying nutricine effects on dairy cow nutrition and health.

1. Introduction

Animal health is a significant global challenge as it affects not only human health but also social and economic factors [1,2]. Although antibiotics have traditionally been used to treat animal diseases, their residual and environmental pollution have hindered the sustainable development of animal husbandry [3,4,5]. In response, animal husbandry has implemented measures to prohibit or reduce antibiotic usage [6,7,8]. To address animal health concerns in the post-antibiotic era, nutrition manipulation is a feasible solution for maintaining animal health. The feed and animal production industries must develop an effective nutrition-based health approach that considers the interaction between nutrition and health [9].
In addition to basic nutrients, such as crude protein and fat, animal feed also contains beneficial trace components that can improve animal intestinal health, maintain immune activity, balance oxidation, regulate gene expression, and have antibacterial, anti-inflammatory, and other biological functions [10,11,12]. These trace components, defined as feed nutricines, have been shown to activate animal immune function, improve antioxidant activity, and improve feed utilization rates, making them an important technical strategy for healthy livestock and poultry breeding in the post-antibiotic era [9,13]. Flavonoids are classified under polyphenolic compounds as they are composed of two aromatic rings (“A” and “B”) linked by a 3-carbon bridge (C6–C3–C6) [14]. As one of the most common nutricines in feed, it has been found to have good biological activity, including improving antioxidant capacity, affecting gastrointestinal function and metabolism, reversing inflammatory reactions, and exerting anti-inflammatory effects [15,16,17,18]. For example, Luxin Kong [19] found that supplementing Holstein calf diets with flavonoids significantly increased average daily weight gain and feed efficiency as well as total VFA concentration and propionate mole ratio during the pre-weaning and overall periods. Animal diets should not only meet the basic nutritional needs but also play a role in physiological regulation and defense [9,20]. Numerous studies have shown that the supplementation of plant extract containing flavonoids to the dairy cow diet improves milk production and lactation performance, decreases the incidence of acidosis, and enhances animal growth performance in cattle receiving a high-concentrate diet [21,22]. Therefore, nutricines in feed are likely key factors in ensuring animal health, and studying nutricines in feed could promote the application of precise nutrition.
However, the structure of nutricines in feed is complex, and the main influencing factors are not clear. These factors are affected by the origin, harvest season, different parts of plants, and processing method [23]. The molecular structures and species of nutricines are also diverse, resulting in a lag in research and application that meets the requirements of industrial development. Since Dr. Adams introduced the concept of nutricines [9], they have been widely studied and applied as feed additives [24,25,26,27]. Several reports have been published on nutricines in feed materials, such as alfalfa flavonoids [28] and oat flavonoids [29]. However, to date, no research has been conducted on nutricines in TMR for dairy cows. Fingerprinting is used to quantitatively analyze and describe the chemical information contained in the nutricines of feed using certain analytical methods [30,31]. This approach helps to identify the components and establish quality control [32]. High-performance liquid chromatography (HPLC) is currently one of the main methods used to construct a fingerprint [33].
The objective of this study is to establish a chemical fingerprint analysis of TMR diets for compound prediction of spectrum–structure–activity. This analysis can provide information on the compounds present in the TMR diets and their effects on biological phenotypes by using HPLC to qualitatively analyze flavonoid compounds. The use of spectrum–effect relationships can help identify the compounds that have an influential effect on biological phenotypes, enabling a better understanding of the material effect in precision nutrition problems. Apparent parameters of animals is important in the research on natural plant active ingredients, but the complex characteristics of biological phenotypes have made it difficult to discover the function of active substances [34]. This study aims to exclude random effects as much as possible to find a positive solution. The nutricines in dairy TMR diets were analyzed using HPLC, and the nutricines fingerprint in dairy cows’ TMR was established for the first time. Based on the fingerprint of TMR and rumen fermentation parameters in vitro, the spectrum–effect relationship between TMR flavonoids and in vitro rumen fermentation parameters was studied. Sample similarity was evaluated first, and the component functional relationship affecting the fermentation parameters was determined through hierarchical clustering and optimization factor analysis strategy to predict compounds with the same function using structure–effect relationship.

2. Results

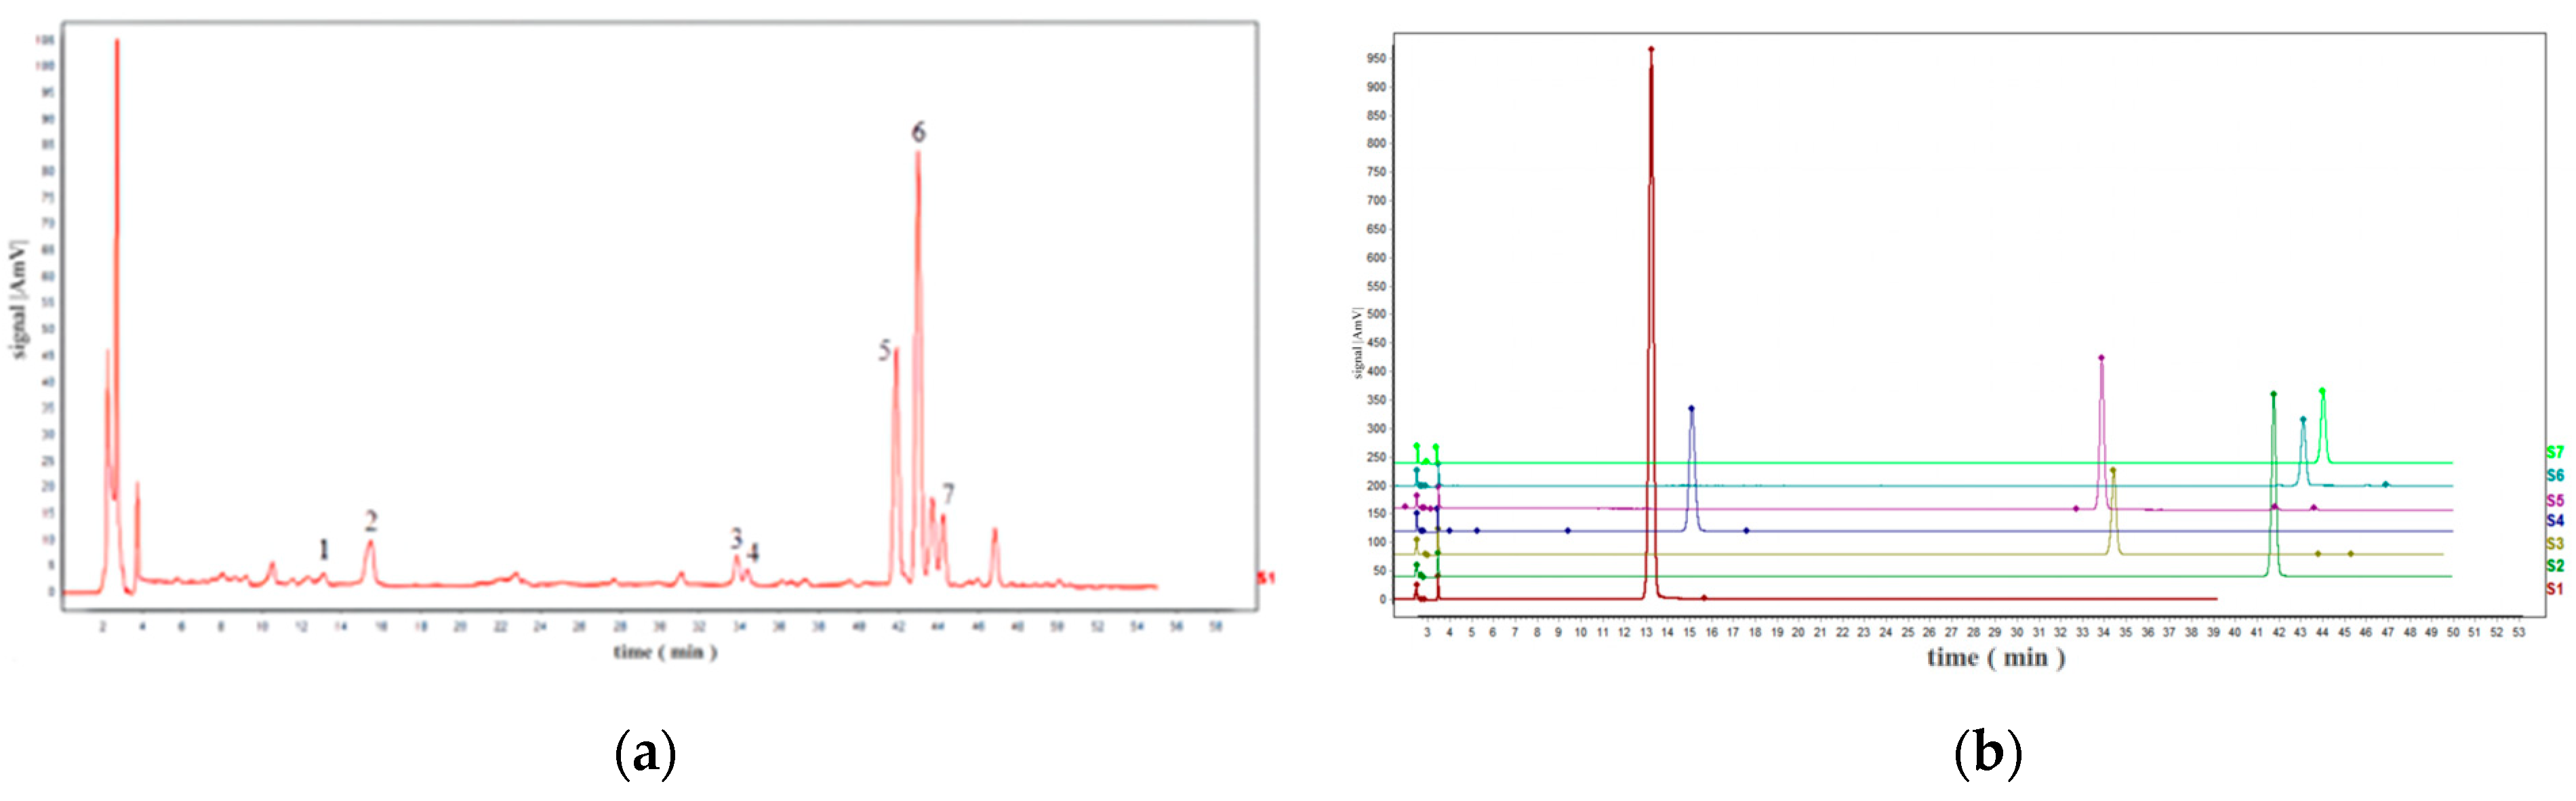
2.1. HPLC–UV Identification of Seven Standard Compounds from the TMR

The extracts of TMR sample 19 (S19) as representative varieties were analyzed using HPLC (Figure 1). By comparing the retention time and peak position with the corresponding standards under the same chromatographic conditions, seven compounds were identified, which were p-coumaric acid, sinapic acid, luteolin, quercetin, apigenin, tricin, and diosmetin.

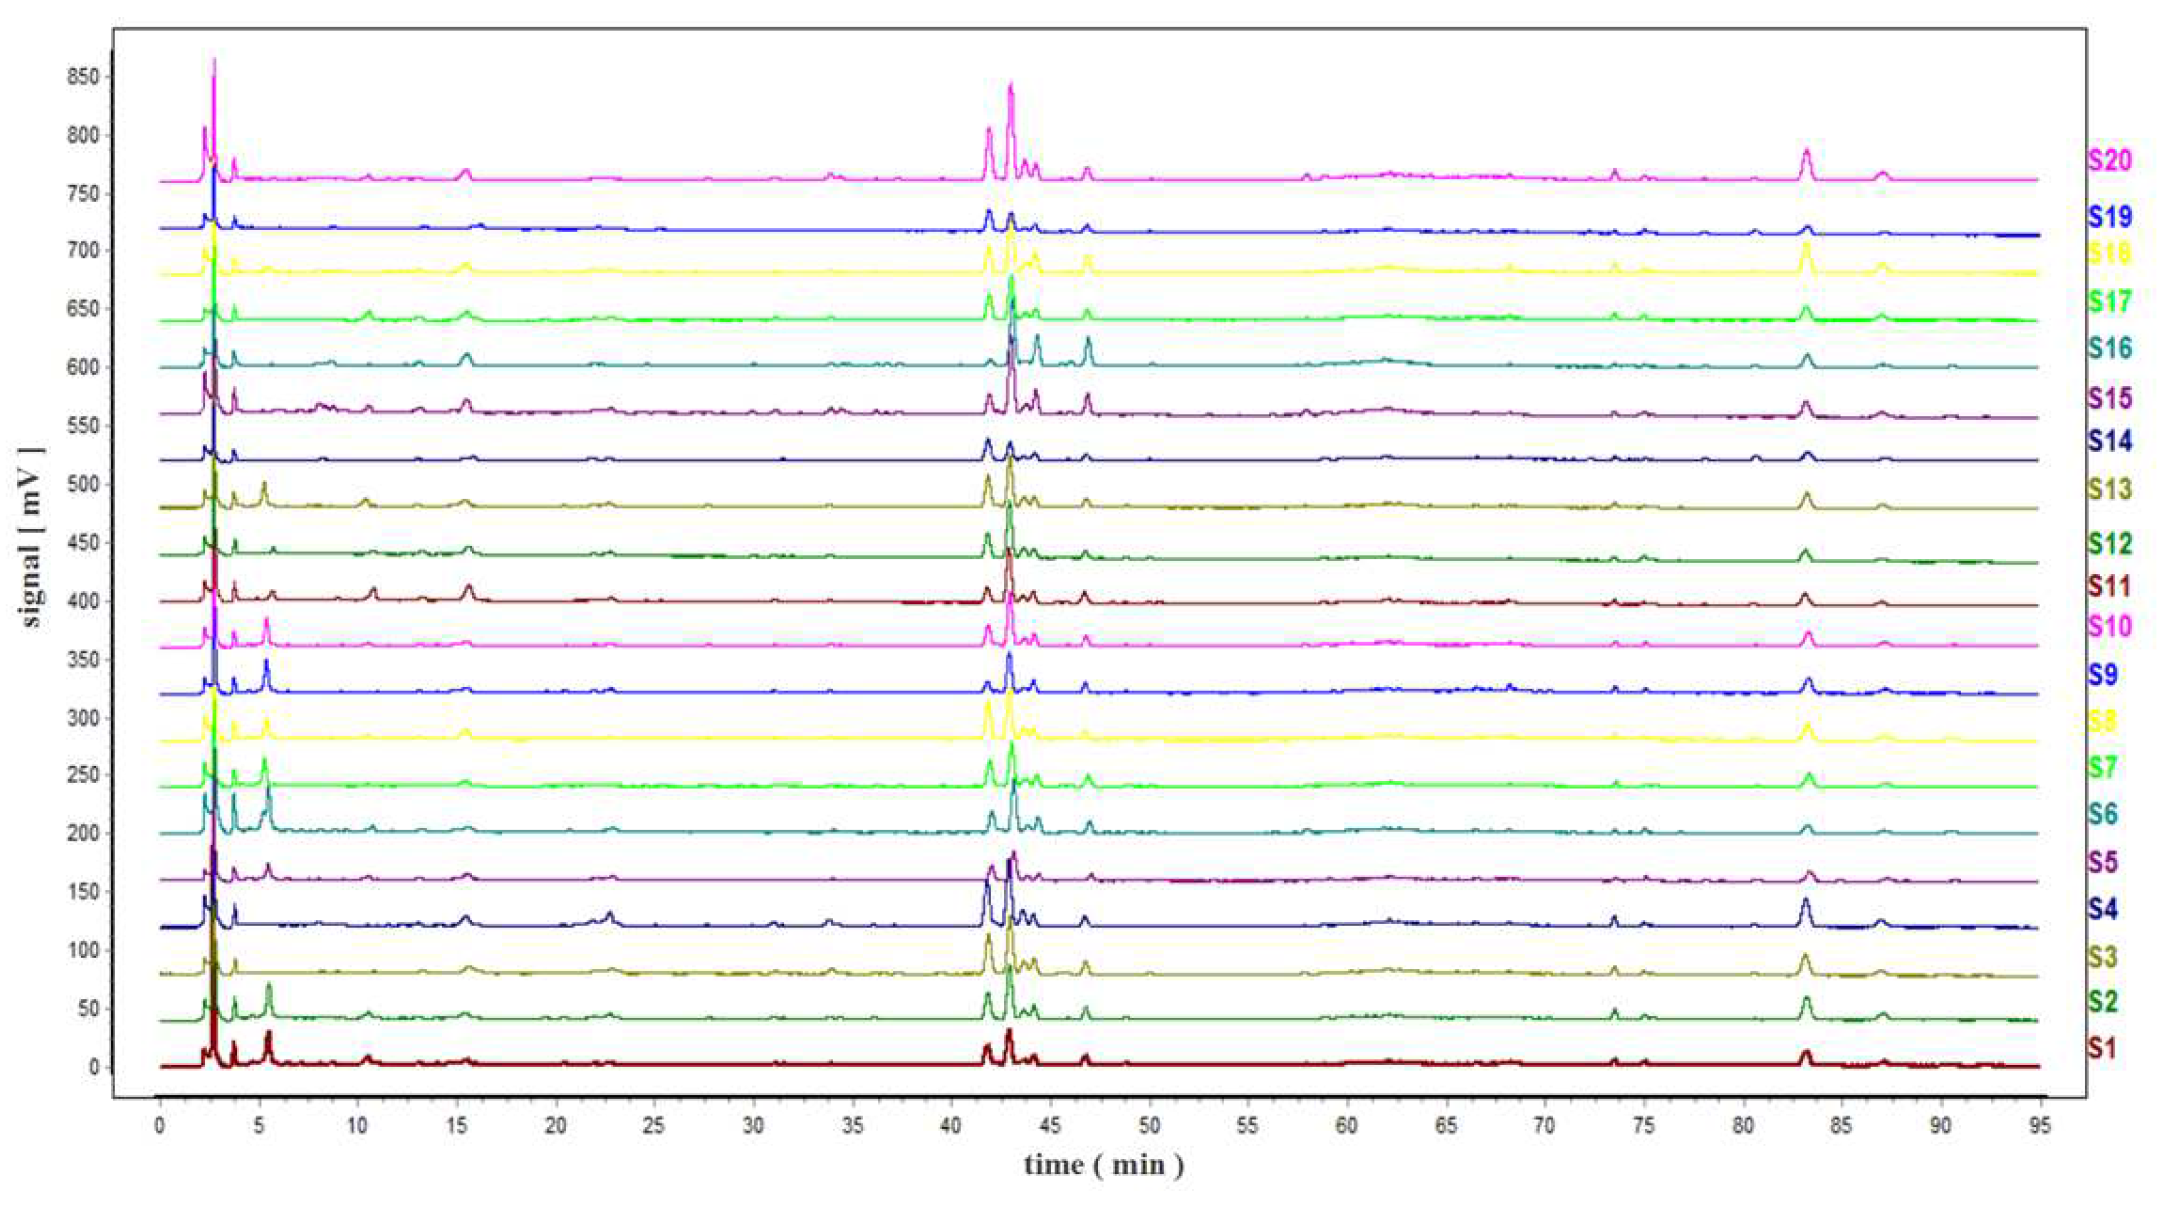
2.2. Construction of TMR Fingerprint

Chromatograms of 20 TMR diets were imported into “Similarity Evaluation System of Chromatographic Fingerprint of Traditional Chinese Medicine” (2012 Edition) for analysis, and the TMR HPLC fingerprint was obtained (Figure 2).

2.3. Confirmation of Reference Peak and Common Peak of Fingerprint

Thirteen common peaks were observed in 20 TMR samples from different location (Figure 3a). Compared with the reference substance (Figure 3b), five peaks were identified, which were p-coumaric acid (peak 1), sinapic acid (peak 2), apigenin (peak 3), tricin (peak 4), and diosmetin (peak 6). However, luteolin and quercetin in S19 cannot be detected in all samples.
The retention time of each peak was corrected using the “Similarity Evaluation System of Chromatographic Fingerprint of Traditional Chinese Medicine”. Quantitative data can be obtained by equalizing the peak areas [35]. Among the five identified peaks, peak 2 has the best resolution; hence, peak 2 of S19 is selected as the reference peak, and the areas of other peaks were calculated (Table 1).

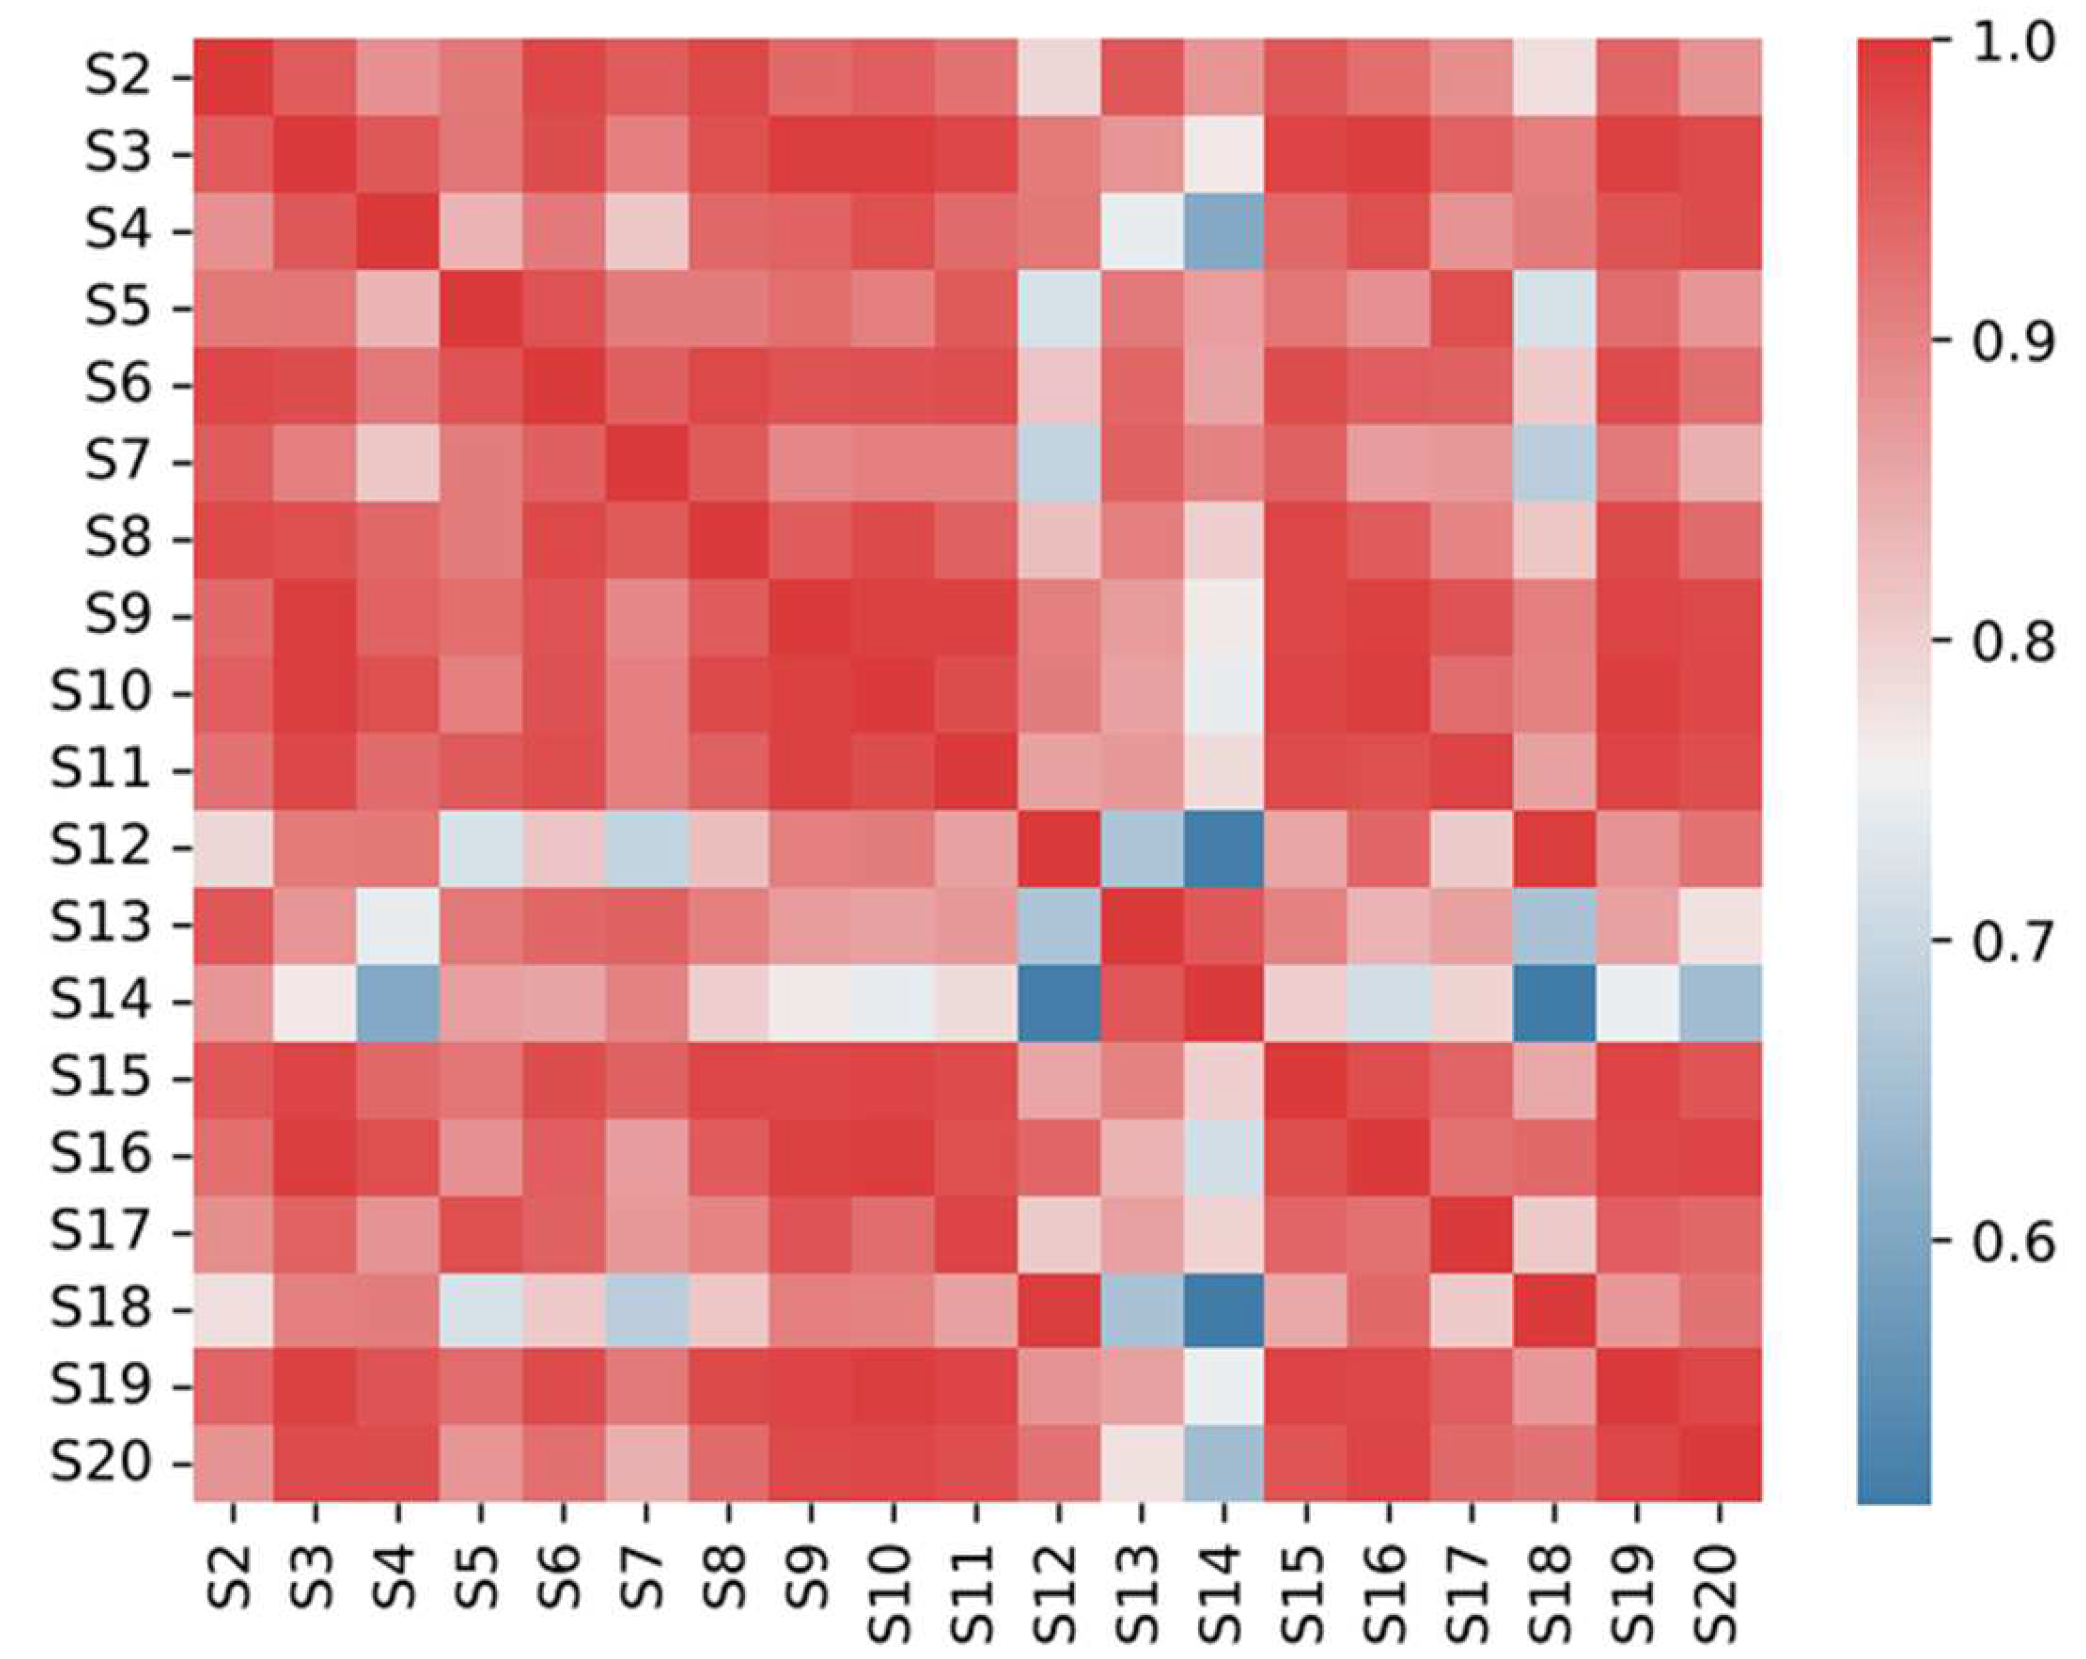
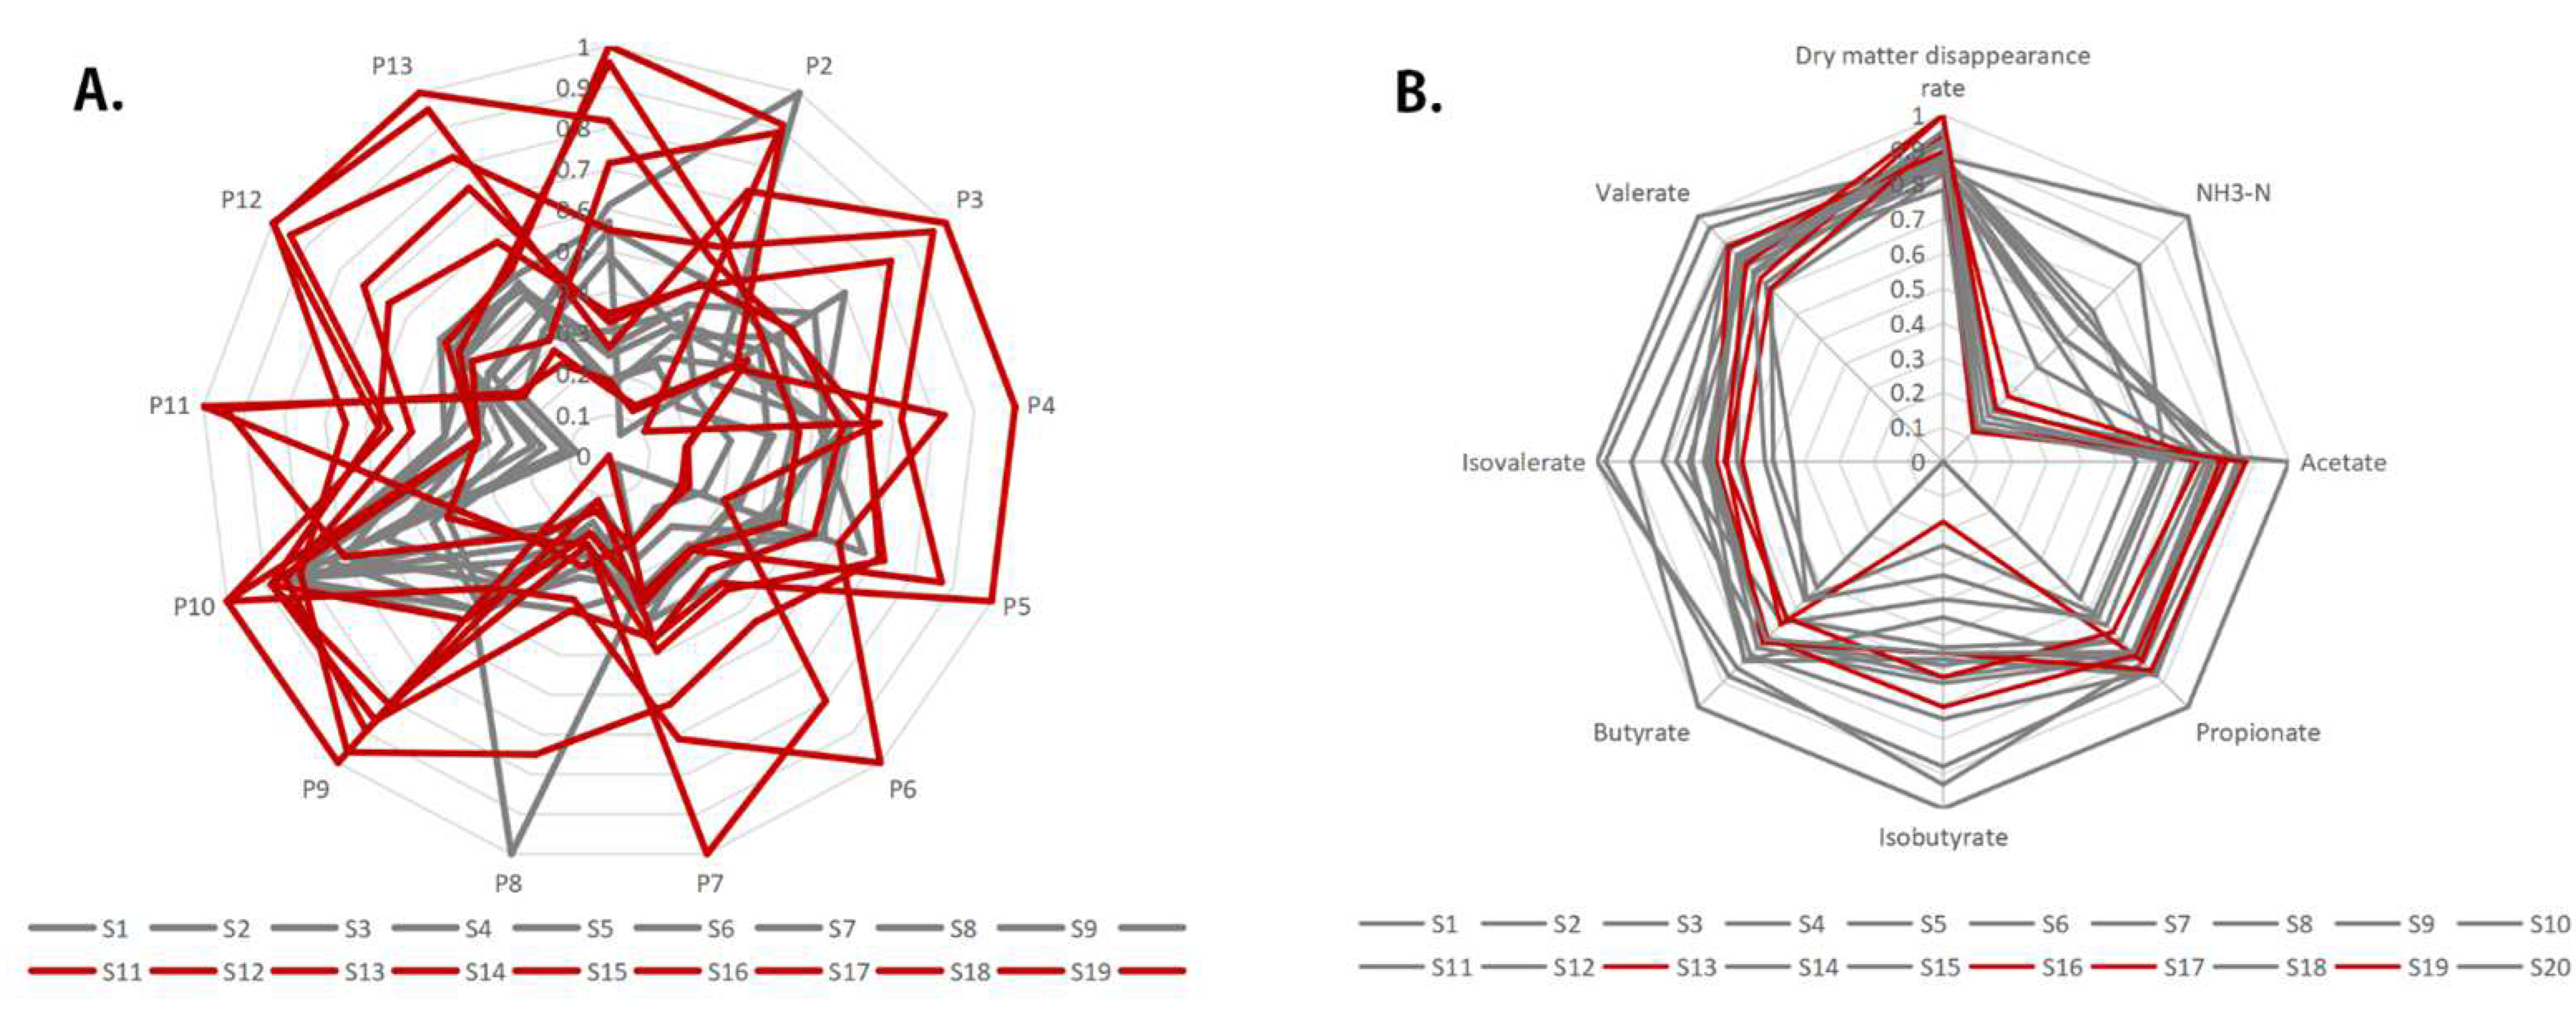
2.4. Similarity Evaluation of the HPLC Fingerprint

Fingerprint similarity evaluation based on whole chromatogram is one of the important methods in TCM (Traditional Chinese Medicine) quality control [33]. Chromatograms of different sample batches of the same variety were introduced into similarity evaluation system (SES), and the similarities among varieties were analyzed, while the chromatographic control fingerprints were exported for further study. The characteristics of different varieties were synthesized using chromatographic control fingerprint, which was representative for identification. Using the characteristic maps of 20 TMR samples as reference peaks, the similarity of the characteristic maps of 20 TMRs from different sources was evaluated, and the similarity of 20 TMR components ranged from 0.633 to 0.995 (Figure 4). These data showed that most TMR diets were highly similar. The difference in correlation coefficient further showed the difference between fingerprint and the intrinsic quality of these samples.

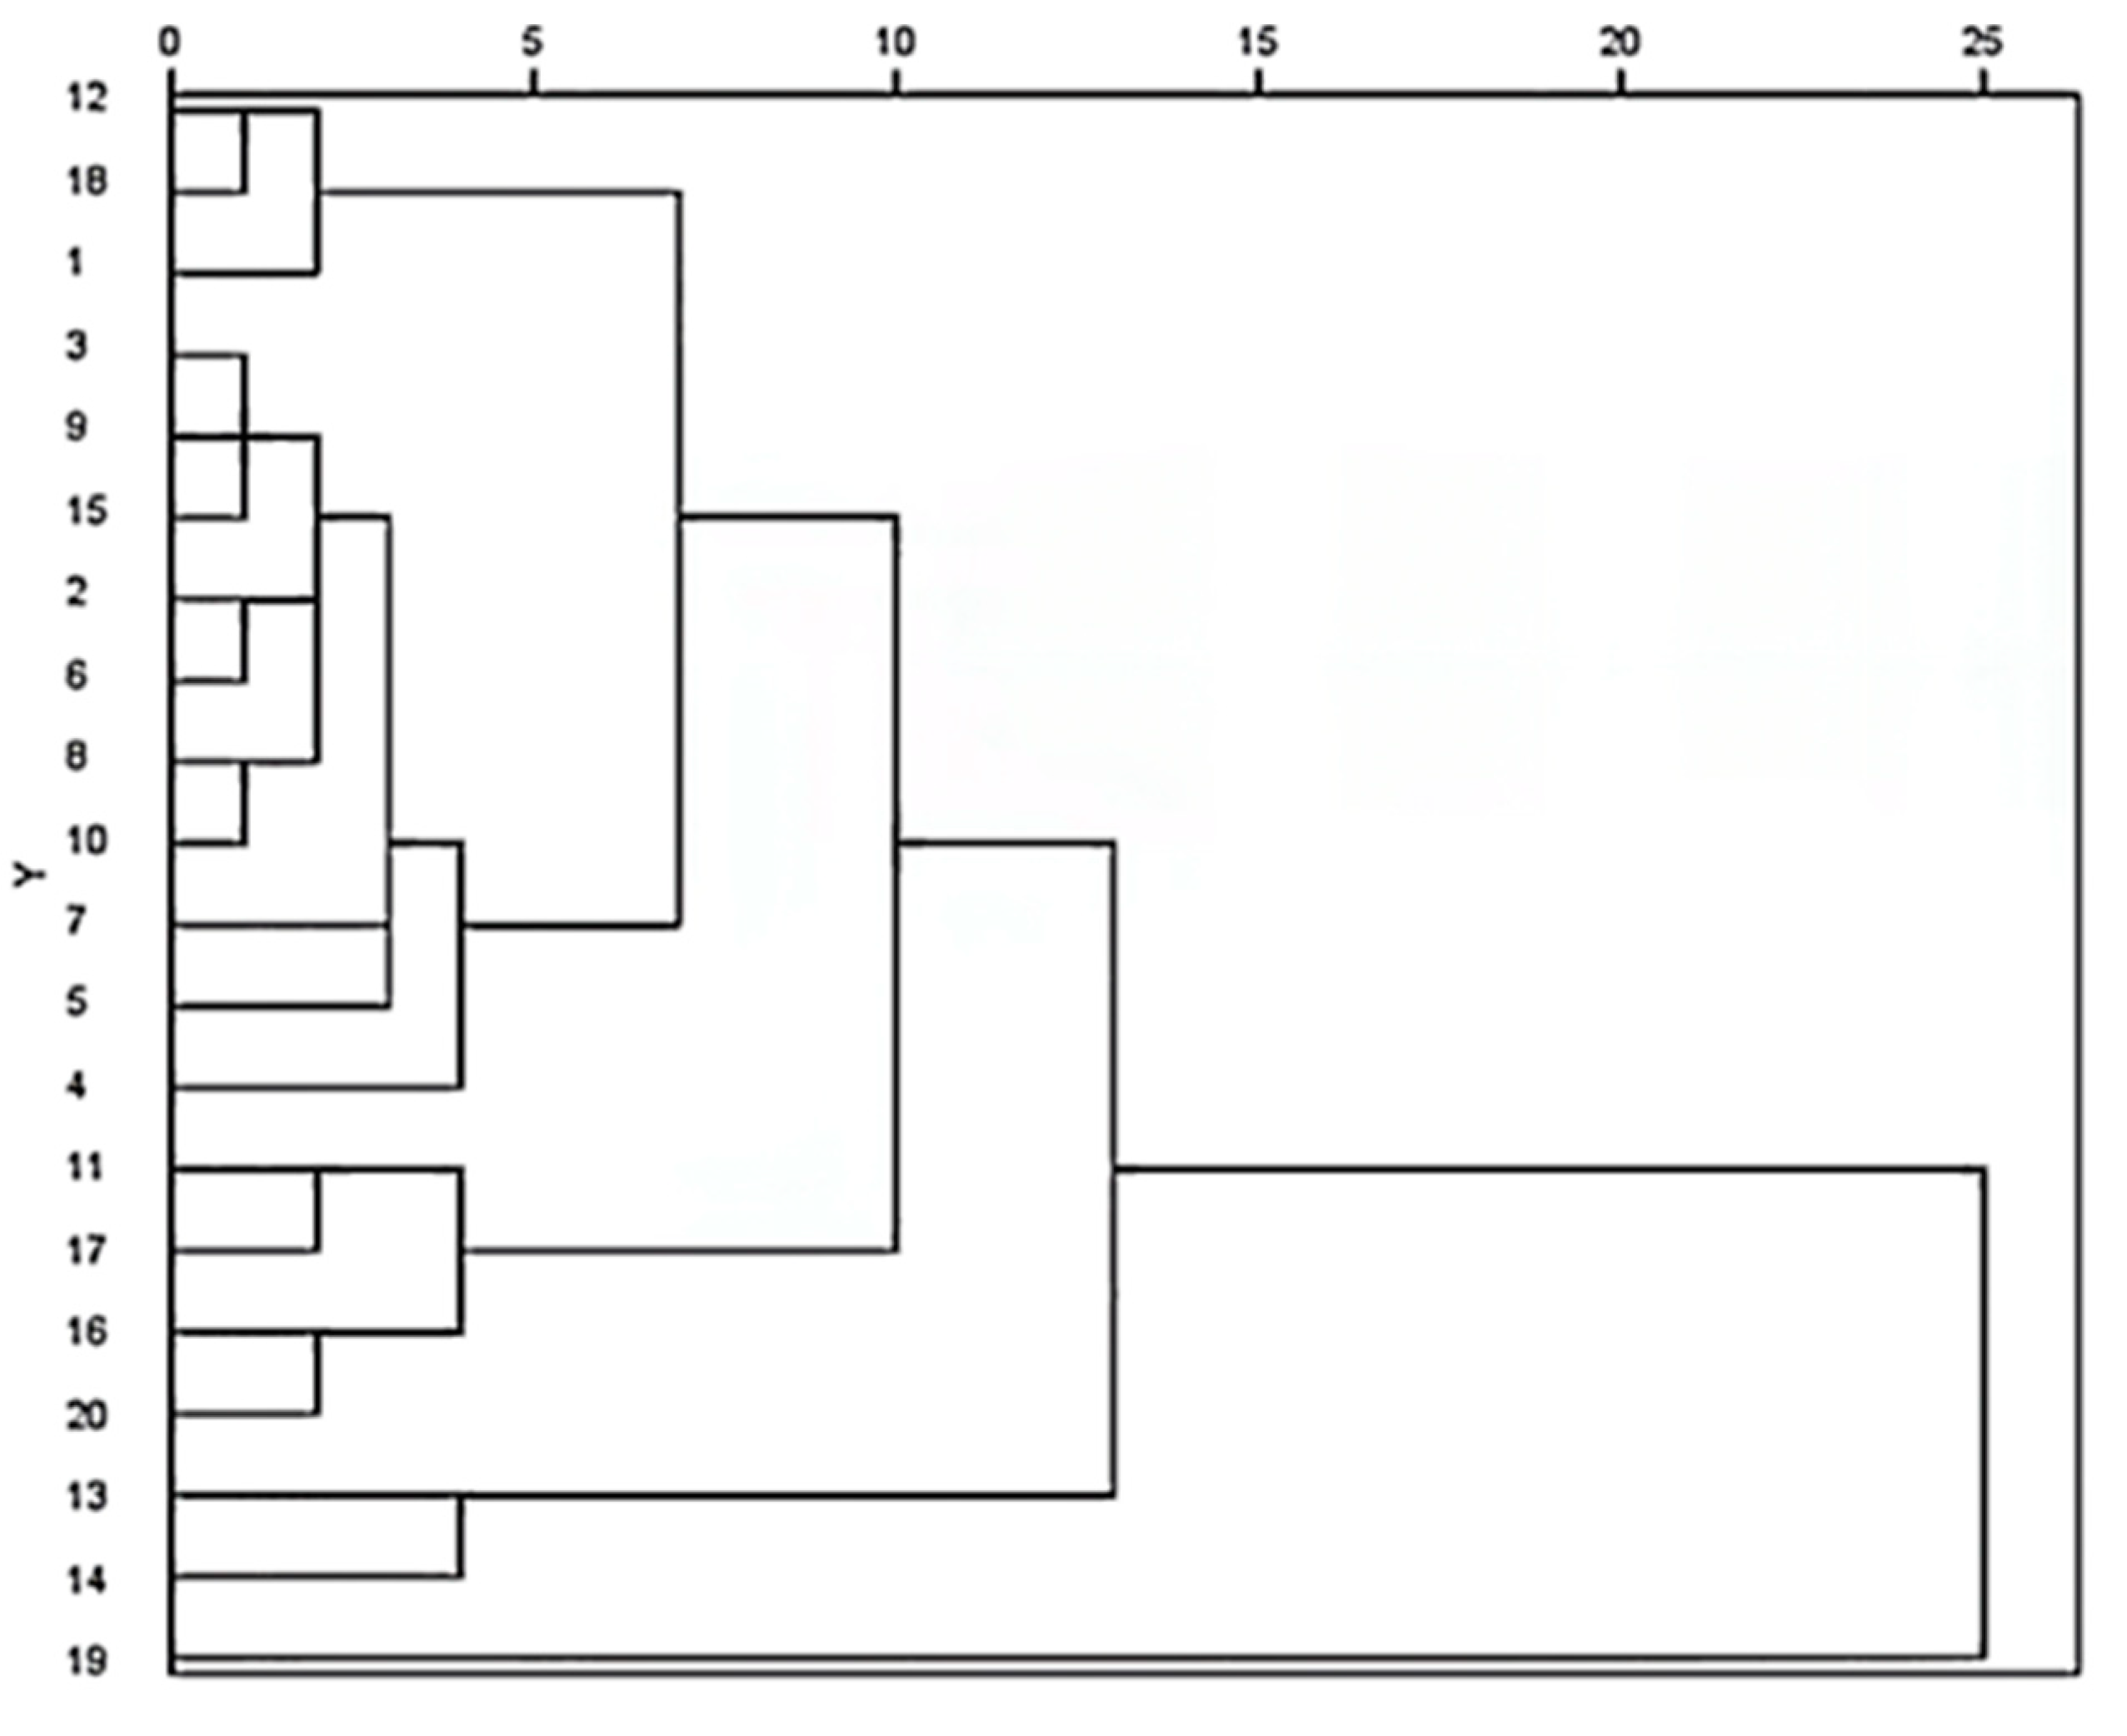
2.5. Sample Clustering Analysis

The relative peak area of each common peak in 20 samples was taken as an index. A total of 20 batches of TMR samples could be divided into four categories: S19 belonged to one group, and it had the highest content of flavonoids; S13 and S14 belong to one group, and the contents of nutricines is the second highest in this group; followed by S11, S16, S17, and S20 that belonged to another group; and other samples belonged to a group, and they had the lowest content of flavonoids (Figure 5).

2.6. In Vitro Rumen Fermentation Results

2.6.1. pH, NH3-N Concentration, and Dry Matter Disappearance Rate of Fermentation Fluid under Different TMR

As shown in Table 2, when the 20 TMR diets were fermented in vitro for 24 h, the pH of the fermentation fluid in each group was 6.65~6.70, and there was no significant difference among the groups (p > 0.05). The concentrations of NH3-N and the dry matter disappearance rates after 24 h fermentation among the 20 TMR diets were significantly different (p < 0.0001). It is mainly observed that the dry matter disappearance rates of S17 and S19 are higher than those of other samples, and the dry matter disappearance rate of S14 is lower than that of other samples. For the NH3-N concentration of different TMR diets fermented in vitro for 24 h, the NH3-N concentration in S11–S19 was relatively low, while the NH3-N concentration in S1–S10 was relatively high. S1–S10 were classified into the fourth category of clustering analysis.

2.6.2. VFA Concentration in Fermentation Fluid under Different TMR

As shown in Table 3, the acetate content, propionate content, and other VFA contents of the 20 TMR diets after in vitro fermentation for 24 h. It can be seen that there were significant differences in the acetate, propionate, butyrate, valerate, and isovalerate contents of the fermentation fluid after in vitro fermentation for 24 h among the 20 TMR diets (p < 0.01) but no significant difference in the isobutyrate content (p = 0.053). In general, the VFA content of S2, S4, S7, and S18 was relatively low, while the content of S11 was relatively high.

2.6.3. Content of Total Flavonoids in TMR

In order to explore whether the content and components of total flavonoids in TMR were the reasons for the difference, we analyzed the correlation between the content of total flavonoids and these indicators.
The extraction method of total flavonoids in TMR was optimized according to the response surface methodology in the early stage of this experiment. Total flavonoids in 20 TMR samples from different cattle farms were extracted, and the contents of total flavonoids in 20 TMR was within the range of 9.9688–13.9468 mg/g (Table 4).
According to the above results, the total flavonoid content in samples S19, S1, and S17 is higher. As the dry matter digestibility of S17 and S19 is also higher, there may be a correlation between the total flavonoid content and dry matter digestibility. Although the VFA level in sample S11 is higher, it is important to note that the digested part of dry matter can be converted into bacterial protein and VFA. Therefore, a high-level of dry matter digestibility does not necessarily indicate a high-level of VFA. The composition of flavonoids in the samples may influence the VFA levels.

2.7. Construction of Fingerprint–Effect Relationship

2.7.1. Correlation Analysis between Total Flavonoids Content in TMR and Fermentation Parameters In Vitro

As shown in Table 5 and Table 6, the total flavonoids content in dairy TMR diet had no correlation with the pH of the fermentation fluid, the dry matter disappearance rate, and the concentration of VFA (p > 0.05) but had a significant positive correlation with the concentration of NH3-N in the fermentation fluid (p = 0.015).

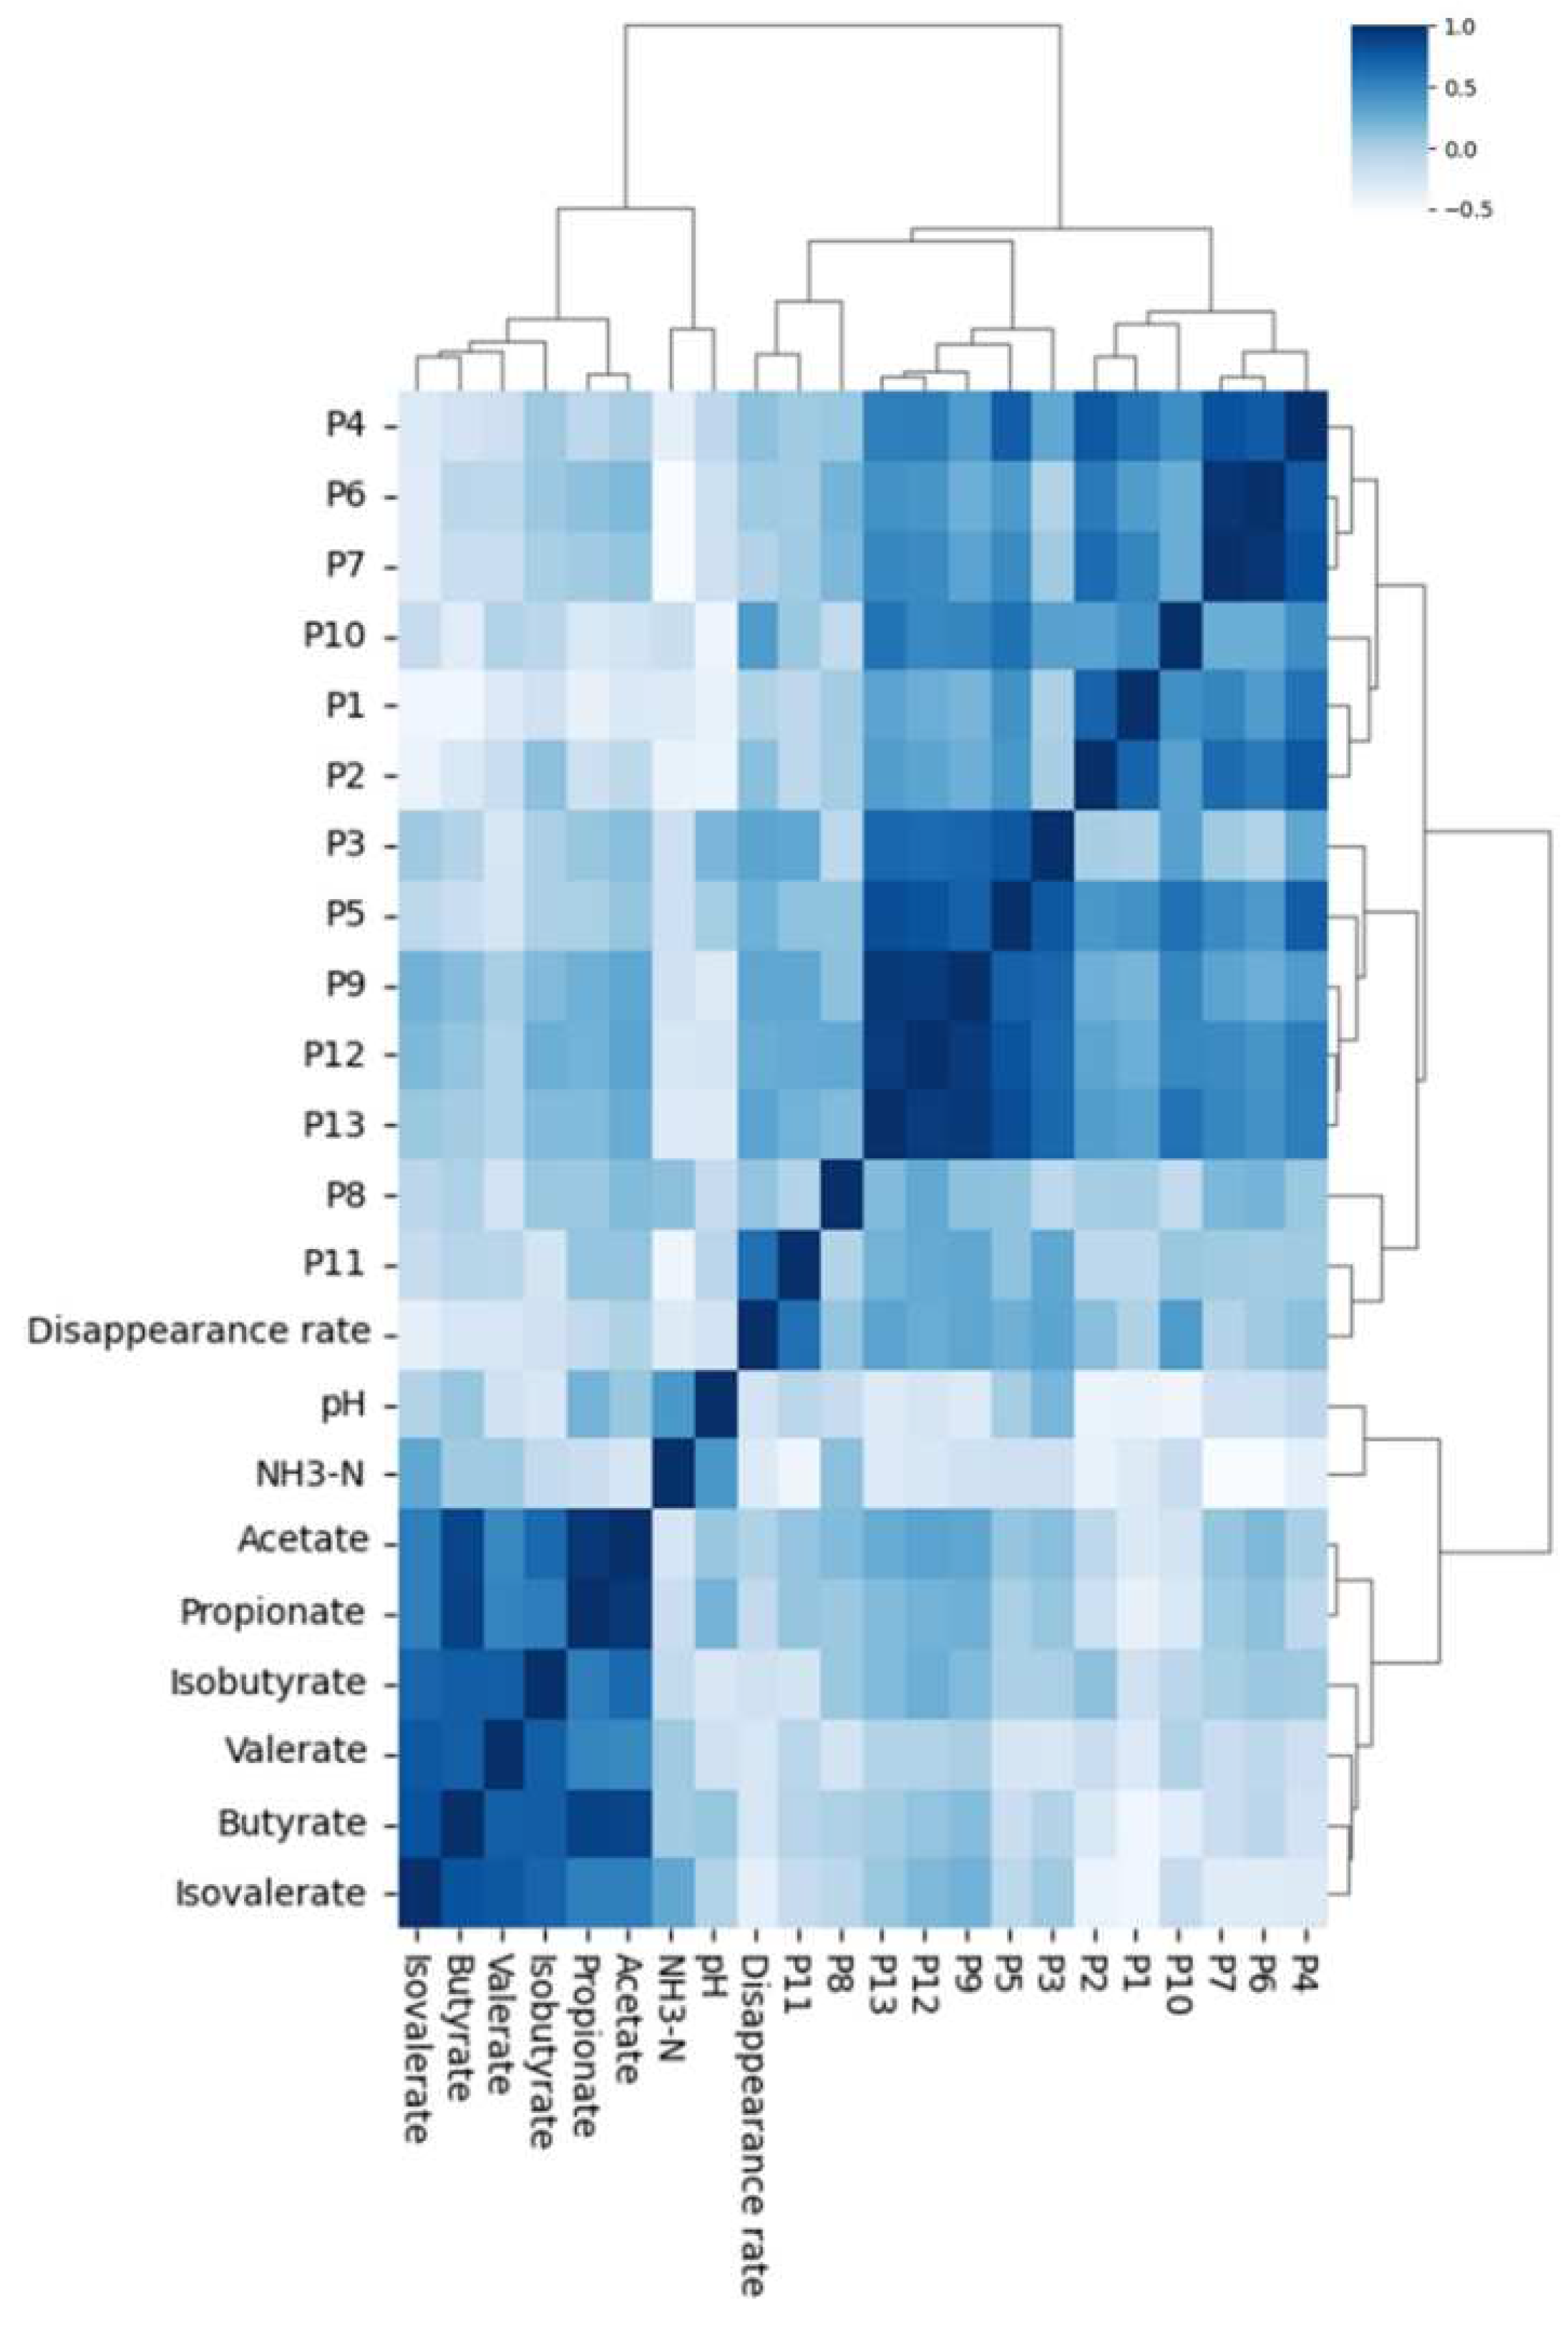
2.7.2. Hierarchical Clustering Analysis Based on Fingerprint–Effect Relationship

The relative peak area of each of the 20 samples and the correlation of in vitro fermentation parameters were used as indicators to plot the hierarchical cluster analysis based on the fingerprint–effect relationship (Figure 6). The results of hierarchical clustering show that the parameters are clearly divided into two modules: the peak module and the fermentation parameter module.
Within the peak module, the results of the spectrum compounds detected using HPLC fingerprint technology with hierarchical clustering (Figure 6) can help us understand the compound nature of the peaks contained in the fingerprint and explain the fermentation indicators of the spectrum compounds. Thirteen of the peaks were classified into four categories: P4, P6, and P7 contain tricin (peak 4) and diosmetin (peak 6), which mainly belong to flavonoids and have a methoxy group connection in the B ring; P10, P1, and P2 contain p-coumaric acid (peak 1) and sinapic acid (peak 2), and their basic structure is 4-hydroxycinnamic acid; P3, P5, P9, P12, and P13 contain apigenin (peak 3), which is a flavonoid and a possible component is hydroxyflavonoids; P8 and P11 contain compositions that are not yet clear.
It is noteworthy that the dry matter disappearance rate was clustered to the peak module, showing that the correlation between the dry matter disappearance rate and the different peak contents is worthy of further study.

2.7.3. Principal Effect Factor Based on Optimization Fixed Model Strategy

In terms of chemical composition, it is currently known that flavonoids in TMR can promote in vitro feed fermentation fluid indicators of dairy cows to some extent, but it is unclear which specific compounds are the main factors in this promotion process. Therefore, in this study, the spectrum–effect relationship method of traditional Chinese medicine was used to identify the main factors in TMR that influence the in vitro fermentation index by combining the fingerprint and in vitro feed fermentation fluid indicators of dairy cows.
In this study, factor analysis was used to analyze the spectrum–activity relationships between TMR and pH, dry matter digestibility, NH3-N, acetate, propionic, isobutyric, butyric, isovaleric, valeric, and valeric acid. A fixed model was constructed using continuous response variable (X) and predictor variable (X). The results of the first model construction are detailed in Table S3, and the detailed parameters determine whether the model fitting is statistically significant. The results show that there is a strong multivariate linear relationship between the peak area of common compounds in TMR and the digestibility of dry matter and NH3-N and acetate concentrations in the fermentation broth (details in Table S4 Moudle Parameter Summary before and after PanelOLS).
Among the nine different mathematical models of TMR and in vitro fermentation parameters constructed in this experiment, the fermentation parameters served as the dependent variables affected by the independent variables. The compounds represented by the peak map isolated using HPLC served as the independent variables. When evaluating the model, factor analysis was used to identify the independent variables that were statistically significant with each dependent variable indicator. The results showed a statistically significant correlation between dry matter digestibility and four peaks, with sinapic acid as compound 2. NH3-N was also found to have a correlation with two peaks, with diosmetin as compound 6, and acetate was correlated with one peak that did not have a reference compound.
Since the results of the nine fixed models were not ideal, an optimization model strategy was used. The pH peak spectrum model and NH3-N peak spectrum model of pH, dry matter digestibility, and NH3-N at the model level (p < 0.05) were statistically significant at the model level, but the p-values of two variables were 0.0575 and 0.0553, and the model had a certain reference value. However, other fixed models failed to optimize and could not improve the fit of the model by variable reduction. The optimization results are detailed in Table 7.
After optimizing the pH peak spectrum model, the confidence was greater than 98% (p = 0.0175), with fits mainly concentrated in the P1, P5, and P12 peaks. Based on coefficient observations, the contents of the three compounds had little effect on the pH differences. The model confidence of the dry matter digestibility peak spectrum was greater than 99.9% (p < 0.001), with fits focused on the P11 and P13 peak spectra. P11 had the most influential effect. The model confidence of the NH3-N peak spectrum was greater than 99% (p < 0.01), with P6 and P8 being the main influencing factors. P6 had a negative effect on NH3-N, while P8 had a positive effect on NH3-N. P8 had a large influential effect. The model confidence of the acetate peak spectrum was greater than 97% (p = 0.0294). The fits were focused on P3, P6, P7, P9, and P10. Among them, P6 and P9 had positive effects on acetic acid, while P3, P7, and P10 had negative effects on acetic acid concentration. P9 and P10 had the highest influence weight. According to the results of the fingerprint study, p-coumaric acid (peak 1), sinapic acid (peak 2), apigenin (peak 3), tricin (peak 4), and diosmetin (peak 6) can be concluded to mainly affect the acetate concentration in the model, with apigenin having the most significant effect. Diosmetin affects the NH3-N level and the acetate concentration. It is worth noting that the effect of the compound does not exist alone in the model. If the relationship is univariate and the effect is considered, it can cause the model to fail or overfit.
The results of the optimized model were also evaluated with the true value (Figure 7). The specific results are shown in Table 8. The results show that the paired t-test between the predicted value and the true value of the four models was good, with no difference between the predicted value and the true value, and the data correlation was high. In conclusion, the key observations affecting dry matter digestibility, NH3-N, and acetate were P2, P3, P6, P7, P9, P10, P11, and P13.

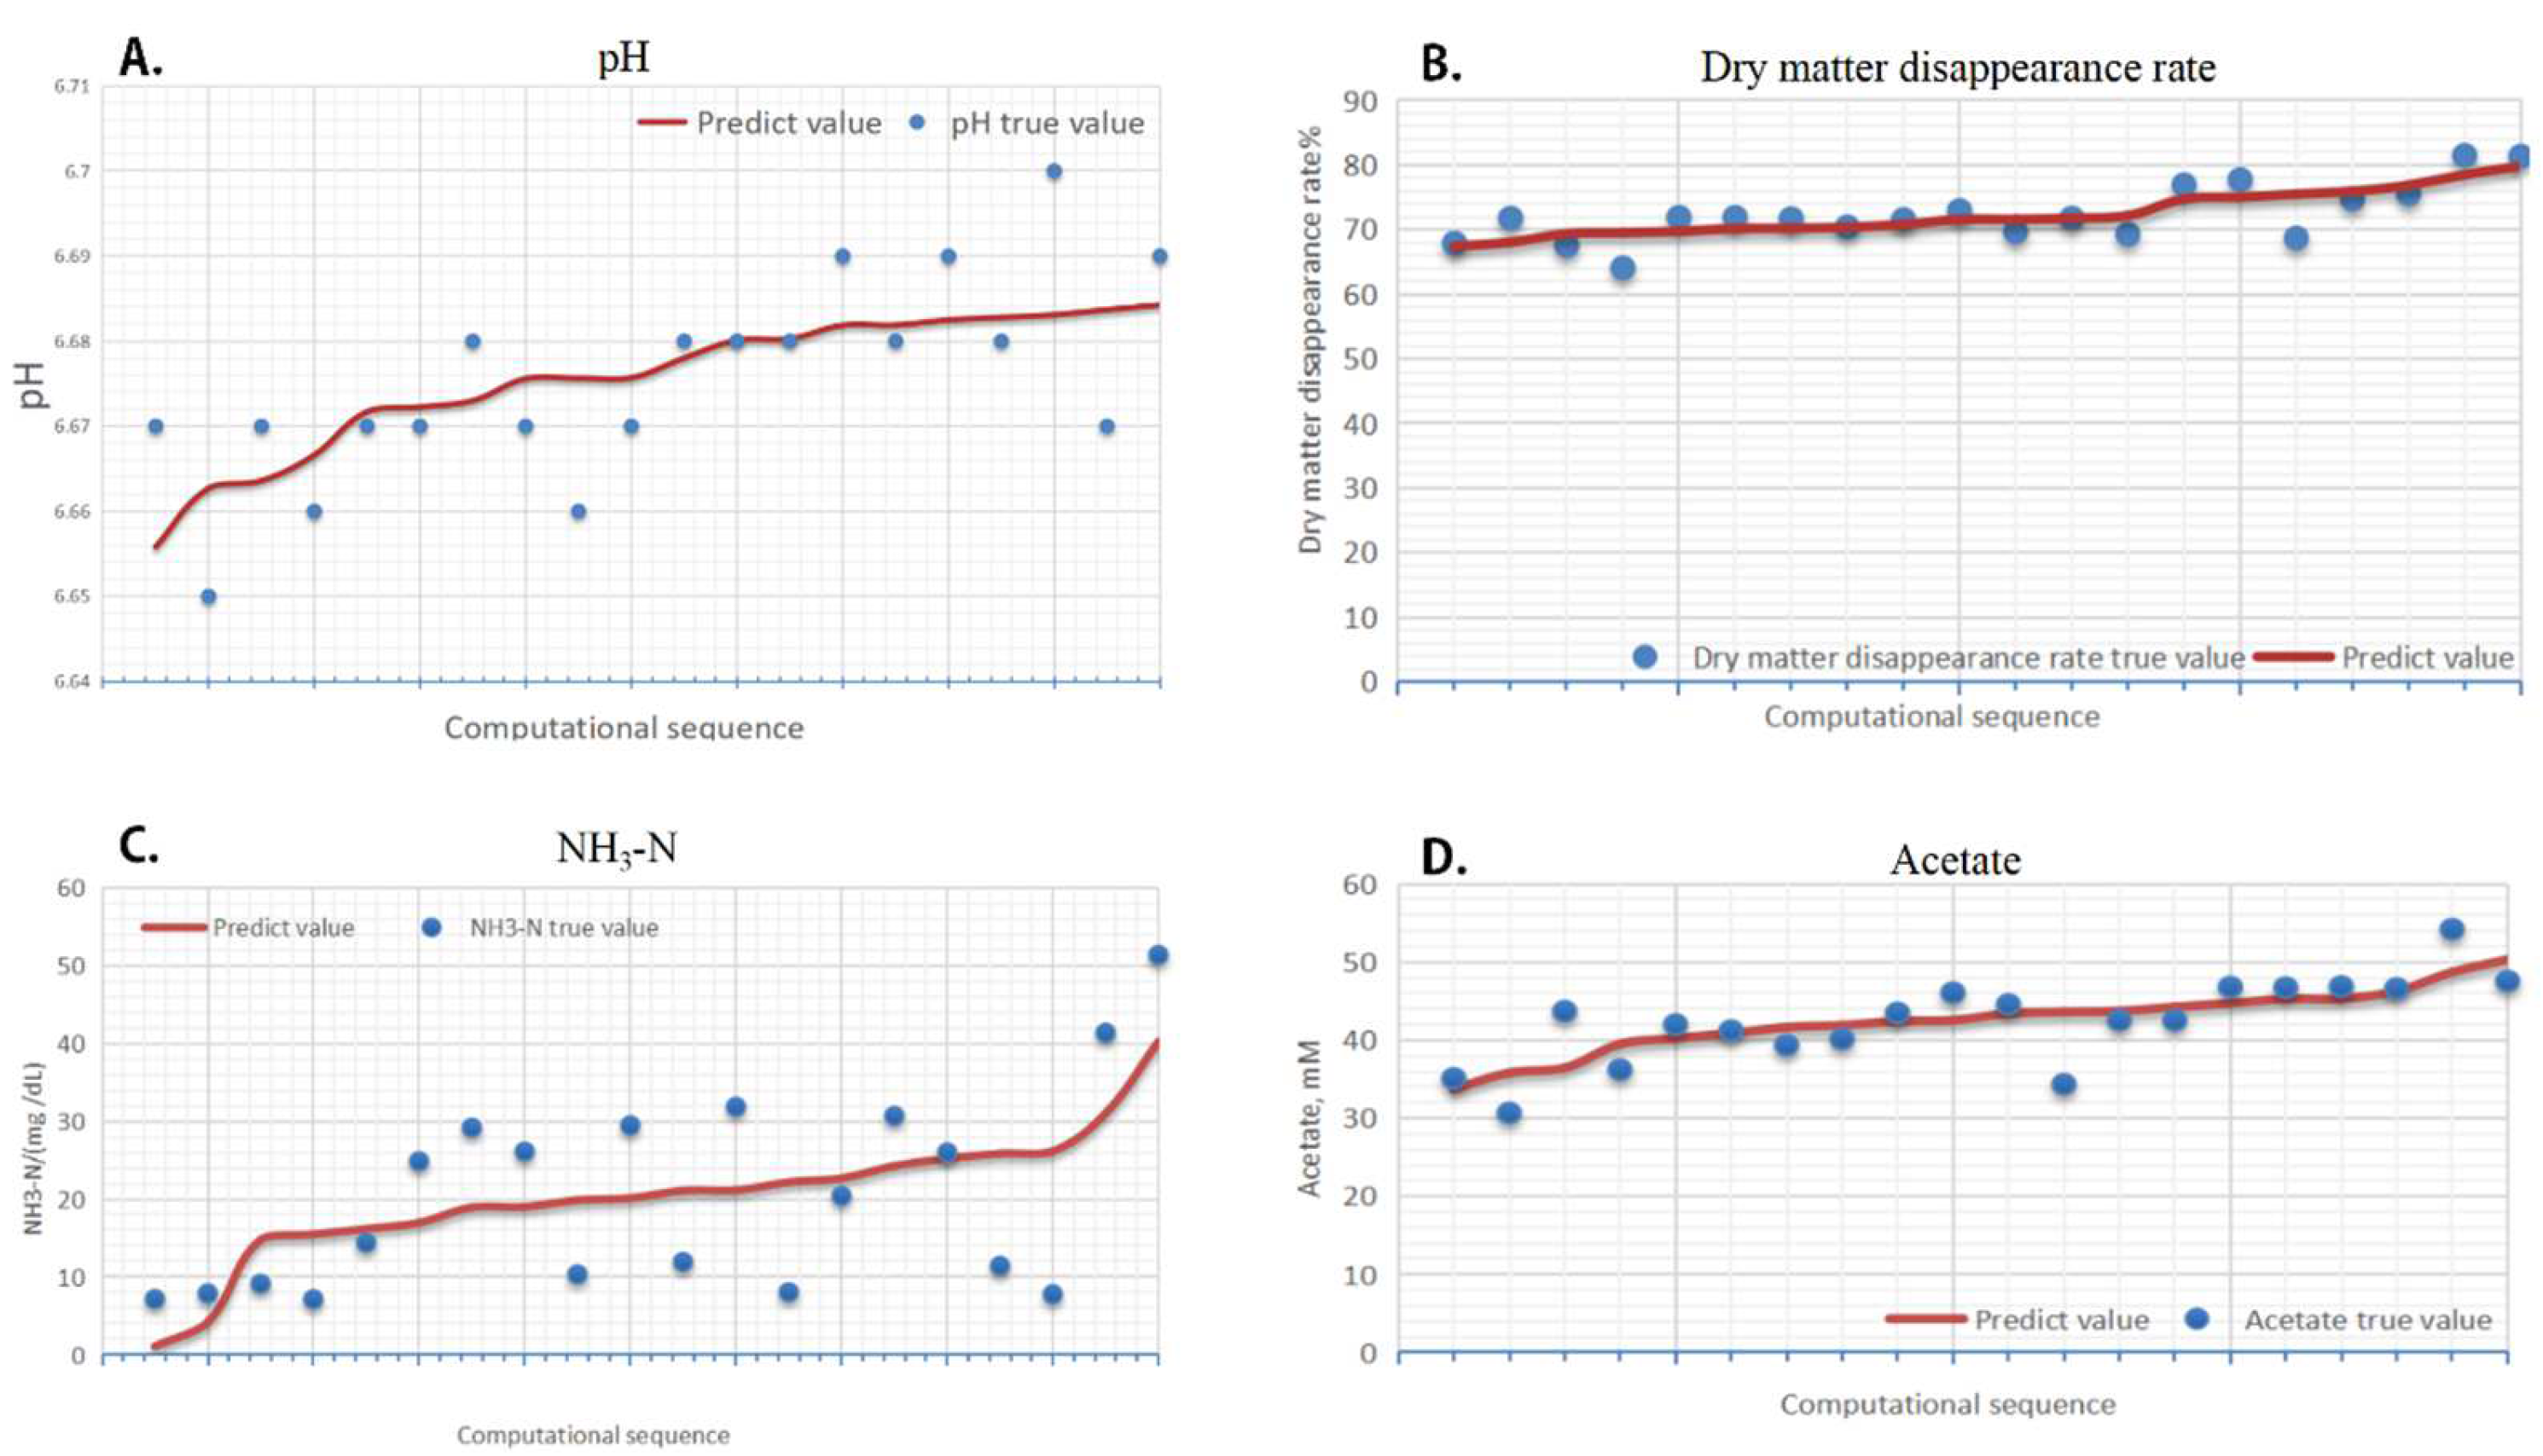
2.7.4. Analysis of Fingerprint–Effect Relationship

In the macroscopic observation of in vitro fermentation index, S17 and S19 showed the highest dry matter digestibility, while S14 had the lowest. Samples S17 and S19 had higher peak areas for P3, P9, and P13 compared to the average, while S14 had lower P3 and P13 and higher P6 and P7. The results of NH3-N concentration for 24 h in vitro fermentation of different TMR diets showed that S1–S10 had lower NH3-N concentration compared to S11–S19. The total area of S11–S19 peaks was larger than that of S1–S10 peaks, indicating that the concentration of natural plant active substances affected the concentration of NH3-N in in vitro fermentation (Figure 8A). Since the experimental samples were natural plant active ingredients of TMR extracted using methanol, most of the active substances may be flavonoids. Based on the above results, we continued to explore the correlation between total flavonoids and in vitro fermentation parameters. The results proved the positive effect of the natural active substance concentration on the NH3-N concentration and also verified the higher flavonoid content in the extracts of this sample.
Based on the hierarchical clustering and fixed model analysis results, P2, P6, P8, P9, P10, and P11 are considered possible factors causing the effect. Furthermore, the fermentation parameter data of samples with highly effective peak content were compared, and the results showed that S13, S16, S17, and S19, which had higher expression of P2, P6, P8, P9, P10, and P11, converged at the fermentation level (Figure 8B). This mainly indicates that dry matter digestibility is higher than average, and NH3-N concentration is below average.

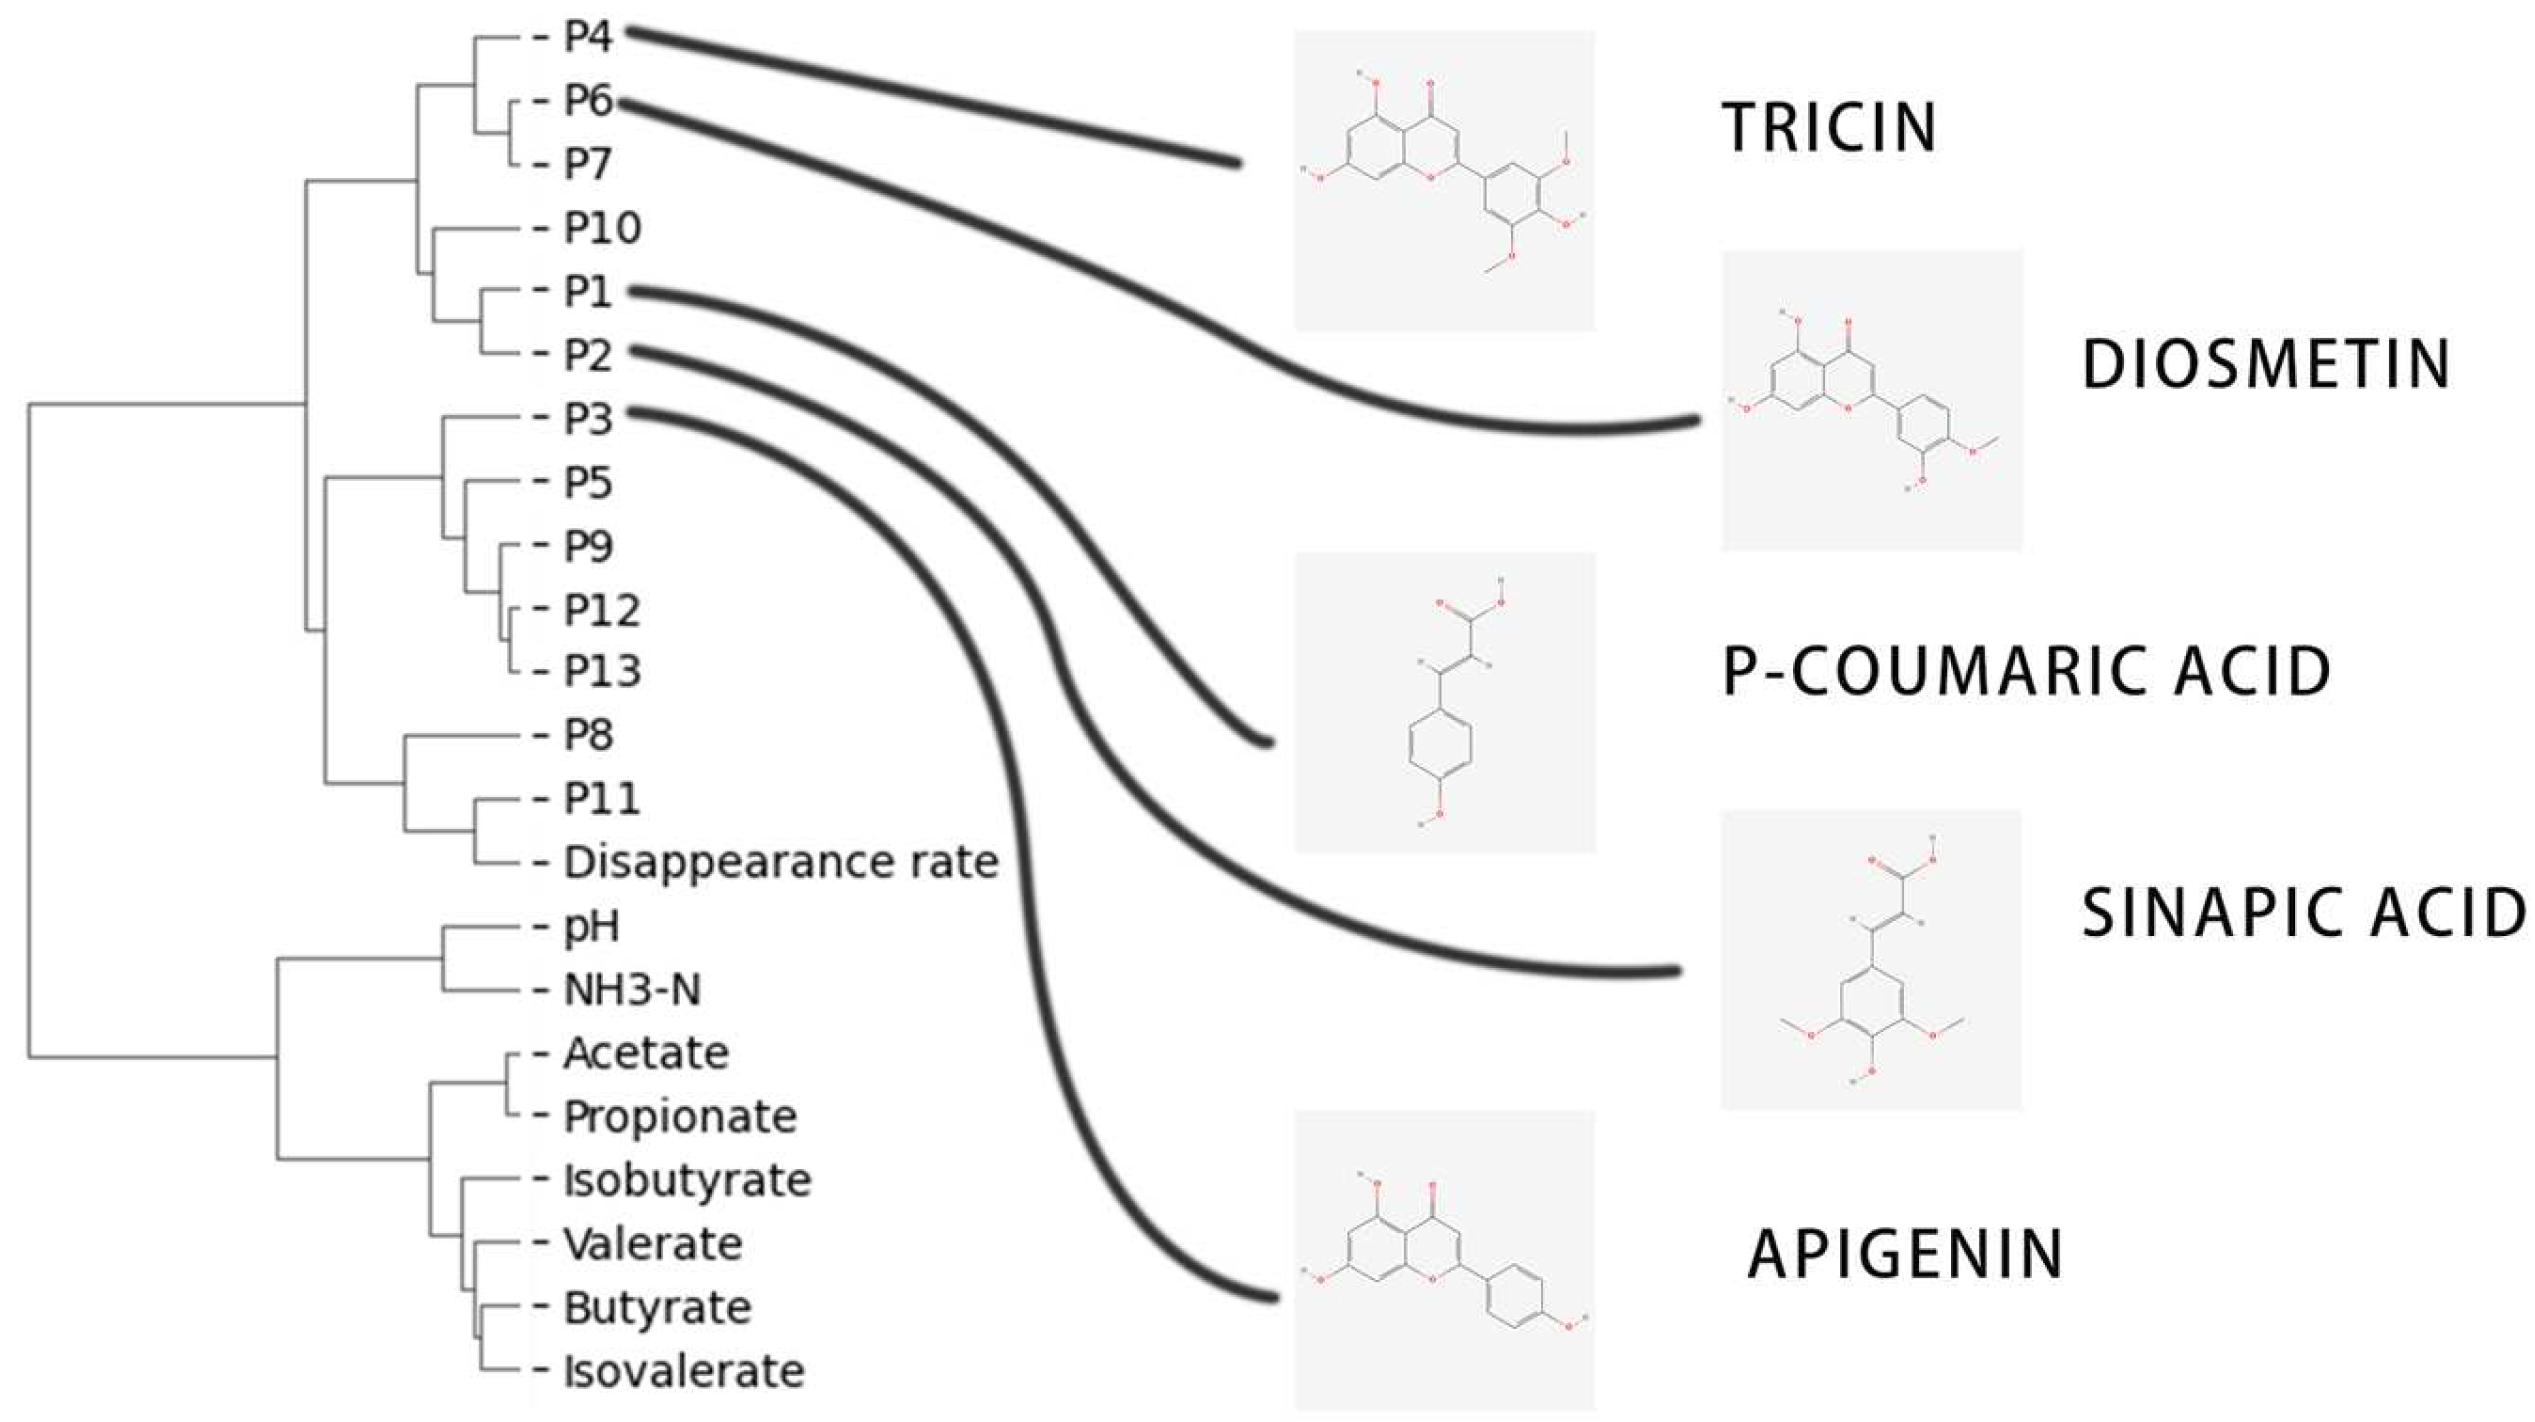
2.8. Structure–Activity Analysis Based on the Hierarchical Clustering Results

The hierarchical clustering results confirm the significant role of tricin and diosmetin in fermentation parameters. However, the influence of natural plant active substances on the apparent index is a complex process, which may involve additive or mutually exclusive effects. To address this issue, the spectral relationship method can provide us with new ideas. By converting the relationship between multiple spectral peaks and the apparent phenomena into mathematical ones, this paper analyzes the apparent factors in the total TMR extract. If the substance is determined through structural analysis, it may be excavated as a new compound that affects its biological phenotype (Figure 9).
In hierarchical clustering analysis, clustering is mainly performed by calculating the Euclidean distances between samples. The hierarchical indicators show a similar trend, from which we can infer the relationship between fermentation parameters and peak spectrum. According to the clustering results, natural plant active substances are generally associated with the digestibility of dry matter, and among them, P11 has the most significant correlation. Clarifying the material types of P11 may provide new insights into the digestibility of in vitro fermentation. However, no structural analysis results of P11 have been found yet; hence, we initially adopted the structural analysis method. Combining the results of the clustering, we inferred that P7 are flavonoids with methoxy links in the B ring, such as luteolin, quercetin, taxifolin, hesperetin, and myricetin. However, the standard used in this study contained luteolin and quercetin, and no valid common peaks were identified in the twenty samples. Therefore, the two compounds were excluded.
P10 is a derivative of 4-hydroxy cassia bark acid as the basic structure, such as ferulic acid, isoferulic acid, methyl sinapic acid, methyl 4-hydroxycinnamate, and p-hydroxybenzalacetone. On the other hand, P5, P9, P12, and P13 may be hydroxyflavones, but their range is too broad to be listed in this article (Table 9).

3. Discussion

Dairy cows’ TMR diet is composed of a variety of feed materials in a specific proportion. This study is the first to investigate nutritionally active substances in TMR. The study confirms the existence of p-coumaric acid, sinapic acid, luteolin, quercetin, apigenin, tricin, and diosmetin in the TMR diet for dairy cows. Compound p-coumaric acid is mainly found in fruits, vegetables, grains, and fungi [46], and a small amount of sinapic acid is detected in rapeseed meal. Luteolin, quercetin, apigenin, and tricin have all been detected in alfalfa, while diosmetin is primarily found in chrysanthemum and peanut [27]. Therefore, these components in TMR may also originate from these feed ingredients.
By conducting similarity evaluation and cluster analysis, we found similarities and differences in TMR from different sources. Similarities may be due to ingredient similarities. However, differences are likely attributed to the ingredients in TMR. Samples 1–12 come from different cattle farms of the same company, and they had the same source of feed raw materials for preparing TMR, and they were grouped together. On the other hand, samples 13–20 come from different cattle farms of different companies and are randomly distributed in different groups. This indicated that feed raw materials could be an essential factor in distinguishing the quality of different TMR diets [47]. Therefore, when formulating the TMR diet formula, we should pay attention to the quality of feed ingredients.
Different TMR samples due to the different content of flavonoids or active ingredients, which affected the dry matter digestibility, NH3-N, and other indicators, demonstrated biological activity to some extent in in vitro fermentation [48]. The peak area in the fingerprint map partly represents the content ratio of the active species [49,50,51]. Therefore, the correlation between the level differences monitored at the apparent level and the natural plant active substances can be explored using the spectrum–effect relationship method [52]. The research of Yunfei Song [53] showed the integration of the relationship between metabolomics and spectral effect, exploration of the potential hepatotoxicity components of Polygonum multiflorum, and finally excavation of 14 components with significant hepatotoxicity, which can be used as toxicity markers or mechanisms in further research. Likewise, this allows us to explain the biological function of natural plants and forecast their active substances. In this study, most of the fermentation parameters affected by the study variables were focused on dry matter digestibility and NH3-N, where the statistically significant compounds had similar active structures.
Dry matter digestibility is a measure of the amount of dry matter from a feedstuff that is digested by rumen fermentation in vitro. Generally, the decrease in the dry matter and degradability upon addition of flavonoids could be attributed to the antimicrobial action of flavonoids [54,55]. In the present study, sinapic acid was found to affect the dry matter digestibility. Sinapic acid is a phenolic acid commonly found in plants, such as grasses and cereal grains [56]. Sinapic acid has been shown to have antioxidant properties, which may help protect rumen microorganisms from oxidative stress and improve their ability to ferment feed [57]. Ruminal NH3-N concentration is a crude predictor of the efficiency of dietary N conversion into microbial N [58]. Monitoring ruminal NH3-N levels can help ensure efficient microbial protein synthesis and reduce the risk of health problems associated with excessive ammonia levels [59]. In this study, diosmetin was found to be related to ruminal NH3-N levels. Diosmetin [60] is a flavonoid found in a variety of plant foods, including citrus fruits, parsley, and oregano, and has a variety of therapeutic properties, such as antibacterial, anti-infectious, and antioxidant effects. Although there is no evidence that sinapic acid and diosmetin can affect the digestibility of dry substances and NH3-N levels, most in vitro fermentation experiments of flavonoids prove that flavonoids reduce digestibility and rumen ammonia [61,62]. This could ultimately improve the efficiency of rumen fermentation and increase dry matter digestibility, improving rumen NH3-N levels. In the model fitting, apigenin was found to have a negative correlation effect with acetic acid content. Apigenin is often used as an immune-regulatory active agent in various biological processes and has a powerful anti-cancer effect [63]. It can also regulate PPAR γ to attenuate fat deposition [64]. There is no precedent for using apigenin in in vitro rumen fermentation, pointing out that apigenin is metabolized to luteolin by cytochrome P450 enzyme [65] and, therefore, may play a similar function to luteolin.
In this study, we have identified nine important indicators, namely P2, P3, P6, P7, P8, P9, P10, P11, and P13, which significantly affect dry matter digestibility and rumen NH3-N levels. The compound represented by P2 is sinapic acid. Through similarity clustering, we obtained four clusters: (1) P4, P6, P7; (2) P1, P2, P10; (3) P3, P5, P9, P12, P13; and (4) P8, P11. Specifically, P1 refers to p-coumaric acid, P2 to sinapic acid, P3 to apigenin, P4 to tricin, and P6 to diosmetin. Typically, plant flavonoids exist in glycoside forms where the aglycone is linked to a variable sugar moiety by a β-glycosidic bond, mainly at position 3 of the C ring [66]. Therefore, similar flavonoid structures exist in natural plants. Based on this, we predict the potential candidate structures of P7 and P10. We suggest that P7 and P10 as potential indicators of fermentation parameters should be experimentally verified. Additionally, compounds such as P11 and P13 that lack structural explanations must find their corresponding compounds through methods such as structure analysis, which have significant potential to impact the in vitro fermentation parameters.
An unbalanced immune system can lead to many diseases [67], and nutritional manipulation may play an important role in regulating immunity by interfering with the synthesis of proinflammatory cytokines, immune cell regulation, and gene expression [68,69]. Numerous studies have shown that flavonoids have various biological activities and could promote immunity to foreign pathogens through different channels [70,71,72,73,74]. For the first time, the flavonoids in dairy cows’ diets were qualitatively analyzed and quantitated using HPLC, providing a general model for exploring the active ingredients through the combination of chromatography and efficacy. Furthermore, it was verified that the nutricines in the feed might be the key factors in dairy cows’ TMR diet to maintain health and distinguish the nutritional value of different TMRs. This discovery would provide a new method for the diet formula and quality evaluation of TMRs in the future.

4. Materials and Methods

4.1. Materials and Reagents

Coumaric acid (CAS: 501-98-4), sinapic acid (CAS: 530-59-6), luteolin (CAS: 491-70-3), quercetin (CAS: 117-39-5), apigenin (CAS: 520-36-5), tricin (CAS: 520-32-1), and diosmetin (CAS: 520-34-3) were all purchased from Shanghai Yuanye Biotechnology Co., Ltd. (Shanghai, China). The purity of all standards was more than 98%. Methanol, acetonitrile, and formic acid (HPLC-grade) were purchased from Tedia (Fairfield, OH, USA). Ultrapure water was purified using a Milli-Q system (Millipore, Burlington, MA, USA). Other reagents were analytical grade.

4.2. TMR Sample Collection

Samples of TMR diets (collected in the morning, noon, and afternoon and mixed evenly) were obtained from 20 cattle farms in Beijing, China, from January to March 2021. The TMR samples were dried in a convection oven at 65 °C for 24 h, ground to pass through a 40-mesh sieve, and stored in a dryer for subsequent experiments. Table 10 presents the nutritional components of the TMR diets from these 20 cattle farms.

4.3. Preparation of Standard Solution and Sample Solution

In brief, 1.0 mg of each standard compound was dissolved in methanol to obtain seven 0.1 mg/mL standard solutions. Then, we accurately transferred 0.5 mL solution into a 5 mL centrifuge tube, mixing it well, and 2 mL of supernatant was collected and filtered through 0.22 μm to obtain the mixed standard solution. S19 (Table S1 for the composition and nutrient levels of the basal diet) was used to study its optimum extraction process. The 1.0 g air-dried TMR powder was weighed, and then, the TMR powder was extracted using 40 mL 90% ethanol under ultrasonic treatment (KQ-500DE, Kunshan, China) for 40 min. Followed by aspiration filtration, evaporation, and concentration to 5 mL (XMTD-4000, Shanghai, China). Before injection, the extract was filtered through a 0.22 µm filter membrane, serving as the analytical solution for HPLC. Second, the dried feed samples were used as the fermentation substrate.

4.4. Apparatus and Chromatographic Conditions

Agilent 1260 liquid chromatograph (Agilent, Santa Clara, CA, USA) equipped with automatic sampler, column temperature controller, DAD detector, quaternary pump, and online degasser was used for HPLC analysis. Chromatographic separation was performed using a Diamonsil C18 column (250 mm × 4.6 mm, 5 μm). Acetonitrile−0.1% formic acid aqueous solution and acetonitrile−0.5% phosphoric acid aqueous solution were used as mobile phase systems. We found that the acetonitrile−0.1% formic acid aqueous solution could enhance the resolution, and the resulting chromatogram has a better peak shape. To shorten the analysis time while maintaining satisfactory separation, the optimal mobile phase was composed of acetonitrile (A) with 0.1% formic acid aqueous solution and (B) operating under a gradient elution program as follows: 0~15 min, 15–20% B; 15~20 min, 20–20% B; 20~55 min, 20–35% B; 55~60 min, 35–85% B; and 60~95 min, 85% B. Then, equilibrate for 5 min to return the mobile phase to its initial state. The flow rate was 1.0 mL/min. The detection wavelength was 350 nm, column temperature was 25 °C, and injection volume was 20 μL.

4.5. Method Validation for Quantitative Analysis

According to the procedures and referring to the HPLC–UV chromatogram, S19 was used to verify the HPLC-DAD method, including intraday precision, repeatability, and stability. The internal variability of standard solution was used to determine the precision, and 6 copies were injected. The precision was within the range of 0.55–3.84%. The peak areas of a sample at 0, 1, 2, 4, 8, 12, and 24 h were measured and compared, and the stability was in the range of 0.54–4.68%. The relative standard deviation (RSD) was evaluated using 5 parallel samples, and the values were lower than 5%. The results showed that the HPLC fingerprint was effective and suitable for sample analysis. Therefore, using this method, the flavonoids extracted from 20 different air-dried TMR diets were analyzed, and a flavonoid fingerprint was constructed. The content of the compounds represented by the peaks in the flavonoid fingerprint was determined using a standard calibration curve. The spectral data obtained from this analysis along with the fermentation data were further analyzed to assess their correlation.

4.6. Fingerprint Similarity Evaluation and Sample Correlation Clustering Analysis

The TMR samples fingerprint was constructed and evaluated using the Similarity Evaluation System of Chromatographic Fingerprint of Traditional Chinese Medicine (2012 Edition). Correlation analysis was performed using SPSS 26.0. Cluster analysis and multiple regression analysis were performed using R software. * indicates significant correlation at p < 0.05 level. ** indicates significant correlation at p < 0.01 level.

4.7. Experimental Design of Rumen Fermentation In Vitro

Rumen fluid collection: Five healthy Holstein cows with similar body weight were selected as rumen fluid donors. Rumen fluid was collected through the oral cavity 2 h before morning feeding, and 0.5 L rumen fluid was collected from each cow, and it was added into a vacuum flask, uniformly mixed, quickly returned to the laboratory, and filtered with four layers of gauze.
Artificial saliva was prepared according to the method of Menke et al. [75] and continuously injected with CO2 for later use. The composition is shown in Table S2.
The artificial saliva and rumen fluid were fully mixed in a ratio of 2:1, and CO2 was continuously passed through a 39 °C water bath.
A total of 0.5 g of TMR samples was weighed and loaded into fermentation bottles as fermentation substrates, 150 mL of in vitro fermentation fluid was added and the bubbles in the culture tube were drained, and the air outlet was sealed and cultured in a constant temperature water bath in a shaking incubator at 39 °C, with three replicates for each sample.

4.8. Sample Collection and Determination of Rumen Fermentation In Vitro

After fermentation for 24 h, the fermentation flask was placed in an ice–water bath to stop the fermentation, and the pH was immediately determined using a portable pH meter (FiveEasy Plus, Shanghai, China). The fermentation fluid was filtered through four layers of gauze and subpackaged in a centrifuge tube for the determination of NH3-N, VFA, and disappearance rate of dry matter.
The fermentation broth was placed in a 2 mL centrifuge tube and centrifuged at 12,000× g for 20 min. Then, 40 μL of supernatant was mixed with phenol chromogenic reagent (2.5 mL) and then with hypochlorite reagent (2.0 mL), with shaking. After shaking, it was placed in a water bath at 37 °C for 30 min, and the absorbance was measured at the wavelength of 550 nm to calculate NH3-N using MULTISKAN FC (Thermo, Waltham, MA, USA).
The VFA contents in the fermentation fluid were determined using Agilent 7890B gas chromatograph. Measurement conditions: temperature of detection chamber, 220 °C; column temperature, 180 °C; gasification chamber temperature, 200 °C; high-purity nitrogen as the carrier gas with pressure, 90 kPa; total flow rate of 37.2 mL/min; air flow rate of 400 mL/min; hydrogen flow rate of 40 mL/min; purge flow rate of 3 mL/min; shunt ratio of 50:1; and linear velocity of 23.4 cm/s.
The DM disappearance rate was determined using the nylon bag method. The fermentation fluid filter residue in the nylon bag was dried at 65 °C for 4 h and then weighed. The dry matter disappearance rate of the feed to be tested was calculated according to the following formula:
A (%) = [(BC)/B] × 100%
In the formula: A is the dry matter disappearance rate (%) of the feed to be tested; B is the content of nutrients before degradation of the feed to be tested (g); C is the content (g) of nutrients after degradation of the feed to be tested.

4.9. Hierarchical Clustering Analysis of Spectrum–Effect Relationships

Hierarchical clustering analysis (HCA) is a widely used unsupervised learning method that groups similar objects or data points into clusters based on their similarities or dissimilarities. HCA is a bottom-up approach where each observation starts in its cluster, and pairs of clusters are merged based on their similarity. The process continues until all the observations are in a single cluster or each observation is in its cluster. In this study, HCA was used to cluster peak spectrum and fermentation parameters to identify the relationship between peak spectrum and effect. The Python 3.10 software was used for HCA. HCA is useful for identifying patterns in data, and in this study, it helped to identify the functional relationship between the TMR flavonoids and the in vitro fermentation parameters.

4.10. Factor Analysis of Spectral Relationship Based on Optimization Fixed Model Strategy

Mathematics is essentially a multivariate variable model. In order to fit or discover the embedded relationship, we introduce a fixed model method with the essence of least squares. The fixed model belongs to the panel data model analysis, which mainly involves the regression of individual effects. In this experiment, the in vitro fermentation parameters were influenced by various uncontrollable environments, which were summarized as random effects or random residues. After calculating the influence of random residues, we analyzed the causal relationship between peak spectrum and fermentation parameters. Based on our findings, we believe that the fixed model is a suitable method for analyzing spectrum–effect relationships. However, this method still has some limitations as it cannot determine whether the independent variables exist in the outcome effect in advance. Integrating random variables into the model fit can reduce the confidence of the model and also affect the fit of the model to the effective variables. Therefore, in this experiment, we designed an optimization strategy for the fixed model analysis. We first fit the model for useless variable screening, with screening conditions for independent variable confidence above 95%. We delayed the establishment of the optimization model until the model confidence and the independent variable confidence were greater than 95%, and the optimization model was the final result. Finally, we listed the equation and R square. We used the linear models in Python 3.10 software to analyze the influencing factors of fermentation parameter, and the fermentation parameters were analyzed using the least squares fixed model:
y i = μ + a i x i + e
a i x i = A P 1 + B P 2 + C P 3 + D P 4 + E P 5 + F P 6 + G P 7 + H P 8 + I P 9 + J P 10 + K P 11 + L P 12 + M P 13
where yi is the fermentation parameter value; µ is the population mean of milk urea nitrogen; and e is the random residue. Affected factors included the peak areas of the 13 peaks: A, B, C, D, E, F, G, H, I, J, K, L, and M.

5. Conclusions

In this study, a qualitative analysis of seven flavonoids in 20 TMR diets of dairy cows has been conducted, namely, p-coumaric acid, sinapic acid, quercetin, tricin, apigenin, luteolin, and diosmetin. The similarity among the 20 TMR components ranged from 0.633 to 0.995. Furthermore, the 20 batches of TMR samples were divided into four categories in the cluster analysis. The results of the spectrum–effect relationship and optimization model revealed a positive correlation between the total flavonoids in the diet and NH3-N in the fermentation broth. P2, P3, P6, P7, P8, P9, P10, P11, and P13 were identified as the main peaks that affected fermentation parameters. Sinapic acid (compound 2) was found to mainly affect dry matter digestibility along with compounds 11, 10, and 9. NH3-N concentration was primarily affected by compound 6 and compound 8 in TMR where diosmetin (compound 6) was found to be one of the main compounds. Based on the structure–activity relationship, we predicted that the molecules in compound 7 may be taxifolin, hesperetin, or myricetin, while the moleules in compound 10 may be ferulic acid, isoferulic acid, methyl sinapic acid, methyl 4-hydroxycinnamate, or p-hydroxybenzalacetone. Further experimental verification is needed to confirm these predictions. The technical route of this paper is shown in Figure 10.

Supplementary Materials

The following supporting information can be downloaded at: https://www.mdpi.com/article/10.3390/fermentation9060571/s1. Table S1: Composition and nutrient levels of the basal diet; Table S2: Composition and nutrient levels of the basal diet; Table S3: PanelOLS Estimation Summary; Table S4: Moudle Parameter Summary before and after PanelOLS.

Author Contributions

L.J. designed the experiments and provided funding support. X.Z., A.X., S.Y., L.W. and J.W. performed the experiments and wrote the manuscript. Y.Z. modified and polished the article. All authors have read and agreed to the published version of the manuscript.

Funding

This work was financially supported by the National “Thirteenth Five-Year Plan” Key R & D Plan (2017YFD 0701604-2).

Institutional Review Board Statement

This study based on research of components in dairy cows TMR did not change the normal feeding, nutrition, and physiological and biological processes of dairy cows and did not involve individual feeding experiments. All the data obtained in this paper are obtained from the normal production data of dairy farms and are part of the normal breeding patterns of dairy farms. Therefore, this study does not involve ethical issues related to animals and humans.

Informed Consent Statement

Not applicable.

Data Availability Statement

Not applicable.

Acknowledgments

This work was supported by the national key research and development plan of the 13th Five-Year Plan (2017YFD 0701604-2) and Dairy Cow Innovation Team of Beijing Modern Agricultural Industry Technology System.

Conflicts of Interest

The all authors declare that the research was conducted in the absence of any commercial or financial relationships that could be construed as a potential conflict of interest.

References

  1. Clay, N.; Garnett, T.; Lorimer, J. Dairy intensification: Drivers, impacts and alternatives. Ambio 2020, 49, 35–48. [Google Scholar] [CrossRef] [PubMed] [Green Version]
  2. Berding, K.; Vlckova, K.; Marx, W.; Schellekens, H.; Stanton, C.; Clarke, G.; Jacka, F.; Dinan, T.G.; Cryan, J.F. Diet and the Microbiota-Gut-Brain Axis: Sowing the Seeds of Good Mental Health. Adv. Nutr. 2021, 12, 1239–1285. [Google Scholar] [CrossRef] [PubMed]
  3. Hu, Y.; Cheng, H. Health risk from veterinary antimicrobial use in China’s food animal production and its reduction. Environ. Pollut. 2016, 219, 993–997. [Google Scholar] [CrossRef]
  4. Nisbet, D.J.; Callaway, T.R.; Edrington, T.S.; Anderson, R.C.; Krueger, N. Effects of the dicarboxylic acids malate and fumarate on E. coli O157:H7 and Salmonella enterica typhimurium populations in pure culture and in mixed ruminal microorganism fermentations. Curr. Microbiol. 2009, 58, 488–492. [Google Scholar] [CrossRef]
  5. El-Kafrawy, S.A.; Abbas, A.T.; Oelkrug, C.; Tahoon, M.; Ezzat, S.; Zumla, A.; Azhar, E.I. IgY antibodies: The promising potential to overcome antibiotic resistance. Front. Immunol. 2023, 14, 1065353. [Google Scholar] [CrossRef]
  6. Batiha, G.E.; Alkazmi, L.M.; Wasef, L.G.; Beshbishy, A.M.; Nadwa, E.H.; Rashwan, E.K. Syzygium aromaticum L. (Myrtaceae): Traditional Uses, Bioactive Chemical Constituents, Pharmacological and Toxicological Activities. Biomolecules 2020, 10, 202. [Google Scholar] [CrossRef] [Green Version]
  7. Hume, M.E. Food Safety Symposium: Potential Impact of Reduced Antibiotic Use and the Roles of Prebiotics, Probiotics, and Other Alternatives in Antibiotic-Free Broiler Production. Poult. Sci. 2011, 90, 2663–2669. [Google Scholar] [CrossRef]
  8. Arsène, M.M.J.; Davares, A.K.L.; Andreevna, S.L.; Vladimirovich, E.A.; Carime, B.Z.; Marouf, R.; Khelifi, I. The use of probiotics in animal feeding for safe production and as potential alternatives to antibiotics. Vet. World 2021, 14, 319–328. [Google Scholar] [CrossRef]
  9. Adams, C.A. Nutrition-based health in animal production. Nutr. Res. Rev. 2006, 19, 79–89. [Google Scholar] [CrossRef] [Green Version]
  10. Bitsie, B.; Osorio, A.M.; Henry, D.D.; Silva, B.C.; Godoi, L.A.; Supapong, C.; Brand, T.; Schoonmaker, J.P. Enteric methane emissions, growth, and carcass characteristics of feedlot steers fed a garlic- and citrus-based feed additive in diets with three different forage concentrations. J. Anim. Sci. 2022, 100, skac139. [Google Scholar] [CrossRef] [PubMed]
  11. Oh, J.; Harper, M.; Giallongo, F.; Bravo, D.M.; Wall, E.H.; Hristov, A.N. Effects of rumen-protected Capsicum oleoresin on immune responses in dairy cows intravenously challenged with lipopolysaccharide. J. Dairy. Sci. 2017, 100, 1902–1913. [Google Scholar] [CrossRef] [PubMed]
  12. Patra, A.K.; Amasheh, S.; Aschenbach, J.R. Modulation of gastrointestinal barrier and nutrient transport function in farm animals by natural plant bioactive compounds—A comprehensive review. Crit. Rev. Food Sci. Nutr. 2019, 59, 3237–3266. [Google Scholar] [CrossRef] [PubMed]
  13. Yang, Y.; Kessler, M.G.C.; Marchán-Rivadeneira, M.R.; Han, Y. Combating Antimicrobial Resistance in the Post-Genomic Era: Rapid Antibiotic Discovery. Molecules 2023, 28, 4183. [Google Scholar] [CrossRef]
  14. Mustafa, A.M.; Abouelenein, D.; Acquaticci, L.; Alessandroni, L.; Angeloni, S.; Borsetta, G.; Caprioli, G.; Nzekoue, F.K.; Sagratini, G.; Vittori, S. Polyphenols, Saponins and Phytosterols in Lentils and Their Health Benefits: An Overview. Pharmaceuticals 2022, 15, 1225. [Google Scholar] [CrossRef] [PubMed]
  15. Serafini, M.; Peluso, I.; Raguzzini, A. Flavonoids as anti-inflammatory agents. Proc. Nutr. Soc. 2010, 69, 273–278. [Google Scholar] [CrossRef] [PubMed] [Green Version]
  16. Wang, H.; Lu, P.; Li, Z.; Yuan, C.; Liu, H.; Zhao, J.; Lu, W.; Wang, J. Oligomeric Proanthocyanidins and Bamboo Leaf Flavonoids Improve the Quality of Bull Semen Cryopreservation. Molecules 2022, 27, 1144. [Google Scholar] [CrossRef]
  17. Langhans, W. Food Components in Health Promotion and Disease Prevention. J. Agric. Food Chem. 2018, 66, 2287–2294. [Google Scholar] [CrossRef]
  18. Liu, K.; Pi, F.; Zhang, H.; Ji, J.; Xia, S.; Cui, F.; Sun, J.; Sun, X. Metabolomics Analysis To Evaluate the Anti-Inflammatory Effects of Polyphenols: Glabridin Reversed Metabolism Change Caused by LPS in RAW 264.7 Cells. J. Agric. Food Chem. 2017, 65, 6070–6079. [Google Scholar] [CrossRef]
  19. Kong, L.; Yang, C.; Dong, L.; Diao, Q.; Si, B.; Ma, J.; Tu, Y. Rumen Fermentation Characteristics in Pre- and Post-Weaning Calves upon Feeding with Mulberry Leaf Flavonoids and Candida tropicalis Individually or in Combination as a Supplement. Animals 2019, 9, 990. [Google Scholar] [CrossRef] [Green Version]
  20. Lu, D. A major breakthrough in the strategic direction of the development of animal nutrition: The construction of animal health nutrition theory and technology system and its practical application. Chin. J. Anim. Nutr. 2021, 33, 1–12. [Google Scholar]
  21. Tedesco, D.; Tava, A.; Galletti, S.; Tameni, M.; Varisco, G.; Costa, A.; Steidler, S. Effects of silymarin, a natural hepatoprotector, in periparturient dairy cows. J. Dairy Sci. 2004, 87, 2239–2247. [Google Scholar] [CrossRef] [PubMed] [Green Version]
  22. Balcells, J.; Aris, A.; Serrano, A.; Seradj, A.R.; Crespo, J.; Devant, M. Effects of an extract of plant flavonoids (Bioflavex) on rumen fermentation and performance in heifers fed high-concentrate diets. J. Anim. Sci. 2012, 90, 4975–4984. [Google Scholar] [CrossRef] [PubMed]
  23. Kumar, M.; Dahuja, A.; Tiwari, S.; Punia, S.; Tak, Y.; Amarowicz, R.; Bhoite, A.G.; Singh, S.; Joshi, S.; Panesar, P.S.; et al. Recent trends in extraction of plant bioactives using green technologies: A review. Food Chem. 2021, 353, 129431. [Google Scholar] [CrossRef] [PubMed]
  24. Shu, G.; Kong, F.; Xu, D.; Yin, L.; He, C.; Lin, J.; Fu, H.; Wang, K.; Tian, Y.; Zhao, X. Bamboo leaf flavone changed the community of cecum microbiota and improved the immune function in broilers. Sci. Rep. 2020, 10, 12324. [Google Scholar] [CrossRef]
  25. Burkina, V.; Zlabek, V.; Halsne, R.; Ropstad, E.; Zamaratskaia, G. In vitro effects of the citrus flavonoids diosmin, naringenin and naringin on the hepatic drug-metabolizing CYP3A enzyme in human, pig, mouse and fish. Biochem. Pharmacol. 2016, 110–111, 109–116. [Google Scholar] [CrossRef]
  26. Chen, Y.; Guo, Y.; Song, Z.; Chang, H.; Kuang, Q.; Zheng, Z.; Wang, H.; Zhang, G. Luteolin restricts ASFV replication by regulating the NF-κB/STAT3/ATF6 signaling pathway. Vet. Microbiol. 2022, 273, 109527. [Google Scholar] [CrossRef]
  27. Formato, M.; Cimmino, G.; Brahmi-Chendouh, N.; Piccolella, S.; Pacifico, S. Polyphenols for Livestock Feed: Sustainable Perspectives for Animal Husbandry? Molecules 2022, 27, 7752. [Google Scholar] [CrossRef]
  28. Zhan, J.; Liu, M.; Wu, C.; Su, X.; Zhan, K.; Zhao, G.Q. Effects of alfalfa flavonoids extract on the microbial flora of dairy cow rumen. Asian-Australas. J. Anim. Sci. 2017, 30, 1261–1269. [Google Scholar] [CrossRef] [Green Version]
  29. Van Hung, P. Phenolic Compounds of Cereals and Their Antioxidant Capacity. Crit. Rev. Food Sci. Nutr. 2016, 56, 25–35. [Google Scholar] [CrossRef]
  30. Ramachandran, S.; Meenatchisundaram, S.; Allu, R.; Thatipelli, S.; Mandal, A.K. Proximate analysis, HPTLC finger print analysis and multi spectrometric analysis of Strychnos nux-vomica nuts. J. Complement. Integr. Med. 2022, 19, 233–242. [Google Scholar] [CrossRef]
  31. Xie, P.; Chen, S.; Liang, Y.Z.; Wang, X.; Tian, R.; Upton, R. Chromatographic fingerprint analysis--a rational approach for quality assessment of traditional Chinese herbal medicine. J. Chromatogr. A 2006, 1112, 171–180. [Google Scholar] [CrossRef]
  32. Zhong, X.K.; Li, D.C.; Jiang, J.G. Identification and quality control of Chinese medicine based on the fingerprint techniques. Curr. Med. Chem. 2009, 16, 3064–3075. [Google Scholar] [CrossRef] [PubMed]
  33. Liang, Y.Z.; Xie, P.S.; Chan, K. Perspective of chemical fingerprinting of Chinese herbs. Planta Med. 2010, 76, 1997–2003. [Google Scholar] [CrossRef] [PubMed] [Green Version]
  34. González, L.A.; Kyriazakis, I.; Tedeschi, L.O. Review: Precision nutrition of ruminants: Approaches, challenges and potential gains. Animal 2018, 12, s246–s261. [Google Scholar] [CrossRef] [PubMed] [Green Version]
  35. Li, C.Q.; Yao, C.; Zhu, R.Y.; Huang, Y.X.; Kang, W.Y.; Wang, J.M. Spectrum-effect relationship in antioxidant activity of Ligustri Lucidi Fructus based on DPPH, ABTS and FRAP assays. Zhongguo Zhong Yao Za Zhi 2016, 41, 1670–1677. [Google Scholar] [CrossRef] [PubMed]
  36. Luteolin|C15H10O6|CID 5280445-PubChem. Available online: https://pubchem.ncbi.nlm.nih.gov/compound/5280445 (accessed on 9 May 2023).
  37. Quercetin|C15H10O7|CID 5280343-PubChem. Available online: https://pubchem.ncbi.nlm.nih.gov/compound/5280343 (accessed on 9 May 2023).
  38. Taxifolin|C15H12O7|CID 439533-PubChem. Available online: https://pubchem.ncbi.nlm.nih.gov/compound/439533 (accessed on 9 May 2023).
  39. Hesperetin|C16H14O6|CID 72281-PubChem. Available online: https://pubchem.ncbi.nlm.nih.gov/compound/72281 (accessed on 9 May 2023).
  40. Myricetin|C15H10O8|CID 5281672-PubChem. Available online: https://pubchem.ncbi.nlm.nih.gov/compound/5281672 (accessed on 9 May 2023).
  41. Ferulic Acid|C10H10O4|CID 445858-PubChem. Available online: https://pubchem.ncbi.nlm.nih.gov/compound/445858 (accessed on 9 May 2023).
  42. Isoferulic Acid|C10H10O4|CID 736186-PubChem. Available online: https://pubchem.ncbi.nlm.nih.gov/compound/736186 (accessed on 9 May 2023).
  43. Methyl Sinapic Acid|C12H14O5|CID 15711802-PubChem. Available online: https://pubchem.ncbi.nlm.nih.gov/compound/15711802 (accessed on 9 May 2023).
  44. Methyl 4-Hydroxycinnamate|C10H10O3|CID 5319562-PubChem. Available online: https://pubchem.ncbi.nlm.nih.gov/compound/5319562 (accessed on 9 May 2023).
  45. p-Hydroxybenzalacetone|C10H10O2|CID 796857-PubChem. Available online: https://pubchem.ncbi.nlm.nih.gov/compound/796857 (accessed on 9 May 2023).
  46. Guan, X.-Q.; Mao, J.-L.; Tang, Y.-X.; Wang, J.-H.; Sun, R. Research progress on pharmacological effects of p-coumaric acid. Chin. Tradit. Herb. Drugs 2018, 49, 4162–4170. [Google Scholar]
  47. O’Callaghan, T.F.; Hennessy, D.; McAuliffe, S.; Kilcawley, K.N.; O’Donovan, M.; Dillon, P.; Ross, R.P.; Stanton, C. Effect of pasture versus indoor feeding systems on raw milk composition and quality over an entire lactation. J. Dairy Sci. 2016, 99, 9424–9440. [Google Scholar] [CrossRef] [Green Version]
  48. Oskoueian, E.; Abdullah, N.; Oskoueian, A. Effects of flavonoids on rumen fermentation activity, methane production, and microbial population. Biomed. Res. Int. 2013, 2013, 349129. [Google Scholar] [CrossRef] [Green Version]
  49. Yan, H.; Zou, C. Progress and prospect of application of traditional Chinese medicine fingerprint (specific chromatogram) in Chinese Pharmacopoeia (2010–2020). Nan Fang Yi Ke Da Xue Xue Bao 2022, 42, 150–155. [Google Scholar] [CrossRef]
  50. Yang, H.; Yang, T.; Gong, D.; Li, X.; Sun, G.; Guo, P. A trinity fingerprint evaluation system of traditional Chinese medicine. J. Chromatogr. A 2022, 1673, 463118. [Google Scholar] [CrossRef]
  51. Ma, J.; Li, K.; Shi, S.; Li, J.; Tang, S.; Liu, L. The Application of UHPLC-HRMS for Quality Control of Traditional Chinese Medicine. Front. Pharmacol. 2022, 13, 922488. [Google Scholar] [CrossRef]
  52. Yuan, X.; Han, B.; Feng, Z.M.; Jiang, J.S.; Yang, Y.N.; Zhang, P.C. Chemical constituents of Ligusticum chuanxiong and their anti-inflammation and hepatoprotective activities. Bioorg Chem. 2020, 101, 104016. [Google Scholar] [CrossRef] [PubMed]
  53. Song, Y.; Yang, J.; Hu, X.; Gao, H.; Wang, P.; Wang, X.; Liu, Y.; Cheng, X.; Wei, F.; Ma, S. A stepwise strategy integrating metabolomics and pseudotargeted spectrum-effect relationship to elucidate the potential hepatotoxic components in Polygonum multiflorum. Front. Pharmacol. 2022, 13, 935336. [Google Scholar] [CrossRef] [PubMed]
  54. Cushnie, T.P.; Lamb, A.J. Recent advances in understanding the antibacterial properties of flavonoids. Int. J. Antimicrob. Agents 2011, 38, 99–107. [Google Scholar] [CrossRef] [PubMed]
  55. Cushnie, T.P.; Lamb, A.J. Antimicrobial activity of flavonoids. Int. J. Antimicrob. Agents 2005, 26, 343–356. [Google Scholar] [CrossRef] [PubMed]
  56. Pandi, A.; Kalappan, V.M. Pharmacological and therapeutic applications of Sinapic acid-an updated review. Mol. Biol. Rep. 2021, 48, 3733–3745. [Google Scholar] [CrossRef] [PubMed]
  57. Peyrot, C.; Mention, M.M.; Brunissen, F.; Allais, F. Sinapic Acid Esters: Octinoxate Substitutes Combining Suitable UV Protection and Antioxidant Activity. Antioxidants 2020, 9, 782. [Google Scholar] [CrossRef]
  58. Firkins, J.L.; Yu, Z.; Morrison, M. Ruminal nitrogen metabolism: Perspectives for integration of microbiology and nutrition for dairy. J. Dairy Sci. 2007, 90 (Suppl. 1), E1–E16. [Google Scholar] [CrossRef] [PubMed]
  59. Zhang, Z.; Wei, W.; Yang, S.; Huang, Z.; Li, C.; Yu, X.; Qi, R.; Liu, W.; Loor, J.J.; Wang, M.; et al. Regulation of Dietary Protein Solubility Improves Ruminal Nitrogen Metabolism In Vitro: Role of Bacteria-Protozoa Interactions. Nutrients 2022, 14, 2972. [Google Scholar] [CrossRef]
  60. Lee, D.H.; Park, J.K.; Choi, J.; Jang, H.; Seol, J.W. Anti-inflammatory effects of natural flavonoid diosmetin in IL-4 and LPS-induced macrophage activation and atopic dermatitis model. Int. Immunopharmacol. 2020, 89, 107046. [Google Scholar] [CrossRef]
  61. Formato, M.; Vastolo, A.; Piccolella, S.; Calabrò, S.; Cutrignelli, M.I.; Zidorn, C.; Pacifico, S. Castanea sativa Mill. Leaf: UHPLC-HR MS/MS Analysis and Effects on In Vitro Rumen Fermentation and Methanogenesis. Molecules 2022, 27, 8662. [Google Scholar] [CrossRef] [PubMed]
  62. Formato, M.; Piccolella, S.; Zidorn, C.; Vastolo, A.; Calabrò, S.; Cutrignelli, M.I.; Pacifico, S. UHPLC-ESI-QqTOF Analysis and In Vitro Rumen Fermentation for Exploiting Fagus sylvatica Leaf in Ruminant Diet. Molecules 2022, 27, 2217. [Google Scholar] [CrossRef]
  63. Salehi, B.; Venditti, A.; Sharifi-Rad, M.; Kręgiel, D.; Sharifi-Rad, J.; Durazzo, A.; Lucarini, M.; Santini, A.; Souto, E.B.; Novellino, E.; et al. The Therapeutic Potential of Apigenin. Int. J. Mol. Sci. 2019, 20, 1305. [Google Scholar] [CrossRef] [Green Version]
  64. Su, T.; Huang, C.; Yang, C.; Jiang, T.; Su, J.; Chen, M.; Fatima, S.; Gong, R.; Hu, X.; Bian, Z.; et al. Apigenin inhibits STAT3/CD36 signaling axis and reduces visceral obesity. Pharmacol. Res. 2020, 152, 104586. [Google Scholar] [CrossRef] [PubMed]
  65. Breinholt, V.M.; Offord, E.A.; Brouwer, C.; Nielsen, S.E.; Brøsen, K.; Friedberg, T. In vitro investigation of cytochrome P450-mediated metabolism of dietary flavonoids. Food Chem. Toxicol. 2002, 40, 609–616. [Google Scholar] [CrossRef] [PubMed]
  66. Berger, L.M.; Wein, S.; Blank, R.; Metges, C.C.; Wolffram, S. Bioavailability of the flavonol quercetin in cows after intraruminal application of quercetin aglycone and rutin. J. Dairy Sci. 2012, 95, 5047–5055. [Google Scholar] [CrossRef] [Green Version]
  67. Albert-Vega, C.; Tawfik, D.M.; Trouillet-Assant, S.; Vachot, L.; Mallet, F.; Textoris, J. Immune Functional Assays, From Custom to Standardized Tests for Precision Medicine. Front. Immunol. 2018, 9, 2367. [Google Scholar] [CrossRef] [Green Version]
  68. Ding, S.; Jiang, H.; Fang, J. Regulation of Immune Function by Polyphenols. J. Immunol. Res. 2018, 2018, 1264074. [Google Scholar] [CrossRef] [Green Version]
  69. Duraiswamy, A.; Sneha, A.N.; Jebakani, K.S.; Selvaraj, S.; Pramitha, J.L.; Selvaraj, R.; Petchiammal, K.I.; Kather Sheriff, S.; Thinakaran, J.; Rathinamoorthy, S.; et al. Genetic manipulation of anti-nutritional factors in major crops for a sustainable diet in future. Front. Plant. Sci. 2022, 13, 1070398. [Google Scholar] [CrossRef]
  70. Williams, A.R.; Krych, L.; Fauzan Ahmad, H.; Nejsum, P.; Skovgaard, K.; Nielsen, D.S.; Thamsborg, S.M. A polyphenol-enriched diet and Ascaris suum infection modulate mucosal immune responses and gut microbiota composition in pigs. PLoS ONE 2017, 12, e0186546. [Google Scholar] [CrossRef] [Green Version]
  71. Xu, G.; Ren, G.; Xu, X.; Yuan, H.; Wang, Z.; Kang, L.; Yu, W.; Tian, K. Combination of curcumin and green tea catechins prevents dimethylhydrazine-induced colon carcinogenesis. Food Chem. Toxicol. 2010, 48, 390–395. [Google Scholar] [CrossRef]
  72. Pérez-Berezo, T.; Franch, A.; Castellote, C.; Castell, M.; Pérez-Cano, F.J. Mechanisms involved in down-regulation of intestinal IgA in rats by high cocoa intake. J. Nutr. Biochem. 2012, 23, 838–844. [Google Scholar] [CrossRef] [PubMed] [Green Version]
  73. Camps-Bossacoma, M.; Pérez-Cano, F.J.; Franch, À.; Castell, M. Theobromine Is Responsible for the Effects of Cocoa on the Antibody Immune Status of Rats. J. Nutr. 2018, 148, 464–471. [Google Scholar] [CrossRef] [PubMed] [Green Version]
  74. Lv, H.W.; Wang, Q.L.; Luo, M.; Zhu, M.D.; Liang, H.M.; Li, W.J.; Cai, H.; Zhou, Z.B.; Wang, H.; Tong, S.Q.; et al. Phytochemistry and pharmacology of natural prenylated flavonoids. Arch. Pharm. Res. 2023, 46, 207–272. [Google Scholar] [CrossRef]
  75. Menke, K.H.; Steingass, H.; Fritz, D.; Schneider, W.; Raab, L.; Salewski, A. The estimation of the digestibility and metabolizable energy contentof ruminant feedingstuffs from the gas production when they are incubated with rumen liquor in vitro. J. Agric. Sci. 1979, 93, 217–222. [Google Scholar] [CrossRef] [Green Version]
Figure 1. (a) HPLC chromatogram of S19 solution. (b) HPLC chromatogram of seven standards. Note: Peak 1 is p-coumaric acid; Peak 2 is sinapic acid; Peak 3 is luteolin; Peak 4 is quercetin; Peak 5 is apigenin; Peak 6 is tricin; Peak 7 is diosmetin.
Fermentation 09 00571 g001
Figure 2. Fingerprints of TMR from different cattle farms.
Fermentation 09 00571 g002
Figure 3. (a) Comparative fingerprints of TMR from 20 different sources. (b) HPLC chromatograms of five standards. Note: Peak 1 is p−coumaric acid; Peak 2 is sinapic acid; Peak 3 is apigenin; Peak 4 is tricin; Peak 6 is diosmetin.
Fermentation 09 00571 g003
Figure 4. TMR similarity analysis of 20 different sources.
Fermentation 09 00571 g004
Figure 5. Cluster Analysis of 20 TMR.
Fermentation 09 00571 g005
Figure 6. Hierarchical clustering analysis based on fingerprint–effect relationship.
Fermentation 09 00571 g006
Figure 7. Discrete verification of prediction value and truth value of model. (A) Figure main display predicted value and true value of pH model; (B) Figure main display predicted value and true value of Dry matter disappearance rate model; (C) Figure main display predicted value and true value of NH3-N model; (D) Figure main display predicted value and true value of Acetate model. Note: the red line represents the predicted value and the blue dots represent the true value.
Fermentation 09 00571 g007
Figure 8. Standardized contrast radar plots of the samples. (A) Figure main display contains different sample peak content ratio of radar map, and experimental data for each column of peak data standardization to explore the content of contrast; (B) Figure main display is the relative content of each fermentation index radar map of different samples, similar to figure (A), and each column data is standardized to compare the overall level of samples under different fermentation parameters.
Fermentation 09 00571 g008
Figure 9. Structure and clustering of peak spectrum compounds determined using HPLC.
Fermentation 09 00571 g009
Figure 10. Full-text technology summary.
Fermentation 09 00571 g010
Table 1. Relative peak areas of common peaks of 20 TMR samples Table 2 TMR similarity analysis of 20 different sources.
Peak P1P2P3P4P5P6P7P8P9P10P11P12P13
Rt min13.1315.5141.8642.9643.6944.2046.8068.1773.5075.0380.6283.2487.11
S10.150.550.971.990.380.420.430.070.200.220.140.970.35
S20.240.481.533.610.671.020.800.080.130.220.030.780.37
S30.080.451.943.010.650.760.690.060.280.120.091.330.51
S40.280.082.663.471.020.070.630.100.310.220.151.540.53
S50.090.340.792.690.500.760.650.360.290.220.111.490.50
S60.090.371.463.600.670.820.730.070.240.180.151.310.47
S70.301.371.183.860.620.760.790.090.230.150.121.100.41
S80.270.671.883.950.850.570.510.040.170.220.041.070.41
S90.120.501.712.600.520.750.650.110.290.190.071.420.50
S100.130.572.323.530.860.720.650.140.270.110.061.490.49
S110.160.652.073.820.820.920.890.040.520.220.182.240.79
S120.080.191.561.290.320.460.430.100.160.100.370.780.31
S130.491.251.435.490.922.481.380.130.250.260.121.490.55
S140.351.220.404.430.461.981.940.080.160.110.121.250.34
S150.470.821.773.110.700.750.670.070.310.230.121.370.57
S160.170.643.184.221.101.080.950.080.470.230.212.010.63
S170.400.742.034.241.081.341.210.270.560.210.243.061.07
S180.090.171.551.260.290.470.430.050.150.180.350.830.27
S190.131.003.806.651.531.030.890.140.500.230.213.071.02
S200.270.793.664.791.330.760.710.000.580.260.202.910.88
Table 2. Effects of TMR on pH, NH3-N concentration, and dry matter disappearance rate of fermentation fluid.
ItemspHDry Matter Disappearance Rate/%NH3-N/(mg/dL)
S16.66 ± 0.00671.90 ± 2.71 abc30.68 ± 9.27 ab
S26.68 ± 0.00367.91 ± 1.73 bc24.86 ± 6.79 ab
S36.68 ± 0.00770.42 ± 2.38 bc26.10 ± 3.06 ab
S46.68 ± 0.00069.29 ± 0.44 bc41.36 ± 19.98 ab
S56.67 ± 0.00371.55 ± 0.84 abc51.37 ± 9.31 a
S66.70 ± 0.00369.64 ± 0.68 bc29.17 ± 5.07 ab
S76.68 ± 0.00371.68 ± 1.21 abc31.85 ± 0.80 ab
S86.69 ± 0.02371.78 ± 2.83 abc29.46 ± 13.21 ab
S96.67 ± 0.00771.91 ± 1.95 abc20.40 ± 1.15 ab
S106.69 ± 0.0967.53 ± 4.92 bc25.97 ± 7.66 ab
S116.67 ± 0.0968.69 ± 2.24 bc7.13 ± 0.40 b
S126.68 ± 0.00774.72 ± 1.96 ab11.40 ± 2.41 b
S136.66 ± 0.00372.93 ± 0.41 abc7.15 ± 0.57 b
S146.67 ± 0.01264.07 ± 0.81 c7.87 ± 1.17 b
S156.65 ± 0.01071.78 ± 1.50 abc10.32 ± 1.71 b
S166.69 ± 0.02076.92 ± 1.10 ab14.39 ± 3.04 b
S176.67 ± 0.00981.34 ± 0.30 a7.76 ± 0.88 b
S186.68 ± 0.00777.73 ± 0.58 ab8.03 ± 1.39 b
S196.67 ± 0.00681.48 ± 1.12 a11.91 ± 3.34 b
S206.67 ± 0.02375.55 ± 2.20 ab9.12 ± 2.59 b
p0.194<0.0001<0.0001
Values are mean ± SEM, n = 8. a, b, c Means in the same row with different superscripts differ (p < 0.05).
Table 3. Effects of TMR extract on VFA concentrations of fermentation fluid.
ItemsAcetate, mMPropionate, mMIsobutyrate, mMButyrate, mMIsovalerate, mMValerate, mM
S141.21 ± 1.72 ab18.52 ± 0.65 ab1.33 ± 0.129.63 ± 0.32 abc2.61 ± 0.15 abc3.09 ± 0.13 ab
S230.66 ± 0.58 b14.45 ± 0.30 b0.99 ± 0.47.06 ± 0.18 c1.97 ± 0.09 bc2.68 ± 0.05 b
S346.60 ± 1.30 ab20.67 ± 0.59 ab1.53 ± 0.1010.90 ± 0.40 abc2.99 ± 0.13 a3.40 ± 0.21 a
S435.08 ± 0.73 b16.26 ± 0.34 b1.22 ± 0.038.74 ± 0.20 bc2.53 ± 0.05 abc2.96 ± 0.03 ab
S546.71 ± 4.60 ab21.56 ± 2.19 ab1.50 ± 0.1511.29 ± 1.15 ab2.94 ± 0.25 a3.29 ± 0.21 ab
S646.06 ± 1.52 ab21.97 ± 0.75 ab1.25 ± 0.0710.53 ± 0.61 abc2.44 ± 0.17 abc3.11 ± 0.01 ab
S734.34 ± 3.06 b15.85 ± 1.44 b1.13 ± 0.127.56 ± 0.64 bc1.86 ± 0.12 c2.74 ± 0.06 b
S843.68 ± 2.81 ab20.26 ± 1.26 ab1.36 ± 0.099.92 ± 056 abc2.33 ± 0.11 abc3.00 ± 0.10 ab
S942.53 ± 0.71 ab20.20 ± 0.35 ab1.31 ± 0.059.55 ± 0.24 abc2.33 ± 0.07 abc2.84 ± 0.03 ab
S1046.85 ± 1.37 ab21.57 ± 0.61 ab1.42 ± 0.0710.26 ± 0.55 abc2.46 ± 0.17 abc2.92 ± 0.05 ab
S1154.19 ± 2.82 a25.07 ± 1.20 a1.57 ± 0.1012.77 ± 0.59 a2.79 ± 0.12 ab3.12 ± 0.10 ab
S1246.79 ± 3.79 ab21.92 ± 1.72 ab1.32 ± 0.1210.56 ± 0.71 abc2.35 ± 0.14 abc3.02 ± 0.12 ab
S1344.55 ± 4.04 ab19.92 ± 1.72 ab1.40 ± 0.129.45 ± 0.78 abc2.30 ± 0.17 abc3.10 ± 0.09 ab
S1441.98 ± 7.66 ab19.69 ± 3.55 ab1.35 ± 0.199.55 ± 1.52 abc2.32 ± 0.26 abc2.99 ± 0.17 ab
S1539.35 ± 0.65 ab18.54 ± 0.36 ab1.30 ± 0.068.55 ± 0.22 bc2.18 ± 0.11 abc2.98 ± 0.13 ab
S1643.47 ± 0.87 ab20.52 ± 0.46 ab1.09 ± 0.028.81 ± 0.25 bc2.15 ± 0.05 abc2.69 ± 0.05 b
S1747.54 ± 2.93 ab21.45 ± 1.41 ab1.31 ± 0.229.68 ± 0.84 abc2.24 ± 0.19 abc2.79 ± 0.18 ab
S1836.21 ± 2.80 b17.06 ± 1.33 b1.18 ± 0.107.65 ± 0.56 bc2.02 ± 0.11 bc2.86 ± 0.09 ab
S1940.13 ± 3.29 ab17.70 ± 1.48 ab1.35 ± 0.058.51 ± 0.56 bc2.25 ± 0.09 abc2.93 ± 0.04 ab
S2042.52 ± 5.64 ab19.64 ± 2.57 ab1.31 ± 0.159.52 ± 1.39 abc2.37 ± 0.30 abc2.97 ± 0.19 ab
p<0.0001<0.00010.053<0.0001<0.00010.007
Values are mean ± SEM, n = 8. a, b, c Means in the same row with different superscripts differ (p < 0.05).
Table 4. Content of Total Flavonoids in TMR from Different Sources.
NO.Total Flavonoids Content, mg/gNO.Total Flavonoids Content, mg/g
S113.95 ± 0.19S1111.95 ± 0.66
S210.91 ± 0.62S1210.71 ± 0.53
S310.56 ± 0.50S1312.61 ± 1.24
S412.30 ± 1.20S1410.51 ± 0.62
S512.71 ± 0.60S1510.96 ± 0.25
S611.21 ± 0.43S1611.16 ± 0.34
S79.97 ± 0.41S1713.00 ± 0.65
S811.81 ± 1.08S1810.86 ± 0.62
S913.50 ± 0.57S1917.38 ± 0.49
S1010.12 ± 0.53S2012.55 ± 0.82
Table 5. Correlation between total flavonoids content in TMR and pH, NH3-N concentration, and dry matter disappearance rate of fermentation fluid.
pHDry Matter Disappearance Rate/%NH3-N/(mg/dL)
Total flavonoids content mg/g−0.378−0.0470.535 *
p0.1000.8450.015
* Means p < 0.05.
Table 6. Correlation between total flavonoids content in TMR and VFA concentrations of fermentation fluid.
Acetate, mMPropionate, mMIsobutyrate, mMButyrate, mMIsovalerate, mMValerate, mM
Total flavonoids content mg/g0.048−0.0380.1940.0160.1320.057
p0.8470.8760.4250.9480.5890.816
Table 7. Model optimization and model results.
ModelBefore OptimizationAfter
Optimization
R-
Squared
p-
Value
R-
Squared
p-
Value
Formula
PH0.72930.41590.45990.0174 Y p H = 0.054 x P 1 + 0.0298 x P 5 0.013 x P 12 + 6.685
Dry matter disappearance rate0.92350.02240.61730.0003 Y Dry   matter   disappearance   rate = 26 . 815 x P 11 + 9 . 6489 x P 13 + 63.019
NH3-N0.94990.00710.43090.0083 Y NH 3 - N = 13 . 312 x P 6 + 70 . 769 x P 8 + 24 . 882
Acetate0.76370.32430.55490.0294 Y Acetate = 3 . 6133 x P 3 + 8 . 6478 x P 6 14 . 043 x P 7 + 43 . 515 x P 9 61 . 392 x P 10 + 51 . 579
Table 8. Model checking of predictive value and true value.
ItemModel Checking
Predicted Value and True ValuePaired Difference
Correlationp-ValueAverage ValueSEMp-Value
pH0.6780.0010.000030.08750.988
Dry matter disappearance rate0.7860−0.000070.616581
NH3-N0.6560.002−0.000582.160541
Acetate0.74500.000820.818470.999
Table 9. Putative structurally active compounds based on the cluster.
Classification According to the ClusterStructurePutative StructureBase Feature
P4, P6, P7Fermentation 09 00571 i001
Tricin
Fermentation 09 00571 i002
Diosmetin
Fermentation 09 00571 i003
Luteolin [36]
flavonoids with methoxy links in the B ring
P4, P6, P7Fermentation 09 00571 i004
Tricin
Fermentation 09 00571 i005
Diosmetin
Fermentation 09 00571 i006
Quercetin [37]
flavonoids with methoxy links in the B ring
P4, P6, P7Fermentation 09 00571 i007
Tricin
Fermentation 09 00571 i008
Diosmetin
Fermentation 09 00571 i009
Taxifolin [38]
flavonoids with methoxy links in the B ring
P4, P6, P7Fermentation 09 00571 i010
Tricin
Fermentation 09 00571 i011
Diosmetin
Fermentation 09 00571 i012
Hesperetin [39]
flavonoids with methoxy links in the B ring
P4, P6, P7Fermentation 09 00571 i013
Tricin
Fermentation 09 00571 i014
Diosmetin
Fermentation 09 00571 i015
Myricetin [40]
flavonoids with methoxy links in the B ring
P1, P2, P10Fermentation 09 00571 i016
p-coumaric acid
Fermentation 09 00571 i017
sinapic acid
Fermentation 09 00571 i018
ferulic acid [41]
4-hydroxy cassia bark acid
P1, P2, P10Fermentation 09 00571 i019
p-coumaric acid
Fermentation 09 00571 i020
sinapic acid
Fermentation 09 00571 i021
isoferulic acid [42]
4-hydroxy cassia bark acid
P1, P2, P10Fermentation 09 00571 i022
p-coumaric acid
Fermentation 09 00571 i023
sinapic acid
Fermentation 09 00571 i024
methyl sinapic acid [43]
4-hydroxy cassia bark acid
P1, P2, P10Fermentation 09 00571 i025
p-coumaric acid
Fermentation 09 00571 i026
sinapic acid
Fermentation 09 00571 i027
Methyl 4-hydroxycinnamate [44]
4-hydroxy cassia bark acid
P1, P2, P10Fermentation 09 00571 i028
p-coumaric acid
Fermentation 09 00571 i029
sinapic acid
Fermentation 09 00571 i030
p-Hydroxybenzalacetone [45]
4-hydroxy cassia bark acid
Table 10. Nutrients levels of TMR diets from 20 cattle farms.
PeakMoisture%Dry Matter%Crude Fat%Crude Ash%Crude Protein%Neutral Detergent Fiber (NDF)%Acid Detergent Fiber (ADF)%
S144.76 54.02 2.02 5.86 10.07 14.37 6.74
S254.78 44.33 1.96 4.93 8.20 15.47 7.22
S350.64 48.31 2.03 5.21 9.45 16.59 6.53
S446.79 51.99 2.45 3.58 9.69 17.81 7.86
S546.15 52.68 2.17 5.24 9.90 14.79 7.38
S649.83 49.09 1.93 4.89 8.85 15.31 6.89
S756.31 42.67 1.68 3.88 7.62 12.40 4.82
S852.28 46.48 1.58 4.58 8.26 13.19 5.89
S950.90 47.89 1.92 3.96 9.08 13.64 5.00
S1041.02 57.68 2.92 5.94 11.11 17.30 7.66
S1146.33 52.42 2.61 5.02 9.57 19.03 6.13
S1249.03 49.80 2.38 4.50 9.48 14.12 6.09
S1351.83 46.81 0.97 3.76 8.27 20.55 12.43
S1464.02 34.79 1.73 2.44 5.17 19.67 9.31
S1546.26 52.21 2.24 4.62 9.35 17.36 10.34
S1643.26 55.08 1.85 4.62 10.29 20.75 11.64
S1753.77 44.88 0.95 3.81 7.84 17.77 8.07
S1848.32 50.29 2.24 5.16 9.24 18.87 8.44
S1951.44 46.98 1.44 4.33 9.32 15.23 11.13
S2051.55 46.92 1.85 3.47 8.75 20.03 9.07
Disclaimer/Publisher’s Note: The statements, opinions and data contained in all publications are solely those of the individual author(s) and contributor(s) and not of MDPI and/or the editor(s). MDPI and/or the editor(s) disclaim responsibility for any injury to people or property resulting from any ideas, methods, instructions or products referred to in the content.

