Article

Effect of Replacing Fish Meal Using Fermented Soybean Meal on Growth Performance, Intestine Bacterial Diversity, and Key Gene Expression of Largemouth Bass (Micropterus salmoides)

1
School of Chemical Engineering, Zhengzhou University, 100 Ke Xue Dadao, Zhengzhou 450001, China
2
National Engineering Technique Research Center for Biotechnology, State Key Laboratory of Materials-Oriented Chemical Engineering, College of Biotechnology and Pharmaceutical Engineering, Nanjing Tech University, Nanjing 210009, China
3
Fishery Biological Engineering Technology Research Center of Henan Province, School of Fisheries, Xinyang Agriculture and Forestry University, Xinyang 464000, China
4
College of Fisheries, Henan Normal University, Xinxiang 453000, China
*
Authors to whom correspondence should be addressed.
These authors contributed equally to this work.
Fermentation 2023, 9(6), 520; https://doi.org/10.3390/fermentation9060520
Submission received: 7 May 2023 / Revised: 19 May 2023 / Accepted: 24 May 2023 / Published: 27 May 2023
(This article belongs to the Special Issue Research on Microbial Protein Synthesis)

Abstract

:
In China, aquaculture costs have increased because of the increase in fish meal (FM) prices. Plant proteins, such as soybean meal, have the potential to replace FM partially and thus reduce the cost of aquatic feed. In this study, soybean meal (SBM) was fermented using compound microorganisms (lactic acid bacteria, yeast, and Bacillus). Fermented soybean meal (FSBM) replaced FM in the diet. The effect of replacing FM on largemouth bass was comprehensively evaluated at three levels: macro (growth performance), microbial (bacterial diversity and metabolic), and gene (key gene expression) levels. The results showed that FSBM increased the crude protein content by 7.45% and decreased the phytic acid concentration by 48.66% compared with original SBM. Compared with the control, the weight gain rate and feed conversion ratio showed no significant difference (p > 0.05) when the replacement amount of FM was less than 30%. Compared with the 50% FSBM treatment, the 10% and 30% treatments showed more steatosis in the liver slices. Although the replacement of FSBM with less than 30% did not have a significant (p < 0.05) negative impact on body weight, FSBM substitution adversely affected the height and width of the intestinal villi. The expression levels of Hepcidin-1, Hepcidin-2, TGF-β1, and IL-10 in 30% and 50% FSBM treatments were lower than those in the control, whereas the expression levels of SOD1 and SOD2 in 30% FSBM treatment were higher than those in the control group, and the expression level of SOD3a in 30% FSBM treatment was equal to the control. In addition, FSBM substitution could affect the composition of intestinal microorganisms and thus influence metabolic pathways, especially the biosynthesis of amino acids and plant secondary metabolites.

1. Introduction

In China, the rapid growth of aquaculture has led to a shortage of protein feed [1]. The primary protein source in aquaculture is fish meal (FM) [2]. In recent years, the rising price of FM has led to the rise in aquaculture costs [3]; consequently, finding alternative protein sources for fish meal is a topic of concern [4].
Soybean meal (SBM) is a by-product of oil extraction and is widely used as a source of animal protein. In China, the price of soybean meal containing 46% crude protein is lower than 614.5 USD t−1. The amino acid composition of soybean meal is relatively well-balanced, making it a viable alternative to fish meal [5]. The original soybean meal contains numerous anti-nutritional factors, such as oligosaccharides, phytic acid, lectins, and trypsin inhibitors [6]. As expected, its direct application has negative effects on digestion and absorption of nutrients, and thereby fish growth [7]. The concentration of these anti-nutritional factors can be reduced through microbial fermentation. Refstie et al. [8], for instance, demonstrated that fermentation with lactic acid bacteria significantly decreased the level of trypsin inhibitors in soybean meal. Similarly, Hassaan et al. showed that fermentation with Saccharomyces cerevisiae significantly reduced the phytic acid content [3]. In recent years, replacing fish meals with fermented soybean meal (FSBM) in aquaculture has become a research hotspot. The preliminary effects of replacing fish meal on the growth of catfish, Nile tilapia, rainbow trout, and grouper were investigated [9].
Perch is the fourth most popular freshwater fish in China, and it is favored by consumers due to its rich nutrition. The cost of raising largemouth bass is approximately 2000–2300 USD t−1. The main expenses in the process of bass farming originate from labor, electricity, fish medicine, and feed. According to previous studies, the cost of feeding perch accounts for 30–70% of the total cost of aquaculture [10], whereas the cost of fish meal accounts for over 50% of all feed ingredients. According to data from the U.S. Department of Agriculture, global fish meal production remained between 4.4 and 4.9 million tons from 2012 to 2020. China is the largest fish meal consumption market in the world, and the annual fish meal consumption is around 2 million tons. Some researchers have investigated the viability of substituting FSBM for fish meal in perch cultures [11]. However, these studies focused primarily on these growth performance indicators for perch. The comprehensive and in-depth evaluation of FSBM as an alternative to fish meal on perch requires additional research. In the current study, we screened three types of microorganisms: Bacillus amyloliquefaciens, Cyberlindnera jadinii, and Streptococcus thermophilus. Then, we mixed Bacillus amyloliquefaciens, Cyberlindnera jadinii, and Streptococcus thermophilus at a ratio of 1:2:1 for the fermentation of soybean meal. Based on the principle of equal nitrogen and energy of feed in the control and experimental treatment groups, fish meal was substituted with FSBM at 0%, 10%, 30%, and 50%. The effect of replacing fish meal with FSBM on largemouth bass was investigated at three levels: macro (growth performance), microbial (bacterial diversity and metabolic), and gene (key gene expression). The results of this experiment lend theoretical support to the substitution of FSBM for the fish meals.

2. Materials and Methods

2.1. Preparation Method of Fermented Soybean Meal

Soybean meal (China Grain Storage Oil (Tangshan) Co., Ltd., Tangshan City, China) was acquired from the Taobao company (https://www.taobao.com) (accessed on 14 Jun 2022). A pulverizer (CLF-102, ChuangLi Instrument Factory, Wenling City, China) was used to crush the soybean meal, which was then homogenized using a 0.425 mm sieve. The soybean meal was then sterilized (121 °C, 30 min). Lactic acid bacteria, yeast, and Bacillus were obtained from the National Biochemical Engineering Research Center (Nanjing, China). B. amyloliquefaciens (0.5% v/v), C. jadinii (0.5% v/v), and S. thermophilus (1% v/v) were cultured in Luria-Bertani (LB) (Solarbio, Beijing, China), Yeast Extract Peptone Dextrose Medium (YPD) (Solarbio, Beijing, China), and lactic acid bacteria culture medium (MRS) (Solarbio, Beijing, China) for 11, 13, and 18 h, respectively. B. amyloliquefaciens and S. thermophilus at 2.5% (v/w) and C. jadinii at 5% (v/w) were inoculated into the sterilized soybean meal. The number of microorganisms in the soybean meal was higher than 1 × 10⁵ CFU g−1 fresh matter at the beginning of fermentation. By adding 900 g of deionized water and 100 mL of inoculum to 1000 g of dried soybean meal, the water content of the digestion system was controlled at approximately 50%. The soybean meal inoculated with microorganisms was fermented in an incubator (SPX-150BⅢ, Tianjin Taist Instrument Co., Ltd., TianJin, China) (37 °C for 96 h). The FSBM was air-dried using a fan (MFSJ-205, Hefei Meiling Group Holdings Co., Ltd., Hefei, China) at room temperature and stored at 4 °C before use.

2.2. The Feed Preparation of Different Treatments

A basic feed (control) containing 35% (w/w) fish meal was formulated. FSBM was used to replace 10%, 30%, and 50% of the fish meal so that the three treatments contained equivalent nitrogen (46% crude protein) and energy (18.5 kJ g−1 energy) with the control feed. Table 1 displays the proportion and composition of ingredients in the control and experimental feeds. After mixing these ingredients thoroughly, they were granulated using a granulator equipped with a 1 mm particle mold. After granulation, these feeds were dried using a fan (MFSJ-205, Hefei Meiling Group Holdings Co., Ltd., Hefei, China) at room temperature and then stored at −20 °C.

2.3. Experiment Process of Breeding Largemouth Bass

Largemouth bass were purchased from aquaculture farms (Guangzhou, Guangdong, China). A total of 160 largemouth bass with similar shapes and sizes were randomly selected as the experimental object. The average weight of these largemouth bass was 60.46 ± 0.19 g. Four water tanks (1.5 × 1.2 m) were used for fish farming, and the number of largemouth bass was 40 in each tank. Each tank was equipped with an aeration pump to ensure oxygen saturation. The fish were fed thrice daily (09:00, 14:00, and 19:00). In the first and second months, the feeding amount for each fish was 0.5–1 g and 1–1.5 g, respectively. Specifically, stopping snatching was used as a standard for stopping feeding. The natural environment was simulated by alternating between light and dark (12 h of light and then 12 h of darkness). Fish feces were removed, and two-thirds of the water was replaced daily. During the experiment, parameters related to the breeding environment, including water temperature and pH, were measured daily to ensure that largemouth bass had an optimal environment for growth.
The entire breeding cycle lasted four months. Before the conclusion of the experiment, the fish were starved for 24 h; anesthetized with tricaine methanesulfonate (MS-222) (0.1 g L−1); and their weight, intestinal length, and liver weight were measured. The calculations for the survival rate (SR), weight gain rate (WGR), specific growth rate (SGR), feed conversion ratio (FCR), visceral index (VSI), condition factor (CF), hepatosomatic index (HSI), and feed efficiency (FE) were based on these fundamental parameters. After weighing, blood was drawn from the tail vein using a 1 mL disposable sterile syringe (Henan Shuguang Huizhikang Biotechnology Co., Ltd., Luohe, China). To obtain blood plasma, the blood was centrifuged at 4 °C at 3000 rpm (5810R, Eppendorf, Hamburg, Germany) for 10 min after the blood was kept at room temperature for 3 h. The blood plasma was stored at −80 °C for later determination of biochemical indicators. In each experiment, fish liver and intestine were collected and fixed with a 10% formalin reagent for histological examination. Additionally, three fish livers from each treatment group were stored in liquid nitrogen and analyzed for key gene expression. The back muscles were collected for amino acid composition analysis. The intestinal tract contents were collected and preserved at −80 °C for analysis of the microbial community and metabolites.

2.4. Determination of Nutrient Availability

The feed was cleaned after feeding for 1 h, and then fish feces was collected after cleaning for 2 h. ICP-OES (inductively coupled plasma-optical emission spectrometer) determined the content of yttrium in feed and feces. Protein and fat in feed and feces were determined based on the standard method in AOAC [12]. The apparent digestibility coefficient of dry matter (ADDM), crude protein (ADCP), and crude lipid (ADCL) were calculated based on the following formulas [11]:
ADDM (%) = 100 × [1 − dietary Y2O3/faeces Y2O3]
ADCP (%) = 100 × [1 − (dietary Y2O3 × faeces crude protein)/(faeces Y2O3 × dietary crude protein)]
ADCL (%) = 100 × [1 − (dietary Y2O3 × faeces crude lipid)/(faeces Y2O3 × dietary crude lipid)]

2.5. Determination Method of Physicochemical Parameters

Crude protein, crude fat, ash, crude fiber, and water content were determined according to the method of AOAC [12]. The feed crude protein was determined by the Kjeldahl method using a semi-automatic Kjeldahl nitrogen determination instrument (K9840, Haineng Future Technology Group Co., Ltd., Jinan, China). Crude protein content was calculated by multiplying the nitrogen content by a factor of 6.25. The crude fat of feed was determined by the Soxhlet extraction method with a fat analyzer (SOX406, Haineng Future Technology Group Co., Ltd., Jinan, China). The feed was burned at 550 °C for 4 h in a muffle furnace (KSL-1200X, Hefei Kejing Material Technology Co., Ltd., Hefei, China), and the ratio of the weight of the remaining solid to the weight of the original feed was recorded as the ash content. The crude fiber in feed was determined by a crude fiber tester (F800, Haineng Future Technology Group Co., Ltd., Jinan, China). Based on Haug and Lantzsch’s method [13], the phytic acid content was determined using an ultraviolet spectrophotometer (Cary60, Agilent Technologies, Malaysia).

2.6. Determination Method of Blood Key Biochemical Parameters

The total protein, albumin, globulin, alanine aminotransferase, glutamic oxaloacetic transaminase, glucose, and alkaline phosphatase in serum was determined by a Toshiba Automatic Biochemical Analyzer (Toshiba TBA40FR, Japan) [3]. The contents of malondialdehyde (MDA) were determined with kit A015-1 and A003-1 (Nanjing Jiancheng Bioengineering Research Institute, Nanjing, China), respectively.

2.7. Determination of Amino Acid Content in Perch Muscle, SBM, and FSBM

The sample (50–200 mg) was put into the hydrolysis tube, and then 10 mL of 6 M HCl was added to hydrolyze the sample for 22–24 h at 110 °C [1]. After hydrolysis, the liquid sample was filtered using a 0.45 μm membrane. Then, the volume was measured in a 50 mL volumetric flask. A rotary evaporator was used for deacidification (2 mL sample). Two mL of sample buffer solution was added to fully dissolve the sample when there was a little solid or stain at the bottom of the rotary evaporator. Then, a 0.45 μm filter was used to filter samples. The amino acid analyzer determined the obtained samples’ amino acid content (Biochrom 30+, Biochrom, UK).

2.8. Methods of Fish Liver and Intestinal Tissue Sections

The liver and intestine were fixed in a 10% formalin solution, and then dehydrated. The dehydrated samples were embedded in paraffin. The pathological sections (RM2016, Shanghai Leica Instrument Co., Ltd., Shanghai, China) were used to conduct 2.5–4 µm thick continuous sections [11]. After coloration with hematoxylin and eosin, the morphology of liver and intestinal tissues under an upright fluorescent microscope (NIKON ECLIPSE E100, Nikon, Japan) was observed.

2.9. Quantitative Method of Key Gene Expression

The total RNA extraction kit (Shenggong, Shanghai, China) was used to extract RNA from fish liver. The micro-UV spectrophotometer (NanoDrop One, Thermo Scientific, MA, USA) was used to define the quality of RNA (purity and concentration). We used 1% agarose gel electrophoresis to detect the integrity of RNA. A reverse transcription kit (Fast King RT Kit (With gDNase, Tiangen Biochemical Technology Co., Ltd., Beijing, China) was used to reverse transcribe total RNA into cDNA. In the current study, the genes related to immunity (Hepcidin-1, Hepcidin-2, IL-1β, IL-15, IL-10, and TGF-β1), apoptosis (Caspase-3, Caspase-8, and Caspase-9), and antioxidation (SOD1, SOD2, and SOD3a) were quantified. The primers used for Q-PCR were referenced from a previous article [14]. All primer sequences are shown in Table S1 in the Supplementary Material. Q-PCR was conducted on the RT-PCR equipment (Quant Studio 3, Thermo Scientific, MA, USA). Q-PCR system is 20 μL, including 2 μL of cDNA, 10 μL of 2× uper Real Pre-mix Plus, 0.6 μL of Forward primer (10 μM), 0.6 μL of reverse primer (10 μM), 0.4 μL of 50×Rox Reference Dye, and 6.4 μL of RNA free water. We used 200 μL 96 orifice plate to perform q-PCR. q-PCR reaction includes four stages: hold stage (95 °C 15 min), PCR stage (95 °C 10 s, 55 °C 30 s, and 72 °C 40 s), and melt curve stage (40 °C, 1 min, and 95 °C, 1 s). Each gene was set with three replicates. To exclude potential contamination of reagents and DNA contamination of extracted RNA, RNA-free water was used as the negative control instead of the template, and the sample without reverse transcriptase was used as the positive control during the PCR process. The relative expression of genes was calculated based on the 2 −ΔΔct method according to the CT value [14].

2.10. DNA Extraction and 16S rRNA Gene Sequencing of Intestinal Microorganisms

This detailed method and steps can be found in the Supplementary Materials.

2.11. Detection Methods of Metabolites in Intestine (LC-MS/MS Analysis)

This detailed method and steps can be found in the Supplementary Materials.

3. Results

3.1. Changes in Soybean Meal Properties before and after Fermentation (Amino Acid Phytic Acid Content)

The total amino acid content of FSBM was 2.95% higher than that of SBM (Table 2). The essential amino acids (valine, methionine, isoleucine, leucine, threonine, phenylalanine, lysine, and arginine) in FSBM increased by 4.76%, 6.07%, 4.35%, 7.85%, 2.21%, 10.28%, 0.58%, and 3.02%, respectively, except for histidine, which decreased by 5%. The content of non-essential amino acids increased by 0.06–24.34%. The crude protein content of SBM increased by 7.45% (from 46.03% to 49.46%) after fermentation, whereas the phytic acid content decreased by 48.66% (from 2.98% to 1.53%).

3.2. Effect of FSBM Instead of Fish Meal on Growth Performance of Largemouth Bass

Table 3 displays the effects of FSBM as opposed to fish meal on the growth performance of largemouth bass. The final body weight (FBW), weight gain rate (WG), specific growth rate (SGR), feed efficiency (FE), visceral somatic index (VSI), and hepatosomatic index (HIS) of largemouth bass decreased as the proportion of FSBM increased. When the proportion replaced by FSBM exceeded 30%, the WG and FE of the largemouth bass were significantly (p < 0.05) lower than those of the control group. The feed conversion ratio (FCR) increased with an increase in the replaced ratio of FSBM, and the FCR of the 50% FSBM group was significantly (p < 0.05) higher than that of the control group. There was no significant (p > 0.05) effect on the survival rate (SR) and plumpness of largemouth bass among all treatments.
Table 4 displays the impact of the partial substitution of fish meal with FSBM on the nutrient utilization rate of largemouth bass. The apparent digestibility of dry matter and protein in the group containing 10% FSBM was than in the other groups. In addition, the apparent digestibility of fat was in the 10%, 30%, and 50% FSBM treatments than in the control group.

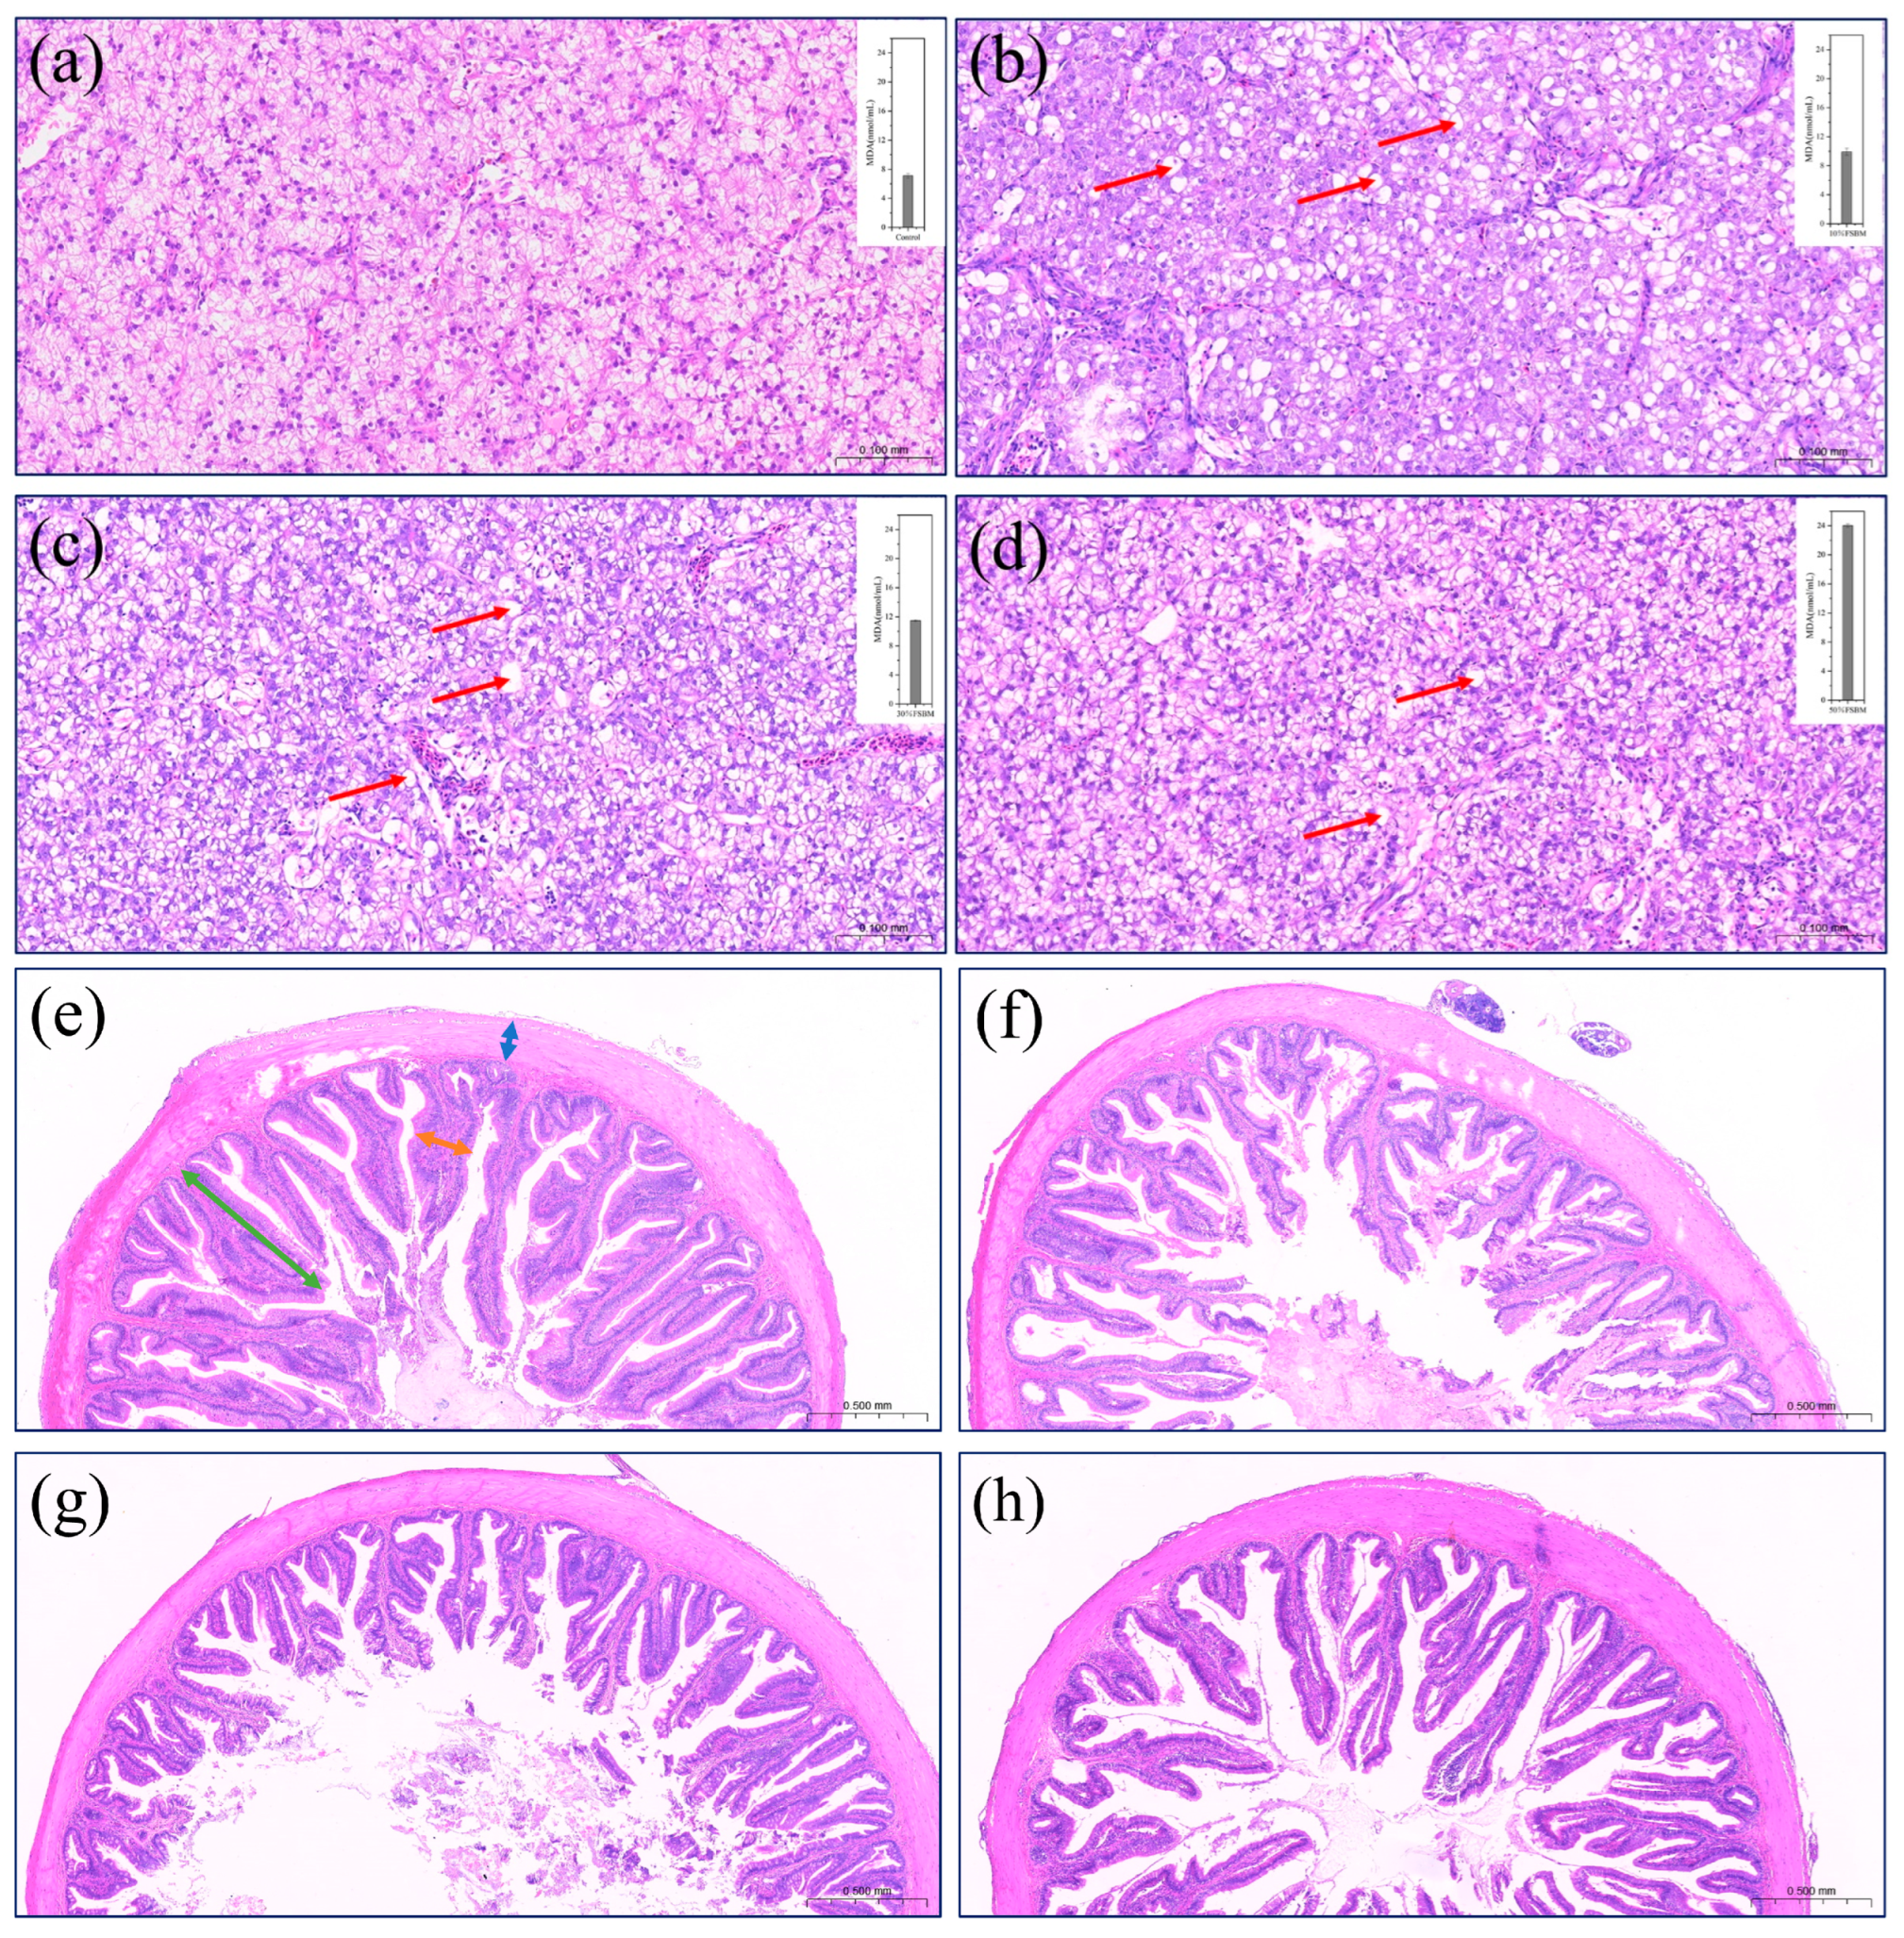
3.3. Effect of FSBM Replacing Fish Meal on the Morphology of Key Organs (Intestine and Liver)

Figure 1a–d depict the steatosis of liver cells resulting from various treatments. When FSBM is substituted for fish meal, all treatments result in steatosis in liver cells. The presence of malondialdehyde (MDA) in the blood also supports this claim. With FSBM supplementation, MDA concentration increased gradually. Figure 1e–h show the morphology of the distal intestine. Compared with the control group, when the substitution amount of FSBM exceeded 30%, there were significant differences in villus height and width, respectively (p < 0.05) (Table 5).

3.4. Effect of FSBM Replacing Fish Meal on Blood Biochemical Parameters

Table 6 displays the effect of replacing fish meal with FSBM on the biochemical indices of largemouth bass serum. Compared to the control group, alanine aminotransferase (ALT) and alkaline phosphatase (ALP) activities were elevated in the 10%, 30%, and 50% FSBM treatments. In contrast, the levels of aspartate aminotransferase (AST), total protein (TP), albumin (ALB), globulin (GLB), and glucose (GLU) were lower in the 10%, 30%, and 50% FSBM groups than in the control group.

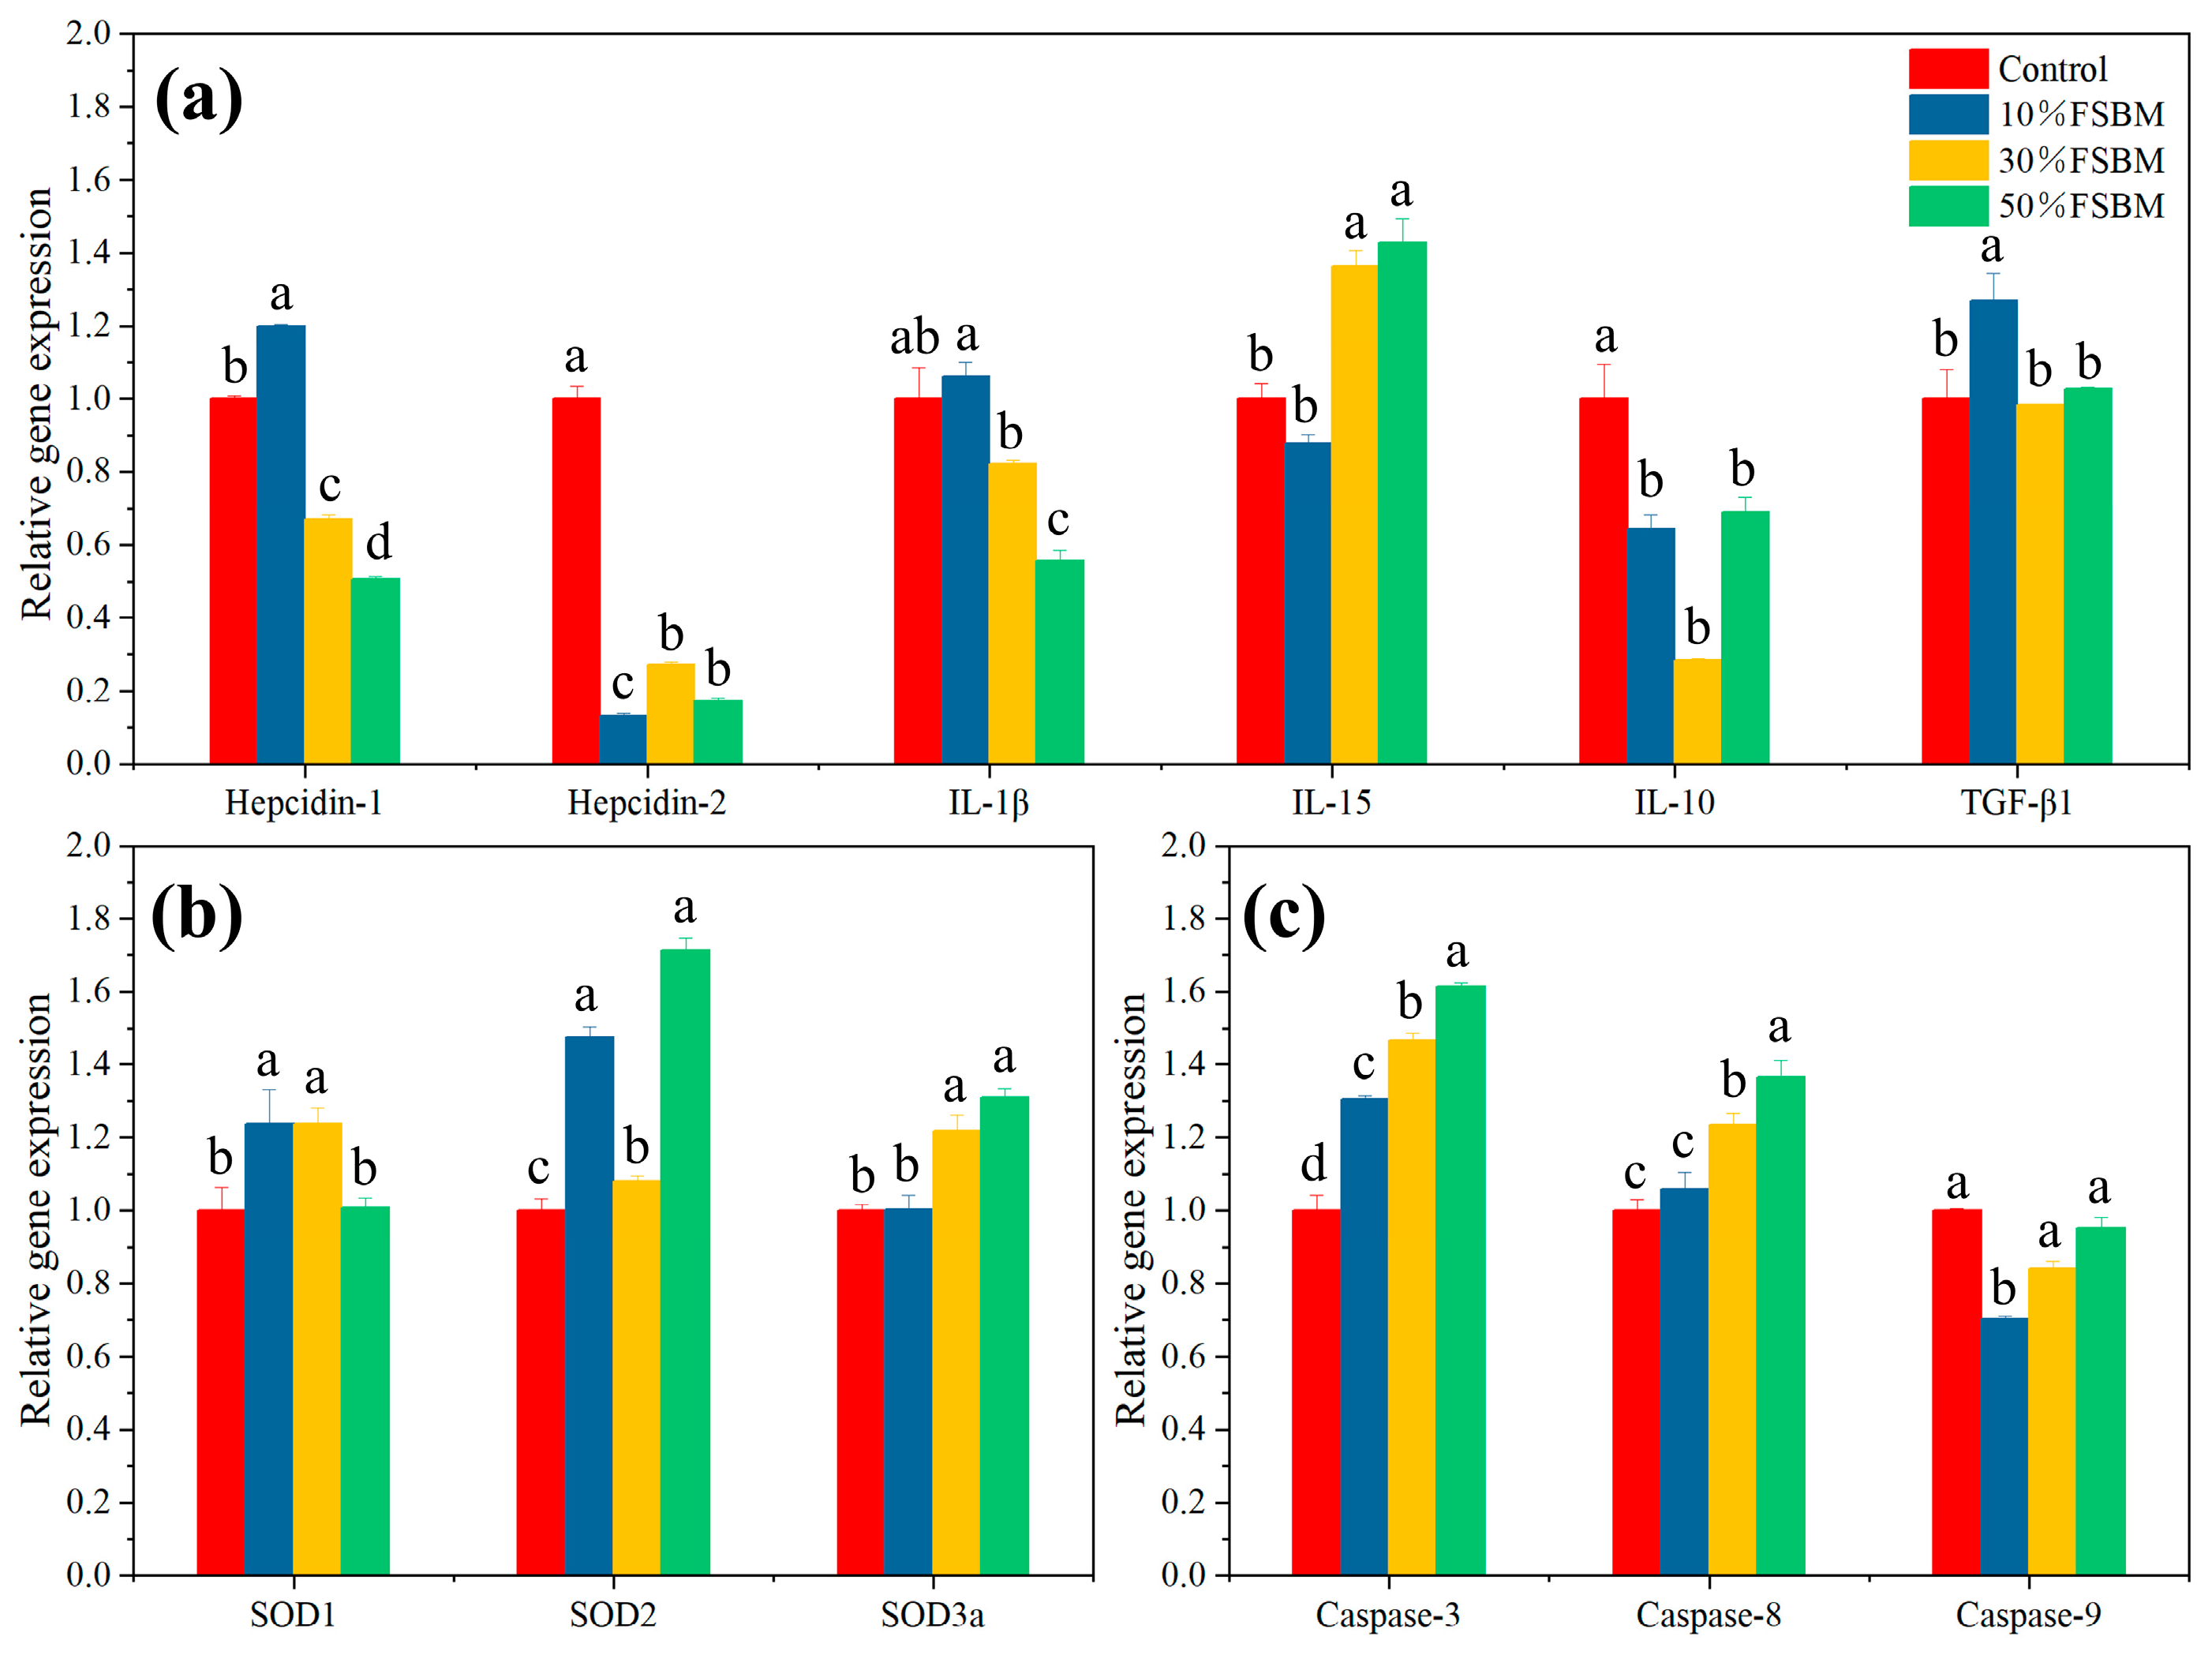
3.5. Effect of FSBM Replacing Fish Meal on Key Gene Expression

The present study quantified three types of genes associated with immunity, antioxidant activity, and cell apoptosis. Immune-related genes include pro-inflammatory factor-related genes (IL-1β and IL-15), anti-inflammatory factor-related genes (IL-10 and TGF-β1), and antimicrobial peptide-related genes (Hepcidin-1 and Hepcidin-2). In this study, the reduced expression of the anti-inflammatory factor IL-10 in the 10% FSBM, 30% FSBM, and 50% FSBM treatments might be due to the regulatory effect of probiotics in FSBM (Figure 2a). This study showed that the expression levels of Hepcidin-1 and Hepcidin-2 genes in the 30% FSBM and 50% FSBM groups were lower than those in the control group. The expression levels of SOD1, SOD2, and SOD3a in the liver of the FSBM treatment groups were greater than those of the control group. The apoptotic genes in this experiment include Caspase-3, Caspase-8, and Caspase-9 (Figure 2c). The levels of Caspase-9 expression were lower in the 10% FSBM, 30% FSBM, and 50% FSBM treatments than in the control. Caspase-3 and Caspase-8 expression levels were higher in the 10%, 30%, and 50% FSBM treatments than in the control.

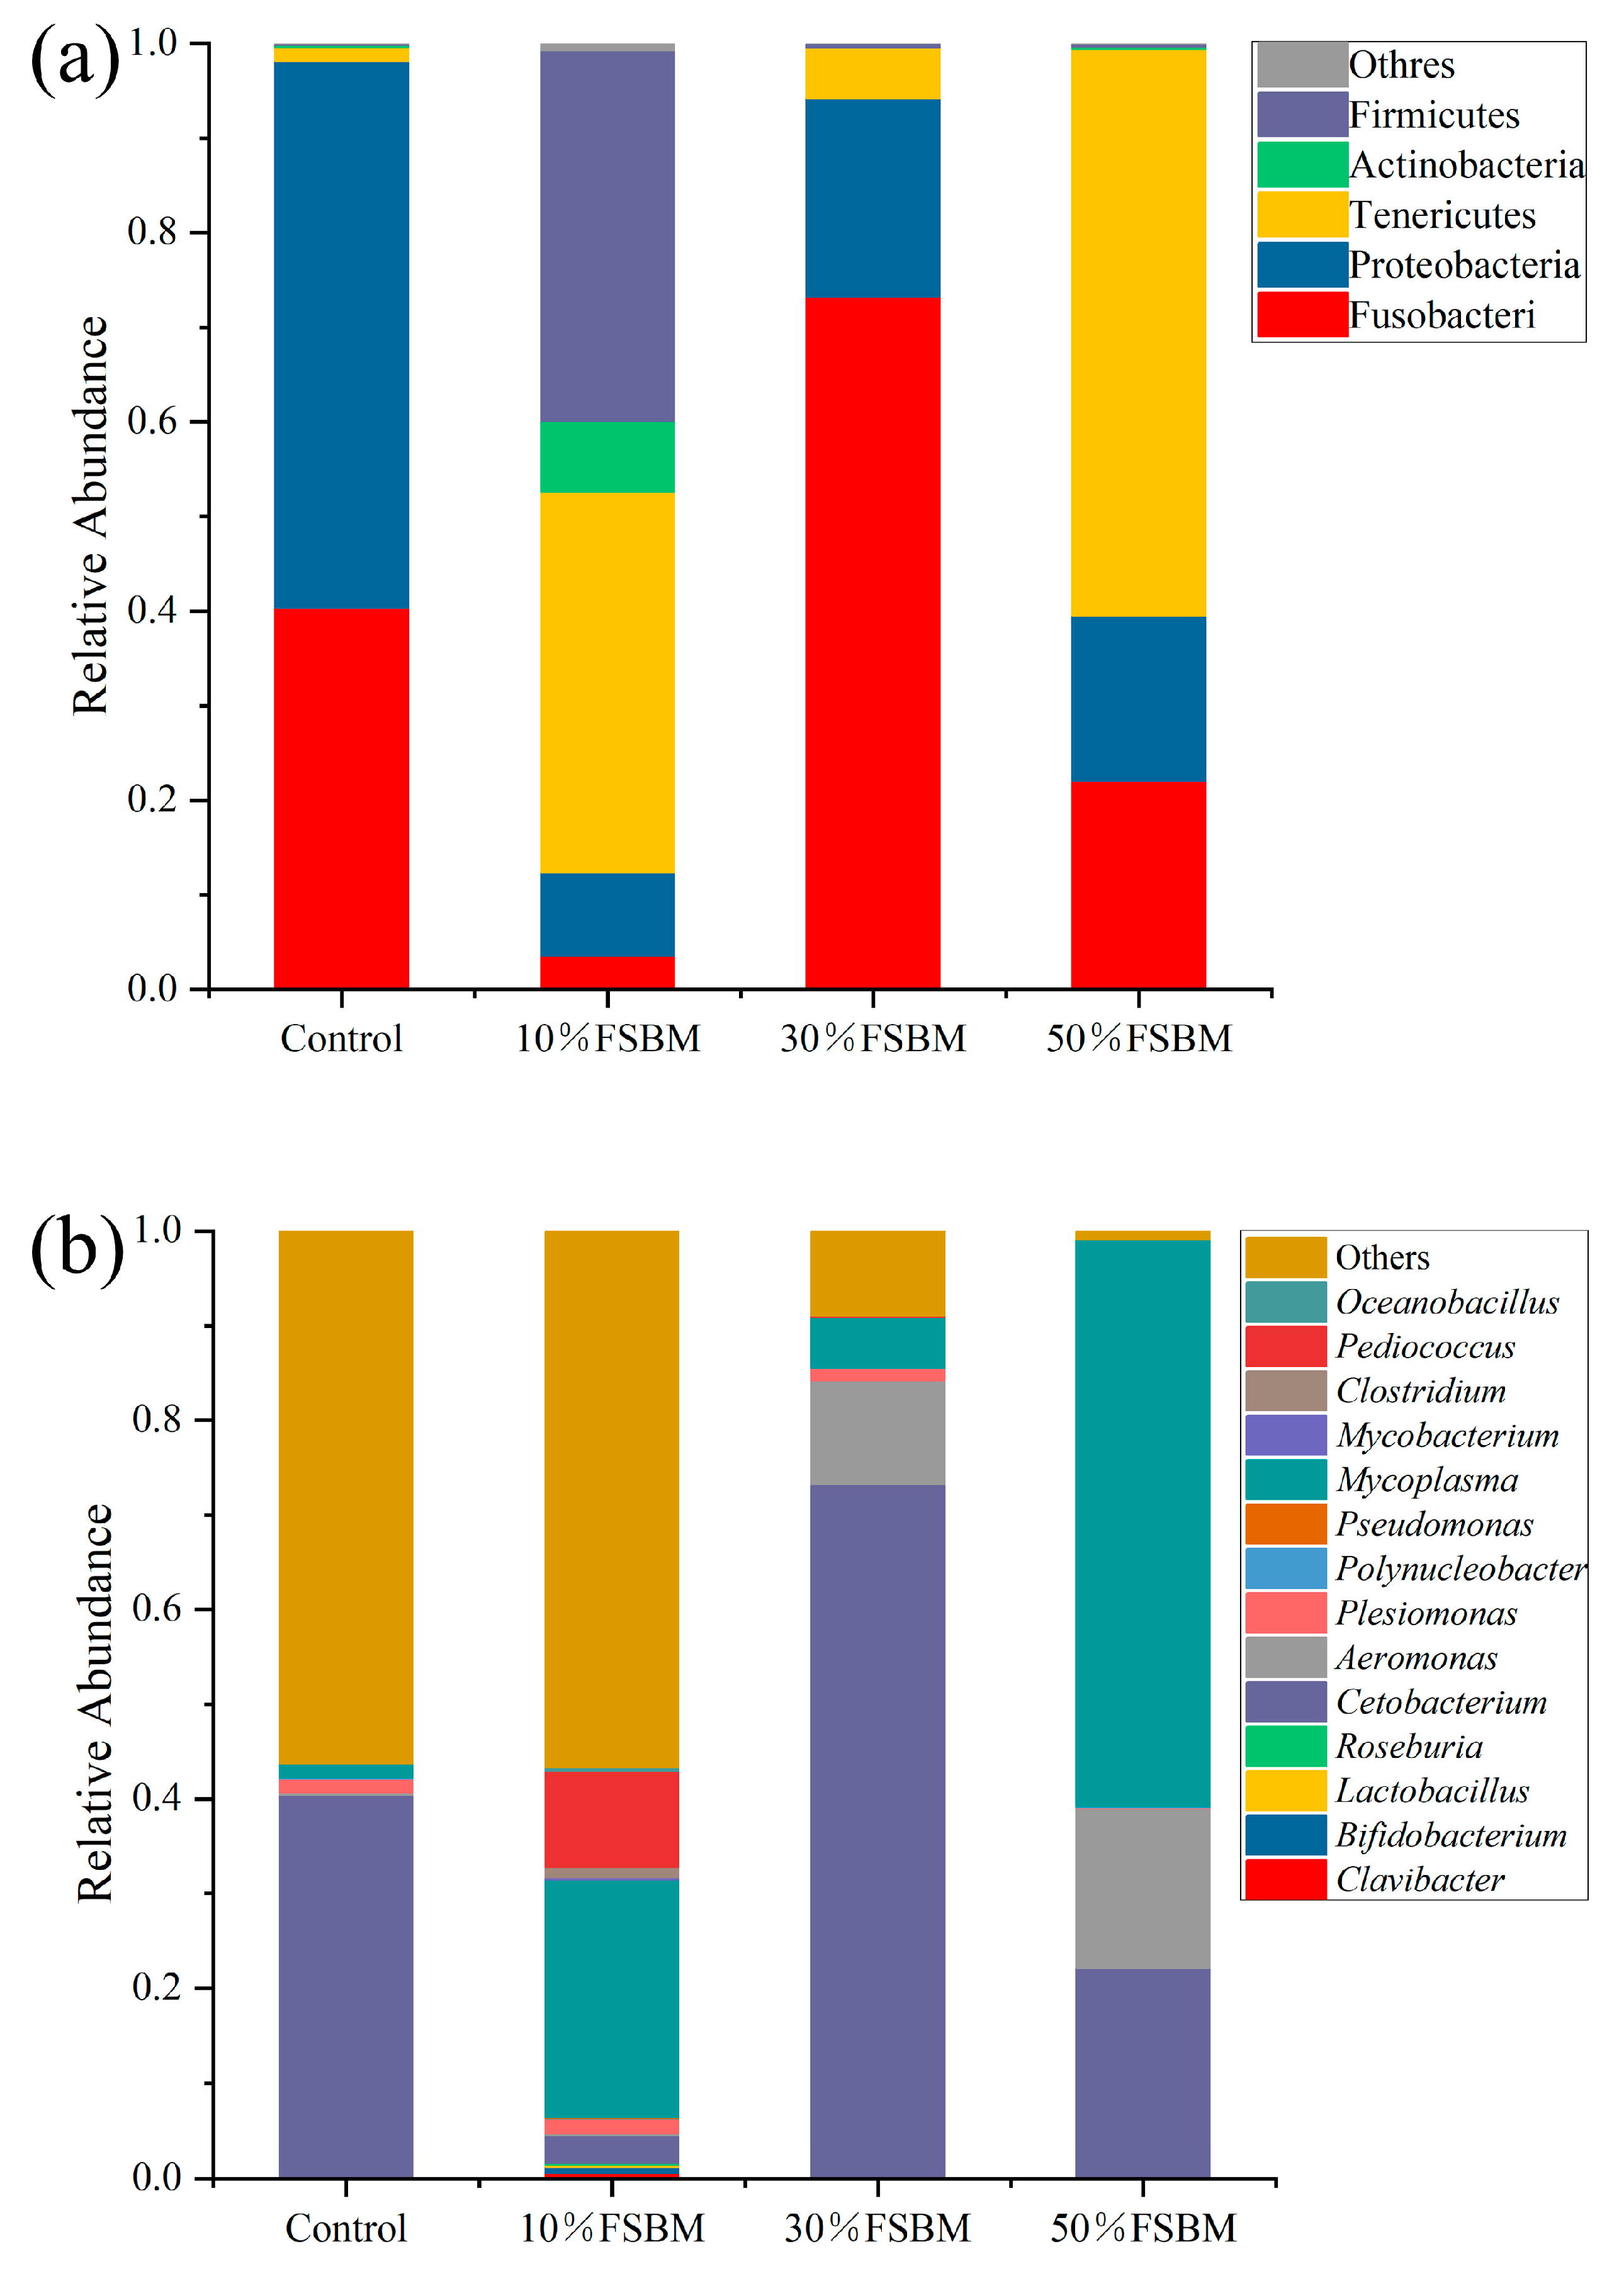
3.6. Effects of Fermented Soybean Meal Replacing Fish Meal on Intestinal Microbial Community Structure

Figure 3 illustrates the phylum and genus composition of microorganisms in different treatments. In all treatments, the largemouth bass gut microbiota consists primarily of Fusobacteria, Tenericutes, Proteobacteria, Firmicutes, and Actinobacteria. In the control group, Proteobacteria (57.84%) and Fusobacteria (40.33%) were the predominant microorganisms. As the proportion of FSBM substitution rises, Proteobacteria exhibited an increasing and then decreasing trend. Firmicutes and Tenericutes were more prevalent in the 10% FSBM treatment than in other groups. Fusobacteria and Actinobacteria were the predominant bacterial groups in the 30% and 50% FSBM treatments. In all treatment groups, the relative abundance of Proteobacteria was lower than that in the control. The abundance of Firmicutes was greater in all treatments than in the control. Cetobacterium, Mycoplasma, Aeromonas, Plesiomonas, and Pediococcus are the dominant microorganisms at the genus level. Cetobacterium (40.33%) and Plesiomonas were the most prevalent microorganisms in the control group (12.34%). The abundance of Cetobacterium first increased and then decreased as the proportion of fermented soybean meal substitution increased. Its relative abundance was highest in the 30% FSBM treatment. Pediococcus was more prevalent in the 10% FSBM group than in the other treatment groups. The relative prevalence of Mycoplasma was highest in the 50% FSBM group.

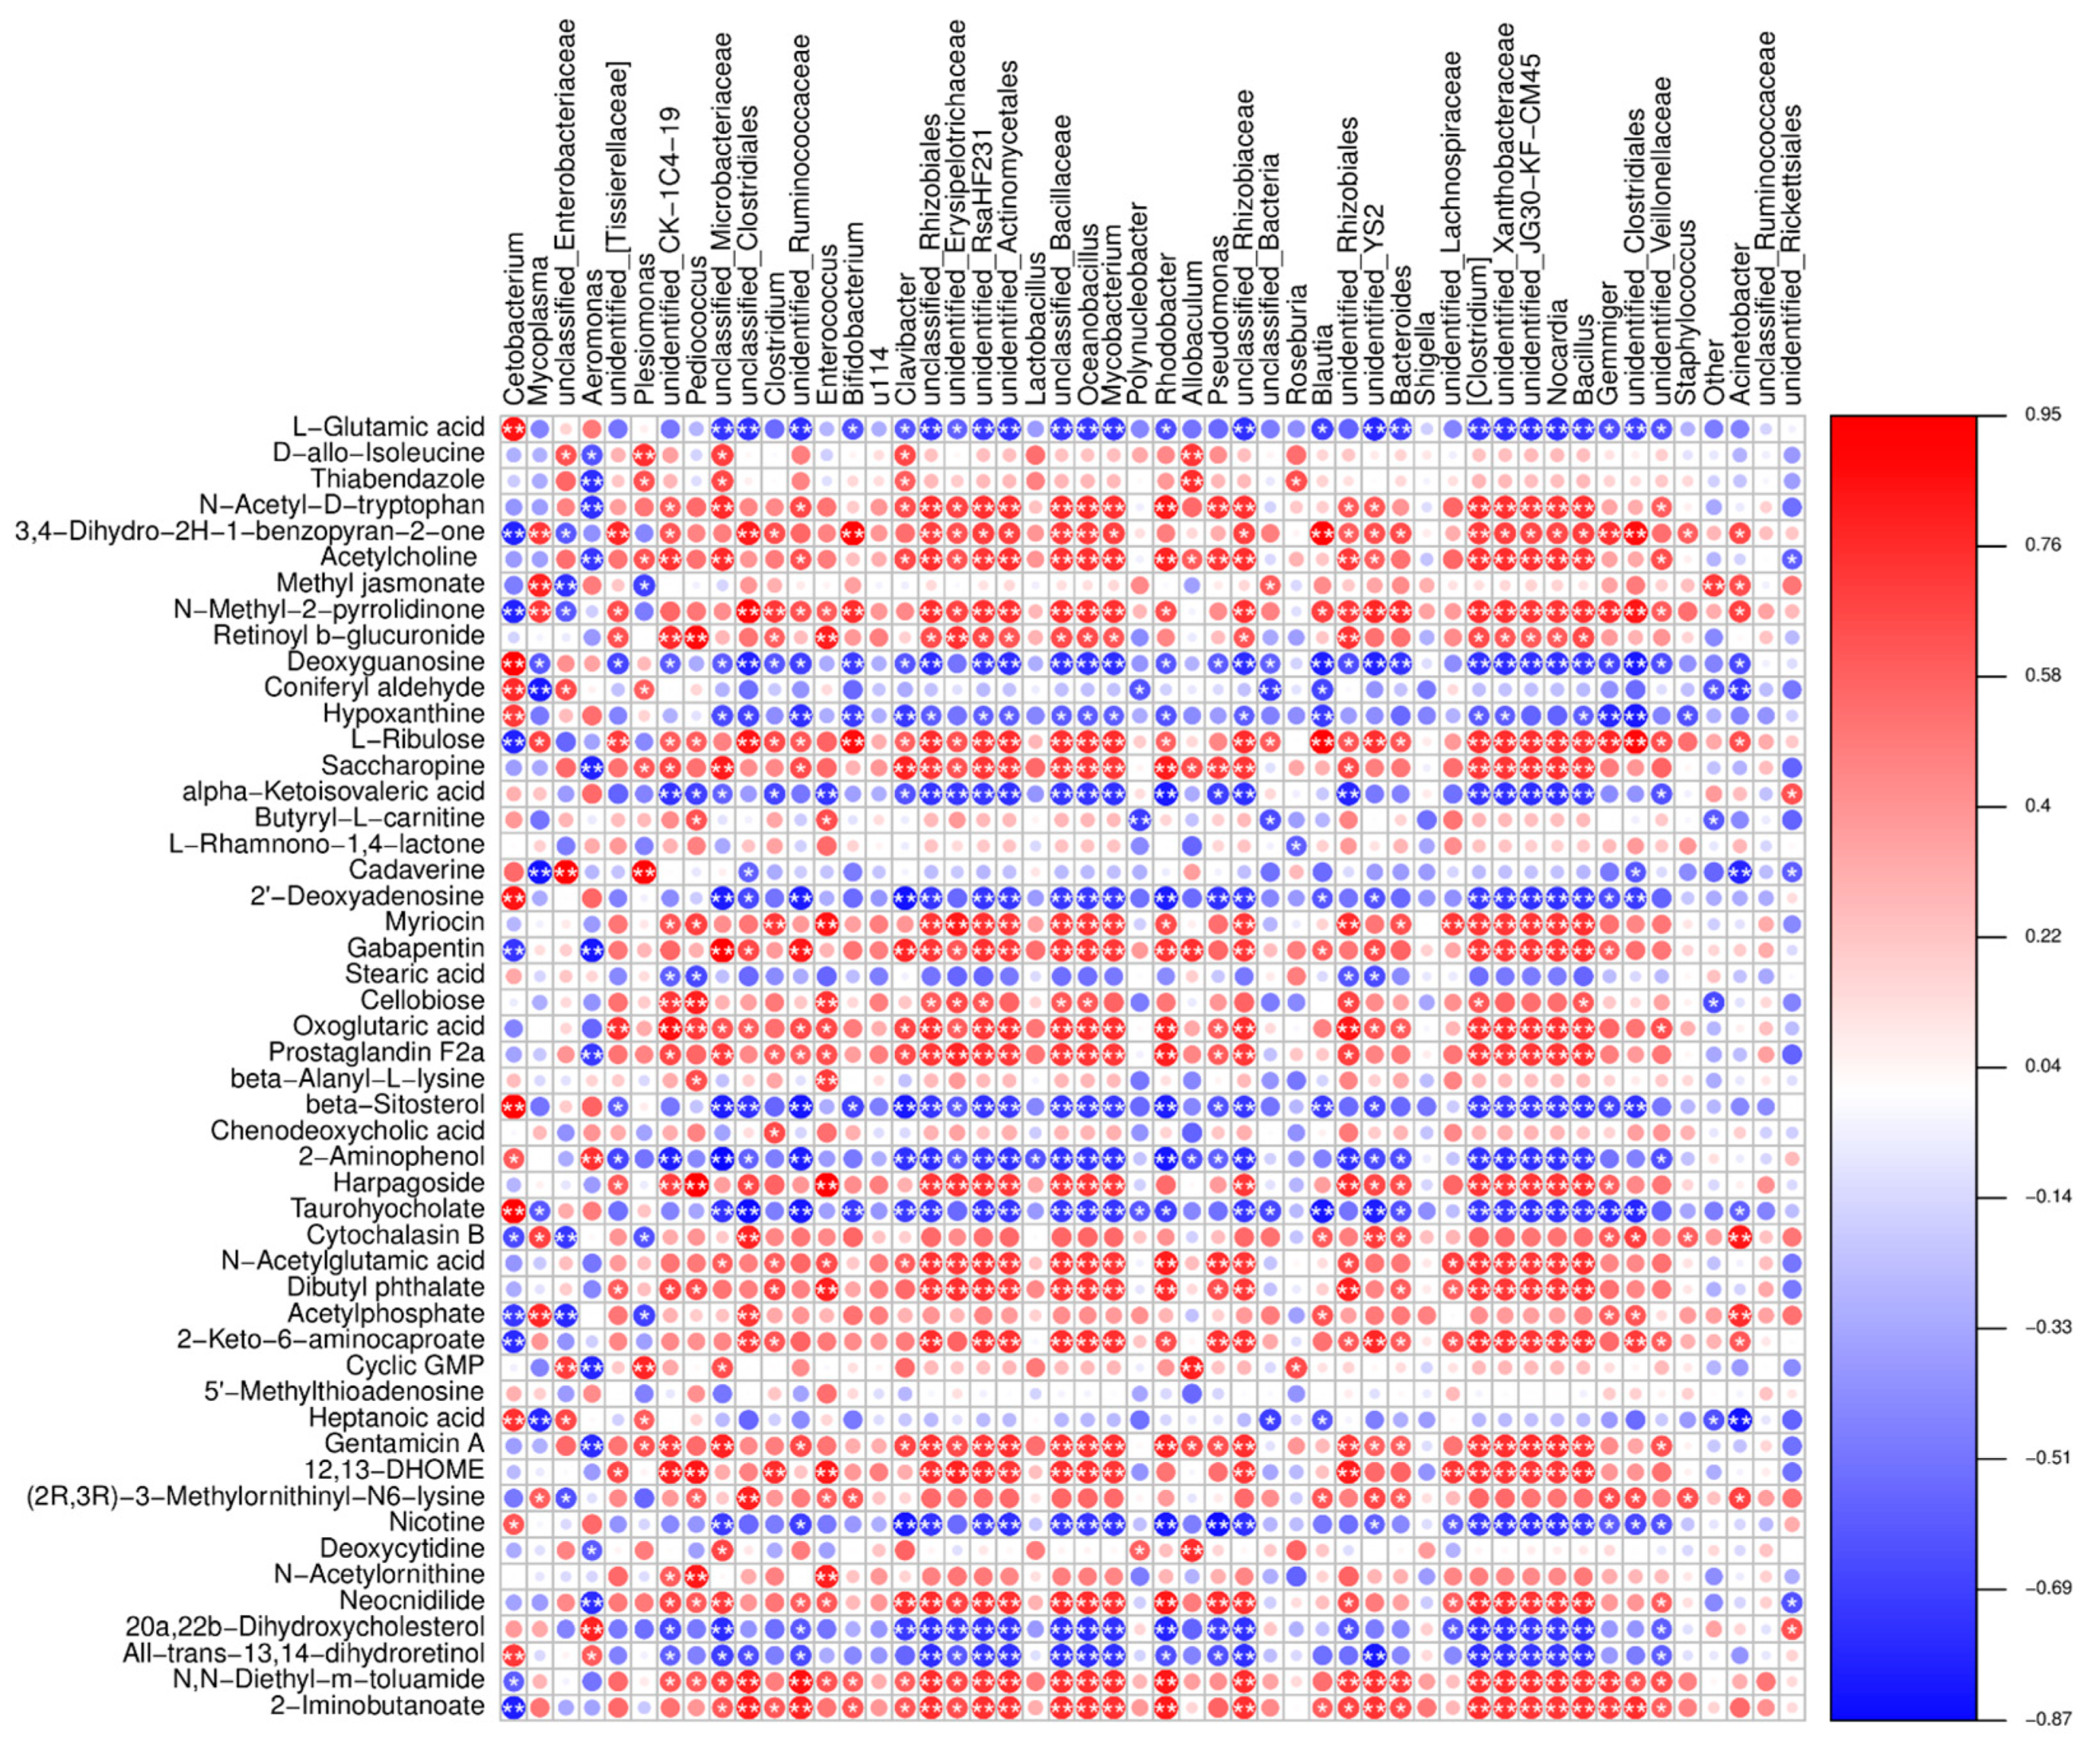
3.7. Effects of Fermented Soybean Meal Replacing Fish Meal on the Relationship between Metabolic Pathways and Metabolites

Figure 4 demonstrates that replacing fish meals with FSBM altered metabolites in distinct metabolic pathways. As depicted in Figure 4, the metabolic pathways of biosynthesis of amino acids and biosynthesis of plant secondary metabolites exhibited statistically significant differences (p < 0.05) between the control and all treatments. The oxoglutaric acid in both metabolic pathways was upregulated in the 10% FSBM treatment. However, there was no significant change (p > 0.05) in the 30% and 50% FSBM treatments. The presence of L−glutamic acid in the biosynthesis of amino acids and biosynthesis of plant secondary metabolites metabolic pathways decreased in the 10% FSBM treatment. It increased in the 30% FSBM treatment. Compared to the control, the 10% and 30% FSBM treatments increased the concentration of N−acetylornithine in the metabolic pathway of biosynthesis of amino acids. In contrast, the concentration of 5′−methylthioadenosine increased and stearic acid decreased in the metabolic pathway of biosynthesis of plant secondary metabolites. Cadaverine, in the metabolic pathway of the biosynthesis of plant secondary metabolites, decreased in treatments containing 10% and 50% FSBM. N−Acetylglutamic acid and alpha−ketoisovaleric acid in the metabolic pathway of amino acid biosynthesis were predicted to be upregulated and downregulated in the 10% FSBM group compared to the control group. In the metabolic pathway of amino acid biosynthesis, saccharopine was upregulated in the 10% FSBM group and downregulated in the 50% FSBM group. L−Asparagine, L−histidine, L−tryptophan, and L−lysine, which are involved in the metabolic pathways of biosynthesis of amino acids and biosynthesis of plant secondary metabolites, were downregulated in the 30% and 50% FSBM treatments.
As shown in Figure 5, oxoglutaric acid and N−acetylornithine were significantly (p < 0.01) positively correlated with the genus Pediococcus, whereas L−glutamic acid and cadaverine were significantly (p < 0.01) positively correlated with the Cetobacterium and Plesiomonas, respectively. However, there was no significant (p > 0.05) positive correlation between 5′−methylthioadenosine, stearic acid, N−acetylglutamic acid, alpha ketoisovalaric acid, and intestinal microorganisms, which changed along with the change in feed composition. Figure 3 demonstrates that the relative abundance of Pediococcus was greater in the 10% FSBM treatment than in the other treatments. Cetobacterium showed a trend of first increasing and then decreasing as FSBM increased. Its relative abundance was highest in the 30% FSBM treatment. The abundance of Plesiomonas was lower in all groups substituting fish meal with FSBM than in the control group. The increased abundance of Pediococcus, Cetobacterium, and Plesiomonas led to increased concentrations of oxoglutaric acid, N−acetylornithine, L−glutamic acid, and cadaverine, respectively.

4. Discussion

Two factors can be attributed to increased amino acid and crude protein content. First, due to the growth and metabolism of microorganisms, some carbon with solid forms was converted into CO2, increasing the relative content of crude protein. Second, microorganisms transformed a portion of inorganic nitrogen into amino acids, polypeptides, and SCP (signal-cell protein). This result was consistent with that of Hong et al. [15], who fermented soybean meal with Aspergillus oryzae GB107 and observed a significant increase in crude protein content. After fermentation, the phytic acid content decreased significantly (p < 0.05), which might be attributed to improved phytase and phosphatase activity [16,17]. Lin and Chen. [7] reported that the phytic acid degradation was pH-dependent and that the optimal pH range for most phytases was between 4.0 and 6.0. The pH of FSBM was decreased by lactic acid produced by S. thermophilus, which aided in enhancing phytase activity.
In the current study, FE decreased as the proportion of replaced FSBM increased. Lee et al. [18] discovered that soybean meal had a lower digestibility and utilization rate than animal protein. Numerous studies have demonstrated that fermentation can reduce anti-nutritional factors in SBM, thereby enhancing the growth performance of fish, the digestibility of nutrients, and the intestinal microbiome [19]. Lee et al. [1] reported that FSBM could replace 40% of fish meal by breeding rainbow trout and grouper without impairing their growth or feed efficiency. For shrimp, the replacement proportion can reach 75% [7]. When the replaced FSBM exceeded a certain threshold, the growth performance of the fish was impaired, and the FE decreased. This is attributable to three factors: (1) the content of indigestible carbohydrate (oligosaccharide) in FSBM is higher than that in fish meal, and protein digestibility is lower; (2) FSBM has low palatability, and anti-nutritional factors are not completely eliminated; (3) the amino acids in soybean meal are unbalanced [1]. This study demonstrated that FSBM could replace 30% of fish meal in the diet of largemouth bass without adversely affecting their growth. A suitable substitution can enhance the apparent digestibility of dry matter and protein. The presence of anti-nutritional factors in soybean meal impairs the utilization of nutrients in animal feed by inhibiting the activity of enzymes and causing adverse intestinal reactions [7]. In this study, the content of anti-nutritional factors in FSBM decreased significantly (p < 0.05), which could improve nutrient utilization. In addition, the enhancement of nutrient utilization may be closely related to organic acids such as lactic acid. For instance, previous studies have demonstrated that adding lactic acid to rainbow trout feed can improve nutrient utilization [7]. In addition, as the concentration of organic acids increased, the solubility of minerals also increased, which enhanced the utilization rate of nutrients [20].
Steatosis is a metabolic disorder caused by excess fatty acids entering the liver and a high peroxidation level. Steatosis of liver cells is indicative of liver cell damage. Steatosis is associated with an imbalance in the proportion of fatty acids [21]. Adding FSBM increased the degree of steatosis, indicating that considering the proportion of essential fatty acids in FSBM was worse than that in fish meals. Steatosis will cause dysfunction of liver function, and then affect the absorption and metabolism of nutrients, resulting in an increase in the feed-to-meat ratio. The intestine is an essential component of the digestive system. Based on its morphology and function, the intestine can be divided into the proximal intestine, midgut, and distal intestine. The distal intestine is the primary site for digestion and absorption of nutrients [22]. The height and width of the villus determine the area of contact between the mucosal epithelial cells and chyme, which is essential for digestion and absorption. This indicates that the substitution of FSBM has negative effects on intestinal morphology and absorption. In addition, the muscular layer is associated with intestinal peristalsis, and its thickness can indicate intestinal peristalsis capacity. Due to the presence of anti-nutritional factors in FSBM, which harmed the fish intestinal tract to a certain extent, FSBM substitution in the current study may have reduced the thickness of the muscle layer [11]. After intestinal injury, the utilization of nutrients was reduced, resulting in an increase in feed usage and increased costs. Severe changes in intestinal morphology could ultimately lead to small stature.
Serum biochemical indicators are considered the most important health status indicators. ALT is an essential amino acid transaminase in mitochondria that plays a crucial role in protein metabolism; its serum concentration is correlated with liver damage. Soltan et al. [23] reported that substituting fish meal with plant protein increased ALT and AST in tilapia serum. However, the results of this study demonstrated that substituting FSBM for fish meal increased the concentration of ALT and decreased the content of AST. The concentration of TP in serum can indicate the capacity for protein metabolism and synthesis. In this experiment, replacing fish meals decreased serum TP levels. Similarly, He et al. [11] asserted that substituting fish meals with SBM and FSBM in breeding largemouth bass decreased serum TP content. The low digestibility and utilization rate of protein caused by the unbalanced amino acid composition of plant protein may account for the decrease in serum TP [11]. GLB is a vital immune protein whose concentration correlates with disease resistance. Alkaline phosphatase activity can predict organ dysfunction and a high phosphatase concentration in serum indicates severe liver damage. The substitution of fish meals with FSBM increased alkaline phosphatase activity in the current study. This phenomenon was also observed in sturgeon breeding (Amur sturgeon) [24].
The main function of pro-inflammatory factors is to aggregate white blood cells into infected or damaged tissues. IL-1β plays a crucial role during microbial invasion and tissue damage because it can enhance phagocytosis, accelerate macrophage proliferation, lysozyme synthesis, and white cell migration [25]. Many studies have shown that probiotics regulate the production of anti-inflammatory factors in animals [26]. The Hepcidin gene plays a crucial role in iron metabolism and innate immunity. It is a regulator of iron homeostasis and an antibacterial peptide. Iron is a necessary component of infectious pathogens. Hepcidin restricts iron circulation by increasing its concentration, lengthening iron retention in phagocytes. Iron restriction is an innate immune response that can combat bacterial and viral infections in multicellular organisms [27]. For instance, Hu et al. [28] reported that the iron-limiting ability of Hepcidin-1 not only has bactericidal activity but also promotes the resistance of grass carp to Aeromonas hydrophila. Lee et al. [27] demonstrated that the expression of Hepcidin genes significantly increased in all organs and blood of olive flounder infected with pathogens. This study showed that the expression levels of Hepcidin-1 and Hepcidin-2 genes in the 30% FSBM and 50% FSBM groups were lower than those in the control, indicating that FSBM, to some extent, reduced the chance of largemouth bass infection with pathogens. The antioxidant response is a crucial defense mechanism exhibited by organisms. Therefore, any improvement in antioxidant activity would be beneficial for the health of aquatic animals. Superoxide dismutase (SOD) can decompose reactive oxygen species (ROS). SOD catalyzes the conversion of O2− to H2O2 as one of the main antioxidant defense mechanisms of oxidative stress [29]. In this experiment, the expression levels of SOD1, SOD2, and SOD3a in the liver of the FSBM treatment groups were greater than those of the control group, indicating that the antioxidant capacity of largemouth bass was enhanced to a certain degree (Figure 2b). This may be because fermentation increases the bioavailability of vitamins and extracellular polysaccharides, increasing antioxidant capacity [30]. Apoptosis is a highly regulated form of cell death that is essential for tissue homeostasis and organ development. The apoptosis process is separated into external and internal pathways. Caspase-3 initiates cell apoptosis after ligands bind to the death domain and activate external apoptotic pathways, followed by Caspase-8 activation [31]. The intrinsic apoptosis process, also called mitochondrial apoptosis, consists of three steps. Initially, oxidative stress causes mitochondrial dysfunction. Mitochondrial dysfunction plays a crucial role in the apoptotic signaling pathway. As ROS levels rise, lipid peroxides accumulate, and cytochrome-c is released from the cytoplasm [32]. Then, a stress that can activate Caspase-9 activates mitochondrial apoptosis. Finally, Caspase-9 induces liver cell apoptosis and fibrosis through Caspase-3 [32]. In this experiment, the levels of Caspase-9 expression were lower in the 10% FSBM, 30% FSBM, and 50% FSBM treatments than in the control. Caspase-3 and Caspase-8 expression levels were higher in the 10%, 30%, and 50% FSBM treatments than in the control. Consequently, substituting FSBM enhances the external apoptotic pathway while diminishing the internal apoptotic pathway.
The gut microbiota is a complex symbiotic system that influences the host’s physiology, nutrition, immunity, and metabolism [33]. Firmicutes consist of numerous types of lactic acid bacteria, such as Streptococcus, lactic acid bacteria, and Leuconostoc, which are regarded as probiotics and play a crucial role in the fish gut [22]. Dietary components play a crucial role in determining the composition of the gut microbiota [34]. Intestinal microorganisms and their metabolites play important roles in digestion, mucosal tolerance, immunity, and disease resistance. At the genus level, Plesiomonas was less abundant in all treatments than in the control. Plesiomonas is a prominent member of the Proteobacteria. P. shigellides is the only Plesiomonas species and a common intestinal pathogenic bacterium. Infecting tilapia and grass carp with P. shigelloides can result in varying degrees of tissue damage. The experimental results suggest that FSBM could prevent the colonization of the intestine by P. shigellides [35]. Certain members of the genus Cetobacterium can convert proteins and carbohydrates into vitamin B12 [35]. Mycoplasma is one of the most prevalent microorganisms in the gut of largemouth bass. The relative abundance of Mycoplasma was greater in the experimental groups than in the control groups. According to previous studies, Mycoplasma plays an important role in fish health. For instance, Rimoldi et al. [36] demonstrated that lactic acid and acetic acid produced by Mycoplasma in the intestine are beneficial to the health of rainbow trout (Oncorhynchus mykiss). Pediococcus is a lactic acid bacterial species. The majority of Pediococcus can produce pediocin bacteriocins, which are lethal to Listeria monocytogenes [37]. Aeromonas possesses a vast array of virulence factors that can cause diseases in fish. Aeromonas consists predominantly of A. hydrophila, A. veronii, and A. caviae [38]. This study discovered that substituting fish meals with FSBM increased the relative abundance of Aeromonas, which may increase the risk of infection in largemouth bass.
Diet composition may alter the metabolic pathways associated with the gut microbiome. L−Asparagine, L−histidine, L−tryptophan, and L−lysine, which are involved in the metabolic pathways of biosynthesis of amino acids and biosynthesis of plant secondary metabolites, were downregulated in the 30% and 50% FSBM treatments. This could be due to the imbalanced amino acid composition of FSBM compared to fish meals. Large-molecule carbohydrates, which cannot be directly absorbed by the intestine, can be degraded by intestinal microorganisms into small-molecule substances that are more readily absorbed by the intestine. Consequently, intestinal microorganisms can influence the health status of the host via metabolic products. Numerous substances, including amino acids, fats [39], fructose, and glucose [40], can influence the composition of the intestinal microorganisms in the host. Previous studies have demonstrated that microorganisms and metabolites interact. On the one hand, microorganisms are capable of synthesizing and decomposing metabolites. Metabolites, on the other hand, can stimulate or inhibit the growth of intestinal microorganisms [41]. Figure 5 shows the correlation between intestinal microorganisms and metabolites. Some metabolites showed a significant (p < 0.01) positive correlation with certain bacteria and a negative correlation with others. This phenomenon suggests that some microbial metabolites may have inhibitory effects on other microorganisms, resulting in a change in the composition of the microbial community [41].
Large-scale aquaculture increases the risk of diseases in aquatic animals. Feeding perch with FSBM can alter the microbial diversity of the fish intestine, thereby improving its immunity and reducing disease, which will increase its economic value. The price of SBM is cheaper than FM. Replacing part of FM using FSBM can reduce the initial investment and improve its competitiveness in the market. Replacing part of FM using FSBM (lower than 30%) does not have an adverse effect on the weight of the fish. Fish meat is the largest edible portion, and excessive use of FSBM instead of FM can cause severe weight loss and damage in the liver and intestines of bass, which is not conducive to growth, ultimately leading to a serious reduction in the economic benefits.

5. Conclusions

Fermentation with a mixture of bacteria (lactic acid bacteria, yeast, and Bacillus) can increase nutritional value (crude protein content and amino acid composition) and decrease anti-nutritional factor content. Based on the current findings, it can be concluded that using FSBM in feed containing 350 g kg−1 fish meal can replace 30% of fish meal in the breeding process of largemouth bass without affecting growth performance, feed digestibility, and antioxidant gene expression. Substitution of FSBM can affect the composition of intestinal microorganisms and, by extension, metabolic pathways, particularly the biosynthesis of amino acids and secondary metabolites in plants. This study provides theoretical support for the substitution of FSBM for fish meal. If FSBM can be used to replace fish meal, it can alleviate the current shortage of fish meal to some extent.

Supplementary Materials

The following supporting information can be downloaded at: https://www.mdpi.com/article/10.3390/fermentation9060520/s1, Table S1: Primer sequences used for real-time PCR analysis.

Author Contributions

Conceptualization, L.W. and W.Z.; methodology, Z.W.; software, T.Y.; validation, S.W. and Y.C.; formal analysis, Z.X.; investigation, Q.W.; resources, R.C.; data curation, J.L. (Jinle Liu); writing—original draft preparation, J.L. (Jixiang Liu); writing—review and editing, X.X.; visualization, T.Y.; supervision, Y.C.; project administration, S.W.; funding acquisition, H.Y. All authors have read and agreed to the published version of the manuscript.

Funding

This study was supported by the National Natural Science Foundation of China (project number: 52200178), the start-up fund of Zhengzhou University (project number: 32213091), China Postdoctoral Science Foundation (project number: 2022M722869), Henan Province Science and Technology Research (project number: 232102310333). We are also very grateful to Personalbio (http://www.personalbio.cn) (accessed on 14 December 2022) for the help in the analysis of intestinal microorganisms and language editing.

Institutional Review Board Statement

Not applicable.

Informed Consent Statement

Not applicable.

Data Availability Statement

The data presented in this study are available on request from the corresponding author.

Conflicts of Interest

The authors declare that they have no known competing financial interests or personal relationships that could have appeared to influence the work reported in this paper.

References

  1. Lee, S.M.; Azarm, H.M.; Chang, K.H. Effects of dietary inclusion of fermented soybean meal on growth, body composition, antioxidant enzyme activity and disease resistance of rockfish (Sebastes schlegeli). Aquaculture 2016, 459, 110–116. [Google Scholar] [CrossRef]
  2. Watanabe, T. Strategies for further development of aquatic feeds. Fish. Sci. 2002, 68, 242–252. [Google Scholar] [CrossRef]
  3. Hassaan, M.S.; Soltanb, M.A.; Abdel-Moezc, A.M. Nutritive value of soybean meal after solid state fermentation with Saccharomyces cerevisiae for Nile tilapia, Oreochromis niloticus. Anim. Feed Sci. Technol. 2015, 201, 89–98. [Google Scholar] [CrossRef]
  4. Hua, K.; Cobcroft, J.M.; Cole, A.; Condon, K.; Jerry, D.R.; Mangott, A.; Praeger, C.; Vucko, M.J.; Zeng, C.; Zenger, K.; et al. The future of aquatic protein: Implications for protein sources in aquaculture diets. One Earth 2019, 1, 316–329. [Google Scholar] [CrossRef]
  5. Seong, M.; Lee, S.; Lee, S.; Song, Y.; Bae, J.; Chang, K.; Bai, S.C. The effects of different levels of dietary fermented plant-based protein concentrate on growth, hematology and non-specific immune responses in juvenile olive flounder, Paralichthys olivaceus. Aquaculture 2018, 483, 196–202. [Google Scholar] [CrossRef]
  6. Drew, M.D.; Borgeson, T.L.; Thiessen, D.L. A review of processing of feed in-gredients to enhance diet digestibility in finfish. Anim. Feed Sci. Technol. 2007, 138, 118–136. [Google Scholar] [CrossRef]
  7. Lin, Y.H.; Chen, Y.T. Lactobacillus spp. fermented soybean meal partially substitution to fish meal enhances innate immune responses and nutrient digestibility of white shrimp (Litopenaeus vannamei) fed diet with low fish meal. Aquaculture 2022, 548, 737634. [Google Scholar] [CrossRef]
  8. Refstie, S.; Sahlström, S.; Bråthen, E.; Baeverfjord, G.; Krogdahl, P. Lactic acid fermentation eliminates indigestible carbohydrates and antinutritional factors in soybean meal for Atlantic salmon (Salmo salar). Aquaculture 2005, 246, 331–345. [Google Scholar] [CrossRef]
  9. Hong, Y.C.; Chu, J.H.; Kirby, R.; Sheen, S.S.; Chien, A. The effects of replacing fish meal protein with a mixture of poultry by-product meal and fermented soybean meal on the growth performance and tissue nutritional composition of Asian seabass (Lates calcarifer). Aquac. Res. 2021, 52, 4105–4115. [Google Scholar] [CrossRef]
  10. Daniel, N. A review on replacing fish meal in aqua feeds using plant protein sources. Int. J. Fish. Aquat. Stud. 2018, 6, 164–179. [Google Scholar]
  11. He, M.; Yu, Y.F.; Li, X.Q.; Poolsawat, L.; Yang, P.X.; Bian, Y.H.; Leng, X.J. An evaluation of replacing fish meal with fermented soybean meal in the diets of largemouth bass (Micropterus salmoides): Growth, nutrition utilization and intestinal histology. Aquac. Res. 2020, 51, 4302–4314. [Google Scholar] [CrossRef]
  12. AOAC-Association of Official Analytical Chemists. Official Methods of Analysis, Agricultural Chemicals, 19th ed.; Gaithersburg: Maryland, VA, USA, 2007; pp. 46–48. [Google Scholar]
  13. Haug, W.; Lantzsch, H.J. Sensitive method for the rapid determination of phytate in cereals and cereal products. J. Sci. Food Agric. 1983, 34, 1423–1426. [Google Scholar] [CrossRef]
  14. Sun, J.-L.; Zhao, L.-L.; Liao, L.; Tang, X.-H.; Cui, C.; Liu, Q.; He, K.; Ma, J.-D.; Jin, L.; Yan, T.; et al. Interactive effect of thermal and hypoxia on largemouth bass (Micropterus salmoides) gill and liver: Aggravation of oxidative stress, inhibition of immunity and promotion of cell apoptosis. Fish Shellfish Immunol. 2020, 98, 923–936. [Google Scholar] [CrossRef]
  15. Hong, K.J.; Lee, C.H.; Kim, S.W. Aspergillus oryzae GB-107 fermentation improves nutritional quality of food soybeans and feed soybean meals. J. Med. Food. 2004, 7, 430–435. [Google Scholar] [CrossRef] [PubMed]
  16. Olukomaiya, O.O.; Adiamo, O.Q.; Fernando, W.C.; Mereddy, R.; Li, X.; Sultanbawa, Y. Effect of solid-state fermentation on proximate composition, anti-nutritional factor, microbiological and functional properties of lupin flour. Food Chem. 2020, 315, 126238. [Google Scholar] [CrossRef] [PubMed]
  17. Zamudio, M.; Gonzalez, A.; Medina, J.A. Lactobacillus plantarum phytase activity is due to non-specific acid phosphatase. Lett. Appl. Microbiol. 2001, 32, 181–184. [Google Scholar] [CrossRef]
  18. Lee, S.M. Apparent digestibility coefficients of various feed ingredients for juvenile and grower rockfish (Sebastes schlegeli). Aquaculture 2002, 207, 79–95. [Google Scholar] [CrossRef]
  19. Kari, Z.A.; Kabir, M.A.; Mat, K.; Rusli, N.D.; Razab, M.K.A.A.; Ariff, N.S.N.A.; Wei, L.S. The possibility of replacing fishmeal with fermented soy pulp on the growth performance, blood biochemistry, liver, and intestinal morphology of African catfish (Clarias gariepinus). Aquac. Rep. 2021, 21, 100815. [Google Scholar] [CrossRef]
  20. Lim, C.; Lückstädt, C.; Webster, C.D.; Kesius, P. Organic acids and their salts. In Dietary Nutrients, Additives, and Fish Health; John Wiley & Sons, Inc.: Hoboken, NJ, USA, 2015; pp. 305–319. [Google Scholar]
  21. Ribeiro, L.; Moura, J.; Santos, M.; Colen, R.; Rodrigues, V.; Bandarra, N.; Soares, F.; Ramalho, P.; Barata, M.; Moura, P.; et al. Effect of vegetable based diets on growth, intestinal morphology, activity of intestinal enzymes and haematological stress indicators in meagre (Argyrosomus regius). Aquaculture 2015, 447, 116–128. [Google Scholar] [CrossRef]
  22. Huang, B.; Zhang, S.; Dong, X.; Chi, S.; Yang, Q.; Liu, H.; Tan, B.; Xie, S. Effects of fishmeal replacement by black soldier fly on growth performance, digestive enzyme activity, intestine morphology, intestinal flora and immune response of pearl gentian grouper (Epinephelus fuscoguttatus ♀ × Epinephelus lanceolatus ♂). Fish Shellfish Immunol. 2022, 120, 497–506. [Google Scholar] [CrossRef]
  23. Soltan, M.; Hanafy, M.; Wafa, M. Effect of replacing fish meal by a mixture of different plant protein sources in Nile tilapia (Oreochromis niloticus L.) diets. Glob. Vet. 2008, 2, 157–164. [Google Scholar]
  24. Xu, Q.Y.; Wang, C.A.; Zhao, Z.G.; Luo, L. Effects of replacement of fish meal by soy protein isolate on the growth, digestive enzyme activity and serum biochemical parameters for juvenile Amur sturgeon (Acipenser schrenckii). Asian-Australas. J. Anim. Sci. 2012, 25, 1588–1594. [Google Scholar] [CrossRef] [PubMed]
  25. Magnadottir, B.; Lange, S.; Gudmundsdottir, S.; Bogwald, J.; Dalmo, R.A. Ontogeny of humoral immune parameters in fish. Fish Shellfish Immunol. 2005, 19, 429–439. [Google Scholar] [CrossRef]
  26. Akhter, N.; Wu, B.; Memon, A.M.; Mohsin, M. Probiotics and prebiotics associated with aquaculture: A review. Fish Shellfish Immunol. 2015, 45, 733–741. [Google Scholar] [CrossRef] [PubMed]
  27. Lee, Y.; Kim, N.; Roh, H.; Park, J.; Kim, M.; Lee, J.; Kim, D.H. Hepcidin-1 in olive flounder (Paralichthys olivaceus): Gene expression, antimicrobial and therapeutic effects of synthetic peptides against bacterial and viral infections. Aquaculture 2020, 560, 738480. [Google Scholar] [CrossRef]
  28. Hu, Y.; Kurobe, T.; Liu, X.; Zhang, Y.A.; Su, J.; Yuan, G. Hamp type-1 promotes antimicrobial defense via direct microbial killing and regulating iron metabolism in grass carp (Ctenopharyngodon idella). Biomolecules 2020, 10, 825. [Google Scholar] [CrossRef]
  29. Fridovich, I. Superoxide radical and superoxide dismutases. Annu. Rev. Biochem. 1995, 64, 97–112. [Google Scholar] [CrossRef]
  30. Verni, M.; Verardo, V.; Rizzello, C.G. How fermentation affects the antioxidant properties of cereals and legumes. Foods 2019, 8, 362. [Google Scholar] [CrossRef]
  31. McIlwain, D.R.; Berger, T.; Mak, T.W. Caspase functions in cell death and disease. Cold Spring Harb. Perspect. Biol. 2013, 5, a008656. [Google Scholar] [CrossRef]
  32. Yu, L.L.; Yu, H.H.; Liang, X.F.; Li, N.; Wang, X.; Li, F.H.; Wu, X.F.; Zheng, Y.H.; Xue, M.; Liang, X.F. Dietary butylated hydroxytoluene improves lipid metabolism, antioxidant and anti-apoptotic response of largemouth bass (Micropterus salmoides). Fish Shellfish Immunol. 2018, 72, 220–229. [Google Scholar] [CrossRef]
  33. Chen, G.F.; Yin, B.; Liu, H.Y.; Tan, B.P.; Dong, X.H.; Yang, Q.H.; Zhang, S. Effects of fish meal replacement with cottonseed protein concentrate on growth, digestive proteinase, intestinal morphology and microflora in pearl gentian grouper (♀ Epinephelus fuscoguttatus ×Epinephelus lanceolatu). Aquac. Res. 2020, 51, 2870–2884. [Google Scholar] [CrossRef]
  34. Wei, H.; Xing, S.; Chen, P.; Wu, X.; Gu, X.; Luo, L.; Xue, M. Plant protein diet-induced hypoimmunity by affecting the spiral valve intestinal microbiota and bile acid enterohepatic circulation in Amur sturgeon (Acipenser schrenckii). Fish Shellfish Immunol. 2020, 106, 421–430. [Google Scholar] [CrossRef] [PubMed]
  35. Meng, X.; Cai, H.; Li, H.; You, F.; Jiang, A.; Hu, W.; Li, K.; Zhang, X.; Zhang, Y.; Chang, X.; et al. Clostridium butyricum-fermented Chinese herbal medicine enhances the immunity by modulating the intestinal microflora of largemouth bass (Micropterus salmoides). Aquaculture 2023, 562, 738768. [Google Scholar] [CrossRef]
  36. Rimoldi, S.; Gini, E.; Iannini, F.; Gasco, L.; Terova, G. The effects of dietary insect meal from Hermetia illucens prepupae on autochthonous gut microbiota of rainbow trout (Oncorhynchus mykiss). Animals 2019, 9, 143. [Google Scholar] [CrossRef] [PubMed]
  37. Porto, M.C.W.; Kuniyoshi, T.M.; Azevedo, P.O.S.; Vitolo, M.; Oliveira, R.P.S. Pediococcus spp.: An important genus of lactic acid bacteria and pediocin producers. Biotechnol. Adv. 2017, 35, 361–374. [Google Scholar] [CrossRef] [PubMed]
  38. Ghatak, S.; Blom, J.; Das, S.; Sanjukta, R.; Puro, K.; Mawlong, M.; Shakuntala, I.; Sen, A.; Goesmann, A.; Kumar, A.; et al. Pan-genome analysis of Aeromonas hydrophila, Aeromonas veronii and Aeromonas caviae indicates phylogenomic diversity and greater pathogenic potential for Aeromonas hydrophila. Antonie Leeuwenhoek 2016, 109, 945–956. [Google Scholar] [CrossRef] [PubMed]
  39. Kim, S.; Kim, S.; Kim, A.; Kang, S.; Park, M.; Sung, M. Dietary fat intake and age modulate the composition of the gut microbiota and colonic inflammation in C57BL/6J mice. BMC Microbiol. 2019, 19, 193. [Google Scholar] [CrossRef]
  40. Do, M.; Lee, E.; Oh, M.; Kim, Y.; Park, H. High-glucose or -fructose diet cause changes of the gut microbiota and metabolic disorders in mice without body weight change. Nutrients 2018, 10, 761. [Google Scholar] [CrossRef]
  41. Xia, Y.; Yu, E.M.; Lu, M.; Xie, J.J.A. Effects of probiotic supplementation on gut microbiota as well as metabolite profiles within Nile tilapia, Oreochromis niloticus. Aquaculture 2020, 527, 735428. [Google Scholar] [CrossRef]
Figure 1. Morphology of the distal intestine (magnification 5×) and histological sections of hepatocytes of the liver (HE-stained, 20×) of largemouth bass fed different diets for 8 weeks. Blue arrow: lamina propria width; orange arrow: villus width, green arrow: villus height, red arrow: hepatic steatosis. (a): Control of the liver; (b): 10%FSBM of the liver; (c): 30%FSBM of the liver; (d): 50%FSBM of the liver. (e): Control of the distal intestine; (f): 10%FSBM of the distal intestine; (g): 30%FSBM of the distal intestine; (h): 50%FSBM of the distal intestine.
Fermentation 09 00520 g001
Figure 2. Expression of genes of largemouth bass fed the experimental diets for 8 weeks. Bars with different lower cases mean a significant difference (p < 0.05). 10%: 10%FSBM; 30%: 30%FSBM; 50%: 50%FSBM. (a): the relative gene expression related to immunity; (b): the relative gene expression related to antioxidation; (c): the relative gene expression related to apoptosis antioxidation.
Fermentation 09 00520 g002
Figure 3. Relative abundances of intestinal bacteria of largemouth bass fed the experimental diets at the phylum level (a); Relative abundances of intestinal bacteria of largemouth bass fed the experimental diets at the genus level (b).
Fermentation 09 00520 g003
Figure 4. Bubble chart of KEGG pathways and changes in metabolites in metabolic pathways. (a): 10%FSBM vs. control; (b): 30%FSBM vs. control; (c): 50%FSBM vs. control.
Fermentation 09 00520 g004
Figure 5. Heatmap of the correlation between gut microbiota and metabolites. The legend on the right is the correlation coefficient, where red indicates a positive correlation and blue indicates a negative correlation. *: p < 0.05, **: p < 0.01.
Fermentation 09 00520 g005
Table 1. Ingredients and proximate composition of experimental diets (air dry basis, g kg−1).
IngredientsControl10% FSBM30% FSBM50% FSBM
Fish meal350315245175
Fermented soybean meal047.7143.1238.5
Corn gluten meal180180180180
Wheat flour145.8132.7106.380
Wheat gluten meal80808080
Fish oil20202020
Corn oil2021.323.225.7
Soybean phospholipid30303030
Lysine4444
Arginine6666
Methionine8888
Monocalcium phosphate20202020
Mineral premix5555
Vitamin premix5555
Carboxymethyl cellulose40404040
Y2O31111
Microcrystalline cellulose75.274.373.471.8
Alpha starch10101010
Proximate composition (% dry-matter basis)
Moisture7.27 ± 0.0317.4 ± 0.0557.72 ± 0.0467.84 ± 0.07
Crude Protein45.97 ± 0.1646.42 ± 0.2245.98 ± 0.4445.6 ± 0.1
Crude fiber8.93 ± 0.139.45 ± 0.199.53 ± 0.5911.32 ± 0.32
Ash8.65 ± 0.078.74 ± 0.099.33 ± 0.249.34 ± 0.184
Crude lipid10.86 ± 0.09911.61 ± 0.1911.55 ± 0.3111.92 ± 0.2
NFE25.5923.5923.6121.82
GE (kJ/g)18.6718.5118.6018.20
Note: Nitrogen-free extract (NFE) = 100 − (crude protein + crude lipid + crude fiber + ash). Gross energy (GE, kJ g−1) = (crude protein × 23.6) + (NFE × 17.2) + (crude lipid × 39.5). Vitamin premix (kg−1 premix): vitamin A, 6,000,000 IU; vitamin D3, 1,000,000 IU; vitamin E, 5000 mg; vitamin K3, 1500 mg; vitamin B3, 5000 mg; vitamin B2, 3500 mg; vitamin B12, 100 mg; vitamin C, 2500 mg; niacinamide, 3800 mg; calcium pantothenate, 2000 mg; folic acid, 200 mg; biotin, 300 mg; inositol, 6000 mg; methionine, 2000 mg; lysine, 5000 mg; zinc, 300 mg; iron, 2100 mg. Mineral premix (mg kg−1 premix): CuSO4, 2000; KI, 100; FeSO4, 10,000; MnSO4, 5000; Na2Se2O3, 100; ZnSO4, 5000; CoCl2, 200.
Table 2. Hydrolyzed amino acid, crude protein, and phytic acid content of soybean meal and fermented soybean meal.
The Type of Amino AcidSBM (mg g−1 Dry Matter Basis)FSBM (mg g−1 Dry Matter Basis)Change (%)
Essential amino acid
Valine19.34320.263+4.76
Methionine10.53511.175+6.07
Isoleucine26.41027.559+4.35
Leucine33.68136.324+7.85
Threonine17.77618.168+2.21
Phenylalanine22.22324.508+10.28
Histidine14.50713.782+5.00
Lysine26.43526.589+0.58
Arginine26.74027.548+3.02
Non-essential amino acid
Aspartic acid45.33145.359+0.06
Proline39.14939.581+1.10
Serine22.29122.423+0.59
Glutamic acid71.52173.187+2.33
Glycine17.24817.950+4.07
Alanine17.63618.015+2.15
Cysteine2.6333.274+24.34
Tyrosine17.74118.198+2.58
Total amino acid431.2443.903+2.95
Crude protein460.3494.6+7.45
Phytic acid29.8 ± 0.215.3 ± 0.16−48.66
Note: Data are presented as the means ± SD (n = 3).
Table 3. Growth performance of largemouth bass fed the experimental diets for 8 weeks.
ParametersControl10% FSBM30% FSBM50% FSBM
IBW 60.45 ± 0.69 a60.39 ± 0.42 a60.72 ± 0.54 a60.28 ± 0.92 a
FBW 172.99 ± 6.65 a162.65 ± 5.73 a169.04 ± 6.26 a130.32 ± 5.20 b
SR 100100100100
WG 186.18 ± 10.99 a169.33 ± 9.49 a178.39 ± 10.30 a116.18 ± 8.63 b
SGR 1.88 ± 0.069 a1.77 ± 0.063 b1.83 ± 0.066 ab1.38 ± 0.071 c
FCR 1.11 ± 0.067 b1.21 ± 0.066 b1.22 ± 0.070 b1.79 ± 0.13 a
FE 90.12 ± 5.32 a82.73 ± 4.64 a82.24 ± 4.75 a55.93 ± 4.16 b
VSI 8.37 ± 0.40 a7.84 ± 0.48 ab7.39 ± 0.16 b7.66 ± 0.12 ab
CF 2.34 ± 0.038 a2.32 ± 0.048 ab2.30 ± 0.032 b2.29 ± 0.040 b
HIS 12.54 ± 0.068 a2.32 ± 0.18 ab1.79 ± 0.093 c1.95 ± 0.069 bc
Note: Data are presented as the means ± SD (n = 3). Values with different superscripts within the same row are significantly different (p < 0.05). Initial body weight (IBW, g). Final body weight (FBW, g). Survival rate (SR, %) = 100 × (final fish number/initial fish number). Weight gain rate (WG, %) = 100 × (final body weight-initial bodyweight)/initial body weight. Specific growth rate (SGR, % day−1) = 100 × (ln final body weight-ln initial body weight)/days. Feed conversion ratio (FCR) = total dry diet consumed/weight gain. Feed efficiency (FE, %) = 100 × weight gain/dry feed fed. Visceral somatic index (VSI, %) = 100 × (Viscera Weight/Fish Weight). Condition factor (CF, %) = 100 × weight of fish (g)/(length of fish)3 cm3. Hepatosomatic index (HSI, %) = 100 × (liver weight/body weight).
Table 4. Apparent nutrient digestibility coefficient (%) of the experimental diets in largemouth bass.
Control10% FSBM30% FSBM50% FSBM
ADDM72.09 ± 0.6473.53 ± 0.0668.02 ± 0.2769.16 ± 0.04
ADCP74.17 ± 0.1075.64 ± 0.2968.43 ± 0.3069.85 ± 0.85
ADCL80.21 ± 0.4483.39 ± 0.5585.57 ± 0.2584.22 ± 0.15
Note: Data are presented as the means ± SD (n = 3). ADDM: apparent digestibility coefficient of dry matter; ADCP: apparent digestibility coefficient of crude protein; ADCL: apparent digestibility coefficient of crude lipid.
Table 5. Morphological of the distal intestinal tract of largemouth bass fed different diets for 8 weeks.
Control10% FSBM30% FSBM50% FSBM
The height of intestinal villi (mm)0.9571 ± 0.0073 a0.9437 ± 0.0758 a0.6888 ± 0.0468 b0.7704 ± 0.0518 b
The width of intestinal villi (mm)0.1606 ± 0.0134 a0.1345 ± 0.1366 b0.1332 ± 0.0130 b0.1315 ± 0.0026 b
Muscle layer thickness (mm)0.1867 ± 0.2575 a0.1608 ± 0.0343 a0.1549 ± 0.0113 a0.1668 ± 0.0060 a
Note: Data are presented as the means ± SD (n = 3). values with different superscripts in the same row differ significantly (p < 0.05).
Table 6. Serum biochemical parameters of largemouth bass fed the experimental diets for 8 weeks.
Control10% FSBM30% FSBM50% FSBM
ALT (U/L)1.22.21.31.7
AST (U/L)13.212.411.612.7
TP (g/L)2014.418.513.3
ALB (g/L)9.66.38.46
GLB (g/L)10.48.110.17.3
GLU (mmol/L)8.73.74.353.61
ALP (U/L)649510270
Note: ALT: alanine aminotransferase; AST: aspartate aminotransferase; TP: total protein; ALB: albumin; GLB: globulin; GLU: glucose; ALP: alkaline phosphatase.
Disclaimer/Publisher’s Note: The statements, opinions and data contained in all publications are solely those of the individual author(s) and contributor(s) and not of MDPI and/or the editor(s). MDPI and/or the editor(s) disclaim responsibility for any injury to people or property resulting from any ideas, methods, instructions or products referred to in the content.

