Abstract
Dioscorea opposite waste (DOW) has been shown to improve the gastrointestinal microbiome, antioxidation capacity, and immune activity, indicating it is a potential feed resource to improve the physiological health and rumen function of weaned lambs. In the present study, the responses of rumen microbiome to DOW supplementation in diet were profiled using metagenome sequencing. In addition, the potential of DOW to regulate plasma parameters in weaned lambs and its possible mechanisms were investigated. Sixty healthy male small tail Han lambs (22.68 ± 2.56 kg) were selected and equally assigned to four dietary treatments: (1) DOW-free diet (CON), (2) addition of 10% DOW diet (DOW1), (3) addition of 15% DOW diet (DOW2), and (4) addition of 20% DOW diet (DOW3). Experimental lambs were fed a corresponding diet for 62 days. Rumen microbiome and plasma parameters were determined at the end of the experiment. The results showed that dietary supplementation with DOW linearly increased the concentration of aspartate aminotransferase, alkaline phosphatase, Immunoglobulin A, Immunoglobulin M, Immunoglobulin G, Glutathione peroxidase, Superoxide dismutase, and total antioxidant capacity in the plasma of weaned lambs, but an opposite trend was observed in Interleukin-1β, Interleukin-6, tumor necrosis factor-α, and Malondialdehyde between the DOW-supplemented group and the CON group. Sequencing of rumen metagenome revealed that dietary supplementation with 20% DOW significantly affected the microbial composition and function and increased the richness and diversity of rumen microbiota and relative abundance of phylum Verrucomicrobia, Planctomycetes, Fibrobacteres, Chloroflexi, Actinobacteria, and Acidobacteria and species Ruminococcaceae_bacterium, Clostridiales_bacterium_NK3B98, Clostridiales_bacterium, and Clostridia_bacterium. It was concluded that supplementing the weaned lamb’s ration with DOW increased the immune response and antioxidant capacity in a dose-dependent manner. Meanwhile, dietary supplementation with 20% DOW modulated the composition of rumen microbiome function by increasing Ruminococcaceae_bacterium and Clostridiales_bacterium with improving the polysaccharide hydrolase activity in the rumen.
1. Introduction
In recent years, the efficient utilization of feed consumed by ruminants has grown in interest as an area of research because of increased emphasis on agriculture sustainability [1], and considerable research has been committed to exploiting innovative feed resources to meet the challenges of the rapidly increased production costs in the industry [2,3]. Therefore, there is an urgent need to identify and explore the potential of alternative non-conventional feed sources that are economical, environmentally friendly, and socially acceptable.
Dioscorea is a genus comprising 600 species in the family Dioscoreaceae and subfamily Dioscoreoideae, 93 of which are distributed in China [4,5]. China and Mexico are the two major producers of Dioscorea opposita, accounting for approximately 67% of global Dioscorea opposita production [6]. In China, yam (Rhizoma dioscorea, Dioscorea opposite) is cultivated over an area of about 2000 km2 per year, with an annual production of about 20,000 tons [7]. For many years, Chinese yam has been used in pharmaceutical manufacturing and food processing to improve stomach function, reduce anorexia, and alleviate diarrhea [8,9]. At the same time, it generates a vast quantity of inexpensive Dioscorea opposite waste (DOW), most of which is discarded, resulting in environmental damage and resource waste. Data showed that Dioscorea opposite Thunb will contribute to the development of new functional foods and even in the treatment of intestinal flora disorders [10]. A recent study showed that Dioscorea polysaccharides enriched beneficial intestinal bacteria and inhibited bacterial pathogens in SD rat cecum [11,12,13]. Similarly, it has been reported that ethanol extract of Chinese Dioscorea flour improves digestibility and enriches lactose fermenting bacteria in rats [8]. Gupta et al. [14] found that bioactive compounds of Dioscorea and its supplementation are important for the regulation of body weight changes, carbohydrate digestion, activity of transport enzymes, morphology of the intestine, alterations in blood lipids, lipid peroxidation, and prevention of liver damage. Additionally, Dioscorea has received more attention as a feed resource due to its suitable mineral elements [15,16], well-balanced essential amino acids [17], total phenols, total flavonoids, allantoin, and polysaccharides [18], as well as various other positive effects [19]. A previous study showed that dietary supplementation with Dioscorea dumetorum at 5%, 10%, and 15% did not influence the growth performance of broiler chickens [20]. It was also reported that supplementing with Chinese yam peel at 1% and 2% promoted the immunity of carp by modulating the gut microbiota and enhancing the intestinal defense barrier [21].
However, the understanding of the influence of DOW on ruminants, especially in weaned lambs, is quite limited, which is a barrier to the application and development of DOW in ruminants. Recent evidence suggested that Dioscorea can improve the growth performance of goats and pre-weaning lambs [22,23]. An in vivo trial in goats showed that replacing 30% of corn-fed diets with Dioscorea alata L. dry meal significantly improved the antioxidant capacity of Hainan black goats in the perinatal period [24]. The suitable nutritional composition of Dioscorea and its successful application in monogastric animals to regulate intestinal health and organismal metabolism has aroused great interest in its potential role in rumen function and physiological metabolism. To date, the understanding of the influence of DOW on rumen microbiome and plasma metabolites remains unclear. It could be hypothesized that ruminant nutrient metabolism is actively involved in DOW through its interaction with the host microorganism. Metagenomic sequencing was included to elucidate the influence of DOW on rumen microbial composition and function. Further, the effect of DOW on lamb plasma metabolism was evaluated by quantifying blood routine, antioxidant, and immune indicators. It will provide a basis for applications of DOW in ruminants.
2. Materials and Methods
2.1. Location and Ethical Considerations
All procedures used in this study were approved by the Laboratory Animal Ethics Committee of Hebei Agricultural University (Hebei, P.R. China; permit number 2018082).
2.2. Animals, Diets and Management
The animal experiment was carried out on Hengshui Zhihao animal husbandry Technology Co., Ltd. in Hebei province, China (37°32′14″ N–37°41′25″ N, 115°28′59″ E–115°41′40″ E). Throughout the study period, the temperature was kept at 1.2–13.5 °C, and the mean relative humidity was kept at 40.6%. The experiment was a completely randomized design with sixty male small tail Han lambs (2 months old) with a similar initial body weight of 22.68 ± 2.56 kg being selected and randomly allocated into one of four DOW treatments (15 lambs per treatment). The treatment had identical basal ration but varied in the percentage of DOW added, and were: 0% (CON), 10% (DOW1), 15% (DOW2), and 20% (DOW3). The basal ration was prepared based on National Research Council recommendations with forage to concentrate ratio of 55:45 [25]. The ingredients and nutritional compositions of the basal ration are shown in Table 1. The DOW is provided by Dengfeng Ma Yam Professional Cooperative in China, and its ingredient and chemical composition was displayed in Table 2. The experiment lasted 62 days, with 14 days of adaptation and 48 days of the trial.

Table 1.
Ingredient and chemical composition of diet (% of DM).

Table 2.
Ingredient and chemical composition of DOW (% of DM).
All the lambs were given ad libitum access to their respective diet and fresh water in individual pens. The experimental ration was separated into two equal parts and fed to the lambs half at 0600 h and 1800 h. The daily allowance of feeds to the animals was determined according to the ad libitum feed intake measured in the adaptation period, ensuring the rejected feed accounted for 3–5% of the provided feed. During the adaption, the lambs are dewormed, ear-tagged, and vaccinated. Simultaneously, the treatment diets were supplemented with the corresponding DOW, while the control group’s diet stayed unchanged.
2.3. Diet Sample Collection and Analysis
The basal ration was collected weekly and stored at −20 °C before chemical analysis. The samples of the total mixed ration were dried and ground to pass through a 40-mesh sieve. The dry matter (DM) and ash contents of feeds were determined according to AOAC (2005) using methods No. 930.15 and 942.05 [26]. The nitrogen (N) contents of feeds were analyzed by the Kjeldahl method [27], and crude protein (CP) content was calculated as N × 6.25 according to AOAC (2005) using method No. 981.10 [26]. The neutral detergent fiber (NDF) and acid detergent fiber (ADF) concentrations were measured according to the method described by Van Soest et al. [28] in an ANKOM 2000 Fiber Analyzer (ANKOM Technologies, Macedon, NY, USA) with treated with heat-stable α-amylase and adding sodium sulfite. The starch concentration was measured using the method reported by Oliveira et al. [29]. Calcium concentration was determined using a flame atomic absorption spectrophotometer (WFX-320, BRAIC, Beijing, China), and phosphorus was measured with a UV spectrophotometer (UV-VIS 8500, Shanghai Tianmei Scientific Instrument Co., Ltd., Shanghai, China). The DOW polysaccharides were separated using an Ultrasonic Cleaner (KQ3200E, Kun Shan Ultrasonic Instruments CO., Ltd., Shanghai, China) and then evaluated using the method described by Do D T et al. [30].
2.4. Blood Sample Collection and Measurements
At the end of the experiment, six lambs with similar body weight were selected from each group before morning feeding, and the blood samples were collected from the jugular vein into 5-mL anticoagulant tubes containing 10 mg K2EDTA, then immediately centrifuged at 8000× g for 10 min at 4 °C to receive plasma samples, which were stored at −80 °C in a refrigerator for further analysis.
The plasma albumin (ALB), total protein (TP), creatinine (Cre), alanine aminotransferase (ALT), alkaline phosphatase (ALP), aspartate aminotransferase (AST), gamma-glutamyltransferase (GGT), triglyceride (TG), uric acid (UA), glucose (GLU), high-density lipoprotein (HDL), low-density lipoprotein (LDL), and cholesterol (CHO) were analyzed using an automatic biochemical analyzer (BS-280, Mindray Bio-Medical Electronics Co., Ltd., Shenzhen, China). The plasma Interleukin-1β (IL-1β), Interleukin-6 (IL-6), and tumor necrosis factor-α (TNF-α) were detected by ELISA kit (Jiangsu Enzyme Industry Co., Ltd. lot numbers MM-36938O2 (TNF-α), MM-0120O1 (IL-1β) and MM-0119O1 (IL-6)) and microplate reader (Rayto, RT-6100) with reference to the instructions. The Immunoglobulin A (IgA), Immunoglobulin M (IgM), and Immunoglobulin G (IgG) were analyzed using commercial kits (Solarbio Science & Technology Co., Ltd., Beijing, China) with reference to the instructions. The malondialdehyde (MDA), superoxide dismutase (SOD), glutathione peroxidase (GSH-Px), and total antioxidant capacity (T-AOC) were analyzed using the methods described by Zhao et al. [31] with visible spectrophotometer method.
2.5. Rumen Fluid Sampling
At the end of the experiment, the rumen fluid was collected at 0 h and 4 h after morning feeding from the same animals used for blood plasma collection in the CON and DOW3 groups. An esophageal stomach tube with a vacuum pump was inserted through the mouth into the rumen for sampling. In order to avoid saliva contamination, the initial 50 mL of rumen fluid was discarded, and subsequently, 40 mL of rumen fluid was strained through four-layer cheesecloth and placed into a 50-mL centrifugal tube as a representative sample. All samples were snap-frozen in liquid nitrogen and stored at −80 °C for microbiome analysis.
2.6. DNA Extraction, Library Preparation, and Metagenome Sequencing
Microbiome DNA was extracted from rumen fluids samples using HiPure Bacterial DNA Kits (Magen, Guangzhou, China) according to the manufacturer’s instructions. The concentration was determined using Qubit R dsDNA Assay Kits in a Qubit R 2.0 Fluorometer (Life Technologies, Carlsbad, CA, USA). The degree of DNA degradation and potential contamination was measured using 1% agarose gels, and quality was measured using Qubit (Thermo Fisher Scientific, Waltham, MA, USA) Shotgun metagenomic sequencing, which was performed on Illumina NovaSeq/Hiseq Xten at Gene Denovo Co., Ltd. (Guangzhou, China). Qualified genomic DNA was firstly fragmented to a size of 350 bp by sonication, and then end-repaired, A-tailed, and adaptor ligated using NEBNext® ΜLtra™ DNA Library Prep Kit for Illumina (NEB, Ipswich, MA, USA) according to the preparation protocol. DNA fragments with length of 300–400 bp were enriched by PCR. At last, PCR products were purified using AMPure XP system (Beckman Coulter, Brea, CA, USA) and libraries were analyzed for size distribution by 2100 Bioanalyzer (Agilent, Santa Clara, CA, USA) and quantified using real-time PCR. Genome sequencing was performed on the Illumina Novaseq 6000 sequencer using pair-end technology (PE 150).
2.7. Assembly, Gene Prediction and Gene Catalogue
To obtain high-quality clean reads, raw data from the Illumina platform was filtered using FASTP (v0.20.0), firstly, removing reads with more than 10% unidentified nucleotides (N); then, reads with more than 50% bases with phred quality scores of less than 20 were removed; and finally, removing reads aligned to the barcode adapter. The reads contaminated by adaptor and lamb hosts reads were removed using Bowite2 [32]. Clean reads were obtained after filtering and used for genome assembly. The sequence data for each sample were assembled individually using MEGAHIT [33] in the k-mer range of 21 to 99 to generate sample-derived assemblies, and the unmapped reads of each sample were polled for re-assembly using MEGAHIT, to generate a mixed assembly. Subsequently, de novo assembly statistics were evaluated by realigning singleton reads using BWA [33]. Contigs were predicted based on the final assembly contigs (>500 bp) using MetaGeneMark [34]. The predicted genes (≥300 bp) from all samples were pooled and combined based on 95% identity and 90% reads coverage using CD-HIT (version4.6) [35] in order to reduce the number of redundant genes for the downstream assembly step. The reads were re-aligned to predicted gene using Bowtie (version 2.2.5) to count reads numbers. After read filtering, was used to generate taxonomic profiles. For gene function annotation, all unique ORFs were against the National Center for Biotechnology Information (NCBI), Encyclopedia of Genes and Genomes (KEGG), evolutionary genealogy of genes: Nonsupervised Orthologous Groups (eggNOG) database, and CAZy database (dbCAN2 version) using DIAMOND [36].
2.8. Taxonomy Profiles
Microbial taxonomic profiles were generated using Kaiju (version 1.6.3) [37] after reads trimming. Briefly, the overall quality and potential problems of reads were first evaluated using FastQC (version 0.11.5). Trimmomatic (version 0.36) was used to trim raw reads by removing ambiguous nucleotides (N’s), extremely short reads (<25 bp), and low-quality bases with a sliding window method; bases within a window size of 4 were cut once the average quality was less than 15 in the Phred scale. The clean reads were subjected to taxonomy classification with the representative bacterial and archaeal genomes from the proGenomes database. The abundance matrix was imported into MetagenomeSeq (version 1.6) to calculate sample distances and Shannon diversity. Genera with significantly different abundance between the “DOW3” and “CON” samples were identified using edgeR (version 3.16.5) with FDR corrected p values < 0.0556.
2.9. Statistical Analysis
Statistical analysis was performed using R software (version 3.5.1). Bray–Curtis distance matrix based on gene/taxon/function gene abundance was generated by Vegan package. Principal component analysis of Bray–Curtis distances were calculated using R vegan package and plotted using R ggplot2 package. Violin plot and box plot were graphed using R ggplot2 package. Heatmap graph was plotted using R Pheatmap package. Beta diversity was visualized using principal-coordinate analysis (PCoA) as calculated based on the weighted UniFrac matrix distances and plotted in R (version 3.2.4). Biomarker features in each group were screened by Metastats (version 20090414) and LEfSe software (version 1.0).
A normal distribution of plasma parameters were analyzed using the Shapiro–Wilk method in SAS 9.4 (SAS Inst. Inc., Cary, NC, USA). Then, all data were analyzed by the Proc mixed of SAS, with results presented as the least squares mean and standard error of the mean. The analytical model was as follows:
where trt is a fixed effect. Each replicate served as an experimental unit. Differences among treatment means were tested for significance using LSD multiple range test using the CONTRAST procedures of SAS to examine the effects of increasing DOW supplementation through linear and quadratic orthogonal contrasts. The residual normality test was performed using Proc Univariate with the Normal and Plot options. Differences were declared to be significant at p < 0.05 and a tendency at 0.05 < p < 0.10.
Yijk = Mean + trt + Error
3. Results
3.1. Routine Plasma Biochemical Indicators
The results in Table 3 showed that dietary supplementation with DOW linearly decreased the concentration of UA (p = 0.049), ALP (p = 0.035), and AST (p = 0.002), whereas it did not affect the plasma concentration of TP and other indicators (p > 0.05).

Table 3.
Plasma biochemical indicators of lambs supplemented with Dioscorea opposite wastes.
3.2. Plasma Immune Parameters
The plasma immune parameters of lambs fed various experimental diets are summarized in Table 4. With increased DOW supplementation, the activity of IgA (p < 0.001)., IgM (p < 0.001) and IgG (p < 0.001) were elevated in a linear dose-dependent manner. However, dietary supplementation with DOW linearly suppressed the concentration of IL-1β (p < 0.001), IL-6 (p < 0.001) and TNF-α (p < 0.001) in the plasma of weaned lambs.

Table 4.
Plasma immune markers of lambs supplemented with Dioscorea opposite wastes.
3.3. Plasma Antioxidant Index
The effect of DOW on plasma antioxidant indexes of weaned lambs was shown in Table 5. Dietary supplementation with DOW had a significant effect on the plasma antioxidant indexes. DOW linearly increased the concentration of glutathione GSH-Px (p < 0.001), SOD (p < 0.001) and T-AOC (p < 0.001) and decreased the MDA activity (p < 0.001) in a linear manner.

Table 5.
Plasma antioxidant index of lambs supplemented with Dioscorea opposite wastes.
3.4. Rumen Microorganism Profiles
In total, 8,630,542.04 CleanData were kept, with over 7,192,118.4 for each sample (Supplementary Table S1). Metagenome sequencing generates beyond 3203.72 ContigsNumber per sample with an average N50 length of 1.78 kb, including 6.27 million non-redundant genes and an average open reading frame (ORF) length of 1071 bp (Supplementary Table S2). The results revealed that the lambs were colonized with a diverse and abundant (5006 genera, Supplementary Table S3) microbial community. Phylogenetic analysis of metagenomic data at the domain level revealed that approximately 96.7% of sequences belong to bacteria, while 2% belong to fungi, Archaea, and viruses (Figure 1A). A total of 25 phyla and over 200 species of bacteria were identified (Figure 1A). At the phylum level, Bacteroidetes (48%) and Firmicutes (36%) (Figure 1B) had the higher relative abundance, which was consistent with previous research [38], and at the genus level, the most predominant bacterial genera were Prevotella, Bacteroides, Clostridium, and Ruminococcus, representing more than 45% of the total sequences (Figure 1C). The identified fungi were from 10 different phyla, dominated by Ascomycota, Basidiomycota, Chytridiomycota, and Mucoromycota (Figure 1D). In terms of viruses, Caudovirates are the most prevalent.
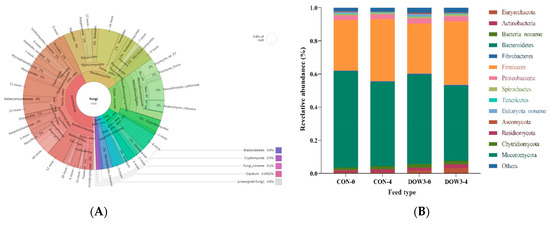
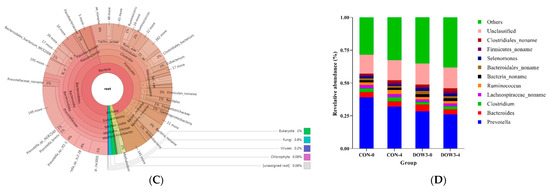
Figure 1.
Classification of the microbiota community composition across the DOW and CON groups. (A) Krona chart illustrating the distribution of all microbiota taxonomic. (B) Phylum level. (C) Krona chart illustrating the distribution of fungi taxonomic. (D) Genus level. The different colors of the bars in B and C represent different species, and the length of the bars represents the proportion of the species.
3.5. Composition of Rumen Microbiota Structure
The difference in rumen bacterial community composition was estimated using the alpha diversity indices for different dietary treatments before (0 h) and after (4 h) feeding. Overall, α-diversity of rumen including Shanon and Chao1 diversity increased at hours 0 and 4 after lambs were fed the DOW3 diet (Figure 2A, B). The principal-coordinate (PCoA) analysis depicted the different bacterial community structures in the DOW3 and CON groups, indicating that the DOW influences the composition of the microbial communities (Figure 2C). Consistent with the observation above, at the phylum level, the results showed that dietary supplementation with 20% DOW significantly increased the abundance of Verrucomicrobia, Planctomycetes, Fibrobacteres, Chloroflexi, Actinobacteria, and Acidobacteria before feeding (Figure 3A). At the species level, the abundance of Ruminococcaceae_bacterium, Clostridiales_bacterium_NK3B98, Clostridiales_bacterium, and Clostridia_bacterium were significantly higher in the DOW3 group before feeding (Figure 3B). To further assess the difference of bacterial community between CON and DOW3 groups and identify the specific biomarker, a linear discriminant analysis (LDA) effect size (LEfSe) was performed. Results revealed that there were 72 biomarkers before feeding (Figure 4A), including 57 in group DOW3 and 15 in group CON, while there were 9 biomarkers after feeding (Figure 4B), including 6 in group DOW3 and 3 in group CON.
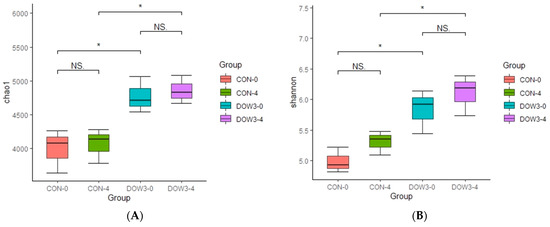
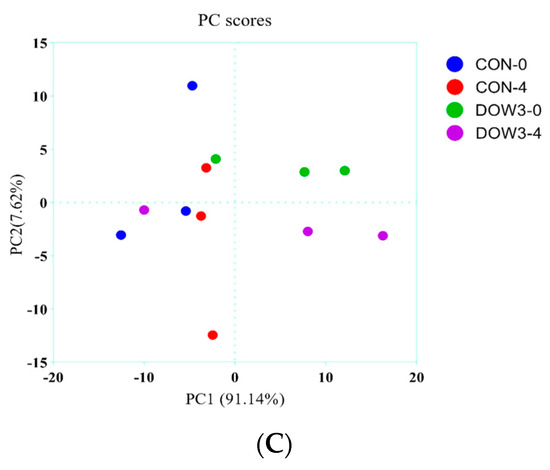
Figure 2.
Differences in weaned lambs’ ruminal microbiota diversity and richness between the DOW and CON groups. (A) Bacterial diversity was estimated by Shannon index. (B) Bacterial richness estimated by the Chao1 value. * indicates significant difference between the Concentrate Group and the Forage Group (p ≤ 0.05). (C) Principal coordinate analysis (PCoA) of rumen microbial communities. CON-0, control group and before feeding. CON-4, control group and after feeding 4 h. DOW3-0, dietary supplementation with 20% DOW and before feeding. DOW3-4, dietary supplementation with 20% DOW and after feeding 4 h.
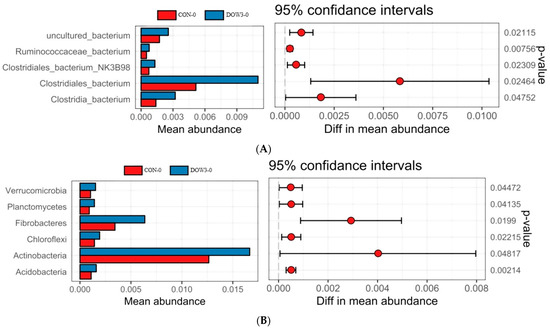
Figure 3.
The relative abundances of significantly differentially detected microbiota between control and DOW-supplemented group. (A) Phylum level; (B) species level. Positive differences indicate greater abundance of bacteria at the phylum level and at the species level in the DOW-supplemented group, while negative differences indicate greater abundance in the CON group. CON-0, control group and before feeding. CON-4, control group and after feeding 4 h. DOW3-0, dietary supplementation with 20% DOW and before feeding. DOW3-4, dietary supplementation with 20% DOW and after feeding 4 h.
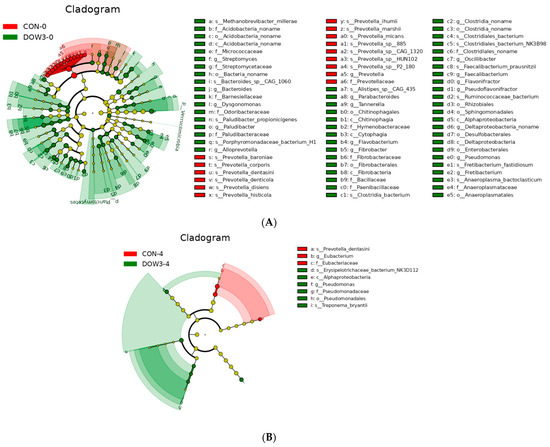
Figure 4.
Linear discriminant analysis (LDA) effect size (LEfSe) of the ruminal microbiota (p < 0.05 by Kruskal–Wallis test; p < 0.05 by pairwise Wilcoxon test; logarithmic LDA score of > 2.0) of weaned lambs fed diet supplementation with 0% DOW or 20% DOW. (A) Before feeding. (B) After feeding. Taxonomic rank labels are provided before bacterial names; p_, c_, o_, f_, and g_ indicate phylum, class, order, family, and genus, respectively. The greater the LDA score of the biomarker taxon mean value, the greater the influence of species abundance on the difference in the microbial community in the different treatments. CON-0, control group and before feeding. CON-4, control group and after feeding 4 h. DOW3-0, dietary supplementation with 20% DOW and before feeding. DOW3-4, dietary supplementation with 20% DOW and after feeding 4 h.
3.6. Mining of Rumen Metagenome for Identification of Cellulolytic Enzymes
A total of 295,723 unique genes were generated after CAZy classification, which belonged to different classes (GHs, GTs, CEs, CBMs, PLs, and AAs) (Figure 5A). Among the six classes of CAZymes families, the GHs were essential, with 122,020 sequences spanning 140 distinct families altogether. Genes encoding enzymes from the functional class GTs were the second most prevalent and contained 104,069 sequences from 78 different families. CBMs modules contained 532.94 sequences from 73 families of genes. A total of 145.16 sequences connected with 16 CEs families were found in the CAZy database, which accounted for 4.83 percent of all CAZymes. Meanwhile, an additional 26 families of PLs (1.53 percent) and 10 families of AAs (0.61 percent) were discovered in the lamb’s rumen metagenome (Figure 5B). There were no significant differences between the CON and DOW3 groups in the levle1 function of GH, GT, CBM, CE, PL, and AA.
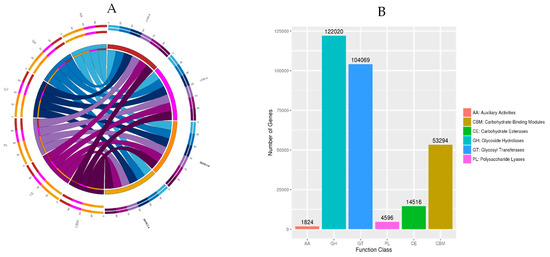
Figure 5.
Classification of the CAZy enzymes across the DOW and CON groups. (A) Percentage of CAZymes in each group. (B) Classification and proportion of CAZymes. CON-0, control group and before feeding. CON-4, control group and after feeding 4 h. DOW3-0, dietary supplementation with 20% DOW and before feeding. DOW3-4, dietary supplementation with 20% DOW and after feeding 4 h.
According to the sequenced-based classification CAZymes, GT27 (polypeptide alpha-N-acetylgalactosaminyltransferase), GH5 (beta-1,4-glucanase), GH0 (Glycoside hydrolases), GT26 (beta-N-acetyl mannosaminuronyltransferase), GH86 (beta-agarase), and CBM34 (carbohydrate-binding) were affected by feed and time. Figure 6 showed that dietary supplementation with 20% DOW significantly increased the abundance of GT27 before and after feeding. Relative to the CON group, the relative abundance of GH0 and GT26 was significantly increased in the DOW3 group before feeding, and the abundance of GH86 and CMB34 were significantly higher after feeding. In addition, there was no significant difference in GT5 abundance after lambs were fed the DOW3 diet, but it was affected by time and decreased after feeding.
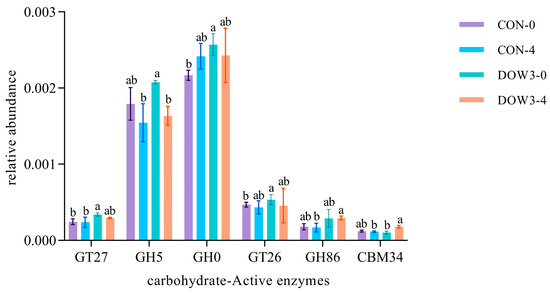
Figure 6.
The genes encoding CAZy enzymes and the families to which they belong. Different letters denote statistically significant difference at p < 0.05. CON-4, control group and after feeding 4 h. DOW3-0, dietary supplementation with 20% DOW and before feeding. DOW3-4, dietary supplementation with 20% DOW and after feeding 4 h.
3.7. Metabolic Pathway Analysis of Different Feed Types
In total, five first-level metabolic pathways in the Kyoto Encyclopedia of Genes and Genomes (KEGG) database were observed as rumen microbial metabolic pathways (Figure 7A). The first-level pathway including “Metabolism” (65.17 ± 0.89%), “Genetic information processing” (17.71 ± 0.02%), “Environment information processing” (10.83 ± 0.01%), “Cellular processes” (3.66 ± 0.02%), and “Human diseases” (2.62 ± 0.04%). At the second level, 19 categories were observed, with “Carbohydrate metabolism” (15.72 ± 0.10%), “Amino acid metabolism” (11.78 ± 0.11%), “Nucleotide metabolism” (8.98 ± 0.06%), and “Metabolism of cofactors and vitamins” (8.35 ± 0.06%) being the most abundant. Enrichment analysis of genes associated in metabolic pathways revealed that the primary metabolic processes in the rumen of different diets and feeding times were “Metabolic pathways” and “Genetic Information Processing”, and the enrichment degree was in the following stages: DOW3-4 >CON-4 > DOW3-0 > CON-0 (Figure 7B). When the identified KEGG pathways were compared, four pathways including “Bacterial secretion system” and “ABC transporters” were significantly enriched in the rumen microbiome of the DOW3 group before feeding (Figure 8A), and two pathways with “Taurine and hypotaurine metabolism” and “Glycerolipid metabolism” were significantly enriched in the rumen microbiome of the DOW3 group after feeding (Figure 8B).
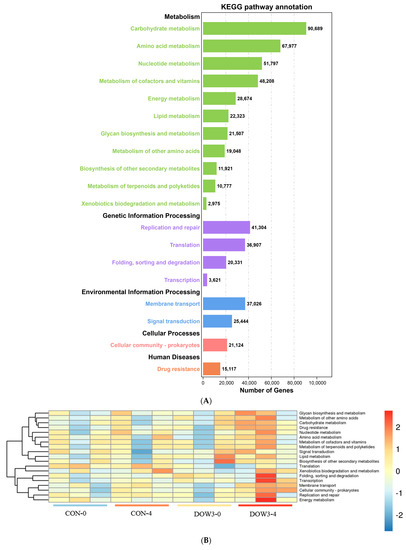
Figure 7.
Differential KEGG functions between DOW3 and CON groups. (A) Classification of the KEGG functions. (B) Heatmap showing the different metabolic pathways between CON and DOW3 groups. CON-4, control group and after feeding 4 h. DOW3-0, dietary supplementation with 20 % DOW and before feeding. DOW3-4, dietary supplementation with 20 % DOW and after feeding 4 h.
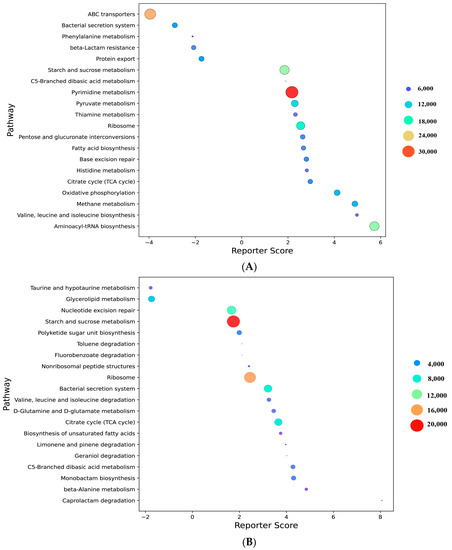
Figure 8.
Analysis of metabolic pathways in which genes are involved. (A) Gene’s enrichment analysis before feeding in the CON group when compared with DOW3 group. (B) Gene’s enrichment analysis after feeding in the CON group when compared with DOW3 group. CON-4, control group and after feeding 4 h. DOW3-0, dietary supplementation with 20% DOW and before feeding. DOW3-4, dietary supplementation with 20 % DOW and after feeding 4 h.
3.8. Correlations Analysis between Bacterial Genera and Plasma Metabolites
To examine the potential impacts of changed microbiota, the correlation between distance-corrected dissimilarities of domain genera and the significantly differentially detected plasma metabolites were analyzed by Mantel test. The results indicated that the bacterial communities were significantly correlated with plasma metabolites, while Prevotella and Clostridiales_noname exhibited the strongest correlation with the AST and T-AOC (p < 0.01, r ≥ 0.4), while Prevotella also showed the strongest correlation with IgG (p < 0.01, 0.2 ≤ r ≤ 0.4) (Figure 9). In addition, the Bacteria_noname was more strongly correlated with AST, IgA, IgM, and T-AOC (0.01 ≤ p < 0.05, 0.2 ≤ r ≤ 0.4), while the Clostridiales_noname was more strongly correlated with IgA, NF-α, and IgG (0.01 ≤ p < 0.05, 0.2 ≤ r ≤ 0.4), whereas no significant correlation was found for other genera (p >0.05, r < 0.2).
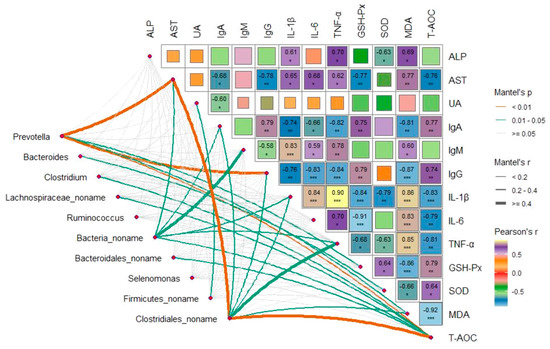
Figure 9.
Mantel’s and Spearman’s correlation analyses. Pairwise comparisons of significantly differentially detected genera using Welch’s t-tests are shown, with a color gradient representing Spearman’s correlation coefficients. The correlation between primary genus and each plasma metabolic indexes were determined using Mantel’s correlation tests. Edge width corresponds to the Mantel’s r statistic for the corresponding distance correlations, and edge color indicates the statical significance based on 999 permutations. 0.01 < P < 0.05, P ≤ 0.05 and P < 0.01 are denoted as *, ** and ***, respectively. CON-4, control group and after feeding 4 h. DOW3-0, dietary supplementation with 20% DOW and before feeding. DOW3-4, dietary supplementation with 20% DOW and after feeding 4 h.
4. Discussion
Plasma metabolism parameters are closely related to nutrient metabolism and physiological status, especially the immune and antioxidant parameters, and can indirectly reflect the function of the organ [39,40]. So, the plasma biochemical parameters can be used to monitor the health of animals [41]. Prior studies showed that Dioscorea could regulate blood sugar levels and control cholesterol, fat uptake and hypertension [42,43]. However, few studies have measured the effect of DOW on blood UA, AST, and ALP. In the present study, dietary supplementation with DOW linearly decrease the concentration of UA, AST, and ALP. The concentration of UA in plasma is a key index of nitrogen metabolism and kidney health. A previous study has shown that saponins of Dioscorea have a significant effect on reducing plasma UA [44]. Therefore, the reduced UA level in the plasma may be due to the Dioscorea saponins, but the concentration of saponins was not measured in the current study. The concentration of AST and ALP are important factors of liver function. In this study, although a linear decrease of AST and ALP was observed, the values were within the normal range of variation, indicating that DOW did not have a negative influence on the hepatic metabolism of lambs. However, the actual molecular mechanism underlying the influence of DOW on plasma metabolism is unclear and needs to be investigated in further research.
Immunoglobulin, mainly including IgA, IgG, and IgM, are major proteins of colostrum and milk that can protect the immune function of the body by interacting directly or indirectly with antigens or pathogens. The increase in immunoglobulin levels can improve the non-specific immunity of the body [45]. IL-1β, IL-6, and TNF-α are important indicators of the body’s inflammatory status, and changes levels indicate the alteration of inflammation in the body. Fu et al. [46] found that Dioscorea extracts can improve the growth performance of weaned pigs by increasing the concentration of IgA, IgG, and IgM in the blood and improving the antioxidant capacity of the body. Another study reported that Dioscorea significantly reduced the mRNA or protein levels of TNF-α, IL-1β, and IL-6 in vitro and in vivo [47], which was basically consistent with our results. In the current study, dietary supplemented with DOW linearly increased the concentration of IgA, IgG, and IgM, while it linearly decreased the concentration of IL-1β, IL-6, and TNF-α in plasma, indicating that DOW improved the immune function and attenuated the inflammatory response of weaned lambs. The possible reason for increasing immunoglobulin may be due to the fructooligosaccharides in DOW, which could enhance IgA-mediated immunomodulation and influence the gut colonization of probiotic LAB strains as demonstrated also in other ruminant species with other plants [48,49].
Reactive oxygen free radicals are created during normal mammalian growth and metabolism. If the free radicals are not scavenged in time, they will accumulate in the body and damage the morphology and function of cells, leading to the peroxidation of unsaturated lipids in biological membranes, forming lipid peroxides and eventually producing MDA [50]. Among the oxidative parameters, the changes of GSH-Px, SOD, MDA, and T-AOC are usually used to evaluate the physiological and health status of animals. GSH-Px can prevent membrane lipid peroxidation by scavenging excessive reactive oxygen species (ROS) in the body and preserving cell membrane structure and functions [51]. SOD is one of the important antioxidant enzymes in the body, which plays an important role in clearing oxygen free radicals and balancing oxidation and anti-oxidation [40]. T-AOC reflects the non-enzymatic antioxidant capacity of the body’s defense system [52]. In vitro studies have shown that the extract of Dioscorea alata leaf, which has similar functions to ascorbic acid and trolox, exhibited potent antioxidant activity in DPPH radical scavenging assay, hydroxyl radical scavenging assay, superoxide radical scavenging assay, ABTs radical cation scavenging activity, and reducing power [53]. Furthermore, Zhongshan Zhang et al. [48] found that polysaccharide from Dioscorea opposite has high anti-lipid peroxidation activity and radical-scavenging effects. In this study, supplemental DOW linearly increased the activities of SOD, GSH-Px, and T-AOC and decreased the concentration of MDA in plasma, indicating that dietary supplementation of DOW improved the antioxidant capacity and enhanced the function of the antioxidant system in weaned lambs. The effect of DOW on antioxidative function may be related to its polysaccharide component, which alleviates oxidative stress by removing free radicals [54]. In addition, the Mantel test analysis in the present study has shed light on the strongest correlation between Clostridiales and T-AOC; thus, the increased Clostridiales in the rumen may be a reason for improving the antioxidant capacity of the body. In summary, the antioxidative effect of DOW may be related to the polysaccharides in DOW and the optimization of rumen microorganisms, but the specific mechanism needs further study.
Keeping a balanced gut microbiota is essential for ruminant productivity and wellness [55]. It is widely known that dietary changes can alter the structure and composition of the gastrointestinal microbiota [56]. A recent study revealed that polysaccharides from Chinese Dioscorea enriched beneficial intestinal bacteria and suppressed bacterial pathogens in SD rat cecum [13]. Similarly, Nan Zhang et al. [57] have demonstrated that Chinese Dioscorea supplementation could increase the levels of Clostridium spp. in mice intestines. Additionally, studies have shown that Dioscorea opposite extract is a promising prebiotic that improves intestinal microorganisms and affects the conversion of some intestinal flora to beneficial bacteria [8,58]. In the current study, the alpha diversity metric indicated that DOW improved the diversity and richness of rumen microbiota, while LefSe analysis revealed supplementation with DOW resulted in a significant shift in the ruminal microbiota. In addition, dietary supplementation with DOW significantly increased the relative abundance of Verrucomicrobia, Fibrobacteres, Ruminococcaceae_bacterium, and Clostridiales_bacterium. Verrucomicrobia contains a diverse set of glycoside hydrolases that are vital in the breakdown of polysaccharides and cellobiose [59], and Fibrobacteres are mainly composed of highly efficient cellulose-degrading bacterial species in the rumen that are efficient in the member rumen [60]. Studies have provided evidence that the proportion of the Fibrobacteres in the rumen largely depends on the fiber and starch content of the diet [61,62]. Therefore, a possible explanation for the increase of Fibrobacteres could be due to the high fiber content in the DOW. The Ruminococcaceae_bacterium belongs to Firmicutes and has been found to act as highly efficient at degrading both crystalline and amorphous cellulose [60]. Clostridiales_bacterium is another well-known cellulolytic bacterium and can produce cellulase-free xylanase [61]. Meanwhile, the present study also observed that Clostridiales_bacterium was positively correlated with the T-AOC concentration, which was consistent with a previous study that showed that Clostridiales_bacterium can modulate the antioxidant capacity of the body [63]. Overall, the significant increase in the above bacteria indicated that DOW improved the fiber digestibility and antioxidant capacity of weaned lambs.
The ability of ruminants to break down plant biomass into carbohydrates is exclusively attributed to the production of multiple polysaccharide hydrolases by the rumen microbiota [64]. The CAZy database comprises a variety of enzymes that actively contribute to the synthesis and breakdown of complex polysaccharides and glycoconjugates. CAZy database provides manually curated information concerning all CAZyme families including GHs, GTs, PLs, CEs, CBMs, and AAs [65]. GHs include a large group of enzymes participating in the metabolism of polysaccharides such as starch, cellulose, lignin, and chitin, responsible for the hydrolysis of glycosidic bonds linking two or more carbohydrates or a carbohydrate and a non-carbohydrate moiety [66,67]. GTs are the only less than GHs CAZy family in the weaned lambs’ rumen, which is capable of catalyzing activated oligosaccharide or glycosidic bonds into different receptors, such as proteins, nucleic acids, oligosaccharides, lipids, and small molecules [68]. CBMs do not exhibit enzymatic activity on their own, but can enhance the activities of all other CAZymes (GHs, CEs, and auxiliary enzymes) or function as appendix modules of CAZymes [69]. In our study, enzymes in GHs and GTs families in rumen metagenome of the DOW-supplemented group possess more abundant plant fiber degradation capacity. In order to obtain more information about these enzymes, the families were classified according to the methods described by Krause et al. [70]. Many enzymes involved in polypeptide alpha-N-acetylgalactosaminyltransferase, glycoside hydrolases, beta-N-acetyl mannosaminuronyltransferase, and beta-agarase were highly enriched in rumen microbiota of the DOW-supplemented group. Additionally, CBM34, responsible for carbohydrate-binding, was significantly higher in the DOW-supplemented group than in the CON group. Previously, a study found that bacteria belonging to Prevotella, Clostridium, Fibrobacter, and Ruminococcus were identified as the key contributors of CAZymes inhabiting the rumen [71]. Thus, the increase of GHs and GTs enzymes in the rumen microbiota after lambs fed the DOW-supplemented diet may be due to the elevated Clostridium and Ruminococcus. The elevated levels of these enzymes further indicated the positive effect of the unconventional feed DOW on the intestinal flora and function of weaned lambs. However, the actual reactions of DOW to regulate gene expression in intestinal microbes are unclear and need to be investigated in further research.
5. Conclusions
Present results showed that dietary supplementation with DOW at 10%, 15%, and 20% improved the immune response and antioxidant capacity by linearly increasing the activity of IgA, IgM, IgG, GSH-Px, SOD, and T-AOC. The results could be attributed to the effects of the DOW on enhancing the richness and diversity of the rumen bacterial community. Dietary supplementation with 20% DOW significantly increased the activity of polysaccharide hydrolases in the rumen. The optimal level of DOW addition and the impact mechanisms of DOW on rumen fermentation need to be studied in the future.
Supplementary Materials
The following supporting information can be downloaded at: https://www.mdpi.com/article/10.3390/fermentation9030256/s1, Table S1: CleanData obtained through microbial metagenomes; Table S2: ContigsNumber obtained through microbial metagenomes; Table S3: The relative abundance of rumen bacterial community.
Author Contributions
Methodology, R.Y., Y.G., Q.H., S.J. and H.Y.; software, R.Y. and C.D.; formal analysis, Y.W.; investigation, R.Y. and Y.L.; Writing–original draft, S.Z.; Writing–review and editing, R.Y.; visualization, S.Z.; project administration, Y.Z. All authors have read and agreed to the published version of the manuscript.
Funding
This research was supported by Key R & D projects in Hebei Province (21322907D and 21322910D); the Natural Science Foundation of Hebei Province of China (C2022204174); the China Agriculture Research System [CARS-38] and [CARS-39-23].
Institutional Review Board Statement
All procedures used in this study were approved by the Laboratory Animal Ethics Committee of Hebei Agricultural University (Hebei, P.R. China; permit number 2018082).
Data Availability Statement
Not applicable.
Conflicts of Interest
The authors declare no conflict of interest.
References
- Shonka-Martin, B.; Heins, B.; Hansen, L. Three-breed rotational crossbreds of Montbéliarde, Viking Red, and Holstein compared with Holstein cows for feed efficiency, income over feed cost, and residual feed intake. J. Dairy Sci. 2019, 102, 3661–3673. [Google Scholar] [CrossRef] [PubMed]
- Zhang, Y.C.; Wang, X.K.; Li, D.X.; Lin, Y.L.; Yang, F.Y.; Ni, K.K. Impact of wilting and additives on fermentation quality and carbohydrate composition of mulberry silage. Asian-Australas. J. Anim. Sci. 2020, 33, 254. [Google Scholar] [CrossRef]
- He, L.; Zhou, W.; Wang, Y.; Wang, C.; Chen, X.; Zhang, Q. Effect of applying lactic acid bacteria and cellulase on the fermentation quality, nutritive value, tannins profile and in vitro digestibility of Neolamarckia cadamba leaves silage. J. Anim. Physiol. Anim. Nutr. 2018, 102, 1429–1436. [Google Scholar] [CrossRef]
- Salehi, B.; Sener, B.; Kilic, M.; Sharifi-Rad, J.; Naz, R.; Yousaf, Z.; Mudau, F.N.; Fokou, P.V.T.; Ezzat, S.M.; El Bishbishy, M.H. Dioscorea plants: A genus rich in vital nutra-pharmaceuticals—A review. Iran. J. Pharm. Res. 2019, 18, 68. [Google Scholar] [CrossRef]
- Shujun, W.; Jinglin, Y.; Hongyan, L.; Weiping, C. Characterisation and preliminary lipid-lowering evaluation of starch from Chinese yam. Food Chem. 2008, 108, 176–181. [Google Scholar] [CrossRef]
- Shen, L.; Xu, J.; Luo, L. Predicting the potential global distribution of diosgenin-contained Dioscorea species. Chin. Med.-UK 2018, 13, 1–10. [Google Scholar] [CrossRef] [PubMed]
- Fan, D.; Zhong, H.; Hu, B. Agro-ecological suitability assessment of Chinese Medicinal Yam under future climate change. Environ. Geochem. Health 2020, 42, 987–1000. [Google Scholar] [CrossRef] [PubMed]
- Jeon, J.R.; Lee, J.S.; Lee, C.H.; Kim, J.Y.; Kim, S.D.; Nam, D.H. Effect of ethanol extract of dried Chinese yam (Dioscorea batatas) flour containing dioscin on gastrointestinal function in rat model. Arch. Pharm. Res. 2006, 29, 348–353. [Google Scholar] [CrossRef] [PubMed]
- Kumar, S.; Das, G.; Shin, H.-S.; Patra, J.K. Dioscorea spp.(a wild edible tuber): A study on its ethnopharmacological potential and traditional use by the local people of Similipal Biosphere Reserve, India. Front. Pharmacol. 2017, 8, 52. [Google Scholar] [CrossRef]
- Zhang, C.Q.; Chen, X.; Ding, K. Structural characterization of a galactan from Dioscorea opposita Thunb. and its bioactivity on selected Bacteroides strains from human gut microbiota. Carbohydr. Polym. 2019, 218, 299–306. [Google Scholar] [CrossRef]
- Sharma, L.N.; Bastakoti, R. Ethnobotany of Dioscorea L. with emphasis on food value in Chepang communities in Dhading district, central Nepal. Bot. Orient. J. Plant Sci. 2009, 6, 12–17. [Google Scholar] [CrossRef]
- Kumar, S.; Mahanti, P.; Rath, S.K.; Patra, J.K. Qualitative phytochemical analysis and antibacterial activity of Dioscorea alata L.: A nutraceutical tuber crops of rural odisha. J. Altern. Med. Res. 2017, 3, 122. [Google Scholar]
- Kong, X.; Zhang, Y.; Wu, X.; Yin, Y.; Tan, Z.; Feng, Y.; Yan, F.; Bo, M.; Huang, R.; Li, T. Fermentation characterization of Chinese yam polysaccharide and its effects on the gut microbiota of rats. Int. J. Microbiol. 2009, 2009, 598152. [Google Scholar] [CrossRef] [PubMed]
- Gupta, K.; Gurjar, S.; Pandey, D.K. Medicinal aspect of saponins shows their wide range of pharmacological/biological activities. Pharmacologyonline 2010, 2, 579–584. [Google Scholar]
- Burkill, H.M. The Useful Plants of West Tropical Africa; University Press of Virginia: Charlottesville, VA, USA, 1995; pp. 1–3. [Google Scholar]
- Zhou, C.; Wu, Y.; Zhang, Y.; Yan, Y. The manufacture and utilization of Chinese yam. Anhui Agric. Sci. Bull. 2004, 10, 65–66. [Google Scholar]
- Baah, F.; Maziya-Dixon, B.; Asiedu, R.; Oduro, I.; Ellis, W. Nutritional and biochemical composition of D. alata (Dioscorea spp.) tubers. J. Food Agric. Environ. 2009, 7, 373–378. [Google Scholar]
- Mayan Hong, J.Y. Optimization of Ultrasonic-assisted Extraction of Polysaccharides from Chinese Yam Peel and Its Antioxidant Activity. Food Res. Dev. 2016, 37, 34–38. (In Chinese) [Google Scholar]
- Lee, S.C.; Tsai, C.C.; Chen, J.C.; Lin, J.G.; Lin, C.C.; Hu, M.L.; Lu, S. Effects of Chinese yam on hepato-nephrotoxicity of acetaminophen in rats. Acta Pharmacol. Sin. 2002, 23, 503–508. [Google Scholar]
- Samonte, R.F. Utilization of Raw Wild Yam (Dioscorea dumetorum) As Feed Supplement for Broiler Chickens. J. Nat. Allied Sci. 2019, 3, 28–35. [Google Scholar]
- Meng, X.; Hu, W.; Wu, S. Chinese yam peel enhances the immunity of the common carp (Cyprinus carpio L.) by improving the gut defence barrier and modulating the intestinal microflora. Fish Shellfish. Immunol. 2019, 95, 528–537. [Google Scholar] [CrossRef]
- Doko Allou, S.; Farougou, S.; Hountondji, F. Impact of prophylactic measures and the use of local food resources on the viability and growth of pre-weaning lambs in Djougou, in the northern region of Benin. J. Anim. Plant Sci. 2013, 19, 2933–2940. Available online: https://www.researchgate.net/publication/258341187 (accessed on 15 February 2023).
- Yashim, S.; Haniel, B.; Makama, S.; Adama, H. Growth Performance, nutrient digestibility and nitrogen balance of red Sokoto bucks fed Irish potato (Solanum tuberosum L.) peels as a replacement for maize offal. J. Anim. Prod. Res. 2016, 28, 245–253. [Google Scholar]
- Zhang, Y.; Shi, H.; Yun, Y. The Effect of Anthocyanins from Dioscorea alata L. on Antioxidant Properties of Perinatal Hainan Black Goats and Its Possible Mechanism in the Mammary Gland. Animals 2022, 12, 3320. [Google Scholar] [CrossRef] [PubMed]
- NRC—National Research Council. Nutrient Requirements of Small Ruminants: Sheep, Goats, Cervids, and New World Camelids; National Academy of Science: Washintgton, DC, USA, 2007; 347p. [Google Scholar]
- AOAC. Official Methods of Analysis of AOAC International, 18th ed.; Association of Official Analytical Chemists: Gaithersburg, MD, USA, 2005. [Google Scholar]
- Bradstreet R, B. Kjeldahl method for organic nitrogen. Anal. Chem. 1954, 26, 185–187. [Google Scholar] [CrossRef]
- Van Soest, P.J.; Robertson, J.B.; Lewis, B.A. Methods for dietary fiber, neutral detergent fiber, and nonstarch polysaccharides in relation to animal nutrition. J. Dairy Sci. 1991, 74, 3583–3597. [Google Scholar] [CrossRef]
- Oliveira, M.A.; Alves, S.P.; Santos-Silva, J.; Bessa, R.J. Effects of clays used as oil adsorbents in lamb diets on fatty acid composition of abomasal digesta and meat. Anim. Feed Sci. Technol. 2016, 213, 64–73. [Google Scholar] [CrossRef]
- Do, D.T.; Lam, D.H.; Nguyen, T.; Mai, T.T.P.; Phan, L.T.M.; Vuong, H.T.; Nguyen, D.V.; Linh, N.T.T.; Hoang, M.N.; Mai, T.P.; et al. Utilization of response surface methodology in optimization of polysaccharides extraction from vietnamese red ganoderma lucidum by ultrasound-assisted enzymatic method and examination of bioactivities of the extract. Sci. World J. 2021, 1, 11. [Google Scholar] [CrossRef]
- Zhao, K.; Huo, B.; Shen, X. Studies on antioxidant capacity in selenium-deprived the Choko yak in the Shouqu prairie. Biol. Trace Elem. Res. 2021, 199, 3297–3302. [Google Scholar] [CrossRef]
- Langmead, B.; Salzberg, S.L. Fast gapped-read alignment with Bowtie 2. Nat. Methods 2012, 9, 357–359. [Google Scholar] [CrossRef]
- Li, D.; Liu, C.-M.; Luo, R.; Sadakane, K.; Lam, T.W. MEGAHIT: An ultra-fast single-node solution for large and complex metagenomics assembly via succinct de Bruijn graph. Bioinformatics 2015, 31, 1674–1676. [Google Scholar] [CrossRef]
- Zhu, W.; Lomsadze, A.; Borodovsky, M. Ab initio gene identification in metagenomic sequences. Nucleic Acids Res. 2010, 38, e132. [Google Scholar] [CrossRef]
- Li, W.; Godzik, A. Cd-hit: A fast program for clustering and comparing large sets of protein or nucleotide sequences. Bioinformatics 2006, 22, 1658–1659. [Google Scholar] [CrossRef] [PubMed]
- Buchfink, B.; Xie, C.; Huson, D.H. Fast and sensitive protein alignment using DIAMOND. Nat. Methods 2015, 12, 59–60. [Google Scholar] [CrossRef]
- Menzel, P.; Ng, K.L.; Krogh, A. Fast and sensitive taxonomic classification for metagenomics with Kaiju. Nat. Commun. 2016, 7, 11257. [Google Scholar] [CrossRef] [PubMed]
- Liang, J.; Zhang, H.; Zhang, P.; Zhang, G.; Cai, Y.; Wang, Q.; Zhou, Z.; Ding, Y.; Zubair, M. Effect of substrate load on anaerobic fermentation of rice straw with rumen liquid as inoculum: Hydrolysis and acidogenesis efficiency, enzymatic activities and rumen bacterial community structure. Waste Manag. 2021, 124, 235–243. [Google Scholar] [CrossRef]
- Geng, A.; Zhang, Y.; Zhang, J.; Zeng, L.; Chang, C.; Wang, H.; Yan, Z.; Chu, Q.; Liu, H. Effects of light regime on the hatching performance, body development and serum biochemical indexes in Beijing You Chicken. Poultry Sci. 2021, 100, 101270. [Google Scholar] [CrossRef]
- Ma, J.; Wang, C.; Wang, Z.; Cao, G.; Hu, R.; Wang, X.; Zou, H.; Kang, K.; Peng, Q.; Xue, B. Active dry yeast supplementation improves the growth performance, rumen fermentation, and immune response of weaned beef calves. Anim. Nutr. 2021, 7, 1352–1359. [Google Scholar] [CrossRef]
- Vranković, L.; Aladrović, J.; Ljubić, B.B.; Pipal, I.; Prvanović-Babić, N.; Mašek, T.; Stojević, Z. Blood biochemical parameters of bone metabolism in cows and calves kept in a beef suckler system during the early postpartum period. Livest. Sci. 2018, 211, 8–13. [Google Scholar] [CrossRef]
- Amat, N.; Amat, R.; Abdureyim, S.; Hoxur, P.; Osman, Z.; Mamut, D.; Kijjoa, A. Aqueous extract of dioscorea opposita thunb normalizes the hypertension in 2K1C hypertensive rats. BMC Complement. Altern. Med. 2014, 14, 36. [Google Scholar] [CrossRef] [PubMed]
- Zhang, Z.; Wang, X.; Liu, C.; Li, J. The degradation, antioxidant and antimutagenic activity of the mucilage polysaccharide from Dioscorea opposita. Carbohydr. Polym. 2016, 150, 227–231. [Google Scholar] [CrossRef]
- Chen, G.L.; Wei, W.; Xu, S.Y. Effect and mechanism of total saponin of Dioscorea on animal experimental hyperuricemia. Am. J. Chin. Med. 2006, 34, 77–85. [Google Scholar] [CrossRef]
- Xu, L.Q.; Zhao, X.X.; Wang, P.X.; Yang, J.; Yang, Y.M. Multidisciplinary treatment of a patient with necrotizing fasciitis caused by Staphylococcus aureus: A case report. World J. Clin. Cases 2019, 7, 3595. [Google Scholar] [CrossRef]
- Fu, L.; Sun, M.; Dong, W.; Zhang, G.; Han, D.; Zang, J.; Liu, H. Effects of compound of hawthorn (Crataegus pinnatifida) and Chinese yam (Dioscorea opposita Thunb.) extracts on growth performance, intestinal health, and immune function in weaned pigs. Anim. Sci. J. 2022, 93, e13790. [Google Scholar] [CrossRef] [PubMed]
- Qi, Y.; Li, R.; Xu, L.; Yin, L.; Xu, Y.; Han, X.; Peng, J. Neuroprotective effect of dioscin on the aging brain. Molecules 2019, 24, 1247. [Google Scholar] [CrossRef]
- Bandyopadhyay, B.; Mitra, P.K.; Mandal, V.; Mandal, N.C. Novel fructooligosaccharides of Dioscorea alata L. tuber have prebiotic potentialities. Eur. Food Res. Technol. 2021, 247, 3099–3112. [Google Scholar] [CrossRef]
- Lombardi, P.; Musco, N.; Cutrignelli, M.I.; Mollica, M.P.; Trinchese, G.; Calabro, S.; Tudisco, R.; Grossi, M.; Mastellone, V.; Vassalotti, G.; et al. The association of aloe and beta-carotene supplementation improves oxidative stress and inflammatory state inn pregnant buffalo cows. Buffalo Bull. 2017, 36, 497–503. [Google Scholar]
- Akhalaya, M.Y.; Platonov, A.; Baizhumanov, A. Short-term cold exposure improves antioxidant status and general resistance of animals. Bull. Exp. Biol. Med. 2006, 141, 31–34. [Google Scholar] [CrossRef] [PubMed]
- Marin, D.; Pistol, G.; Gras, M.; Palade, M.; Taranu, I. A comparison between the effects of ochratoxin A and aristolochic acid on the inflammation and oxidative stress in the liver and kidney of weanling piglets. Naunyn-Schmiedeberg’s Arch. Pharmacol. 2018, 391, 1147–1156. [Google Scholar] [CrossRef]
- Yang, M.; Chen, R.; Song, Y.; Zhou, Y.; Liu, Q.; Zhuang, S. Effects of dietary betaine supplementation on growth performance, meat quality, muscle fatty acid composition and antioxidant ability in slow-growing broiler chickens. Br. Poult. Sci. 2021, 63, 351–359. [Google Scholar] [CrossRef]
- Sakthidevi, G.; Mohan, V. Total phenolic, flavonoid contents and in vitro antioxidant activity of Dioscorea alata L. tuber. J. Pharm. Sci. Res. 2013, 5, 115–119. [Google Scholar]
- Ju, Y.; Xue, Y.; Huang, J.; Zhai, Q.; Wang, X.-H. Antioxidant Chinese yam polysaccharides and its pro-proliferative effect on endometrial epithelial cells. Int. J. Biol. Macromol. 2014, 66, 81–85. [Google Scholar] [CrossRef] [PubMed]
- Zhang, X.; Li, X.; Wu, J. Rumen-protected glucose supplementation in transition dairy cows shifts fermentation patterns and enhances mucosal immunity. Anim. Nutr. 2021, 7, 1182–1188. [Google Scholar] [CrossRef] [PubMed]
- Jiao, J.; Wu, J.; Wang, M. Rhubarb supplementation promotes intestinal mucosal innate immune homeostasis through modulating intestinal epithelial microbiota in goat kids. J. Agric. Food Chem. 2018, 66, 1047–1057. [Google Scholar] [CrossRef]
- Zhang, N.; Liang, T.; Jin, Q.; Shen, C.; Zhang, Y.; Jing, P. Chinese yam (Dioscorea opposita Thunb.) alleviates antibiotic-associated diarrhea, modifies intestinal microbiota, and increases the level of short-chain fatty acids in mice. Food Res. Int. 2019, 122, 191–198. [Google Scholar] [CrossRef]
- Aswani, M.A.; Kathade, S.A.; Nisar, A.; Anand, P.K.; Kunchiraman, B.N.; Jagtap, S.D. Prebiotic Profiling of Indigenous selected dioscorea Spp. Using In-Vitro Techniques. Biosci. Biotechnol. Res. Asia 2022, 19, 387–394. [Google Scholar] [CrossRef]
- Gharechahi, J.; Zahiri, H.S.; Noghabi, K.A.; Salekdeh, G.H. In-depth diversity analysis of the bacterial community resident in the camel rumen. Syst. Appl. Microbiol. 2015, 38, 67–76. [Google Scholar] [CrossRef] [PubMed]
- Flint, H.J.; Bayer, E.A.; Rincon, M.T.; Lamed, R.; White, B.A. Polysaccharide utilization by gut bacteria: Potential for new insights from genomic analysis. Nat. Rev. Microbiol. 2008, 6, 121–131. [Google Scholar] [CrossRef]
- Jewell, K.A.; Scott, J.J.; Adams, S.M.; Suen, G. A phylogenetic analysis of the phylum Fibrobacteres. Syst. Appl. Microbiol. 2013, 36, 376–382. [Google Scholar] [CrossRef]
- Thoetkiattikul, H.; Mhuantong, W.; Laothanachareon, T.; Tangphatsornruang, S.; Pattarajinda, V.; Eurwilaichitr, L.; Champreda, V. Comparative analysis of microbial profiles in cow rumen fed with different dietary fiber by tagged 16S rRNA gene pyrosequencing. Curr. Microbiol. 2013, 67, 130–137. [Google Scholar] [CrossRef]
- Liang, J.; Raza, S.H.A.; Kou, S.; Chen, C.; Yao, M.; Wu, Y.; Wang, S.; Ma, X.; Zhang, W.-J.; Nie, C. Effect of Clostridium butyricum on plasma immune function, antioxidant activity and metabolomics of weaned piglets. Livest. Sci. 2020, 241, 104267. [Google Scholar] [CrossRef]
- Bohra, V.; Dafale, N.A.; Purohit, H.J. Understanding the alteration in rumen microbiome and CAZymes profile with diet and host through comparative metagenomic approach. Arch. Microbiol. 2019, 201, 1385–1397. [Google Scholar] [CrossRef]
- Cantarel, B.L.; Coutinho, P.M.; Rancurel, C.; Bernard, T.; Lombard, V.; Henrissat, B. The Carbohydrate-Active EnZymes database (CAZy): An expert resource for glycogenomics. Nucleic Acids Res. 2009, 37, D233–D238. [Google Scholar] [CrossRef] [PubMed]
- Stewart, R.D.; Auffret, M.D.; Warr, A.; Wiser, A.H.; Press, M.O.; Langford, K.W.; Liachko, I.; Snelling, T.J.; Dewhurst, R.J.; Walker, A.W. Assembly of 913 microbial genomes from metagenomic sequencing of the cow rumen. Nat. Commun. 2018, 9, 870. [Google Scholar] [CrossRef]
- Jose, V.L.; Appoothy, T.; More, R.P.; Arun, A.S. Metagenomic insights into the rumen microbial fibrolytic enzymes in Indian crossbred cattle fed finger millet straw. AMB Express 2017, 7, 13. [Google Scholar] [CrossRef] [PubMed]
- Lairson, L.; Henrissat, B.; Davies, G.; Withers, S. Glycosyltransferases: Structures, functions, and mechanisms. Annu. Rev. Biochem. 2008, 77, 521–555. [Google Scholar] [CrossRef] [PubMed]
- Boraston, A.B.; Bolam, D.N.; Gilbert, H.J.; Davies, G.J. Carbohydrate-binding modules: Fine-tuning polysaccharide recognition. Biochem. J. 2004, 382, 769–781. [Google Scholar] [CrossRef] [PubMed]
- Krause, D.O.; Denman, S.E.; Mackie, R.I.; Morrison, M.; Rae, A.L.; Attwood, G.T.; McSweeney, C.S. Opportunities to improve fiber degradation in the rumen: Microbiology, ecology, and genomics. FEMS Microbiol. Rev. 2003, 27, 663–693. [Google Scholar] [CrossRef]
- Wang, L.J.; Zhang, G.N.; Xu, H.J.; Xin, H.S.; Zhang, Y.G. Metagenomic Analyses of Microbial and Carbohydrate-Active Enzymes in the Rumen of Holstein Cows Fed Different Forage-to-Concentrate Ratios. Front. Microbiol. 2019, 10, 649. [Google Scholar] [CrossRef]
Disclaimer/Publisher’s Note: The statements, opinions and data contained in all publications are solely those of the individual author(s) and contributor(s) and not of MDPI and/or the editor(s). MDPI and/or the editor(s) disclaim responsibility for any injury to people or property resulting from any ideas, methods, instructions or products referred to in the content. |
© 2023 by the authors. Licensee MDPI, Basel, Switzerland. This article is an open access article distributed under the terms and conditions of the Creative Commons Attribution (CC BY) license (https://creativecommons.org/licenses/by/4.0/).