Article

Using Dielectric Constant Measurement to Monitor Ethanol Fermentation and Anaerobic Co-Digestion of Lignocellulosic Biomass

1
Department of Biosystems Engineering, Faculty of Engineering, University of Szeged, H-6725 Szeged, Hungary
2
Department of Food Engineering, Faculty of Engineering, University of Szeged, H-6725 Szeged, Hungary
*
Author to whom correspondence should be addressed.
Fermentation 2023, 9(10), 902; https://doi.org/10.3390/fermentation9100902
Submission received: 6 September 2023 / Revised: 29 September 2023 / Accepted: 8 October 2023 / Published: 10 October 2023
(This article belongs to the Special Issue Lignocellulosic Biomass Decomposition and Bioconversion)

Abstract

:
Our study aimed to investigate the applicability of dielectric measurements across three key stages of plant-based biomass utilization: enzymatic hydrolysis of native and microwave pre-processed corn-cob residues, ethanol fermentation of the hydrolysates, and anaerobic co-digestion with meat-industry wastewater sludge. Our major findings reveal that microwave pre-treatment not only accelerates enzymatic hydrolysis but also improves sugar yield. A strong linear correlation (r = 0.987–0.979; R2 = 0.974–0.978) was observed between the dielectric constant and sugar concentrations, offering a reliable monitoring mechanism. During ethanol fermentation, microwave pre-treated samples resulted in higher yields; however, the overall bioconversion efficiency was lower. Dielectric measurements also exhibited a strong linear correlation (r = 0.989–0.997; R2 = 0.979–0.993) with ethanol concentration. Finally, anaerobic co-digestion could be effectively monitored through the measurement of the dielectric constants (r = 0.981–0.996; R2 = 0.963–0.993), with microwave-treated samples showing higher biogas yields. These results demonstrate that dielectric measurements provide a promising alternative for monitoring and controlling biomass utilization processes.

1. Introduction

The increasing emphasis on sustainable development and reducing dependence on non-renewable resources has intensified the focus on the utilization of biomass and the adoption of green technologies. Biomass utilization forms a key pillar in the circular economy model, which aims to eliminate waste and continuously utilize resources in a closed-loop system [1]. As global economies have faced the dual challenge of ensuring energy security and mitigating environmental impact, the exploration and refinement of biomass conversion technologies offer promising solutions. The transition towards a bio-based economy can provide answers to the urgent need for new, sustainable sources of chemicals, materials, and energy. The conversion of biomass into bioenergy and bio-products involves a collection of different technologies, each with their specific efficiency and applicability.

1.1. General Characteristics of Lignocellulosic Biomass

Lignocellulosic biomass (LCB) is the most abundant raw material and biological resource on Earth, and is estimated to make up about 80% (450 Gt of carbon) of the total biomass [2,3]. Utilization of LCB for bioenergy production has been widely investigated in the previous decades, as it provides an excellent environmentally friendly alternative to non-renewable energy sources. There are numerous procedures to convert plant-based biomass into usable feedstock or valuable energy carriers, such as C5 and C6 sugars, organic acids, or more commonly, bioethanol and biogas. Lignocellulose itself represents a complex structural component of plant cell walls, composed primarily of three different biopolymers: cellulose, hemicellulose (collectively called holocellulose), and lignin. Cellulose, which is the most abundant, is a homopolysaccharide consisting of β-1,4-linked D-glucose units which are arranged into ordered fibrils. These fibrils form crystalline microfibrils with high chemical stability—this provides rigidity and strength to the plant cell wall [4]. Hemicellulose, in contrast, is a heteropolysaccharide, which acts as a filler material interfacing with the cellulose microfibrils. Hemicellulose is diverse in its monosaccharide composition and linkage patterns, depending on the species of the plant; however, the different sugar components are mainly xylose, arabinose, glucose, mannose, galactose, and rhamnose [5]. Lignin is a complex phenolic polymer, which provides resistance to microbial infections for the plant and contributes to water impermeability. It is composed of different phenylpropanoid units—among others, coniferyl, sinapyl, and p-coumaryl alcohols—connected through various linkages (primarily carbon–carbon and ether bonds), and its presence and abundance greatly vary among different species and even different tissues within the same plant. Due to its complex and unique structure, the degree of lignification can present difficulties when it comes to LCB utilization.

1.2. Utilization Methods for Lignocellulosic Biomass

Physical pre- or post-processing methods, such as mechanical milling, thermal treatments, microwave, or ultrasonic irradiation aim to disrupt the primary structure of the LCB fibers, improve the bioavailability of certain organic compounds, and/or increase the specific surface area of the biomass [6,7,8]. Chemical methods, like acid hydrolysis, alkaline treatment, or ionic liquids, aim to disrupt the lignin structure and thus make the polysaccharides more accessible [9,10]. Less intensive and more environmentally friendly biological methods harness the enzymatic capabilities of microorganisms or purified enzymes to convert the LCB material into fermentable sugars, which can be combined with physical and chemical treatment methods as well [11,12].
One of the major overall indicators of LCB utilization efficiency is bioethanol production, which can be achieved via four different major techniques: separate hydrolysis and fermentation (SHF), simultaneous saccharification and fermentation (SSF), consolidated bioprocessing (CPB), and simultaneous and saccharification co-fermentation (SSCF). Since CPB and SSCF usually grant a relatively low bioethanol yield and/or present difficulties in terms of optimization [13], the most commonly used methods are SHF and SSF. During SHF, the hydrolysis of the LCB material is performed first, followed by a separate fermentation step. This holds the advantage that the enzymes needed for the breakdown of cellulose strands and the microorganisms used for the ethanol fermentation can each be optimized for their own step, potentially leading to higher efficiency [14]. However, since these two sub-processes take place separately in place and time, SHF is considered time-consuming and more expensive in contrast to SSF. During the latter, hydrolysis and fermentation occur at the same time and place, which means that the produced glucose (and/or other sugars) cannot accumulate inside the reactor, thus eliminating the possibility of feedback inhibition. Nevertheless, this approach means that the conditions (like pH, temperature) must be a compromise that allows both the hydrolysis enzymes and the fermentation organisms to function, which may not be optimal for either process [15].
In order to provide fermentable sugars to microorganisms to convert them further into ethanol, first the cellulose and hemicellulose need to be hydrolyzed into sugar monomers. This process is called saccharification, which is achieved by either using adequate microorganisms, purified enzymes, or chemicals. The former two are considered to be the most environmentally friendly approaches, and since enzymes can provide the same efficiency overall as acidic hydrolysis under certain conditions [16], the enzymatic hydrolysis is usually the most favorable method for saccharification. The enzymatic process primarily involves cellulases and hemicellulases, systematically breaking down complex carbohydrate polymers into fermentable sugars. The cellulase complex includes endoglucanases, exoglucanases, and β-glucosidases working synergistically to degrade cellulose. Likewise, hemicellulose is hydrolyzed by a mixture of enzymes, including xylanases, mannanases, and others, depending on its heterogenous composition. One of the greatest challenges in this process is due to the presence of lignin, and the overall rigidity and stability of the LCB fiber’s components. Using standalone enzymes usually grants low yield and efficiency [17], and therefore a preliminary pre-processing step is needed to enhance the process [18]. The array of these pre-treatment methods is broad, as discussed above: a range of physical, thermal, chemical, biological, and combined treatments are available, and have been intensively investigated in the past several years. Among these, the utilization of microwave irradiation has shown promising results, due to its fast, selective, and volumetric heating capabilities. Microwaves (300 MHz–3 GHz electromagnetic waves), when absorbed in certain materials, are converted into heat through two major phenomena: dipole rotation and ionic conduction [19]. Molecules that have either permanent or induced dipolarity (like water) will arrange correspondingly to the polarity of the applied electromagnetic field. In case of a 2.45 GHz—the most commonly used microwave—frequency, this means 4.9 × 10⁹ revolutions per second. The rapid rotational movement induces friction between the adjacent molecules, which ultimately leads to fast and excessive heat generation. For ionic molecules, the periodically changing electromagnetic field causes movement, or “migration”, in the direction of the corresponding polarity, which also leads to friction and eventually heat formation [20]. Since plant-based biomass evidently contains plant cells with excessive free and bounded water content, microwave irradiation as a pre-processing method is certainly favorable, as we have already shown in one of our previous studies [18]. The water content inside the plant cells under the influence of microwave irradiation rapidly heats up, which results in a great increment of pressure—to such an extent that the cell wall no longer can sustain, and, in the end, it disrupts [21]. Under this method, the enzymes used for LCB saccharification have better availability to the substrate molecules, which results in higher yields and/or shortening the time of hydrolysis [22,23,24]. Moreover, if microwave irradiation is coupled with chemical treatments (mostly alkaline addition), the degree of lignification can also be reduced [25].
The next step in bioethanol production after cellulose hydrolysis is the ethanol fermentation itself. Upon completion of the hydrolysis process, the resulting mixture consists primarily of glucose and xylose, the simplest forms of sugar derived from cellulose and hemicellulose, respectively. The most commonly used microorganisms, i.e., Saccharomyces cerevisiae or other yeasts, metabolize the simple sugars under anaerobic conditions and convert them into ethanol. The process of fermentation involves glycolysis, a biochemical pathway wherein one glucose molecule is converted into two molecules of pyruvate, yielding a small amount of energy. Pyruvate is then further metabolized anaerobically to ethanol and carbon dioxide. The fermentation process can take anywhere from hours to days, depending on the specific conditions and the strain of yeast used [26]. The end product, ethanol, can then be distilled and purified to produce bioethanol fuel. Meanwhile, the carbon dioxide released during fermentation can be captured and used in various industrial applications, thereby contributing to a closed carbon cycle and promoting environmental sustainability [27]. However, managing the by-products and potential inhibitors generated during the preceding steps of biomass pretreatment and hydrolysis remains a significant challenge in optimizing the efficiency of the SHF process [28].
Another possible and commonly used method of LCB utilization is biogas fermentation, especially in the form of co-fermentation with wastewater sludge [29], which presents a unique opportunity to enhance biogas production while also addressing waste-management issues [30]. As discussed above, the complex and resistant nature of LCB compounds usually necessitates the use of pre-processing methods to make the biomass components more accessible for subsequent microbial degradation. This means that using (appropriately prepared) bioethanol fermentation residues—which have already undergone pre-treatment—can be a promising alternative as a feed material for co-fermentation with sludge to achieve an optimal nutrient profile; however, this approach has not been intensively investigated yet, therefore making it one of our specific research aims. The major downside of—especially industrial—sludge samples is the unfavorable C/N ratio, the sludge being relatively low on carbon content and usually high in nitrogen [31]. In contrast to this, plant-based biomass contains much more—typically organic—carbon, and most of the time only just a negligible amount of nitrogen. Thus, mixing these two feedstocks appropriately can create a favorable C/N ratio for biogas production, which is one of the most important factors in terms of anaerobic digestion (AD) [32]. The co-fermentation process occurs within an anaerobic digester, where the combined feedstock is broken down over several stages: hydrolysis, acidogenesis, acetogenesis, and methanogenesis [33]. Co-fermentation offers several advantages over the standalone use of LCB. It allows increased overall biogas yield, reduced digestion time, and more efficient utilization of available resources [34]. Additionally, by integrating waste management with renewable energy production, co-fermentation also contributes to environmental sustainability.

1.3. Monitoring Methods in Biomass Utilization Processes

1.3.1. Conventional Methods

One of the most important aspects in biomass utilization, in addition to optimization, is process monitoring to ensure efficient operation, maximizing yield and managing potential issues before they become critical. During SHF, it is important to monitor either the initial biomass composition (as it informs the selection and dosage of enzymes for hydrolysis and the expected yield of fermentable sugars), or the end product of the hydrolysis, i.e., sugar concentration. Techniques such as high-performance liquid chromatography (HPLC) can be used to analyze the sugar content in the hydrolysate after hydrolysis, and spectroscopic techniques like Fourier transform infrared (FTIR) spectroscopy may be used to monitor the hydrolysis process in real time [35,36,37]. Another—significantly cheaper—method is the assessment of the total sugar content via certain spectrophotometric methods, such as dinitro-salicylic acid (DNS or DNSA)-based techniques [38] or enzymatic reactions [39]. During the sugar–ethanol conversion, HPLC can also be used to quantify ethanol production and to identify potential inhibitors such as acetic acid or furfural [40], but faster (and usually cheaper) techniques like refractometric measurement subsequent to distillation can also be used to measure the nascent ethanol concentration [41]. For a biogas co-fermentation process, real-time monitoring of parameters like pH, temperature, and biogas composition (typically methane and carbon dioxide ratios) is essential. Techniques like gas chromatography (GC) can be used to analyze the biogas composition, and advanced spectroscopic methods such as near-infrared (NIR) or mid-infrared (MIR) spectroscopy may be used for real-time monitoring of the fermentation process [42]. In addition to these, microbial community dynamics, especially in co-fermentation, can be assessed using advanced molecular techniques like next-generation sequencing (NGS). These methods help in identifying the diversity of microbes in the digester and their functional roles, which can provide valuable insights for optimizing the process and enhancing the biogas yield [43].

1.3.2. Dielectric Measurements

In addition to these somewhat more conventional methods, dielectric measurement presents a promising monitoring tool. The main principle behind this technique is that materials behave differently when put into contact with an electromagnetic field, depending on the frequency and strength of the field, temperature, and—most importantly—the chemical, physical, and biological structure and composition of the investigated material [44]. The field strength (E) of the applied electromagnetic field causes a so-called dielectric shift (D) in the material matrix, and the ratio of these quantities is proportional to the absolute permittivity (ε) of the material. Since the dielectric shift in real materials occurs with a delay in time (in contrast to vacuum, where it is instantaneous), it is more practical to use the complex permittivity (ε*) as the function of frequency instead of the absolute permittivity. As with any other complex functions, the complex permittivity can also be separated to its real and imaginary components as follows:
ε * ( f ) = ε ( f ) i ε ( f )
In this equation, ε′ represents the dielectric constant, which quantifies how much of the electrical energy can be absorbed and stored inside the material the electric field is in contact with, while the complex part ε″, the dielectric loss factor, shows how much of the stored electrical energy is converted into other forms of energy, like heat. These two dielectric parameters are strongly dependent on the physicochemical and biological/biochemical structure of the investigated material, and therefore their measurement might provide valuable information in certain processes where any of these structural changes occur [45]. For instance, during SHF, the change in composition from long-chain polymers to monomeric sugars alters the dielectric properties of the solution, which can be measured and correlated with the progress of hydrolysis. Similarly, during fermentation, the transformation of sugars into ethanol and the subsequent changes in cell density and viability of the fermenting microorganisms can be monitored using dielectric measurements. In the context of biogas co-fermentation, dielectric measurements can provide valuable insights into the AD process. Changes in the dielectric properties can reflect the different stages of digestion, from hydrolysis to methanogenesis, based on the variations in the solution’s composition and the microbial population—as we have already shown in one of our recent studies [46]. Compared to the aforementioned conventional analytic techniques, the main advantages of dielectric measurements include the lack of need for special chemicals and sample preparation. Moreover, the feasibility for rapid and reliable measurements enables its use in real-time process monitoring without altering the structure of the investigated material, and with relatively low maintenance costs.

1.4. Specific Aims of the Study

Since the applicability of dielectric measurements in biomass utilization has not previously been investigated in its entirety, the main objective of our study was to explore whether certain dielectric parameters can be effectively used to monitor a complete set of LCB biomass utilization processes: starting with the enzymatic hydrolysis of plant-residue biomass, followed by controlled ethanol fermentation, and at last but not least, the anaerobic co-digestion of meat-industry sludge and LCB residues from the bioethanol fermentation part. We wanted to see if any correlation could be found between the changes in dielectric constant during these given utilization processes and certain typical analytical parameters—sugar concentration, ethanol concentration, and biogas yield, respectively.

2. Materials and Methods

2.1. Enzymatic Hydrolysis

During the first stage of our experiments, we wanted to investigate and monitor the enzymatic breakdown of the lignocellulose content of industrial plant-residue biomass, namely corn-cob residues. These residues were obtained from a local corn-processing factory, and the primary (>98%) components originated from the inner, sturdier part of the corn cobs, called pith. Table 1 summarizes the basic characteristics of the applied material.
For the enzymatic hydrolysis, 10 m/m% suspensions in 3 parallels were created with purified water in a total mass of 100 g. In order to verify the effectiveness of microwave pre-treatment as an enhancing pre-processing method, one part of each sample was irradiated prior to the addition of enzymes, in a Labotron 500 laboratory microwave device with the following operational parameters: P = 500 W, t = 180 s (total irradiated microwave energy, MWE = 90 kJ), and f = 2450 MHz. The other halves of the samples received no pre-treatment, and thus served as control samples. Thereafter, a mixture of glycoside hydrolases (cellulase, beta-glucosidase, hemicellulase; under the trade name Cellulase enzyme blend) from Sigma-Aldrich (Merck), St. Louis, MI, USA with a nominal hydrolytic activity of 1000 U/g was added to the samples in a volume of 300 µL. The dosage was chosen according to the product specification sheet. To ensure the optimal conditions for the enzymes, the temperature was kept constant at 45 ± 0.5 °C and the pH at 4.8 ± 0.2 in an automatic fermenter (Minifors 2, Infors HT, Bottmingen, Switzerland). To achieve better mass transport and component transport, the samples were continuously stirred during the hydrolysis.
During the 6-days-long hydrolyzation period, the rate of cellulose degradation was characterized by the measurement of produced reducing sugars with the 3,5-dinitrosalicylic acid-based (DNS) spectrophotometric method every 24 h [47]. The absorbance was measured at wavelength and temperature of 540 nm and 45 °C, respectively, with a Biochrom WPA Biowave II spectrophotometer. Simultaneously, the samples were characterized by the measurement of their dielectric constant (ε’) (refer to Section 2.4).

2.2. Ethanol Fermentation

After the 6-days-long saccharification, the different hydrolysates (control and pre-treated) underwent anaerobic fermentation, likewise, in an automatic, continuously stirred anaerobic bioreactor (Minifors 2, Infors HT, Bottmingen, Switzerland). Since plant-based hydrolysates can contain microbial-activity inhibitors—mainly furfural and hidroxymethyl-furfural—their presence was ruled out by assessing the samples with reflectometric tests. The ethanol fermentation was achieved with Saccharomyces cerevisiae strains, for which the optimal parameters were set and kept (T = 30 ± 0.5 °C, pH = 5.5). Although traces of active cellulase enzymes could have remained in the hydrolysates, these conditions set for the fermentation ultimately stop them from working; thus, the formation of more possible monosaccharides is negligible. The ethanol production was measured by standard distillation–refractometric method (Refractro 30 GS, Metler Toledo, Oakland, CA, USA) every 24 h, along with the measurement of dielectric parameters, just like during the saccharification process.

2.3. Anaerobic Digestion

In the third part of our experiments, we wanted to see whether the solid residues originated from the previous ethanol fermentation can be used for co-fermentation with wastewater sludge to produce biogas. To do so, we first dried the residues to eliminate traces of alcohol and other, potentially inhibitory compounds (45 °C, 12 h), and then mixed them in laboratory glass fermenters (Vtotal = 250 cm3) with 90 cm3 of meat-industry wastewater sludge (MIWS, originating from a local meat processing factory, Szeged, Hungary), and 10 cm3 of inoculated sludge to ensure the proper microbial community for AD. The basic characteristics of the utilized MIWS can be seen in Table 2. The total solid (TS) content was measured via drying to constant weight at 105 °C. The total chemical oxygen demand (TCOD) was determined with standard potassium–dichromate test tubes (digestion time: 120 min, T = 150 °C) (Hanna Instruments, George Washington Hwy, VA, USA) and an MD-200 portable COD photometer (Lovibond, Amesbury, UK). Biochemical oxygen demand (BOD5) was measured with a respirometric OxiDirect BOD analyzer (Lovibond, Amesbury, UK; parameters: 5 days, 20 °C), whilst the total organic carbon (TOC) and total nitrogen (TN) were determined with a Torch TOC/TN combustion analyzer (Teledyne Tekmar, Hudson, NH, USA).
During the mesophilic biogas fermentation, the mixtures were kept at a constant 38 ± 0.5 °C temperature and were continuously stirred for better homogeneity. Throughout the anaerobic digestion, the biogas production was measured by evaluating the nascent pressure inside the fermenters (WTW OxiTop IDS/B manometric measuring head, Xylem, Washington DC, USA), and then the biogas volume was calculated via the modified ideal gas law. Also, the dielectric characteristics of the fermentation medium was measured, similarly to the previous two processes.

2.4. Dielectric Measurements

One of the main objectives of our study was to investigate whether any connection could be found between the dielectric behavior and the physical/(bio)chemical changes of the fermentation media during the three utilization processes detailed above. Accordingly, we continuously measured the dielectric constants of these media with a dielectric measurement system. The dielectric constant (ε’) was measured in the frequency range of 200–2400 MHz with an open-ended dielectric probe (DAK 3.5; Speag, Zürich, Switzerland, frequency range: 200 MHz–20 GHz) connected to a vector network analyzer (ZVL-3, Rhode&Schwarz, Munich, Germany, bandwidth: 30 kHz–3 GHz) with an insulated coaxial cable. All the different samples were stored in a cylindrical borosilicate beaker during the measurements. The layer thickness of the samples was 7 cm, and the immersion depth of the probe was 5 cm each time. Since the dielectric properties are temperature-dependent, the samples were kept at a temperature appropriate to the utilization process itself during the dielectric assessment (i.e., 45 °C, 30 °C, 38 °C, respectively).
The summary of the different processes and measurements can be observed graphically in Figure 1a,b.

3. Results and Discussion

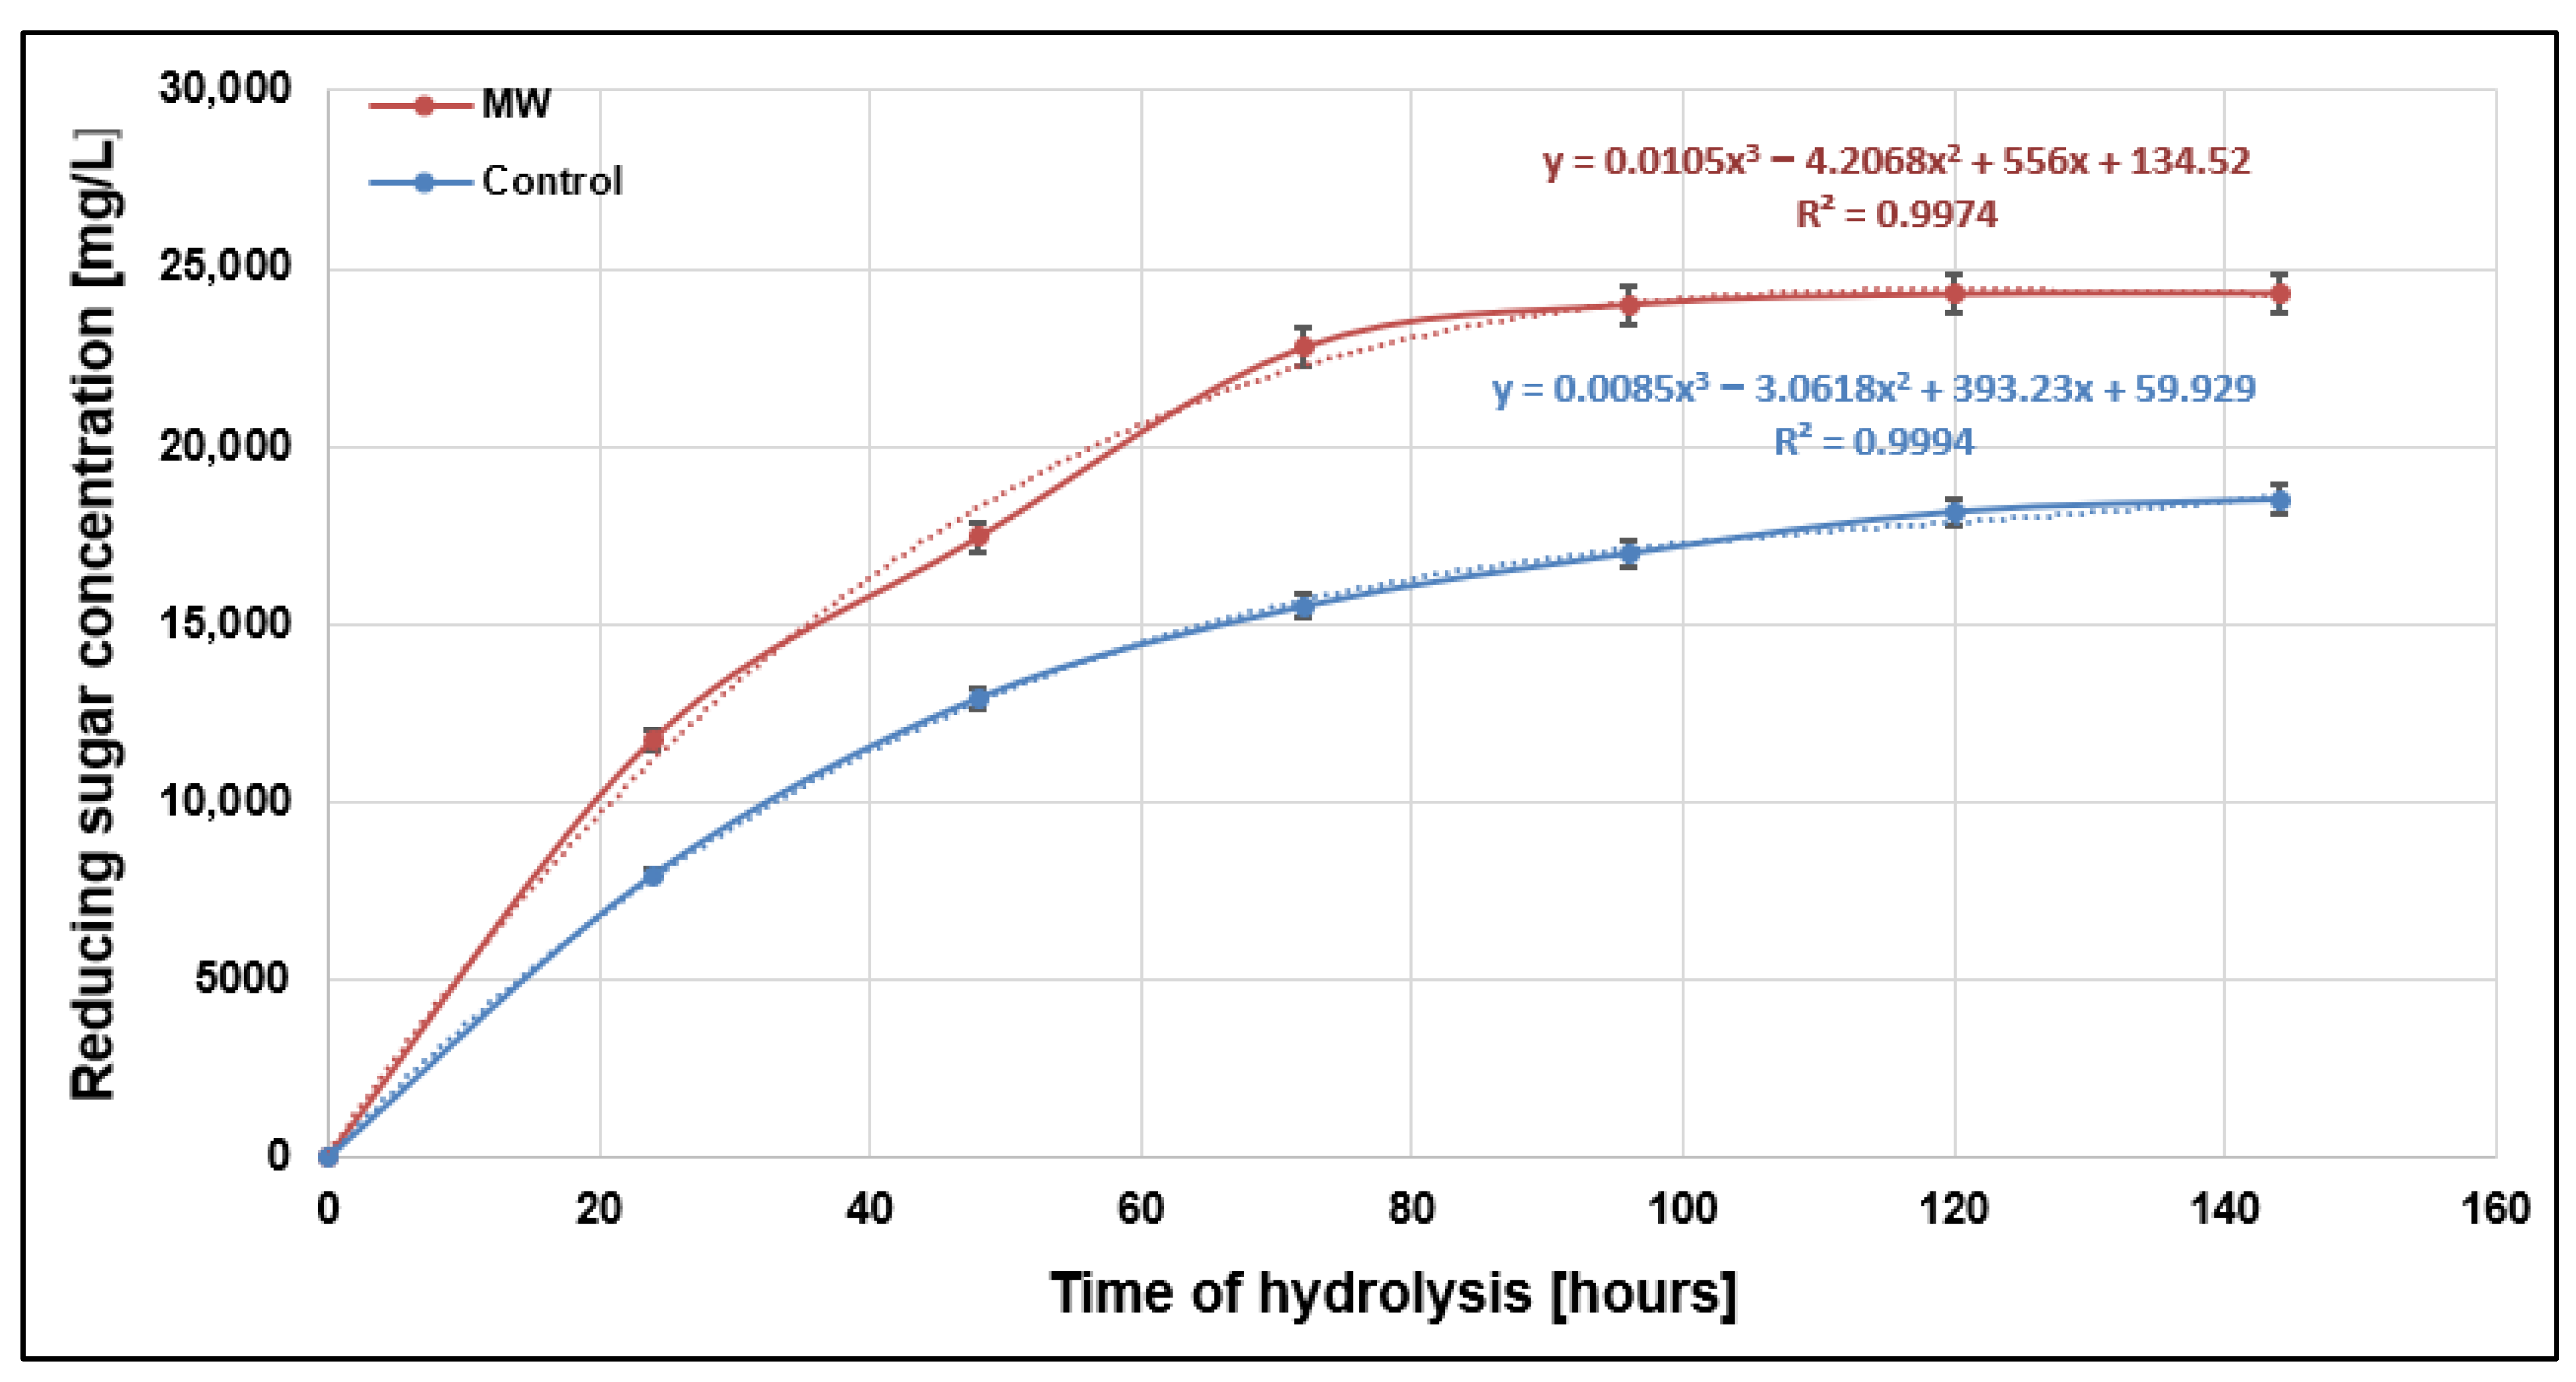
3.1. Enzymatic Hydrolysis—Saccharification

At the first stage of our investigation, we wanted to see the rate and dynamics of the enzymatic breakdown of the lignocellulose content found in the fibers of the utilized plant residue, described in the Materials and Methods section. Figure 2 shows the concentration of reducing sugar as a function of time during the hydrolysis of the control and microwave pre-processed (MW) samples.
Experimental results clearly show that the breakdown of cellulose and hemicellulose (represented by the production rate of the reducing-sugar products) follows the typical form of enzyme kinetics, so the curve for the values of the function is represented by a saturation curve. It can be seen that the initial rate of the reaction was considerably lower for the control samples (cf. 120 h vs. 72 h to steady state), meaning that they reached the equilibrium product concentration slower, than that of those previously processed by microwave irradiation (MW). Furthermore, the maximum yield for the control samples peaked at around 18,000 mg/L, whereas the maximum yield of the microwave pre-treated ones reached almost 25,000 mg/L. This indicates that not only can microwave irradiation indirectly speed up the enzyme reaction itself, but it can also result in higher concentrations of end product. This can be explained by the destructive mechanisms of microwave irradiation, i.e., that it can generate extremely high temperatures inside the plant cells, which ultimately leads to an increment in pressure to such an extent that cell wall disrupts [21,24]. Heat generation induced by microwaves can also weaken the secondary chemical bonds between individual cellulose strands, and therefore, the structure of the cellulose fibers eventually disintegrates [48,49], which leads to better substrate availability for the hydrolytic enzymes.
Since the one of the main objectives of the research was to verify whether the changes in dielectric characteristics of the reaction media correlate with the progress of hydrolysis itself, we measured the dielectric constant of the hydrolysates every 24 h. Figure 3 shows the results obtained for the dielectric constant as a function of frequency on a given day of the hydrolysis. Day 0 represents the initial values, prior to the enzymatic digestion.
One of the key points that should be noted is that the dielectric constant gradually decreases as the saccharification progresses (Figure 3): during the first several days, the differences between each dielectric spectrum is noticeable, but towards the end of the enzymatic process these differences become slighter. This tendency strongly connects with the saturation curve of the product formation (Figure 2), indicating that there is a correlation between them to some extent. It is also very important to note that local minimums of the dielectric constant can be seen at around f = 900–1000 MHz, starting from Day 1, becoming more and more prominent as the hydrolysis goes forward. A drop in the dielectric constant usually indicates that the material matrix has undergone such chemical and/or physical changes that it can absorb and/or store less electric energy than previously, which can be explained by the molecular changes that occur during the hydrolysis of cellulose. In the study by Bryent et al. [50], it was verified that the carbohydrate release from LCB and organic acid production can be detected by conductivity analysis using kHz range dielectric spectroscopy. During saccharification, the glucose concentration gradually increases, and glucose molecules do not possess a strong permanent dipole moment, unlike water [51]. When glucose is added to water, some of the water–water interactions (including hydrogen bonds) are disrupted, and instead, water–glucose interactions are formed. The weaker dipole character of these interactions contributes to a lower effective dielectric constant [52]. It is also worth noting that glucose molecules evidently occupy space, effectively reducing the number of water molecules in a given volume of solution compared with pure water, which results in fewer dipole–dipole interactions. The fact that this specific, observable decrease in the dielectric constant occurs at around 900 MHz might be explained by the dielectric behavior of aqueous systems [53] (like dilute sugar solutions): the relaxation frequency of water is around 900–1000 MHz, and since the components of cellulose fibers are insoluble in water, in their original form they cannot alter this in any way. However, the sugar products of the cellulose hydrolysis are water-soluble, which ultimately and evidently leads to a change in the dielectric behavior, more precisely, relaxation phenomena.
Similar tendencies could be found when evaluating the dielectric spectra of the microwave pre-processed samples (Figure 4). The key differences can be explained on the one hand by the fact that the microwave irradiation increased the rate of the enzymatic reaction, and on the other hand by the higher concentration of reducing sugars formed in the system during the whole process. This results in generally lower values of the dielectric constant throughout the dielectric spectrum, and more prominent differences between the distinct days of the reaction. The local minimum ε’ occurring at around 900–1000 MHz is presented here as well, which further supports the idea that these specific changes in dielectric behavior are indeed the results of saccharification.
Based on the preliminary evidence suggested by the observed dielectric spectra, we wanted to evaluate the strength of correlation between the produced sugar content during the hydrolysis and the change in dielectric behavior. Therefore, we constructed ε’(900 MHz) = f([RS]) functions, meaning that we depicted the values of the dielectric constant at 900 MHz (i.e., the variable which is affected by the biochemical changes in the material matrix) as a function of the corresponding sugar concentration (i.e., the variable which ultimately leads to the change in dielectric behavior). A 900 MHz frequency was chosen on the one hand because of the distinct, specific decrease that is represented on the dielectric spectra (Figure 3 and Figure 4), and on the other hand because, in case of a potential scale-up, high-power industrial microwave processing equipment usually operates around this frequency value [54]. Figure 5 shows the obtained results.
It can be clearly seen that in cases of both the control and microwave pre-treated samples, a relatively strong, linear correlation can be found between the amount of reducing sugars in the suspension and the dielectric constant of the hydrolyzation medium (r = 0.987, 0.989 and R2 = 0.974, 0.978, respectively). This suggests that the complex molecular changes during the hydrolysis do indeed affect the dielectric behavior of the system, and by measuring and detecting them, we can gain valuable information about the utilization process itself. It has already been shown in previous studies that the glucose concentration has a strong connection with the dielectric constant of the overall glucose model solution [55], and our findings now prove that this method can be effectively used in real materials and processes as well. This supports the idea that the cellulose degradation can be indirectly monitored by measuring certain dielectric properties, which, being fast, accurate, and non-destructive, present a promising alternative to the commonly used quantitative analytic methods.

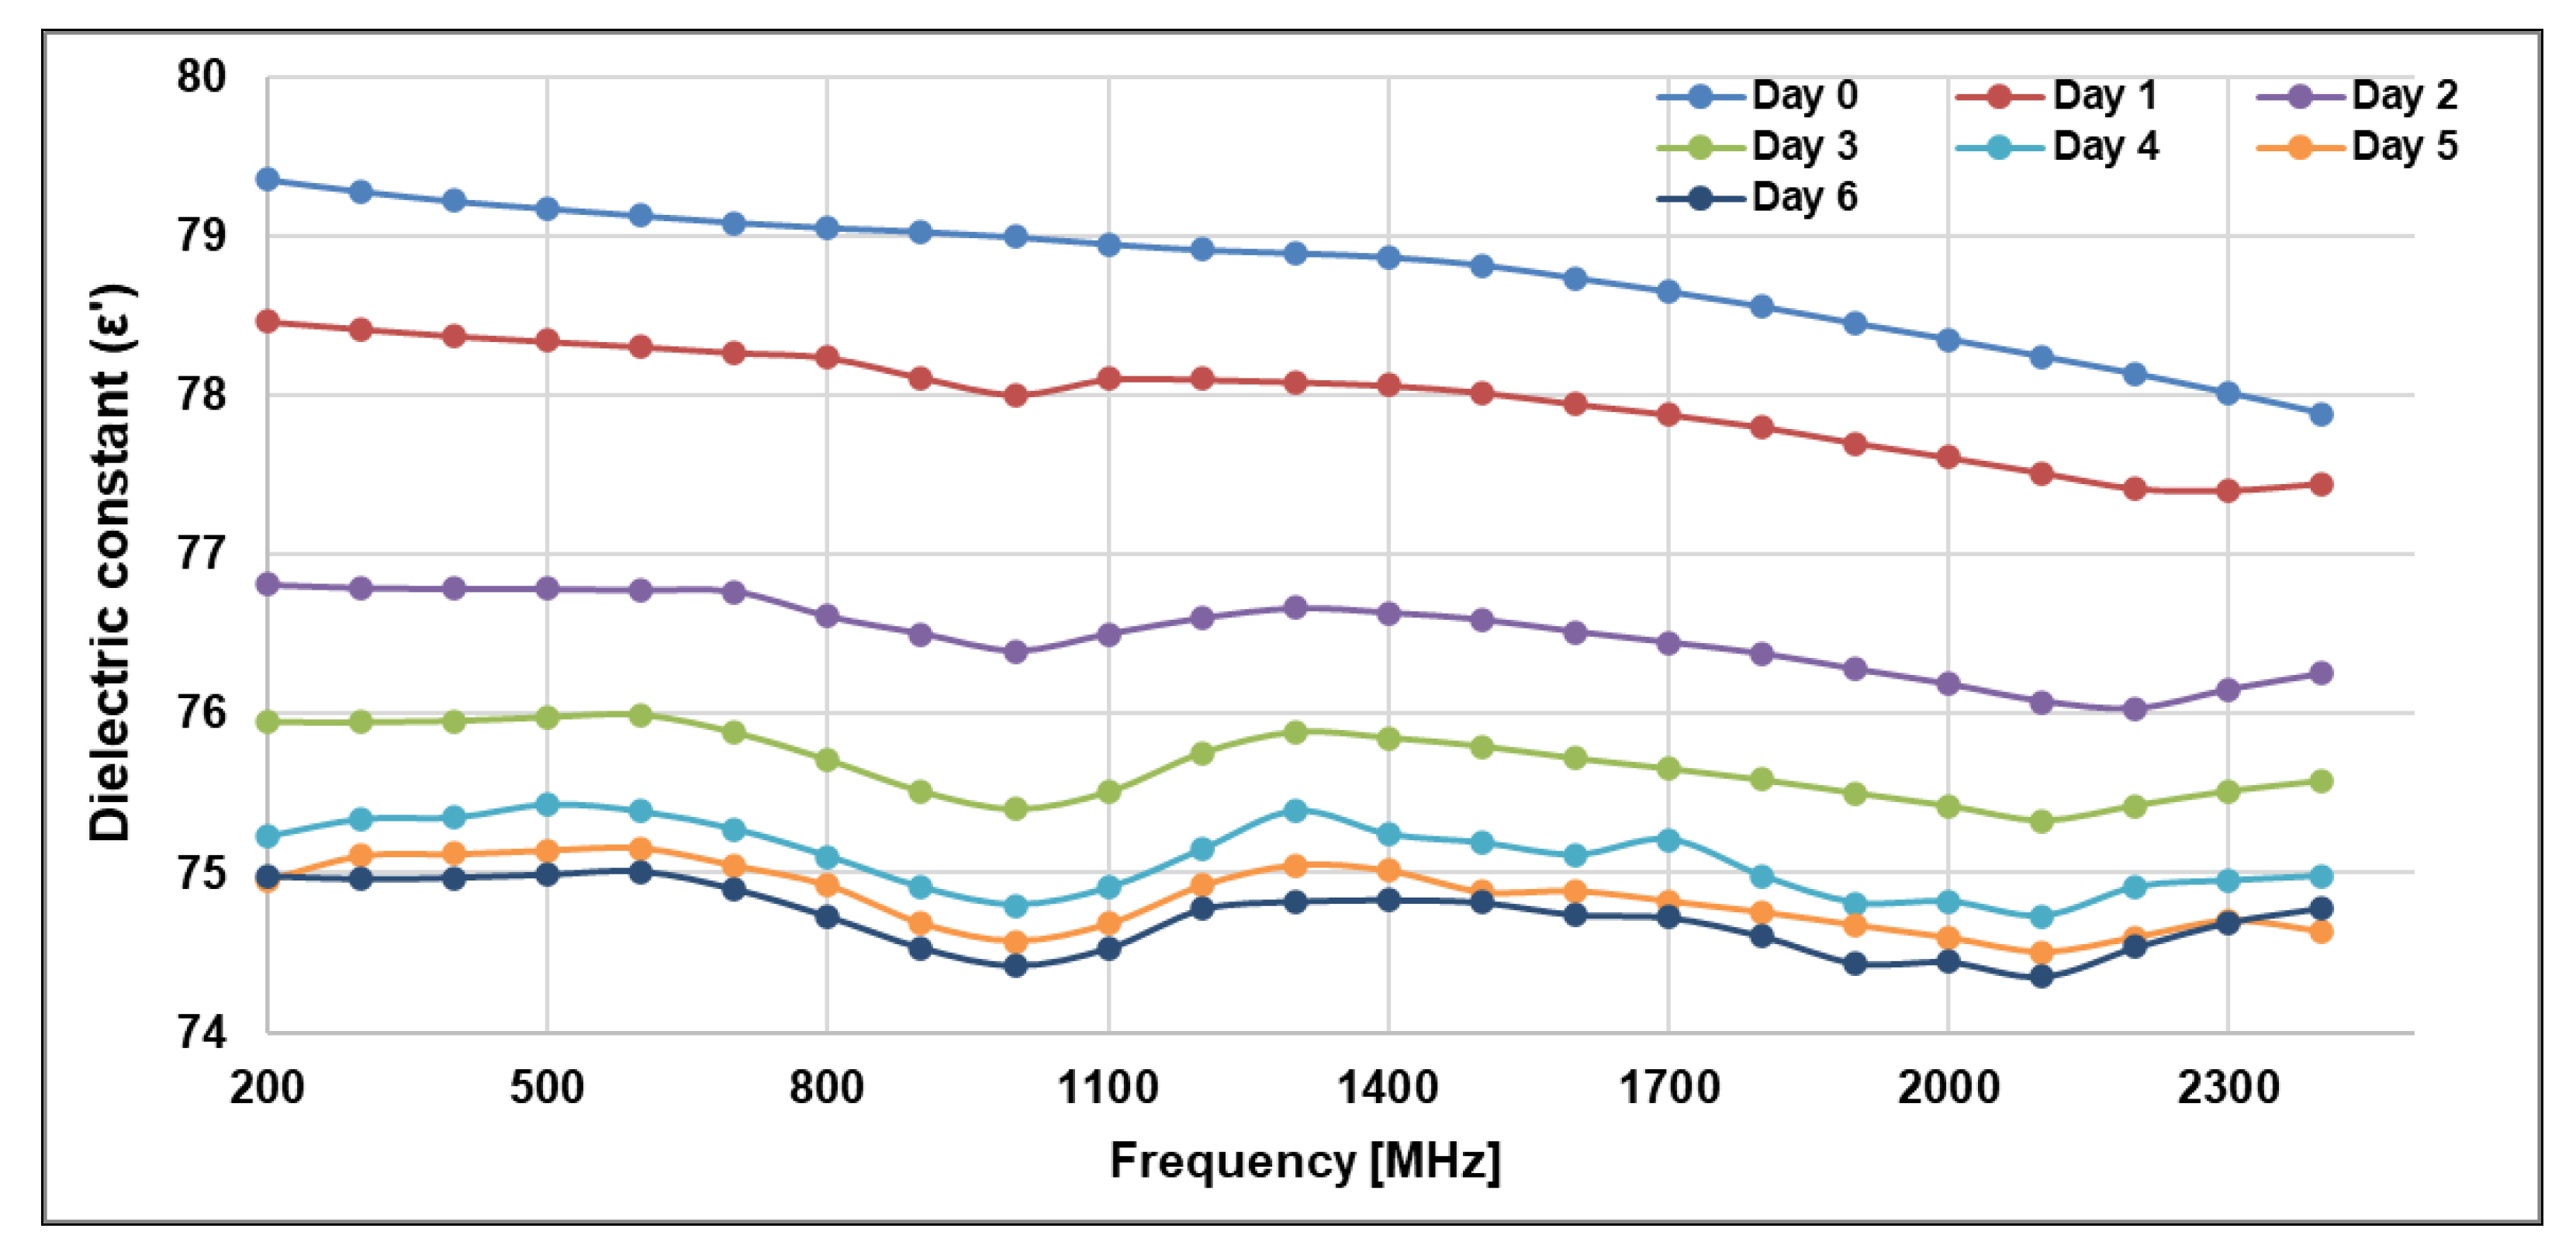
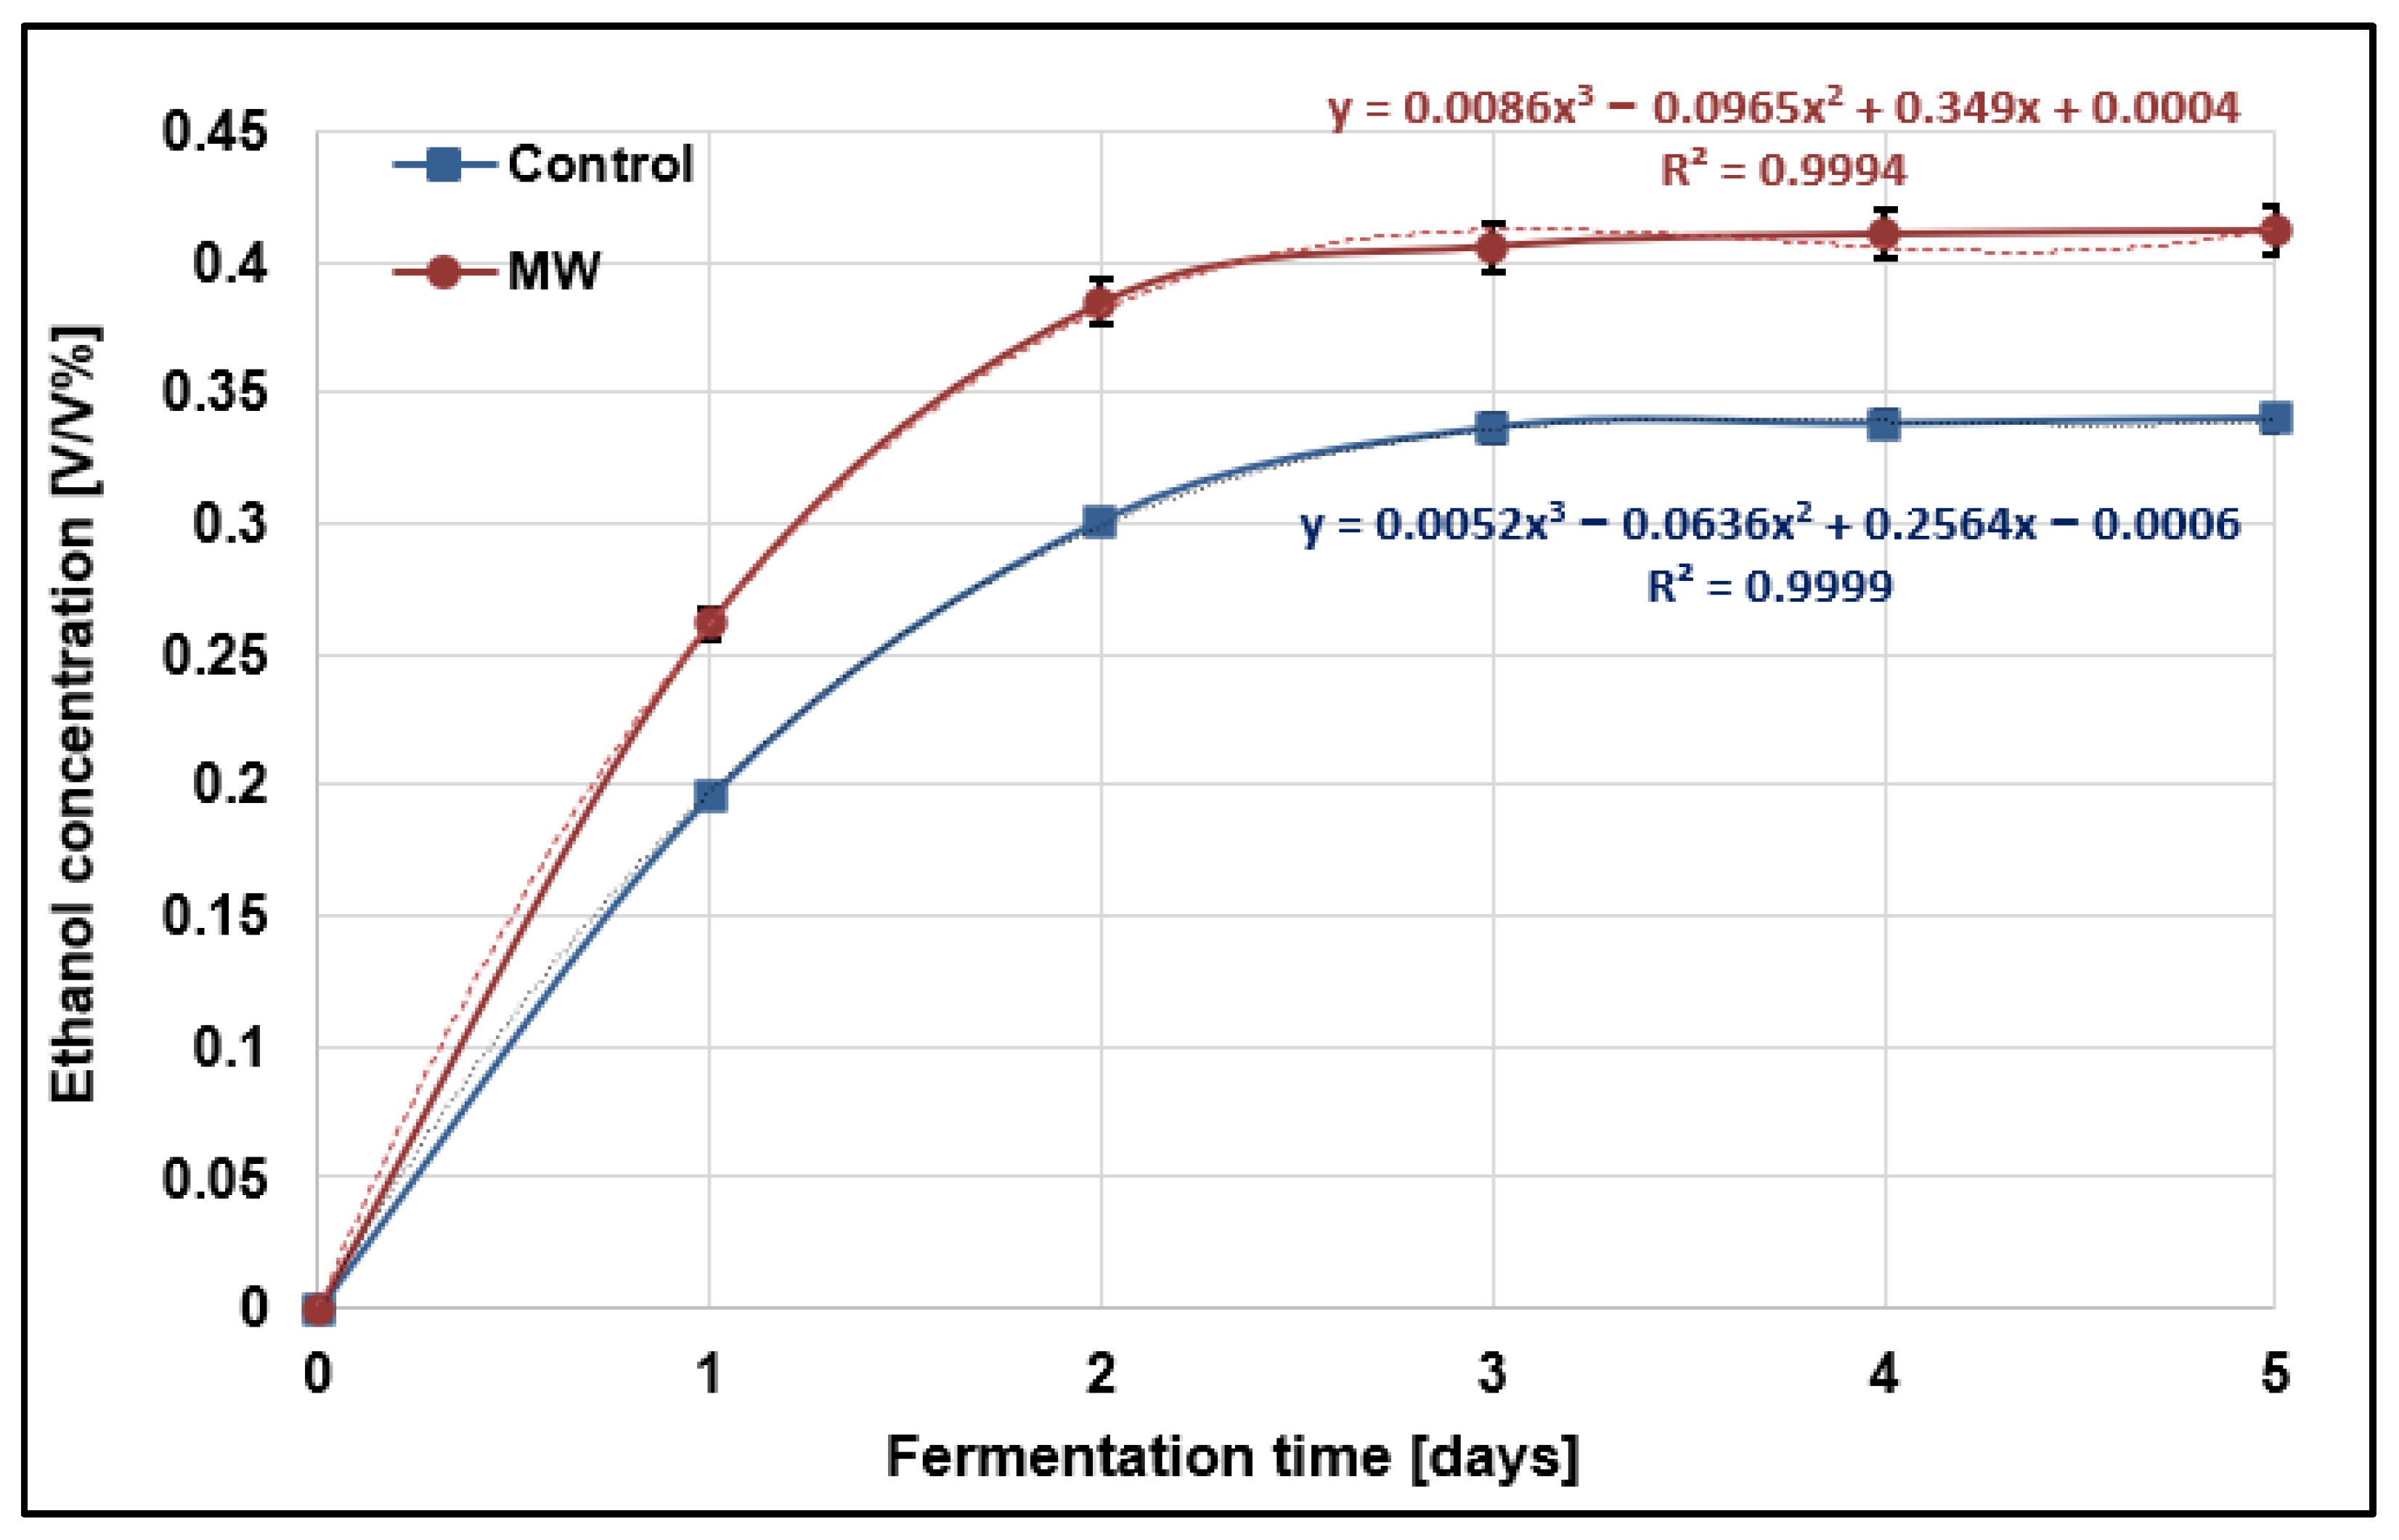
3.2. Ethanol Fermentation

During the second stage of SHF, we wanted to investigate the production rate of ethanol from the two different hydrolysates after the saccharification step, and verify whether any correlation could be found between the ethanol production kinetics and the dielectric behavior of the fermentation media. Similar to the change of reducing-sugars concentration during saccharification, the ethanol production follows a saturating tendency in both cases (Figure 6).
The microbial fermentation of the control (non-pre-treated) hydrolysates yielded a maximum concentration of ~0.34 v/v%, while the one which was based on microwave pre-processed LCB biomass resulted in a maximum of 0.41 v/v%. The contribution of microwave irradiation to the fermentation step is mainly based on the fact that the final sugar concentration was higher in the pre-processed samples, which evidently leads to higher ethanol conversion as well. However, in contrast to the saccharification step, the steady-state stage did not occur considerably earlier (12 h at most) in the case of the MW-treated samples, which means that this processing step cannot be accelerated the same way as the saccharification with the treatment of the raw material. Although the overall ethanol concentration was higher than that of the control samples, the effectiveness of the fermentation was lower in the case of the MW-treated hydrolysates. The efficiency was calculated by comparing the theoretical maximum ethanol yield (i.e., that which is biochemically possible) based on the maximum sugar concentrations of the hydrolysates [56], which turned out to be around 40% for the control samples and 33.8% for the microwave pre-treated ones. This suggests that microwave irradiation might lead to the formation of certain compounds during the enzymatic hydrolysis, which act as inhibitory agents [57] in terms of microbial metabolism.
Similar to the saccharification step, the change in dielectric constant throughout the process of ethanol fermentation was also measured to seek correlations between it and the ethanol production rate. Figure 7a,b show the dielectric spectra obtained for the control and the MW-treated samples, respectively.
Observing the dielectric spectra, one of the key points that can be seen is that the dielectric constant gradually decreases as the fermentation progresses for both control and MW-treated samples. Note that the Day 0 sample of the ethanol fermentation is basically equivalent to the “Day 6” sample of the saccharification step. The reason behind this is that ethanol is less polar than dissolved sugars or water, meaning that the bulk fermentation liquid is less responsive to the applied electromagnetic field, thus decreasing its dielectric constant [58]. It is also important to note that the local minimum of the dielectric constant around f = 900 MHz becomes less and less prominent as the fermentation progresses, i.e., as the sugar–ethanol conversion progresses. This also supports the fact that this distinct drop of the dielectric constant is indeed the result of the reducing-sugar content present. As the ethanol concentration saturates and reaches its maximum, the differences in the values of the dielectric constant diminish and eventually disappear for both the control and pre-processed samples.
In order to evaluate the strength of correlation between the ethanol content and the dielectric behavior of the fermentation medium, we plotted the dielectric constant against the alcohol concentration at f = 900 MHz (Figure 8).
Just like in the case of the saccharification process, the dielectric constant strongly correlates to the actual condition of the fermentation liquid. Abidin et al. showed in their 2014 study that solutions with different ethanol–glucose concentration ratios can be monitored by measuring the dielectric constant of the solutions [59], and our results suggest that this technique can be effectively implemented in real SHF processes too. Since the coefficient of correlation is high for both the control and MW-treated sample (0.989 and 0.997, respectively), the connection can be most definitely explained by the changes that occurred in the overall ethanol concentration, which follow a strong linear tendency (R2 = 0.979, 0.993). This suggests that measuring the dielectric behavior of the medium can be an accurate monitoring technique, just like in the case of the saccharification process, and therefore a suitable alternative to examine a biomass-utilization process like SHF.

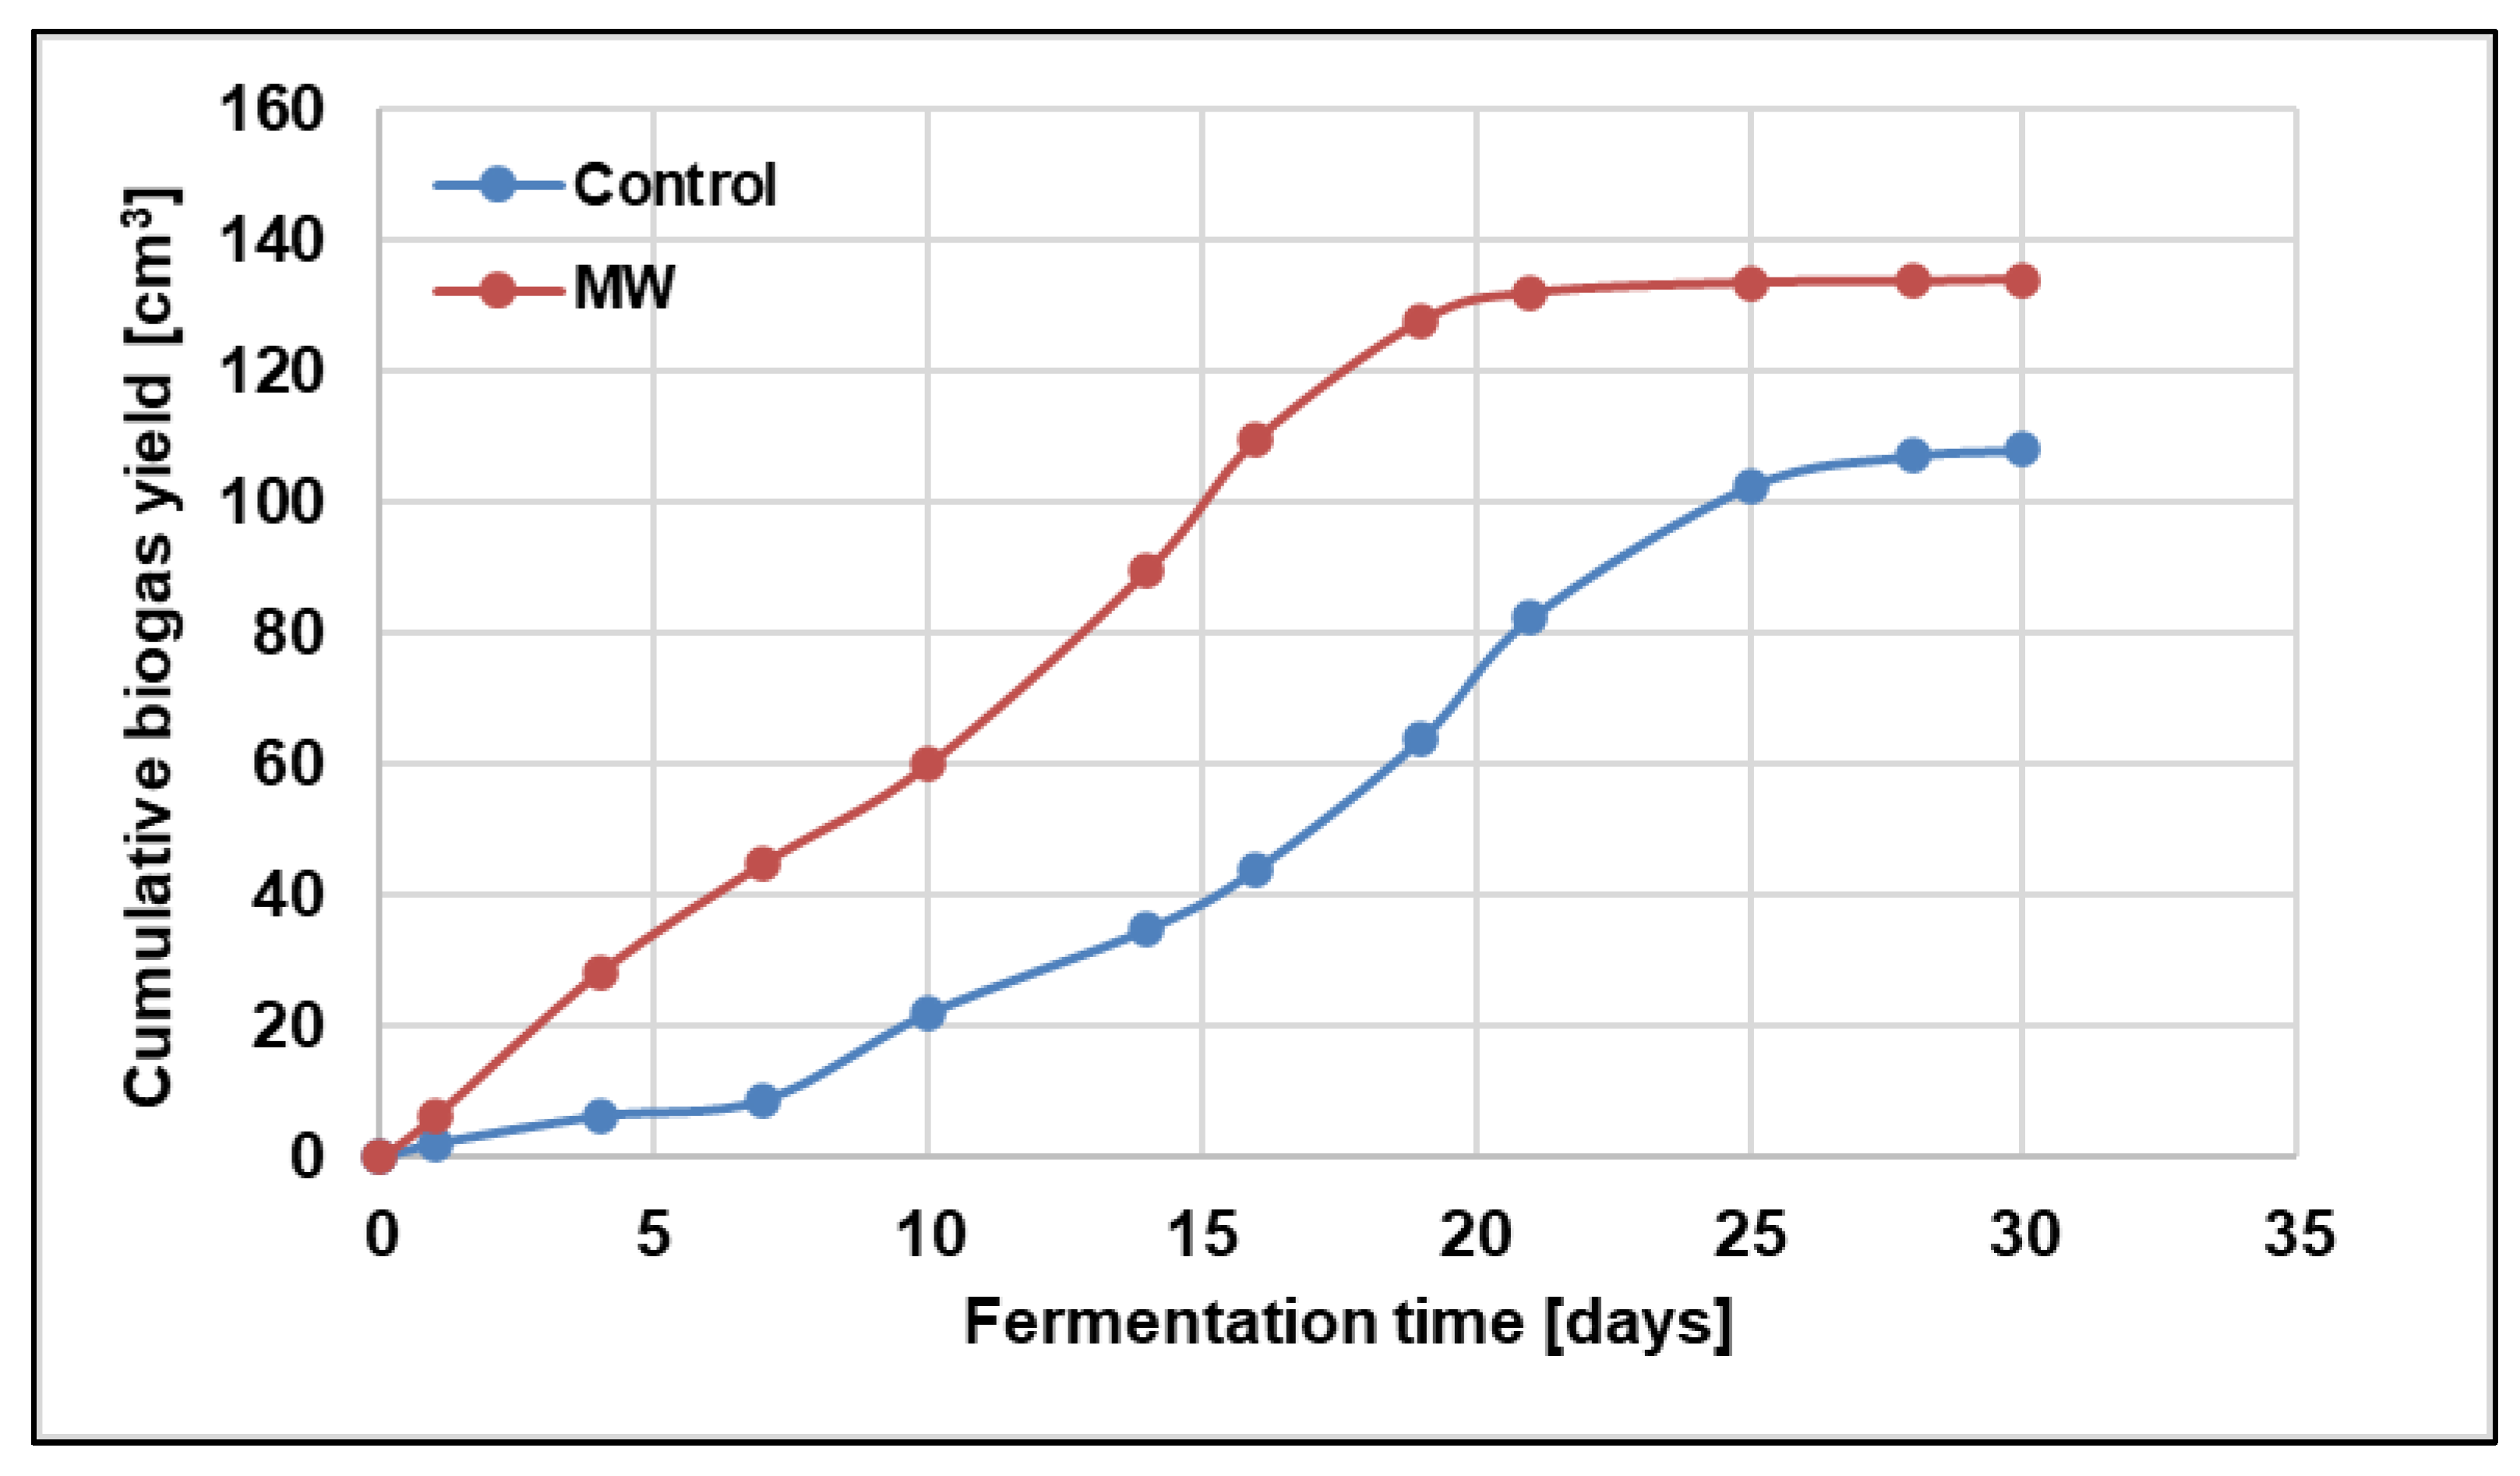
3.3. Anaerobic Digestion (AD)—Biogas Fermentation

To fully exploit the potential of the utilized plant-residue biomass, as the last stage of our investigations we conducted a co-fermentation experiment with the ethanol fermentation residues and meat-industry wastewater sludge. Food industrial sludge, especially meat-industry-originated, usually does not have an optimal C/N ratio for biogas production, because its TN content is typically high [60]. Therefore, by the addition of plant-based residues (which, on the contrary, are typically high in TC and have negigiblle nitrogen content) in appropriate amounts can enhance the C/N ratio to make it suitable for biogas fermentation. Based on our earlier research [46], we achieved a 35:1 C/N ratio by mixing the solid ethanol fermentation residue with MIWS. Figure 9 shows the results of the biogas production rate versus time of digestion for the control and MW-treated samples.
The obtained results clearly indicate that not only was the overall biogas yield higher for the MW-processed samples, but the rate of production also increased in contrast to the controls. The lag phase of the anaerobic fermentation is around 6–7 days for the control samples, while the log (or exponential) phase exceeds 17 days in total. Meanwhile, in the case of the MW-processed medium, the lag phase can hardly be observed at this scale; the log period stars approx. 12–24 h after the start of the process, and the steady-state or stationary phase sets in on the 20th day of the AD. These results suggest that although the microwave irradiation disrupted the structure of the cellulose fibers prior to the first processing step, saccharification, and resulted in higher cellulose–sugar conversion (i.e., the recoverable organic matter content depleted more in the raw material), due to the pre-processing step, the remaining utilizable compounds were still higher in the MW-treated samples. Likewise, since neither the enzymatic hydrolysis nor the ethanol fermentation was 100% efficient, a considerable amount of usable organic content was retained in the residues—which further justifies the need for this last utilization step. Moreover, due to structural changes [21,61,62], these organic components were more accessible for the microorganisms during AD, which explains the shorter lag phase and higher yield in the case of the pre-treated samples.
To verify the applicability of dielectric measurements throughout the whole biomass-utilization process, naturally we also measured the dielectric behavior of the fermentation media during the AD. Figure 10a,b represent the dielectric spectra obtained for the control and MW-treated samples, respectively.
The results obtained show great coherence with one of our earlier research works [46]. Both for the control and MW-processed samples, the values of the dielectric constant progressively decrease as the anaerobic fermentation goes forward, and the differences are the most prominent in the low-frequency range. Also, the frequency level that corresponds to the absolute maximum of the dielectric constant at a given day of fermentation gradually shifts towards the higher frequencies. The differences cease when the AD reaches its stationary phase (from which point onwards, no significant structural and/or (bio)chemical change occurs), just like in the case of the SHF process. It can be also observed that the dielectric constant values are generally lower during the fermentation of MW-treated samples; the reason behind this might be that the higher concentration of free, recoverable, and solvable compounds (caused by the microwave disintegration of the plant structure) made the excitability of the material matrix weaker, i.e., it reacted to the electromagnetic field to a lesser extent. Although part of the soluble organic content evidently decreased as more and more biogas was formed, in case of a wastewater–sludge-based fermentation media, the disintegration of the sludge flocs and EPS due to mechanical (most notably the stirring) and biochemical impacts is significant [63], which, on the contrary, increases the concentration of different solvable and non-solvable molecules in the liquid phase [64]. This alteration causes the dielectric constant to decrease progressively as the anaerobic digestion continues, up until the point where the whole process becomes steady-state.
To see the type and strength of correlation between the biogas production and the given dielectric state of the fermentation media, similar to the individual parts of the SHF, we constructed functions between the maximum points of the dielectric constant for a given day of fermentation and the corresponding biogas yield (Figure 11). It must be noted that we characterize the process of AD here with the biogas yield, for obvious reasons; therefore, the possible correlation between the state of the fermentation and the dielectric behavior is indirect, as opposed to the earlier two processes.
These results suggest that the biogas yield, and therefore the general state of the fermentation medium, linearly correlates with its dielectric behavior, regardless of whether it is pre-processed or native (r = 0.996, 0.981), and the connection is strong (R2 = 0.963, 0.993). The differences of the slopes are clearly the consequences of the biogas production rate, or more specifically, the length of the log or exponential phase. These observations imply that the measurement of the dielectric properties can be used to control and monitor the process of anaerobic digestion, and thus, a quasi-full cycle of plant-based biomass utilization starting from enzymatic hydrolysis, through ethanol fermentation, up until anaerobic co-fermentation.

4. Conclusions

In our present work, we investigated the applicability of dielectric measurements to monitor three different plant-based biomass utilization processes—enzymatic hydrolysis, also known as saccharification, of native and microwave pre-processed corn-cob residues, followed by the microbial ethanol fermentation of the hydrolysates, and finally, the co-digestion of the solid ethanol fermentation residues and meat-industry wastewater sludge. The main and most important objective of these three processes is the utilization and re-use of otherwise worthless, superfluous plant waste to create environmentally friendly, green energy carriers and/or sources. However, the controlling and monitoring of these processes are crucial, but also usually complicated, given the fact that all three hold great chemical and/or physical complexity. Since the dielectric behavior of a bulk system or material matrix strongly depends on its structure and chemical–biological composition, measuring certain dielectric properties might be a promising alternative for monitoring and assessing these utilization processes, or to be used for estimation purposes. Our key research findings are as follows:
  • Microwave pre-processing of the raw lignocellulosic material indirectly accelerates the subsequent enzymatic saccharification and increases the achievable reducing-sugar yield.
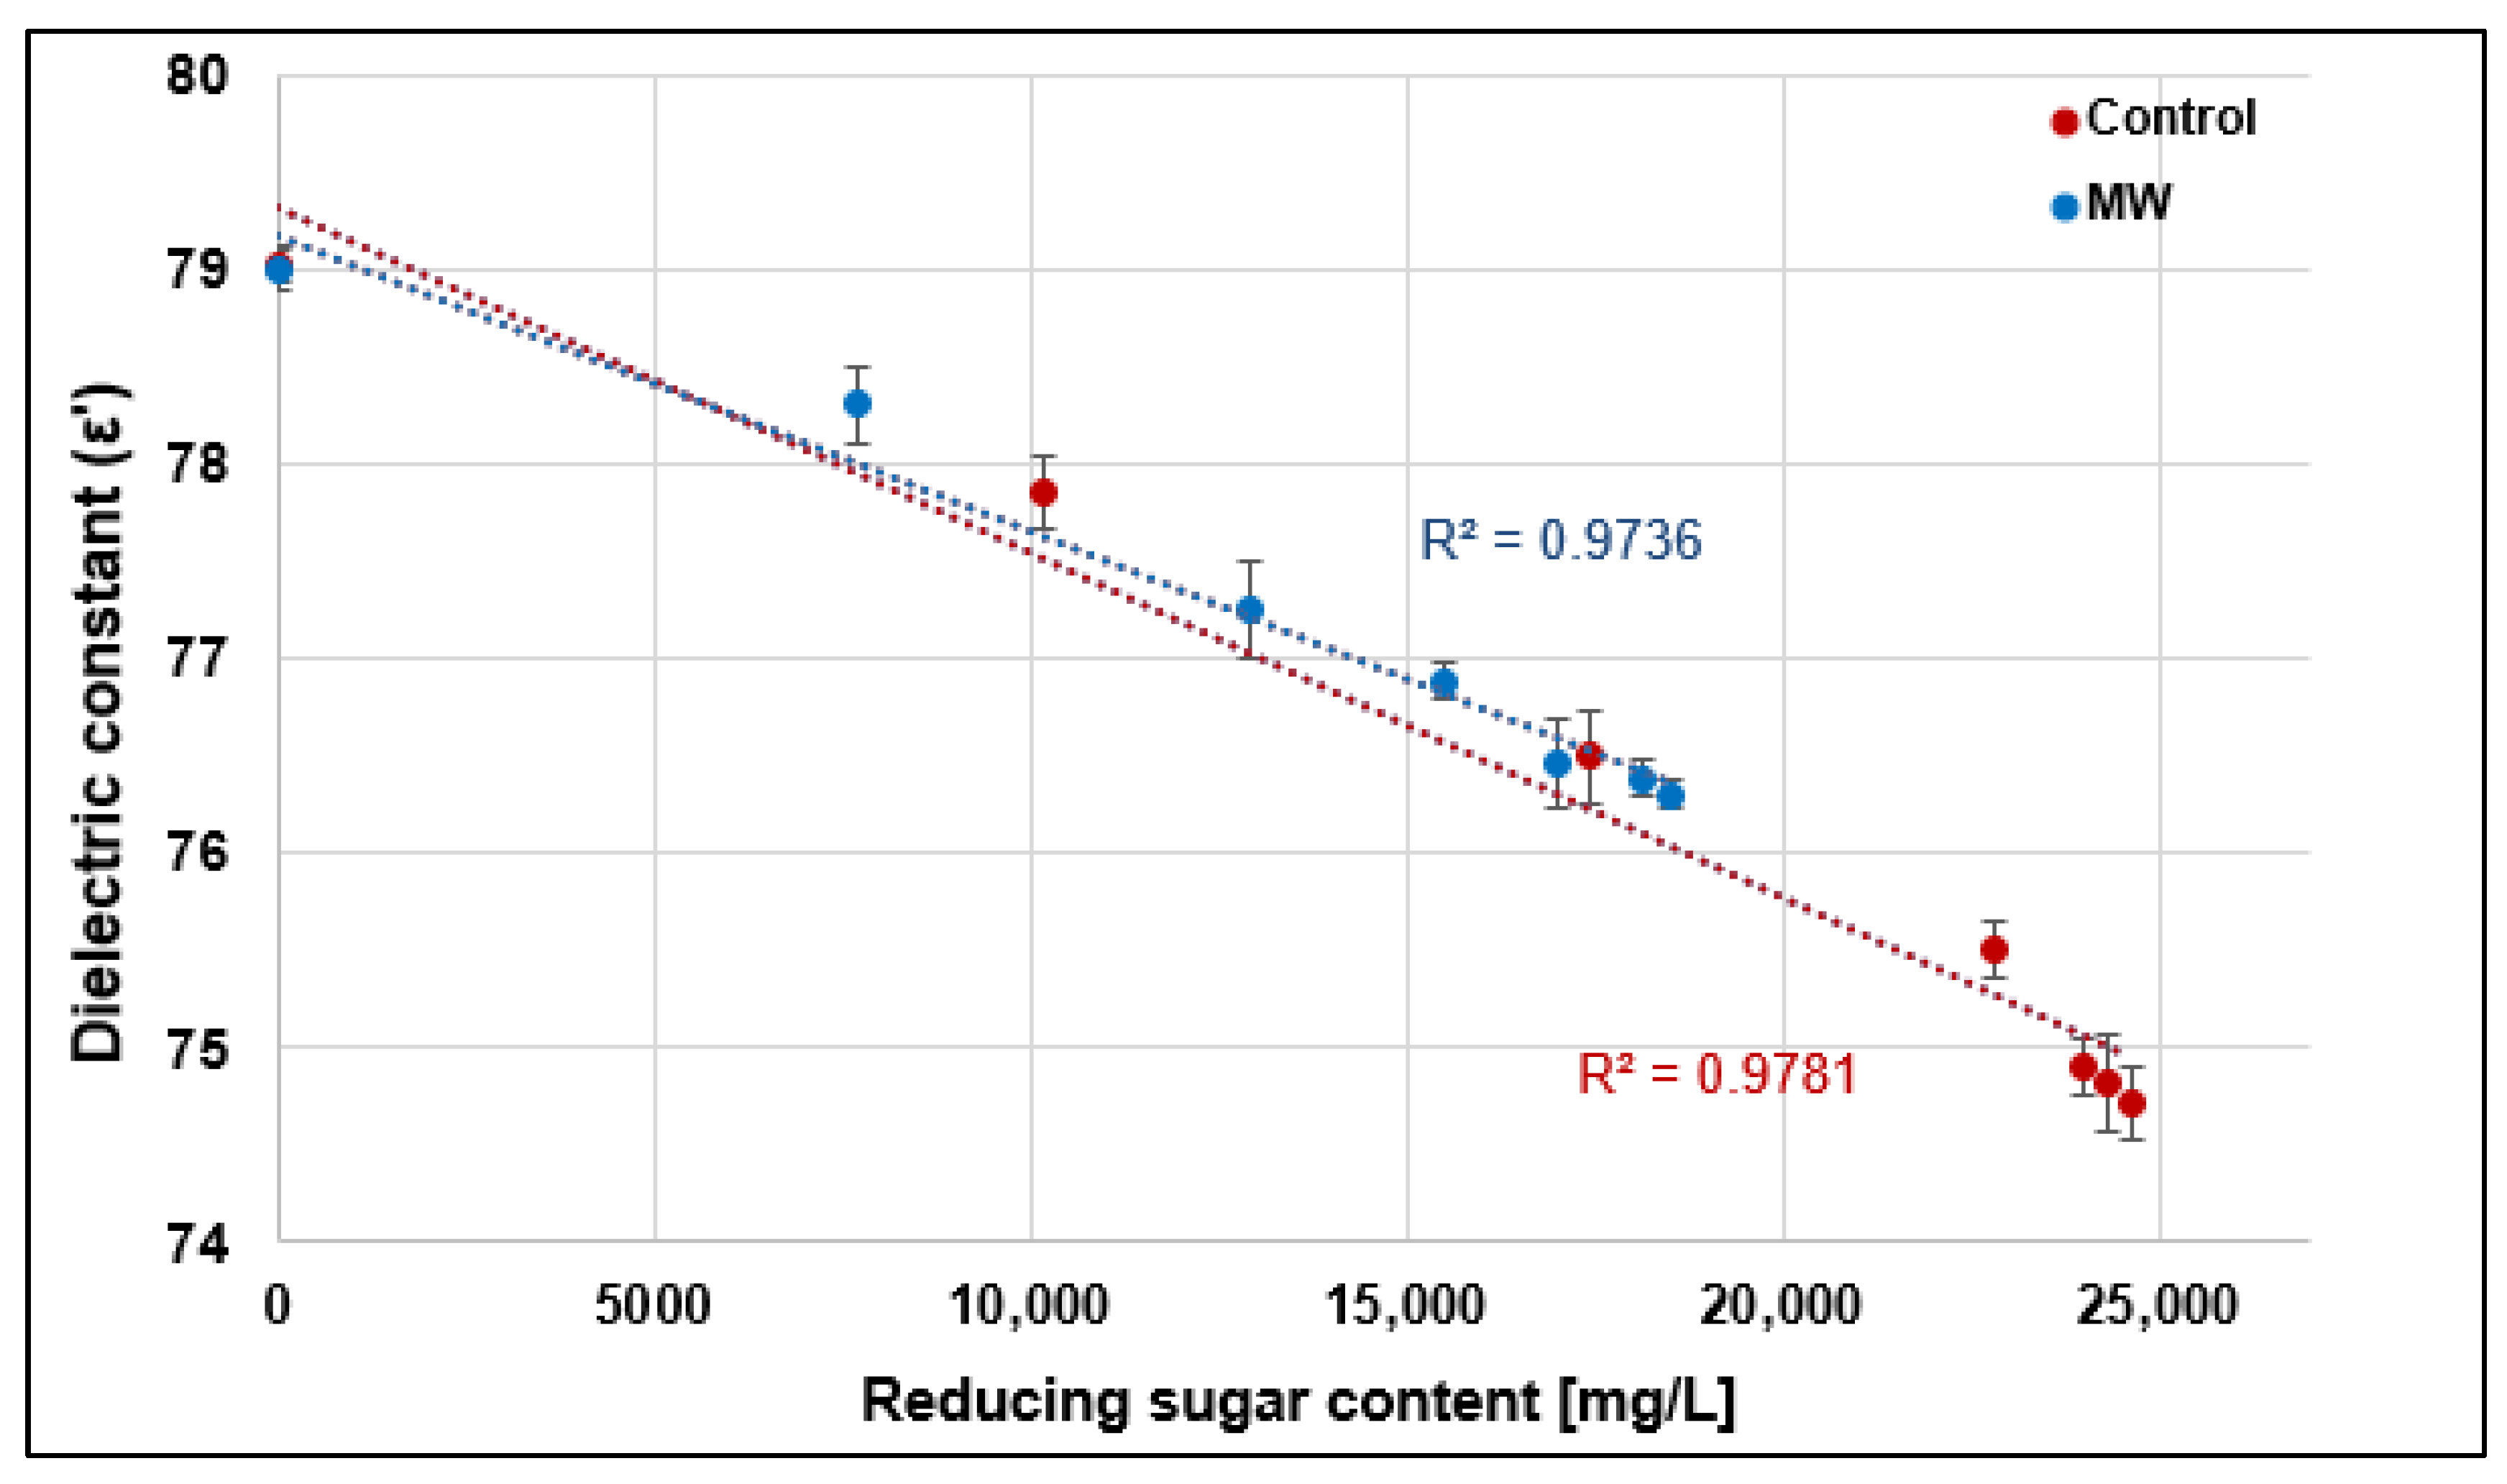
  • The cellulose–monosaccharide conversion can be monitored by measuring the dielectric constant of the hydrolysates. The relationship between the reducing-sugar concentration and the dielectric constant is linear and strong; the coefficient of correlation r was 0.987 for the control and 0.989 for the microwave pre-treated samples, respectively. R2-values suggest that the linear fitting accounts for approximately 98% of the variance observed in the dielectric constant.
  • The microbial bioethanol fermentation of the hydrolysates yielded more in the case of the microwave pre-processed samples; however, the overall conversion efficiency fell short to the controls. The reason behind this is yet to be confirmed; most probably the microwave irradiation led to the formation of certain compounds that can inhibit the microbial metabolism to some extent.
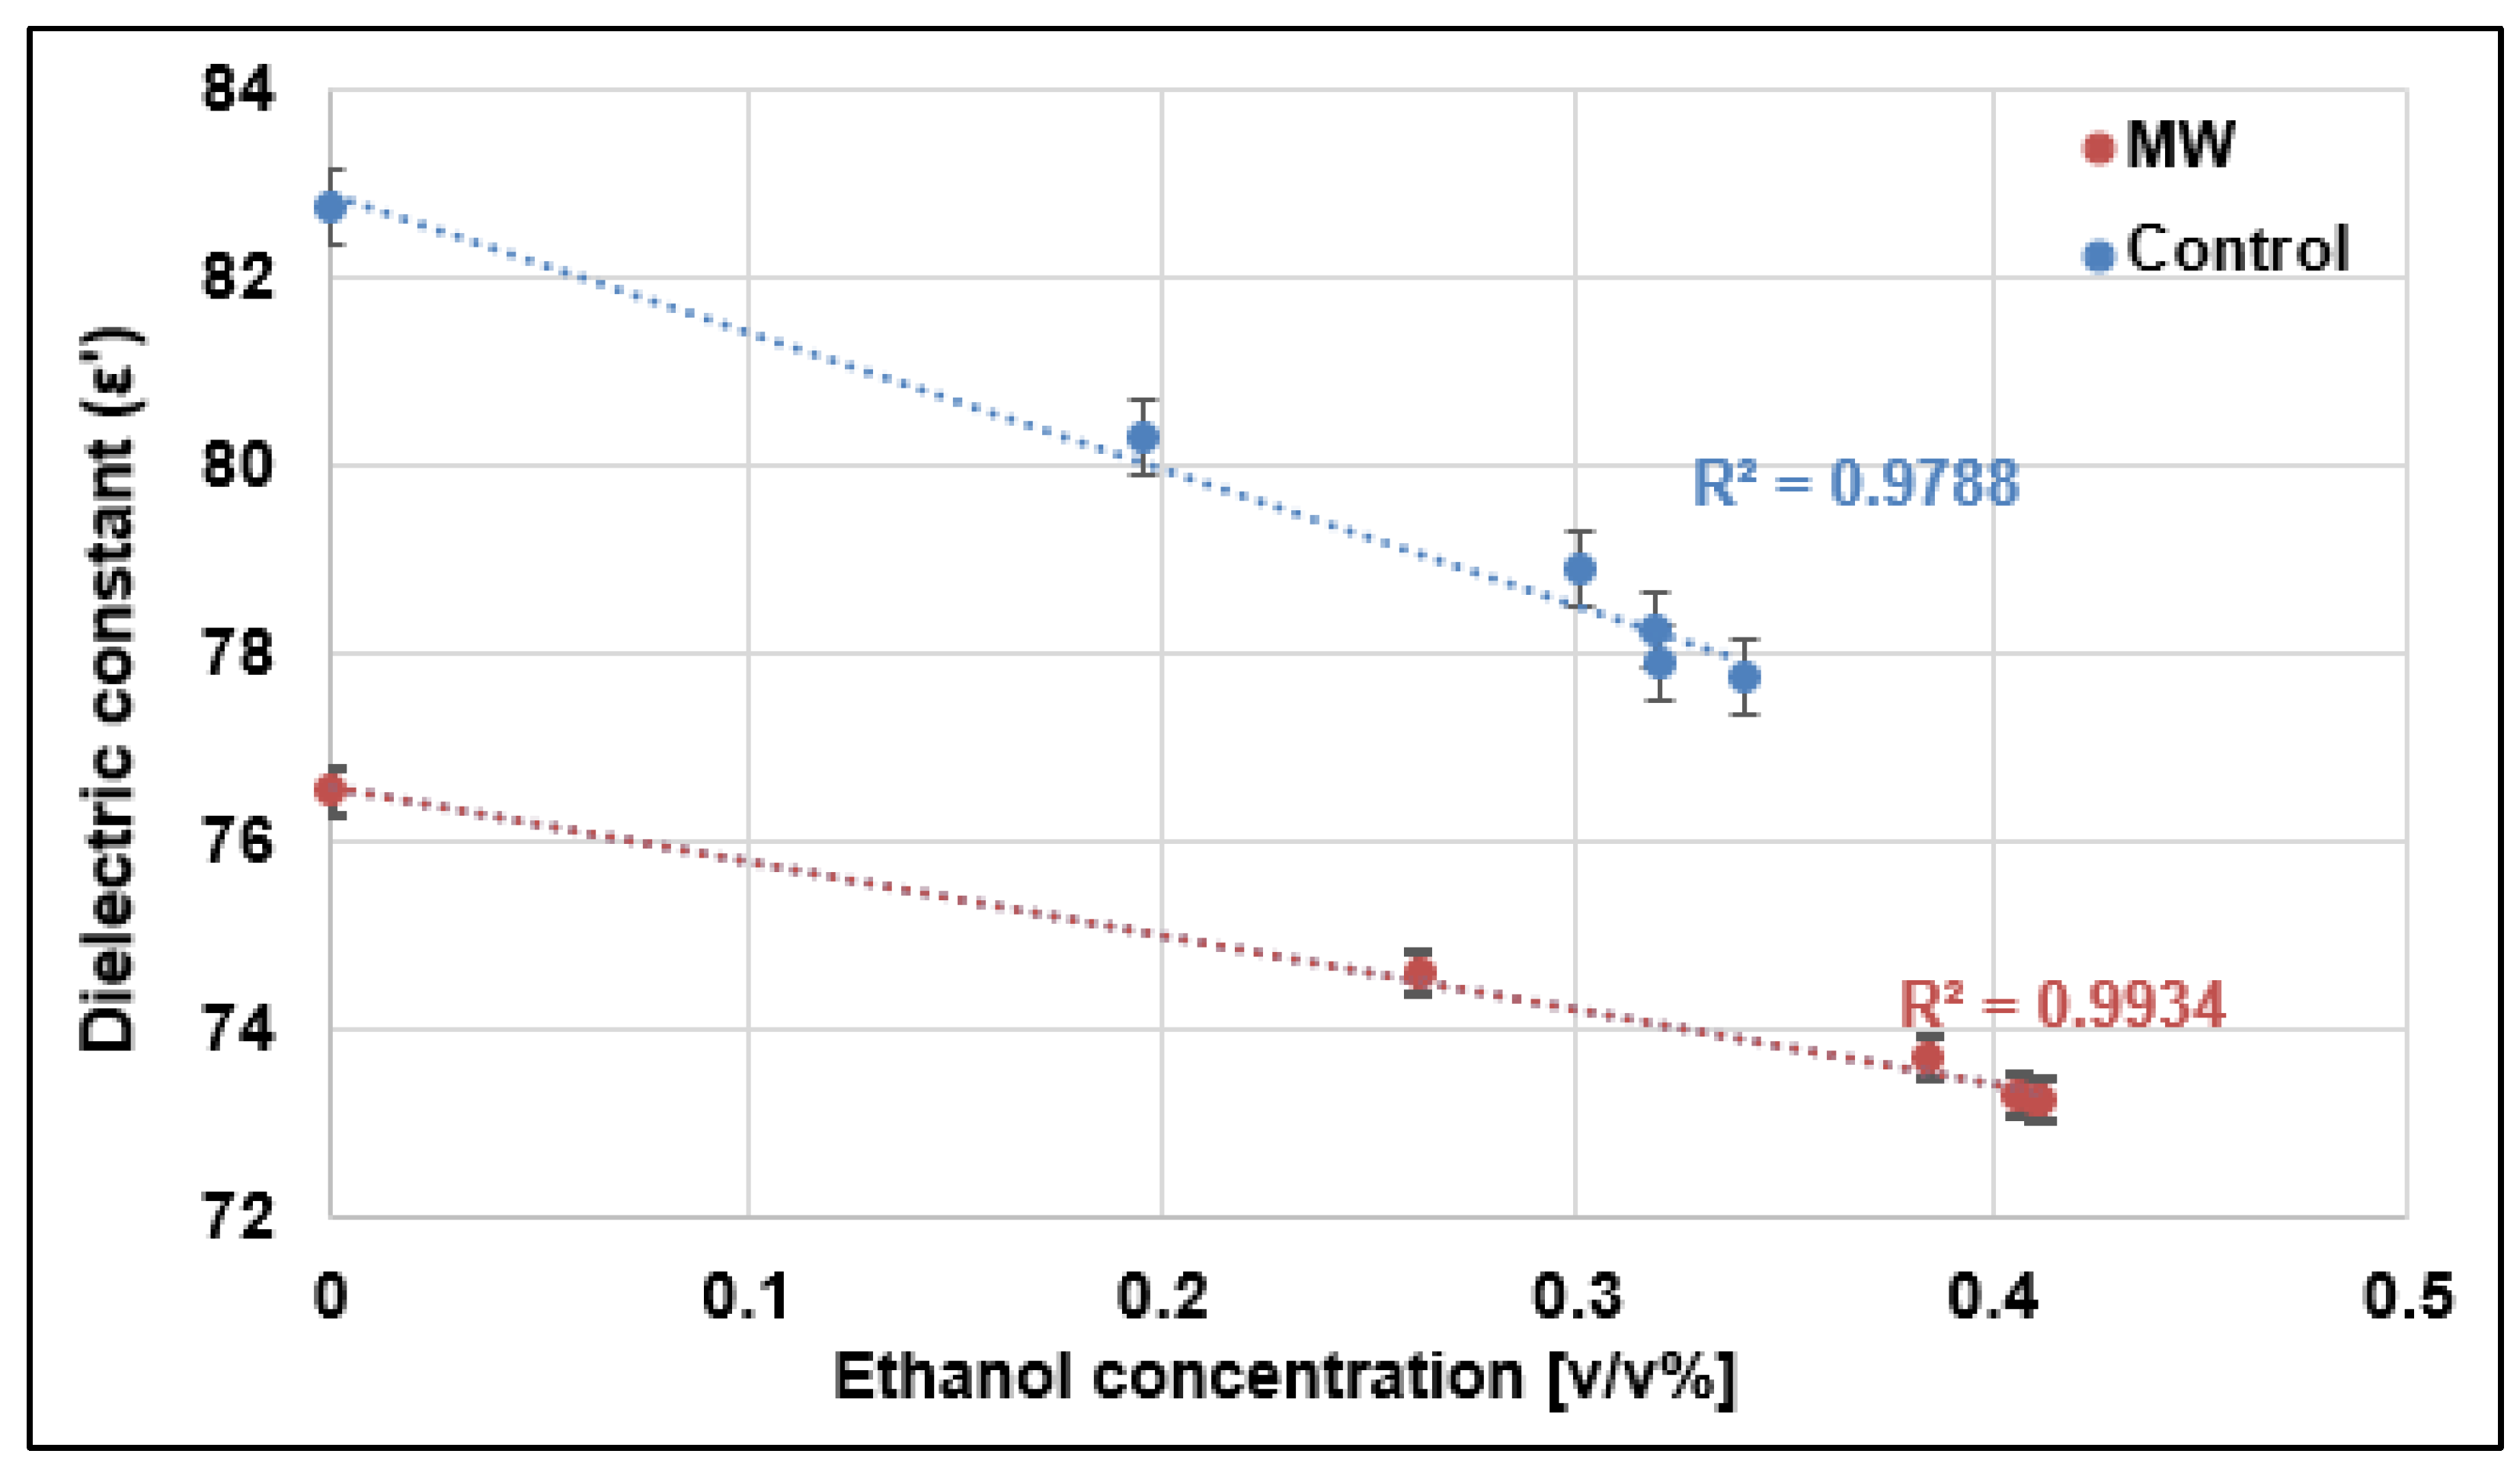
  • As the ethanol fermentation progresses and the ethanol concentration increases, the dielectric constant of the fermentation medium gradually decreases. The correlation between the dielectric constant and the ethanol concentration is strong and linear; the values for the coefficient of correlation r were 0.989 and 0.997 for the control and MW-treated samples, respectively, while the R2-values were 0.979 and 0.993. This indicates that the fermentation part of the SHF process can be also monitored and assessed via dielectric measurements.
  • Although the conversion rate for the MW-treated samples during SHF was higher than that of the controls (i.e., the depletion of recoverable organic compounds), the biogas yield was still higher during the co-fermentation process. This can be explained by the effects of microwave irradiation on the physical structure of the raw material, and its indirect effects regarding the chemical composition of the liquid phase.
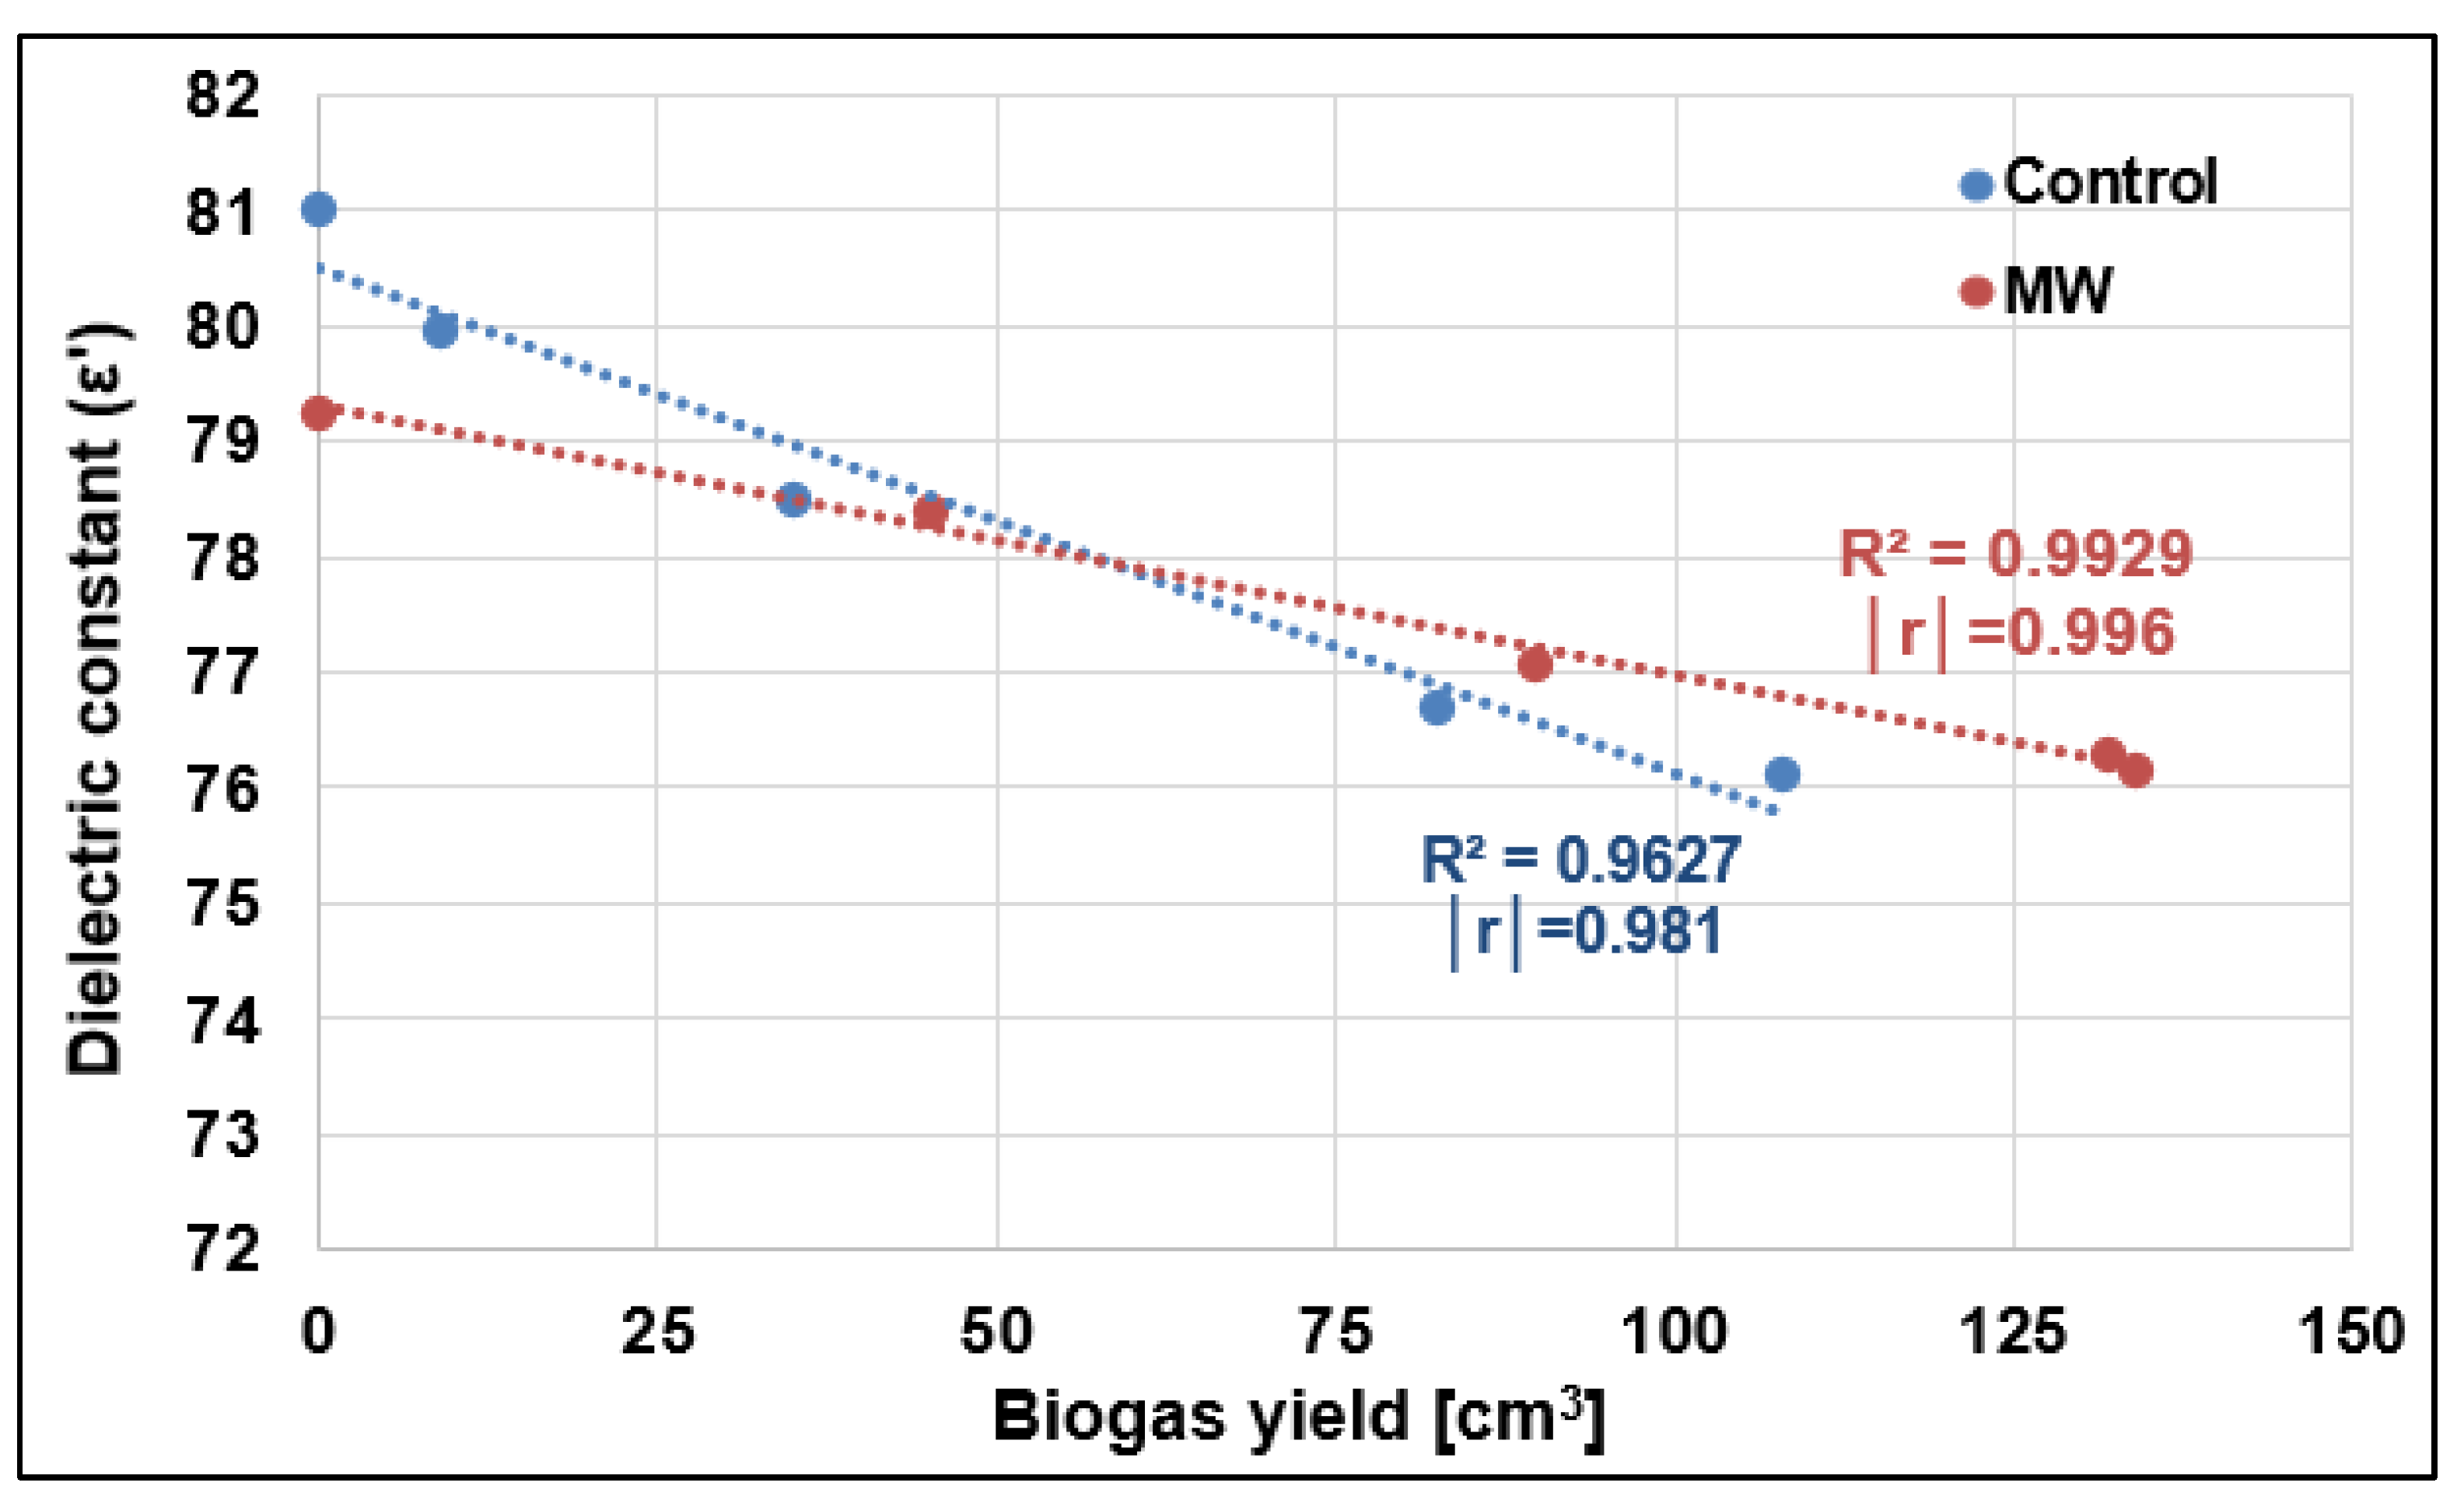
  • Anaerobic digestion can also be monitored by measuring the dielectric constant of the fermentation media, albeit in an indirect way. The r values regarding the correlation between the dielectric constant and the biogas yield were 0.981 and 0.996 for the control and MW-processed samples, respectively. R2 values imply that the linear relationship is strong for both cases (R2 = 0.963 and 0.993).

Author Contributions

Conceptualization: S.B., C.H. and Z.P.J.; methodology: S.B., B.L. and Z.P.J.; formal analysis, S.B.; investigation: Z.P.J., R.D. and B.L.; resources, C.H.; data curation, Z.P.J., S.B.; writing—original draft preparation, Z.P.J.; writing—review and editing, S.B., C.H.; visualization, Z.P.J., R.D. and S.B.; supervision S.B., C.H. All authors have read and agreed to the published version of the manuscript.

Funding

The authors are grateful for the financial support provided by the New National Excellence Program of the Ministry for Culture and Innovation from the source of the National Research, Development and Innovation Fund, under funding numbers UNKP-23-3-SZTE-246, ÚNKP-23-5-SZTE-668, and UNKP-23-2-SZTE-249. This project was supported by Bolyai János Research Scholarship of the Hungarian Academy of Sciences (BO/00161/21/4).

Institutional Review Board Statement

Not applicable.

Informed Consent Statement

Not applicable.

Data Availability Statement

Research data are available on special request.

Conflicts of Interest

The authors declare no conflict of interest.

References

  1. Sherwood, J. The significance of biomass in a circular economy. Bioresour. Technol. 2020, 300, 122755. [Google Scholar] [CrossRef] [PubMed]
  2. Ge, X.; Chang, C.; Zhang, L.; Cui, S.; Luo, X.; Hu, S.; Qin, Y.; Li, Y. Chapter Five–Conversion of Lignocellulosic Biomass Into Platform Chemicals for Biobased Polyurethane Application. In Advances in Bioenergy; Li, Y., Ge, X., Eds.; Elsevier: Amsterdam, The Netherlands, 2018; Volume 3, pp. 161–213. [Google Scholar]
  3. Bar-On, Y.M.; Phillips, R.; Milo, R. The biomass distribution on Earth. Proc. Natl. Acad. Sci. USA 2018, 115, 6506–6511. [Google Scholar] [CrossRef] [PubMed]
  4. Seddiqi, H.; Oliaei, E.; Honarkar, H.; Jin, J.; Geonzon, L.C.; Bacabac, R.G.; Klein-Nulend, J. Cellulose and its derivatives: Towards biomedical applications. Cellulose 2021, 28, 1893–1931. [Google Scholar] [CrossRef]
  5. Ajao, O.; Marinova, M.; Savadogo, O.; Paris, J. Hemicellulose based integrated forest biorefineries: Implementation strategies. Ind. Crops Prod. 2018, 126, 250–260. [Google Scholar] [CrossRef]
  6. Ralph, J.; Lapierre, C.; Boerjan, W. Lignin structure and its engineering. Curr. Opin. Biotechnol. 2019, 56, 240–249. [Google Scholar] [CrossRef]
  7. Wang, H.; Pu, Y.; Ragauskas, A.; Yang, B. From lignin to valuable products–strategies, challenges, and prospects. Bioresour. Technol. 2019, 271, 449–461. [Google Scholar] [CrossRef]
  8. Taylor, M.J.; Alabdrabalameer, H.A.; Skoulou, V. Choosing Physical, Physicochemical and Chemical Methods of Pre-Treating Lignocellulosic Wastes to Repurpose into Solid Fuels. Sustainability 2019, 11, 3604. [Google Scholar] [CrossRef]
  9. Hasanov, I.; Raud, M.; Kikas, T. The Role of Ionic Liquids in the Lignin Separation from Lignocellulosic Biomass. Energies 2020, 13, 4864. [Google Scholar] [CrossRef]
  10. Norrrahim, M.N.F.; Ilyas, R.A.; Nurazzi, N.M.; Rani, M.S.A.; Atikah, M.S.N.; Shazleen, S.S. Chemical pretreatment of lignocellulosic biomass for the production of bioproducts: An overview. Appl. Sci. Eng. Prog. 2021, 14, 588–605. [Google Scholar] [CrossRef]
  11. Wu, Z.; Peng, K.; Zhang, Y.; Wang, M.; Yong, C.; Chen, L.; Qu, P.; Huang, H.; Sun, E.; Pan, M. Lignocellulose dissociation with biological pretreatment towards the biochemical platform: A review. Mater. Today Bio 2022, 16, 100445. [Google Scholar] [CrossRef]
  12. Ab Rasid, N.S.; Shamjuddin, A.; Abdul Rahman, A.Z.; Amin, N.A.S. Recent advances in green pre-treatment methods of lignocellulosic biomass for enhanced biofuel production. J. Clean. Prod. 2021, 321, 129038. [Google Scholar] [CrossRef]
  13. Putro, J.; Edi Soetaredjo, F.; Lin, S.-Y.; Ju, Y.-H.; Ismadji, S. Pretreatment and Conversion of Lignocellulose Biomass into Valuable Chemicals. RSC Adv. 2016, 6, 46834–46852. [Google Scholar] [CrossRef]
  14. Burman, N.W.; Sheridan, C.M.; Harding, K.G. Lignocellulosic bioethanol production from grasses pre-treated with acid mine drainage: Modeling and comparison of SHF and SSF. Bioresour. Technol. Rep. 2019, 7, 100299. [Google Scholar] [CrossRef]
  15. Devos, R.J.B.; Colla, L.M. Simultaneous saccharification and fermentation to obtain bioethanol: A bibliometric and systematic study. Bioresour. Technol. Rep. 2022, 17, 100924. [Google Scholar] [CrossRef]
  16. Hernández Pérez, R.; Salgado Delgado, R.; Olarte Paredes, A.; Salgado Delgado, A.; García Hernández, E.; Medrano Valis, A.; Martínez Candia, F. Comparing Acid and Enzymatic Hydrolysis Methods for Cellulose Nanocrystals (CNCs) Obtention from Agroindustrial Rice Husk Waste. J. Nanotechnol. 2022, 2022, 5882113. [Google Scholar] [CrossRef]
  17. Vasić, K.; Knez, Ž.; Leitgeb, M. Bioethanol Production by Enzymatic Hydrolysis from Different Lignocellulosic Sources. Molecules 2021, 26, 753. [Google Scholar] [CrossRef]
  18. Jákói, Z.; Szabó, A.; Vágvölgyi, A.; Hodúr, C.; Beszédes, S. Applicability of microwave irradiation for enhanced biodegradability of tobacco biomass. Acta Tech. Corviniensis Bull. Eng. 2019, 12, 19–24. [Google Scholar]
  19. Li, H.; Zhao, Z.; Xiouras, C.; Stefanidis, G.D.; Li, X.; Gao, X. Fundamentals and Applications of Microwave Heating to Chemicals Separation Processes. Renew. Sustain. Energy Rev. 2019, 114, 109316. [Google Scholar] [CrossRef]
  20. Kumar, R.; Sahoo, S.; Joanni, E.; Singh, R.K. A Review on the Current Research on Microwave Processing Techniques Applied to Graphene-Based Supercapacitor Electrodes: An Emerging Approach beyond Conventional Heating. J. Energy Chem. 2022, 74, 252–282. [Google Scholar] [CrossRef]
  21. Chen, X.; Yang, J.; Shen, M.; Chen, Y.; Yu, Q.; Xie, J. Structure, Function and Advance Application of Microwave-Treated Polysaccharide: A Review. Trends Food Sci. Technol. 2022, 123, 198–209. [Google Scholar] [CrossRef]
  22. Hermiati, E.; Laksana, R.P.B.; Fatriasari, W.; Kholida, L.N.; Thontowi, A.; Yopi; Arnieyanto, D.R.; Champreda, V.; Watanabe, T. Microwave-Assisted Acid Pretreatment for Enhancing Enzymatic Saccharification of Sugarcane Trash. Biomass Convers. Biorefinery 2020, 12, 3037–3054. [Google Scholar] [CrossRef]
  23. Ríos-González, L.J.; Medina-Morales, M.A.; Rodríguez-De la Garza, J.A.; Romero-Galarza, A.; Medina, D.D.; Morales-Martínez, T.K. Comparison of Dilute Acid Pretreatment of Agave Assisted by Microwave versus Ultrasound to Enhance Enzymatic Hydrolysis. Bioresour. Technol. 2021, 319, 124099. [Google Scholar] [CrossRef] [PubMed]
  24. Özbek, H.N.; Koçak Yanık, D.; Fadıloğlu, S.; Göğüş, F. Effect of Microwave-assisted Alkali Pre-treatment on Fractionation of Pistachio Shell and Enzymatic Hydrolysis of Cellulose-rich Residues. J. Chem. Technol. Biotechnol. 2020, 96, 521–531. [Google Scholar] [CrossRef]
  25. Gazliya, N.; Aparna, K. Microwave-Assisted Alkaline Delignification of Banana Peduncle. J. Nat. Fibers 2019, 18, 664–673. [Google Scholar] [CrossRef]
  26. Hashem, M.; Alamri, S.A.; Asseri, T.A.Y.; Mostafa, Y.S.; Lyberatos, G.; Ntaikou, I. On the Optimization of Fermentation Conditions for Enhanced Bioethanol Yields from Starchy Biowaste via Yeast Co-Cultures. Sustainability 2021, 13, 1890. [Google Scholar] [CrossRef]
  27. Kuittinen, S.; Hietaharju, J.; Kupiainen, L.; Hassan, M.K.; Yang, M.; Kaipiainen, E.; Villa, A.; Kangas, J.; Keinänen, M.; Vepsäläinen, J.; et al. Bioethanol Production from Short Rotation S. schwerinii E. Wolf Is Carbon Neutral with Utilization of Waste-Based Organic Fertilizer and Process Carbon Dioxide Capture. J. Clean. Prod. 2021, 293, 126088. [Google Scholar] [CrossRef]
  28. Kumar, V.; Yadav, S.K.; Kumar, J.; Ahluwalia, V. A Critical Review on Current Strategies and Trends Employed for Removal of Inhibitors and Toxic Materials Generated during Biomass Pretreatment. Bioresour. Technol. 2020, 299, 122633. [Google Scholar] [CrossRef] [PubMed]
  29. Malovanyy, M.; Voytovych, I.; Mukha, O.; Zhuk, V.; Tymchuk, I.; Soloviy, C. Potential of the Co-Digestion of the Sewage Sludge and Plant Biomass on the Example of Lviv WWTP. Ecol. Eng. Environ. Technol. 2022, 23, 107–112. [Google Scholar] [CrossRef] [PubMed]
  30. Kunatsa, T.; Xia, X. A Review on Anaerobic Digestion with Focus on the Role of Biomass Co-Digestion, Modelling and Optimisation on Biogas Production and Enhancement. Bioresour. Technol. 2022, 344, 126311. [Google Scholar] [CrossRef]
  31. Ibro, M.K.; Ancha, V.R.; Lemma, D.B. Impacts of Anaerobic Co-Digestion on Different Influencing Parameters: A Critical Review. Sustainability 2022, 14, 9387. [Google Scholar] [CrossRef]
  32. Budiyono, B.; Matin, H.H.A.; Yasmin, I.Y.; Priogo, I.S. Effect of Pretreatment and C/N Ratio in Anaerobic Digestion on Biogas Production from Coffee Grounds and Rice Husk Mixtures. Int. J. Renew. Energy Dev. 2022, 12, 209–215. [Google Scholar] [CrossRef]
  33. Gerardi, M.H. The Microbiology of Anaerobic Digesters; John Wiley & Sons: Hoboken, NJ, USA, 2003; ISBN 9780471468950. [Google Scholar]
  34. Dareioti, M.A.; Tsigkou, K.; Vavouraki, A.I.; Kornaros, M. Hydrogen and Methane Production from Anaerobic Co-Digestion of Sorghum and Cow Manure: Effect of pH and Hydraulic Retention Time. Fermentation 2022, 8, 304. [Google Scholar] [CrossRef]
  35. Agblevor, F.A.; Murden, A.; Hames, B.R. Improved Method of Analysis of Biomass Sugars Using High-Performance Liquid Chromatography. Biotechnol. Lett. 2004, 26, 1207–1211. [Google Scholar] [CrossRef]
  36. Jørgensen, H.; Kristensen, J.B.; Felby, C. Enzymatic Conversion of Lignocellulose into Fermentable Sugars: Challenges and Opportunities. Biofuels Bioprod. Biorefining 2007, 1, 119–134. [Google Scholar] [CrossRef]
  37. Sills, D.L.; Gossett, J.M. Using FTIR to Predict Saccharification from Enzymatic Hydrolysis of Alkali-Pretreated Biomasses. Biotechnol. Bioeng. 2011, 109, 353–362. [Google Scholar] [CrossRef] [PubMed]
  38. Visvanathan, R.; Houghton, M.J.; Williamson, G. Maltoheptaoside Hydrolysis with Chromatographic Detection and Starch Hydrolysis with Reducing Sugar Analysis: Comparison of Assays Allows Assessment of the Roles of Direct α-Amylase Inhibition and Starch Complexation. Food Chem. 2021, 343, 128423. [Google Scholar] [CrossRef]
  39. Liu, K.; Liu, Q. Enzymatic Determination of Total Starch and Degree of Starch Gelatinization in Various Products. Food Hydrocoll. 2020, 103, 105639. [Google Scholar] [CrossRef]
  40. Vanmarcke, G.; Demeke, M.M.; Foulquié-Moreno, M.R.; Thevelein, J.M. Identification of the Major Fermentation Inhibitors of Recombinant 2G Yeasts in Diverse Lignocellulose Hydrolysates. Biotechnol. Biofuels 2021, 14, 1–15. [Google Scholar] [CrossRef]
  41. Plugatar, Y.; Johnson, J.B.; Timofeev, R.; Korzin, V.; Kazak, A.; Nekhaychuk, D.; Borisova, E.; Rotanov, G. Prediction of Ethanol Content and Total Extract Using Densimetry and Refractometry. Beverages 2023, 9, 31. [Google Scholar] [CrossRef]
  42. Cruz, I.A.; Andrade, L.R.S.; Bharagava, R.N.; Nadda, A.K.; Bilal, M.; Figueiredo, R.T.; Ferreira, L.F.R. An Overview of Process Monitoring for Anaerobic Digestion. Biosyst. Eng. 2021, 207, 106–119. [Google Scholar] [CrossRef]
  43. Lee, M.-K.; Yun, Y.-M.; Kim, D.-H. Enhanced Economic Feasibility of Excess Sludge Treatment: Acid Fermentation with Biogas Production. BMC Energy 2019, 1, 2. [Google Scholar] [CrossRef]
  44. Fares, O.; AL-Oqla, F.M.; Hayajneh, M.T. Dielectric Relaxation of Mediterranean Lignocellulosic Fibers for Sustainable Functional Biomaterials. Mater. Chem. Phys. 2019, 229, 174–182. [Google Scholar] [CrossRef]
  45. Li, K.; Chen, G.; Li, X.; Peng, J.; Ruan, R.; Omran, M.; Chen, J. High-Temperature Dielectric Properties and Pyrolysis Reduction Characteristics of Different Biomass-Pyrolusite Mixtures in Microwave Field. Bioresour. Technol. 2019, 294, 122217. [Google Scholar] [CrossRef] [PubMed]
  46. Jákói, Z.; Hodúr, C.; Beszédes, S. Monitoring the Process of Anaerobic Digestion of Native and Microwave Pre-Treated Sludge by Dielectric and Rheological Measurements. Water 2022, 14, 1294. [Google Scholar] [CrossRef]
  47. Saqib, A.A.N.; Whitney, P.J. Differential Behaviour of the Dinitrosalicylic Acid (DNS) Reagent towards Mono- and Di-Saccharide Sugars. Biomass Bioenergy 2011, 35, 4748–4750. [Google Scholar] [CrossRef]
  48. Cui, J.-Y.; Zhang, N.; Jiang, J.-C. Effects of Microwave-Assisted Liquid Hot Water Pretreatment on Chemical Composition and Structure of Moso Bamboo. Front. Bioeng. Biotechnol. 2022, 9, 821982. [Google Scholar] [CrossRef]
  49. Yang, X.; Li, X.; Liang, J.; Zhu, J. Comparative Study of Effective Pretreatments nt he Structural Disruption and Hydrodepolymerization of Rice Straw. Sustainability 2023, 15, 4728. [Google Scholar] [CrossRef]
  50. Bryant, D.N.; Morris, S.M.; Leemans, D.; Fish, S.A.; Taylor, S.; Carvell, J.; Todd, R.W.; Logan, D.; Lee, M.; Garcia, N.; et al. Modelling real-time simultaneous saccharification and fermentation of lignocellulosic biomass and organic acid accumulation using dielectric spectroscopy. Bioresour. Technol. 2011, 102, 9675–9682. [Google Scholar] [CrossRef]
  51. Mazurkiewicz, J.; Tomasik, P. Effect of external electric field upon charge distribution, energy and dipole moment of selected monosaccharide molecules. Nat. Sci. 2012, 4, 276. [Google Scholar] [CrossRef]
  52. Chakraborty, S.; Das, C.; Saha, R.; Das, A.; Bera, N.K.; Chattopadhyay, D.; Karmakar, A.; Chattopadhyay, D.; Chattopadhyay, S. Investigating the quasi-oscillatory behavior of electrical parameters with the concentration of D-glucose in aqueous solution. J. Electr. Bioimpedance 2015, 6, 10. [Google Scholar] [CrossRef]
  53. Bakam Nguenouho, O.S.; Chevalier, A.; Potelon, B.; Benedicto, J.; Quendo, C. Dielectric characterization and modelling of aqueous solutions involving sodium chloride and sucrose and application to the design of a bi-parameter RF-sensor. Sci. Rep. 2022, 12, 7209. [Google Scholar] [CrossRef]
  54. Thostenson, E.T.; Chou, T.W. Microwave processing: Fundamentals and applications. Compos. Part A Appl. Sci. Manuf. 1999, 30, 1055–1071. [Google Scholar] [CrossRef]
  55. Liao, X.; Raghavan, V.; Meda, V.; Yaylayan, V. Dielectric Properties of Supersaturated α-D-Glucose Aqueous Solutions at 2450 MHz. J. Microw. Power Electromagn. Energy 2001, 36, 131–138. [Google Scholar] [CrossRef]
  56. Chang, Y.H.; Chang, K.S.; Chen, C.Y.; Hsu, C.L.; Chang, T.C.; Jang, H.D. Enhancement of the Efficiency of Bioethanol Production by Saccharomyces cerevisiae via Gradually Batch-Wise and Fed-Batch Increasing the Glucose Concentration. Fermentation 2018, 4, 45. [Google Scholar] [CrossRef]
  57. Ethaib, S.; Omar, R.; Kamal, S.M.; Biak, D.A. Microwave-assisted pretreatment of lignocellulosic biomass: A review. J. Eng. Sci. Technol. 2015, 10, 97–109. [Google Scholar]
  58. Augustine, R.; Raman, S.; Rydberg, A. Relative permittivity measurements of Et-OH and Mt-OH mixtures for calibration standards in 1-15 GHz range. Electron. Lett. 2014, 50, 358–359. [Google Scholar] [CrossRef]
  59. Abidin, Z.; Omar, F.; Radiah, D. Dielectric Characterization of Ethanol and Sugar Aqueous Solutions for Potential Halal Authentication. Int. J. Microw. Opt. Technol. 2014, 9, 39–43. [Google Scholar]
  60. Siddiqui, Z.; Horan, N.J.; Anaman, K. Optimisation of C:N Ratio for Co-Digested Processed Industrial Food Waste and Sewage Sludge Using the BMP Test. Int. J. Chem. React. Eng. 2011, 9, 1–9. [Google Scholar] [CrossRef]
  61. Li, H.; Qu, Y.; Yang, Y.; Chang, S.; Xu, J. Microwave irradiation-A green and efficient way to pretreat biomass. Bioresour. Technol. 2015, 199, 34–41. [Google Scholar] [CrossRef]
  62. Taqi, A.; Farcot, E.; Robinson, J.P.; Binner, E.R. Understanding Microwave Heating in Biomass-Solvent Systems. Chem. Eng. J. 2020, 393, 124741. [Google Scholar] [CrossRef]
  63. Huang, L.; Jin, Y.; Zhou, D.; Liu, L.; Huang, S.; Zhao, Y.; Chen, Y. A Review of the Role of Extracellular Polymeric Substances (EPS) in Wastewater Treatment Systems. Int. J. Environ. Res. Public Health 2022, 19, 12191. [Google Scholar] [CrossRef] [PubMed]
  64. Myszograj, S.; Płuciennik-Koropczuk, E. Thermal Disintegration of Sewage Sludge as a Method of Improving the Biogas Potential. Energies 2023, 16, 559. [Google Scholar] [CrossRef]
Figure 1. (a) Flowchart of the applied methods and measurements. (b) Scheme of the dielectric measurement (from left to right: dielectric assessment software, VNA, dielectric sensor submerged in the sample—not to scale).
Fermentation 09 00902 g001
Figure 2. Production rate of reducing-sugar end products.
Fermentation 09 00902 g002
Figure 3. Changes in dielectric constant throughout the hydrolysis of control samples in terms of frequency (T = 45 °C).
Fermentation 09 00902 g003
Figure 4. Changes in dielectric constant throughout the hydrolysis of MW pre-treated samples in terms of frequency (T = 45 °C).
Fermentation 09 00902 g004
Figure 5. The correlation between the reducing-sugar concentration and the dielectric constant (f = 900 MHz; (T = 45 °C)).
Fermentation 09 00902 g005
Figure 6. Production rate of ethanol during the microbial fermentation (T = 30 °C).
Fermentation 09 00902 g006
Figure 7. Changes in the dielectric constant (T = 30 °C) in terms of frequency throughout the fermentation of (a) the control samples, and (b) the MW-treated samples. For better comprehensibility and comparability, the boundary of the y-axis is the same for both cases.
Fermentation 09 00902 g007
Figure 8. The dielectric constant (f = 900 MHz, (T = 30 °C)) values versus the ethanol concentration on each day of the fermentation.
Fermentation 09 00902 g008
Figure 9. Cumulative biogas production in the co-fermentation of the control and MW pre-processed samples.
Fermentation 09 00902 g009
Figure 10. Changes in the dielectric constant (T = 38 °C) in terms of frequency throughout the anaerobic digestion of (a) control samples, (b) MW-treated samples. For better comprehensibility and comparability, the boundary of the y axis is the same for both cases.
Fermentation 09 00902 g010
Figure 11. The maximum dielectric constant (T = 38 °C) versus the biogas yield on each day of the fermentation.
Fermentation 09 00902 g011
Table 1. Main characteristics of the used corn-cob residues (provided by the producer).
CharacteristicsQuantityUnit of Measurement
Moisture content7 ± 0.1%
Density300 ± 45kg/m3
Cellulose47.1 ± 1.8%
Hemicellulose37 ± 0.7%
Lignin5.2 ± 0.11%
Total carbon (TC)43.5 ± 1.9%
Total nitrogen (TN)0.2 ± 0.002%
Ash1.2 ± 0.08%
Avg. particle size2.4 ± 0.1mm
Table 2. Basic analytical parameters of the meat-industry wastewater sludge.
ParameterValueUnit of Measurement
TS13.9 ± 0.7%
pH6.1 ± 0.2[-]
TCOD798.2 ± 7.2g/L
BOD557.24 ± 2.4g/L
TOC72.6 ± 1.8g/L
TN22 ± 1.5g/L
Disclaimer/Publisher’s Note: The statements, opinions and data contained in all publications are solely those of the individual author(s) and contributor(s) and not of MDPI and/or the editor(s). MDPI and/or the editor(s) disclaim responsibility for any injury to people or property resulting from any ideas, methods, instructions or products referred to in the content.

