Abstract
Sub-moderate temperature (ranging from low to moderate temperature) anaerobic digestion (AD) could balance fermentation efficiency and energy input. We investigated biogas production and the microbial community in wastewater AD at sub-moderate (15 °C, 20 °C, and 25 °C) and moderate (35 °C; control group) temperatures with the organic loading rate (OLR) incrementally increased over 200 days. The impact of temperature on biogas production was found to be minimal at a low OLR but became more significant at a high OLR. Notably, a temperature threshold ranging from 15 °C to 20 °C exerted a strong inhibitory effect on biogas production and disrupted the microbial community. And, SMT-AD is deemed by this study to be the optimal application strategy of wastewater with low temperature and low OLR. Bacterial richness was positively and linearly related to temperature. There is a relevance between methane production and archaeal diversity under the influence of temperature and OLR. Temperature and OLR shaped the ecological function of predominant bacteria. Anaerolineales, Thermotogales, and Lactobacillales were strongly influenced by temperature. Synergistales had a synergistic relationship with Desulfovibrionales. Clostridiales was responsible for acetate and butyrate production and closely related to Lactobacillales. Acetoclastic Methanosaetaceae was the predominant methanogen. Methanogens could survive and maintain their population even though methanogenesis was limited under high OLRs and low temperatures.
1. Introduction
Anaerobic digestion (AD) of organic wastewater could effectuate two goals: obtaining renewable energy in the form of methane and lowering the pollution load [1,2]. Temperature is considered a crucial factor influencing the performance and consistency of a reactor during the process of AD. Microbial-mediated hydrolysis, acidogenesis, acetogenesis, and methanogenesis in AD are temperature-dependent biological processes [3,4,5]. Specially, the production of volatile fatty acids (VFAs) in acidogenesis is influenced by temperature, and higher temperatures can induce system instability through the accumulation of VFAs and a decrease in pH [6]. And, temperature also governs the concentration of free ammonia nitrogen (FAN), and higher temperatures favor the production of FAN, which hinders methane production [7]. The suitability of mesophilic temperature (30–37 °C) for these four processes has extensively investigated. Therefore, moderate temperature AD (MT-AD) has been widely employed for wastewater treatment [8]. The properties of the microbial communities in MT-AD of wastewater have been largely revealed through studies on hydraulic retention time (HRT) [9,10], organic loading [11,12], bioreactor configuration [13,14], etc. Compared with a moderate temperature, the psychrophilic temperature (<20 °C) [15,16] is relatively less suitable for microbial growth and metabolism in anaerobic digestion. However, low-temperature anaerobic digestion (LT-AD) requires considerably less energy input than mesophilic AD and has become a research focus. Especially, the treatment of low strength wastewater and low-temperature industrial effluent using LT-AD [17] has been demonstrated in the laboratory and at the pilot scale. The acclimation of microbiomes to low temperature [18,19] and properties of psychrotrophs have been frequently studied [20,21]. Many studies have also compared the performance of low- and moderate-temperature AD [22]. The feasibility of long-term continuous LT-AD treatment of long-chain fatty acid (LCFA)-containing wastewater using acclimated biomass has been reported, with Methanocorpusculum playing a crucial role in LCFA degradation during both psychrophilic and mesophilic treatments [23]. It was observed by Hui Y et al. [22] that the initial inhibition of methane production was observed in LT-AD under antibiotic stress (e.g., oxytetracycline); however, it was later stimulated at 35 °C; and in comparison to MT-AD, the dominant acetoclastic methanogens Methanosaeta gradually declined and were replaced by methylotrophic Methanomethylovorans in LT-AD. Additionally, Estefanny QC et al. [24] reported that the microbial diversity decreased with successful adaptation to increasing total ammonia nitrogen in LT-AD, while the microbial community exhibited increased diversity under mesophilic conditions despite ammonia inhibition. Moreover, Methanocorpusculum emerged as a resilient hydrogenotrophic methanogen at high ammoniacal concentrations under psychrophilic conditions, and Methanosarcina was found in both low and high ammoniacal concentrations in mesophilic conditions. However, the effects of temperatures ranging from low to moderate (i.e., sub-moderate temperature, SMT) on both microbial community structure and biogas production during AD treatment of wastewater are not well known. SMT-AD possesses the efficiency of MT-AD and the energy-saving quality of LT-AD for wastewater treatment, and research on this topic is important for promoting its application. In addition, microbial production is also dependent on the organic loading rate (OLR) of wastewater, which determines the quantity of organic carbon, organic nitrogen, and trace elements essential for microbial growth [25]. Particularly, high or low OLR can influence the balance between hydrolysis and acidogenesis of microbiome [26], but little is known about the combined effects of sub-moderate temperature and OLR on biogas production and microbial community succession.
In this study, we investigated the biogas production and microbial community structure in anaerobic fixed-bed reactors (AFBRs) operated over a range of sub-moderate temperatures (15 °C, 20 °C, and 25 °C), with the control group of 35 °C. The OLR in all reactors was gradually increased with artificial molasses wastewater. Illumina amplicon sequencing and real-time PCR were used to reveal the microbial community diversity and structure and the ecological roles of microbial groups under different temperatures.
2. Materials and Methods
2.1. Feedstock and Inoculum
The artificial wastewater consisted of 10% molasses (sag:70%; brix:45%), 0.8% commercial cat food (as N and P source; Whiskas, Beijing, China), and tap water. The ratio of COD:N:P was maintained at 300–500:5:1 to supply microorganisms with adequate N and P, and pH was maintained at 7.0 ± 0.2 with 5 mol/L NaOH.
The seed sludge consisting of mesophilic (30 °C–35 °C) granular sludge was obtained from a full-scale treatment plant for Coca Cola production wastewater (Tianjin, China). The total solid (TS) and volatile solid (VS) contents of the inoculated sludge were 35.21% and 7.23%, respectively. Initially, 4 L of seed sludge and 6 L of tap water were added to each reactor.
2.2. Anaerobic Fixed-Bed Reactors
Bioreactors were constructed with 10 mm thick synthetic glass (height-to-diameter ratio of 9:4). Six cylindrical active carbon fiber blocks (bundled with stainless steel; 5.5 cm inside diameter; 30 cm height; 2 mm thick; Japan Carbon Company, Tokyo, Japan) were added as microbial carriers. The effective volume was 10 L. Wastewater was pumped into the bottom of the reactors at a rate of 4.3 L/h using a peristaltic pump (BT100-2J/DG-2; Baoding Longer Precision Pump Co., Ltd., Baoding, China); effluent was simultaneously discharged from the top. Biogas volume was measured using a wet-type gas flow meter (rated flow 0.2 m3/h; precision grade ±1%; Changchun Filter Co., Ltd., Changchun, China).
2.3. Experimental Procedure
The temperatures of three anaerobic fixed-bed reactors (AFBRs) were set to 15 °C, 20 °C, and 25 °C (R15, R20, and R25, respectively), and a moderate temperature control was set to 35 °C (R35). The AFBRs were incubated in separate biochemical incubators (Model MIR 254, Sanyo, Japan) for 200 days. The AFBRs were run in a semi-continuous operation with a hydraulic retention time (HRT) of 3 days. The initial organic loading rate (OLR) was 3.3 kg (COD)/m3·d; every 15 days (5 HRTs), the OLR was increased by 1.65 kg (COD)/m3·d. The temperature of the influent was adjusted to match that of the corresponding AFBR before feeding. One seed sample and twenty microbial samples from the earlier, middle, and later stages of OLR promotion were collected from all AFBRs for microbial analysis.
2.4. Sampling
Microbial samples were taken from multiple locations in each reactor before the OLR was increased (every 15 days). A hanging sampler, constructed from a 3×3 cm piece of active carbon fiber, was hung from the top, middle, and bottom of the fiber carrier and used to collect samples within the reactors. Additional samples were taken from sludge deposited at the bottom of the reactors. About 20 g of sludge was collected and stored in a −30 °C freezer. Effluent samples were taken during each charge/discharge event and stored in a −30 °C freezer.
2.5. Microbial Analysis
2.5.1. High-Throughput Sequencing
Total DNA was extracted from a 0.5 g sludge sample using an E.Z.N.A.® soil DNA Kit (Omega Bio-tek, Norcross, GA, USA). The exacted products were determined through electrophoresis of agarose gel (1% weight/volume agarose) after ethidium bromide dye. The quality of DNA was assessed by spectrophotometry absorbance at wavelengths of 230, 260, and 280 nm (ratios of absorbance at 260/280 nm > 1.8 and 260/230 nm > 1.7) detected by UVmini-1240 Spectrophotometer (SHIMADZU CORP.).
For bacteria and archaea, the V3-V4 hypervariable region of 16S rRNA genes was amplified with the bacteria primer pair 338F (5′-ACTCCTACGGGAG GCAGCAG-3′) and 806R (5′-GGACTACHVGGGTWTCTAAT-3′); the archaea primer pair 344F (5′-ACGGGGYGCAGCAGGCGCGA-3′) and 806R (5′-GGACTAC VSGGGTATCTAAT-3′), combined with the Illumina adapters; and a barcode sequences on the reverse primers. The amplification was performed in a mixture with a volume of 50 μL, which contained 30 ng of template DNA, 2 μL of 10 uM forward and reverse primers, 0.3 μL of Pyrobest DNA Polymerase (2.5 U/μL, TaKaRa, Code: DR005A), 5 μL of 10 ×Pyrobest Buffer, and 4 μL of 2.5 mM dNTPs. The amplification procedure was performed as follows: initial denaturation at 95 °C for 5 min; 30 cycles of denaturation at 95 °C for 45 s, primer annealing at 55 °C for 50 s, and extension at 72 °C for 45 s, followed by a final extension period of 10 min at 72 °C. Three replicated amplifications for each sample were analyzed independently and mixed after PCR amplification to minimize the impact of potential biases from amplification.
The three amplicon replicates of each sample were equally combined for MiSeq sequencing. Firstly, the pooled amplicon products were purified using an AxyPrep DNA Gel Extraction Kit (Axygen Biosciences, Union City, CA, USA) according to the manufacturer’s protocol after extraction from 2% agarose gels. Then, the amplicons were quantified by QuantiFluor™ -ST (Promega, Madison, WI, USA), and next, PCR amplicon libraries were built according to the MiSeq Reagent Kit Preparation Guide. Ultimately, the combined sample libraries were paired-end (2 × 300) sequenced in the process of cluster generation and sequencing by synthesis on the Illumina MiSeq platform (Illumina, SanDiego, CA, USA).
According to primer barcodes, the measured reads were assigned to different samples with a maximum of one mismatch allowed. Unqualified bases in terminal sequences were removed with the Trimmomatic trimmer (threshold = 50 bp; QC < 20). Unqualified paired-end reads were filtered out (Q20 ≥ 90%) using Readfq (version 6.0). High-quality paired-end reads were assembled to raw tags based on overlapping sequences between them using FLASH (version 1.2.10) with a mismatch of 0.1 allowed. Raw tags with a length less than 200 bp and a maxhomop greater than 10 were removed using Mothur (primer mismatch of up 2 allowed). Chimeric-free clean tags were obtained from Usearch (version 8.0.1623). High-quality tags were clustered into Operational Taxonomic Units (OTUs) with 97% similarity using QIIME (version 1.8.0), and ‘singletons’ (OTUs observed less than 2 times) caused by sequencing errors were removed (11,376 bacterial OTUs obtained from 21 samples; 1137 archaeal OTUs obtained from 9 samples). OTUs representing sequences were divided into multiple taxonomic levels (Phylum, Class, Order, Family, Genus) using the Ribosomal Database Project (RDP) classifier and the Silva database (Release 11.5 http://www.arb-silva.de (accessed on 30 September 2016)) with a minimum confidence of 50%. Rarefaction curves were drawn using R (version 3.1.1). Diversity was assessed with the Hill number, and differences between samples were assessed using QIIME (version 1.8.0). Redundancy Analysis (RDA) for species and environmental factors was conducted using CANOCO (version 4.5).
2.5.2. Assessment of Microbial Biodiversity with Hill Number
An average of 23,767 ± 8688 (bacteria) and 51,586 ± 15,965 (archaea) high-quality reads per sample were obtained, which were suitable for estimating microbial community diversity of samples, as indicated by rarefaction curves that approached saturation (Supplementary Figure S2). Likewise, the number of OTUs (1868 ± 645 and 370 ± 248 per sample for bacteria and archaea, excluding singletons) was adequate for data processing.
Biodiversity is believed to largely influence the functional roles of ecological communities and can be used to evaluate the robustness of AD, which could be an engineering ecosystem [27]. Sample data cannot completely describe the microbial community of a reactor but can be used to mathematically estimate diversity [28]. We used the Hill number to represent microbial diversity. The Hill number [29,30] accounts for species richness as well as the evenness of community structure using the Simpson and Shannon indices. And, this index is comprehensive and relevant for biological interpretation [31].The Hill number was calculated based on OTUs from 16S rDNA and used to characterize microbial diversity in the reactors. The formula is as follows:
where ε is the ‘order’ of diversity, which indicates sensitivity to species frequencies; εN is the diversity of the sample; S is the number of species sampled; and Pi is the relative abundance of the i species. For ε = 0, 0N is equal to S, representing species richness. 1N is equivalent to , i.e., exp (Shannon’s entropy), and 2N is , which corresponds to 1/Simpson’s index. Therefore, the Hill number combines three common measures of microbial diversity.
2.5.3. Quantitative Real-Time PCR (Q-PCR) of Methanogens
Quantitative PCR was conducted with an ABI 7500 Q-PCR system (Model 7500, Applied Biosystems, Waltham, MA, USA) using a TaqMan hydrolysis probe. The primer sets, 5′-nuclease TaqMan probes, and preparation of standard methanogen DNA described by Yuan et al., 2012 [32], were used as follows: MBT (Methanobacteriales; MBT857F, MBT929F, MBT1196R; amplicon size: 343 bp); MMB (Methanomicrobiales; MMB282F, MMB749F, MMB832R; amplicon size: 506 bp); Msc (Methanosarcinaceae; Msc380 F, Msc492F, Msc828R; amplicon size: 408 bp); and Mst (Methanosaetaceae; Mst702F, Mst753F, Mst862R;amplicon size: 164 bp). The TaqMan probes were labeled with FAM (reporter) and BHQ-1 (quencher). A Q-PCR mixture of 20 μL was prepared using the 2× Taq-Man Universal PCR Master mix from Applied Biosystems, USA: 5 μL of PCR-grade water, 1 μL of each primer (final concentration, 10 μM), 2 μL of the TaqMan probe (final concentration,1 μM), 10 μL of 2× reaction solution, and 1 μL of template DNA. The two-step amplification protocol was performed as follows: denaturation for 10 min at a temperature of 94 °C, followed by cycling through a total of forty cycles consisting of a ten-second denaturation step at a temperature of 94 °C and combined annealing and extension for thirty seconds at a temperature of 60 °C (63 °C was used only for primer set MMB). Standard curve construction for methanogens was carried out following the methods reported by Zhang et al. in 2018 [33].
2.6. Analysis of Volatile Fatty Acids (VFAs), CH4, and COD
High-performance liquid chromatography (LCMS-2020; Shimadzu, Tokyo, Japan) was used to measure the concentrations of formic, acetic, propionic, and butyric acids. Effluent samples were centrifuged at 13,000× g, and the supernatant was mixed with the same volume of acetonitrile to stabilize the VFAs. Samples were then filtered through a 0.22 µm polyamide membrane filter. VFAs were separated by a resin-based column (Aminex® HPX-87H; 300 × 7.8 mm; Bio-Rad Laboratories, Hercules, CA, USA) with 0.05 M H2SO4 (pH = 2.2) as the mobile phase (flow rate = 0.6 mL/min), and VFA concentration was measured using an ultraviolet absorption detector. The column oven and injection temperatures were set to 40 °C and 90 °C, respectively. The column pressure was 6.3 MPa, and the injection volume was 10 µL.
CH4 concentration was determined using a biogas analyzer (Model ADG, Landtec, Dexter, MI, USA). The COD of the influent and the effluent was measured using a water quality analyzer (Lovibond 99731COD, Dortmund, Germany) with potassium dichromate as the oxidant.
2.7. Statistical Methods
A Pearson’s correlation analysis was used to reveal the linear dependence between microbial diversity and sample parameters. The significance of Pearson’s correlation coefficients was inferred based on Student’s t-distribution (degrees of freedom = n − 2). ANOVA was used to determine the differences between sample means. All analyses were conducted using SPSS version 19.0 (SPSS Inc., Chicago, IL, USA). The biogas production at each organic loading rate (OLR) was determined using Pearson’s empirical method.
3. Results and Discussion
3.1. Effect of Temperature and OLR on Biogas Production
As depicted in Figure 1, when the OLR increased from 3.3 kg (COD)/m3·d to 14.85 kg (COD)/m3·d at 15 °C, the biogas production of R15 exhibited an increase from 10.6 L/d to a maximum of 32.7 L/d, and with further increases in OLR, the biogas output gradually decreased to 13.1 L/d under the OLR of 26.4 kg (COD)/m3·d. At 20 °C, when OLR increased to 19.8 kg (COD)/3·d, the biogas production of R20 exhibited a transition from 10.7 L/d to a peak 58.9 L/d, and subsequently maintained this level despite further OLR increments. Subsequently, during the process where OLR gradually rose to 21.5 kg (COD)/m3·d, the biogas production for R25 also experienced an increase from 10.7 L/d to another maximum value of 71.1 L/d under 25 °C. In the control group at 35 °C, as the OLR increased from 3.3 kg (COD)/m3·d to 21.5 kg (COD)/m3·d, the gas production exhibited a significant increase from 13.3 L/d to 113.1 L/d, reaching a plateau thereafter with no further changes observed in response to OLR variations. The biogas yields of LT-AD, SMT-AD, and SMT-AD were comparable at low OLRs. However, at high OLRs, where the biogas yields reached their maximum, the biogas production was significantly higher by factors of 2.1, 4.5, 5.6, and 7.5 compared with that at low OLRs for temperatures of 15 °C, 20 °C, 25 °C, and 35 °C, respectively. Additionally, the production of LT-AD biogas experienced a significant decrease after reaching its maximum due to the impact of the increased OLR. Conversely, both SMT-AD and MT-AD exhibited a consistent and unaltered peak biogas output despite the increase in OLR, demonstrating a similar pattern.
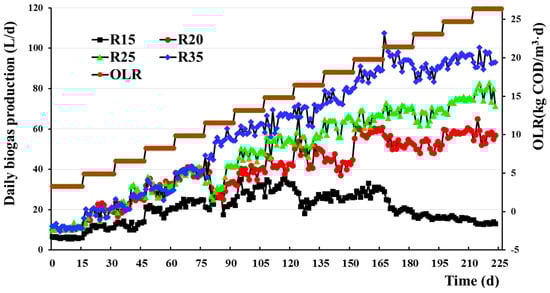
Figure 1.
Effects of temperature and organic loading rate (OLR) on biogas production. R15, R20, R25, and R35 represent reactors set at temperatures of 15 °C, 20 °C, 25 °C, and 35 °C, respectively. The OLR in all reactors was incrementally increased from 3.3 kg (COD)/m3·d to 26.4 kg (COD)/m3·d, and each level was maintained for 15 d (5 HRTs).
The biogas production was not significantly affected by a temperature difference of 5 °C between R20 and R25, when operating at OLRs below 11.55 kg (COD)/m3·d (p > 0.05; 95% confidence, Figure 1); however, when compared with the moderate temperature reactor R35, a decrease in biogas production of 16% was observed in both R20 and R25 with reductions of 10 °C and 15 °C, respectively (Figure 1). When the OLR exceeded 11.55 kg (COD)/m3·d, biogas production in R20 and R25 significantly differed (p < 0.01; 95% confidence) and were 38.2% and 22.4% lower than that in 35 °C, respectively (Figure 1). It could be seen that when the OLR was low, the effect of temperature on biogas production was small; when OLR increased, the temperature showed a stronger effect on biogas production. Biogas production in 15 °C decreased by 40.8% and 51.8% under low (less than 11.55 kg (COD)/m3·d) and high (exceeding 11.55 kg (COD)/m3·d) OLRs, respectively, compared with that in 20 °C. This decrease was by much more than the decrease in production in 20 °C compared with that in 25 °C (0% and 25.6% under low and high OLRs, respectively). And, a similar result can be obtained from the change in removal rate of COD following the promotion of OLR (Figure 2). Therefore, it is probable that a temperature threshold existed between 15 °C and 20 °C, below which the point microbial metabolic output is strongly restrained.
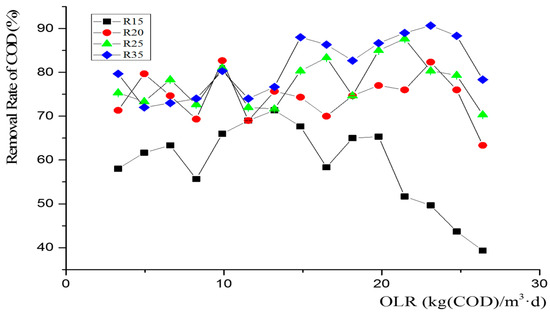
Figure 2.
The change in removal rate of COD along with the promotion of OLR. Error bars represent removal rate of COD standard deviations of triplicate measurements.
The above results show that the OLR and temperature had a significant interactive effect on biogas production. In addition, Q10 can be further utilized to elucidate the interplay between temperature and OLR. Q10 represents the van’t Hoff temperature coefficient, denoting the magnitude of change in biochemical reaction rate with a 10 °C increase in temperature. In most biochemical reactions, Q10 tends to approach 2.0 and is consistently greater than 1.0, exhibiting a correlation with both temperature and substrate concentration [34]. The production rate of biogas closely approximates the rate of chemical reaction. Under conditions where the OLR does not impede microbial metabolism production, the approximate Q10 value for R20 relative to R15 reaches 1.8 at the OLR of 5.0 kg (COD)/m3·d, while the Q10 of R25 relative to R15 reaches 1.7 at the same OLR level. Both R20 and R25 exhibit a Q10 close to 2 under identical OLR conditions. The Q10 of R35 (relative to R25) reaches 1.9 at the OLR of 11.55 kg (COD)/m3·d, approaching a value close to 2. The results indicate that SMT-AD achieves a normal Q10 at a lower OLR, whereas MT-AD requires achieving it at a higher OLR. This observation suggests that SMT-AD exhibits greater sensitivity to changes in the organic loading rate compared with medium temperature anaerobic fermentation. Therefore, biogas production during AD is the result from the synergistic effect of temperature and the OLR on microbial communities.
3.2. Effect of Temperature and OLR on COD Removal and VFA Accumulation
The rates of chemical oxygen demand (COD) removal for R15, R20, R25, and R35 at an OLR ranging from 3.3 to 11.55 kg (COD)/m3·d are 60.9%, 75.5%, 76.1%, and 77.5%, respectively. Notably, the COD removal rate during anaerobic fermentation at the low temperature of 15 °C was significantly lower compared with that at other temperatures; however, there were no significant differences (p > 0.05; 95% confidence, Figure 2) observed among SMT-AD(R20, R25) and MT-AD(R35) in terms of the COD removal rate, which is consistent with the biogas production changes under low OLRs; as the OLR exceeds 11.55 kg COD/m3·d, the disparities in COD removal rates among the three groups gradually escalate. From 11.55 kg (COD)/m3·d to 26.4 kg (COD)/m3·d, R15, R20, R25, and R35 exhibit removal rates of 58.1%, 73.8%, 78.4%, and 84%, respectively, with a tendency for removal rates to be positively correlated with temperature, and the COD removal of R20 and R25 in SMT-AD exhibits a similarity. Moreover, the disparity in the COD removal rate between R20 and R25 is significantly lower than that between R20 and R15, which also aligns with the variations observed in biogas production across the reactors (Figure 2).
The accumulation of volatile fatty acids (VFAs) increased proportionally with the applied OLR in all reactors. Apart from a noticeable decrease in pH of R15, no signs of rancidity were observed in the other three reactors (Figure S1), indicating their sustained high COD removal efficiency during the late stage. The predominant organic acids that accumulated in the four reactors were primarily acetic acid and lactic acid. As the temperature increased, a decrease in the accumulation of organic acids was observed, potentially attributed to enhanced efficiency in their conversion into methane at higher temperatures. In the R15 and R20 reactors, the accumulation of butyric acid was observed in the later stages; however, in the late stages of the R25 and R35 reactions, there was a reduced accumulation of butyric acid (Figure 3). The presence of accumulated butyric acid hindered microbial methanogenesis metabolism [35], which aligns with the observation that R25 and R35 exhibited a stronger biogas production capacity compared with R15 and R20. The organic acids are metabolic byproducts of microorganisms, and the composition of microbial communities in the system is intricately linked to the accumulation of these organic acids. Analyzing this relationship can provide further insights into the key factors influencing the of reactor fermentation systems (refer to Section 3.5).
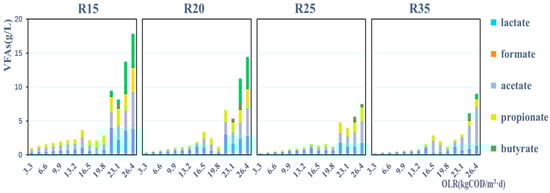
Figure 3.
Accumulation of volatile fatty acids (VFAs: lactate, formate, acetate, propionate, and butyrate) changed with promotion of OLR in R15, R20, R25, and R35, respectively.
3.3. Temperature Adaptation Strategy for the Anaerobic Digester Employed in Wastewater Treatment
A cost-effective approach to regulating the temperature of anaerobic digestion involves utilizing surplus thermal energy derived from biogas engines in a combined heat and power (CHP) system [36]. However, there is a limitation on the availability of excess thermal energy from a biogas system exhibiting thermal energy conversion efficiencies ranging between 40% and 45% [37]. To ensure effective treatment, it becomes imperative to elevate the digestion temperature by heating the substrate and by offsetting heat loss. When dealing with low-temperature wastewater in digesters, it is crucial to consider net energy output as significant factor.
The net energy output estimates for digesters in Table 1 were determined using the following set of criteria:

Table 1.
Net energy output under different temperatures.
- (1)
- The assumed average temperature throughout the year was 15 °C;
- (2)
- The digester has a volumetric capacity of 1000 m3 (height-to-diameter ratio of 9:4, consistent with the reactor in this study), making it suitable for engineering applications, and assuming that the operation process of this study was used;
- (3)
- The reactor was assumed to be insulated with the common material rock wool, for which the heat conductivity coefficient is 0.038 W/(m·K) [38] and the insulation thickness of engineering is 150 mm;
- (4)
- Heat loss = a × A × ∆T/∆X, where a is the heat conductivity coefficient, A is the bioreactor area, ∆T is the difference between fermentation and ambient temperature, and ∆X is the insulation thickness of the insulation material;
- (5)
- The heat requirement for the feedstock was determined by utilizing the daily water inflow; the temperature differential; and the specific heat capacity of wastewater, which was assumed to be 4200 J/kg·K;
- (6)
- A heat efficiency of 65% for the hot-water boiler was used to heat the reactors [39];
- (7)
- The volumetric biogas production rate was derived from the daily biogas production and the calculated volume of the test reactor at the specific organic loading rate (OLR) employed in this study;
- (8)
- The calorific value of the biogas was approximately 21 MJ/m3 [40].
Considering that R15 exhibits minimal inhibition based on the OLR in terms of biogas production and there is no significant difference in biogas yield between R20 and R25, 9.9 kg (COD)/m3·d was selected as a representative low OLR condition to compare the net energy output of the engineered reactors at different temperatures. Table 1 reveals that there is no significant disparity in energy output for engineering anaerobic digestion (E-AD) processes at both 20 °C and 25 °C. However, the net energy output of E-AD at 20 °C surpasses that at 25 °C by a margin of 13.2% and demonstrates its superiority over E-AD processes conducted at low temperatures (15 °C) or medium temperatures (35 °C). In addition, the net energy output of 35 °C E-AD is equivalent to that of 15 degrees E-AD. The above results suggest that, in terms of energy output, both LT-AD and MT-AD exhibit limited suitability for treating low-temperature and low-load wastewater in engineering applications. Conversely, SMT-AD, exemplifying AD at 20 °C, emerges as the optimal strategy for application.
Considering that R20, R25, and R35 all exhibited superior biogas production capacities at an OLR of 19.8 kg (COD)/m3·d, this specific OLR was selected as the representative high OLR condition for comparing the net energy output of the engineered reactors across different temperatures. As the OLR has already suppressed the AD at 15 °C, no further analysis will be conducted on the net energy output of 15 °C AD. According to Table 1, there is no statistically significant difference in the net energy output between E-AD at 20 °C and E-AD at 25 °C. However, the net energy output of 35 °C E-AD exhibits a remarkable increase of 56.9% compared with that of SMT-AD, indicating a distinct advantage in energy production. Therefore, for engineering applications involving low-temperature and high-OLR conditions, MT-AD is considered superior.
3.4. Effect of Temperature and OLR on Microbial Community Diversity
The species richness (0N) in all reactors was less than that in the seed sludge (Figure 4), and the species richness in R15 and R20 was lower than that in R25 and R35 under the initial OLR. And, this may indicate that reduction of 15–20 °C from moderate to low temperature deteriorated the richness of the bacteria community in the case that the seed sludge was from the full-scale UASB reactor at moderate temperature. In addition, the instability of 0N in R15, R20, and R25 was bigger than that in the control group R35 along with changes in the OLR according to the standard deviation of species richness (STDEV.S: R15, 153.7; R20, 228.2; R25, 170.8; and R35, 129.6). This may indicate that the reduced temperature weakened the stability of the microbial communities in the reactors.
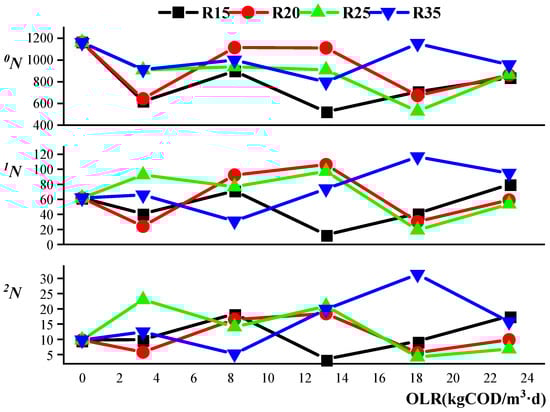
Figure 4.
Effects of temperature and organic loading rate (OLR) on bacterial diversity, represented by the Hill number (εN, ε = 0, 1, 2). Samples were taken from reactors (R15, R20, R25, and R35) under five OLRs (3.30, 8.25, 13.2, 18.15, and 23.10 kg (COD)/m3·d). The first symbol (four lines cross) indicates the seed sludge.
1N and 2N represent diversity, which is a more general term than species richness. Although the Hill index 2N is a more robust estimate than 1N 28, the changing trends in 1N and 2N with increasing OLRs were similar in our study (Figure 4). This may be caused by the sufficient sequence size (Supplementary Figure S2). The change trend in the diversity index with an increased OLR was different from the species richness trend (Figure 4). 0N of the control group R35 under the initial OLR was lower than that of the seed sludge, but both 1N and 2N in R35 were similar to that of the seed sludge. Compared with R35, 1N and 2N of R25 increased, whereas R15 and R20 decreased. Thus, the sharp decrease of 15–20 °C had a negative impact on diversity in R15 and R20. The increase in diversity in R25 under the initial OLR may be caused by the fact that 25 °C is a tolerable temperature for both psychrotrophic and mesophilic bacteria [41].
The change trends of 1N and 2N in R20 was similar to that in R25 with an OLR change from 8.25 to 23.10 kg (COD)/m3·d. So, it could be obtained that although a strong relationship between diversity and OLR could not be obtained, the microbial diversity of 20 °C and 25 °C was extreme—similarly influenced by OLR. The temperature difference of 5 °C between R20 and R25 did not cause large differences in diversity or biogas production with increased OLR; however, these parameters largely differed between R15 and R20, and this may indicate that the change in the OLR in low-temperature AD severely disturbed the diversity of the bacteria community, just like that in low-temperature seriously restrained biogas production (Figure 1). Thus, the diversity of the microbial communities was also influenced by both temperature and OLR.
Temperature could greatly influence the microbial community [42]. In our research, species richness 0N and temperature presented a significant positive linear relationship (Figure 5, r2 = 0.254, p = 0.047, 95% confidence) in the engineered wastewater treatment ecosystem, whereas 1N and 2N were not linearly related to temperature (1N: r2 = 0.082, p = 0.281; 2N: r2 = 0.026, p = 0.549, 95% confidence). Zhou et al., 2016, reported a similar relationship between microbial species richness and temperature in a forest soil ecosystem [43]. This may indicate that species abundance is temperature-dependent, but diversity is influenced by a combination of temperature and OLR, as evidence from the partial Pearson’s correlation analysis (Table 2), which showed that species richness 0N had a significant relation with temperature, but the diversity index 1N and 2N did not have that. Furthermore, although both biogas production and species richness were positively correlated with temperature, the biogas–temperature correlation was stronger (Table 2). Therefore, the temperature had a stronger impact on biogas production than on microbial richness.
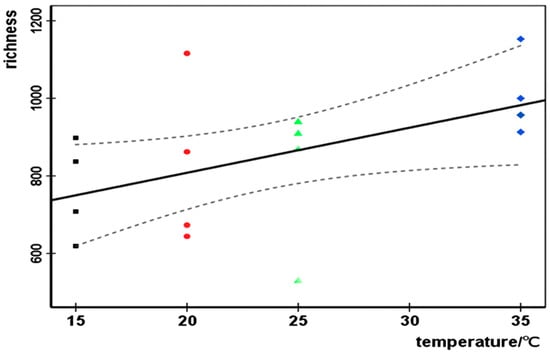
Figure 5.
Linear regression between temperature and richness. The dotted curve represents the 95% confidence limit (r2 = 0.254; p = 0.047). The black squares, red circles, green triangle, and blue rhombus, respectively, represent 0N of R15, R20, R25, and R35 under different OLRs.
Table 2.
Partial Pearson’s correlation analysis for 0N, 1N, 2N, average daily biogas production with temperature and controlling variable OLR.
The richness and diversity of archaeal communities in R15, R20, R25, and R35 were much lower than the values for the wastewater seed sludge (Table 3), and this may be caused by the artificial wastewater, as feedstock was simpler than real wastewater in the treatment plant. The Hill indices of archaeal communities were smaller than those for bacteria microbial communities in all reactors (Figure 4, Table 3), indicating that methanogens were tender when facing an undesirable environment. The Hill indices for archaeal communities under the low temperature of R15 decreased with an increased OLR (Figure 4), and this was accordant with the high OLR strongly restraining CH4 production in R15 (Figure 6). The Hill indices for R20, R25, and R35 increased with OLR (from 8.25 to 23.10 kg (COD)/m3·d), and this may respond to the fact that the CH4 percent of R25 and R35 remained stable with an increased OLR, and the recovery of CH4 production in R20 happened after being restrained under a high OLR. Therefore, there may be some relevance between CH4 production and diversity of the archaeal community.
Table 3.
0N, 1N, and 2N for archaeal communities in R15, R20, R25, and R35 under low OLR (8.25 kg (COD)/m3·d) and high OLR (23.10 kg (COD)/m3·d). IN represents seed sludge sample.
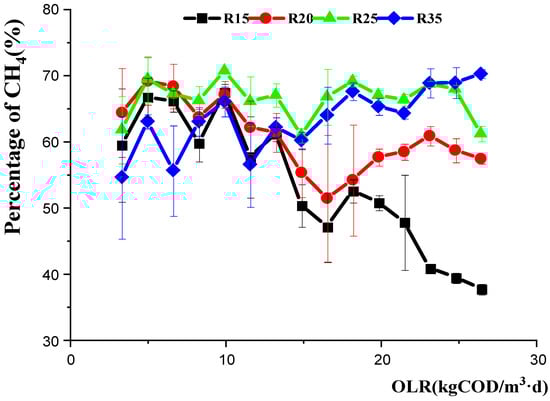
Figure 6.
CH4 content with increasing OLR in R15, R20, R25, and R35; error bars represent the percentage of methane standard deviations of triplicate measurements.
3.5. Effects of Temperature and OLR on Community Composition and Ecological Function
3.5.1. Bacterial Community
The main bacterial order identified in the reactors included Clostridiales, Synergistales, Bacteroidales, Anaerolineales and Lactobacillales (Figure 7). Riviere et al., 2009 [44], also reported similar predominant bacteria groups in several mesophilic full-scale digesters. Redundancy analysis-based OTUs were carried out to unravel the relevance between the domain microbial individuals and environment factors (Figure 8). Anaerolineales and Thermotogales were positively correlated with temperature, and the abundance of Lactobacillales was negatively correlated with temperature. And, no group was positively related to OLR. Although the other domain bacteria, i.e., Synergistales, Desulfovibrionales, Clostridiales, and Bacteroidales, were not strongly related to temperature or OLR (Figure 8a), the combined effect of temperature and OLR, along with a typical feedstock, shaped their ecological niches.
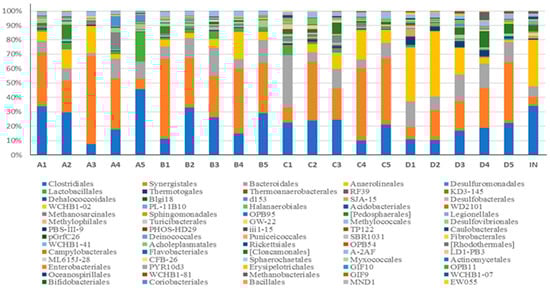
Figure 7.
Composition of bacterial community under different OLRs at the order level in R15, R20, R25, and R35, respectively. The letters A, B, C and D represent 15 °C, 20 °C, 25 °C, and 35 °C, respectively; the numbers 1, 2, 3, 4, and 5 represent OLRs 3.30, 8.25, 13.2, 18.15, and 23.10 kg (COD)/m3·d, respectively.
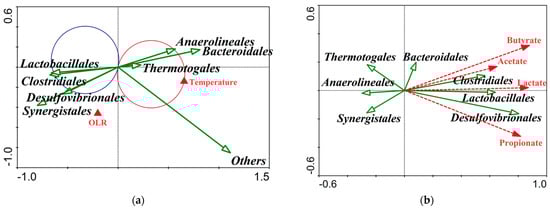
Figure 8.
Redundancy analysis (RDA) for correlations between the main bacteria and temperature: OLR (a) and VFAs (b). In Figure 5a, the section of t-value biplot with Van Dobben circles delimits the scores of bacteria OTUs significantly correlating with temperature at p < 0.05 (Monte Carlo permutation test/reduced rank regression). Red circle encloses positively correlating species taxa with temperature, whereas the blue circle delimits the negatively correlating taxa. The redundancy analysis was conducted using Canoco 4.5 software.
The relative abundance of Anaerolineales, belonging to the phylum Chloroflexi, was 8.3%, 7.8%, 11.6%, and 21.3% in R15, R20, R25, and R35 (Figure 7), respectively, and the good occupation of Anaerolineales in digesters may be caused by abundance of the simple sugars in the feedstock of molasses wastewater since they could strictly conduct anaerobic fermentation of carbohydrates [45]. Abundant environmental 16S rRNA gene clones belonging to Anaerolineales have been found in multiple ecosystems [46], and they can exist at temperatures ranging from 25 °C to 65 °C [45], and this may state the correlation between Anaerolineales and temperature in our research (Figure 8a). Thermotogales are thermophilic or hyperthermophilic individuals that grow well between 55 °C and 90 °C [47]. We found low abundance (0.5%, 0.2%, 0.8%, and 3.4%) of Thermotogales in all four AFBRs, and abundance increased with increasing temperature. Thermotogales converts sugars to H2 and simultaneously generates lactic acid [48]. Thermotogales abundance was not significantly related to lactic acid production in our study (Figure 8b); thus, relatively low temperature and low abundance may limit the ecological role of Thermotogales in AD ecosystems.
The relative abundance of Synergistales, belonging to Synergistetes, was 33%, 40%, 34%, and 24% in R15, R20, R25, and R35 (Figure 7), respectively, and was maximum in all bacteria, indicating that Synergistales was more robust than the other bacteria. There was a similar result in Werner et al.’s, 2011 [49], report that Synergistales were predominant in multiple mesothermal full-scale digesters. Synergistales can degrade amino acids into organic acids [50], and their high abundance may be caused by the protein from cat food, which was a component of the artificial wastewater.
Desulfovibrionales, belonging to Proteobacteria, is typical of sulfate-reducing bacteria [51]. The class Deltaproteobacteria, mainly consisting of Desulfovibrionales in our study, could perform syntrophic propionate oxidation [52]. In our study, its abundance was positively related to propionate concentration (Figure 8b). So, Desulfovibrionales may oxidize propionate with sulfate as an electron acceptor to produce H2S, and this leads to the accumulation of H2S in the biogas production of all AFBRs. In addition, the vector arrows for Desulfovibrionales and Synergistales were almost point blank under the effects of temperature and OLR (Figure 8a), indicating a synergistic relationship between the two. This agrees with the findings that some species of Synergistales can survive on intermediate metabolites of propionate oxidation [53], which could be conducted by Desulfovibrionales. And, Vanwonterghem et al., 2014 [54], also reported that Desulfovibrionales and Synergistales have a syntrophic metabolism.
Clostridiales, belonging to Firmicutes, was also predominant in all reactors and played an important role in the fermentation of simple sugars from wastewater. Many species of Clostridiales, especially the genus Clostridium, degrade polysaccharides [55], and Clostridiales was positively correlated with acetate and butyrate (Figure 8b). Clostridiales could produce organic acids via sugar fermentation [56]. They could produce acetate and H2 simultaneously, and some of these species are typical representativeness of acetogen, which could use H2 as an electron donor and CO2 as an electron acceptor to produce acetate [57]. The relationship between Clostridiales and acetate in our study supports these properties (Figure 8b). Furthermore, butyrate is a main metabolic product of Firmicutes [58]. In all temperature reactors, 95% of Firmicutes consisted of the order Clostridiales, demonstrating that butyrate production was tightly related to the abundance of Clostridiales.
Although the relative abundance of Lactobacillales was lower than that of Clostridiales, they showed a similar response to temperature variation (Figure 8a). And, this may be caused by the fact that both Lactobacillales and Clostridiales belong to Firmicutes and they have some similar characteristics. In addition, Lactobacillales was negatively correlated with temperature and thus more robust at sub-optimal temperature. Lactobacillales produces lactic acid derived from glucose and yields side products such as acetic acid and ethanol by heterofermentation of hexoses and pentoses [59]. This may explain why Lactobacillales was positively correlated with lactic acid production (Figure 8b).
3.5.2. Archaeal Community
In all reactors, the magnitudes of Methanosaetaceae (Mst), Methanosarcina (Msc), and Methanomicrobiales (Mmb) were 109 copies/mL, 106 copies/mL, and 108 copies/mL, respectively; temperature did not influence the magnitude of Mst, Msc, and Mmb. However, Mst, Msc, and Mmb were sensitive to changes in the OLR in R35, possibly because the methanogens were struck by high rates of substrate transformation and transport when the OLR was increased under a moderate temperature (35 °C). In contrast, low rates of substrate transformation and transport under a sub-moderate temperature probably created a driven and inactive environment leading to a placid change in methanogens when the OLR was raised. In addition, it was probably seen that the methanogens could survive to maintain their population under weak conditions although the combined effect of a relatively low temperature and a high OLR (>14.85 kg (COD)/m3·d) severely restrained the metabolic activity of methanogens (Figure 6). Mst possessed an absolute advantage in all reactors (Figure 9), and this corresponded with the results from high-throughput sequencing that Mst had supramaximal ratio, 86.2%, 93.8%, 87.6%, and 91.8% in the four temperature reactors (Supplementary Figure S3). The second major methanogen was Methanobacteriaceae (Mbt), 2.5%, 2%, 5%, 3.1%, respectively. And, similar studies have reported Mst and Mbt as predominant orders in wastewater AD communities [60,61]. It could be indicated that the dominant methanogenesis pathway, independent of temperature and OLR in all reactors, was the acetoclastic methanogenesis since Mst exclusively performs the metabolic process [62]. The relative abundances of Mbt and Mmb, which are hydrogenotrophic [63], were much lower than that of Mst. And, this may seemingly be coincident with the low accumulation of butyrate (in the promotion process of 3.3 to 19.8 kg (COD)/m3·d, there was no accumulation of butyrate until the building up appeared at the end, Figure 3), since the yield of hydrogen, a substrate for hydrogenotrophic methanogens, has a stronger thermos-dynamical relation with the fermentation pathway of butyrate formation than other VFAs [64].
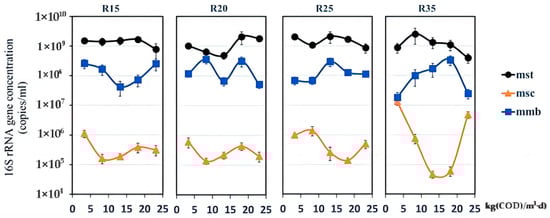
Figure 9.
Quantitative changes in the 16S rRNA gene concentrations of the family Methanosaetaceae (Mst), the family Methanosarcina (Msc), and the order Methanomicrobiales (Mmb). Samples were from five OLR points (3.30, 8.25, 13.2, 18.15, and 23.10 kg (COD)/m3·d) in R15 (15 °C), R20 (20 °C), R25 (25 °C), and R35 (35 °C), respectively. Error bars represent the gene concentration standard deviations of triplicate measurements.
4. Conclusions
The effect of temperature on biogas production increased with the OLR in sub-moderate temperature AD. And, SMT-AD is deemed as the optimal application strategy of wastewater with a low temperature and a low OLR. Temperature presented a significant positive linear relationship with bacterial richness and diversity. The influence of temperature on the microbial metabolic output was much stronger than that on species richness. There is a positive relation between CH4 production and diversity of the archaeal community. Temperature and the OLR shaped the ecological niches occupied by microbes. Acetoclastic Methanosaetaceae was the predominant methanogen. Methanogenesis was limited under a high OLR and a low temperature but methanogens could survive and maintain their population.
Supplementary Materials
The following supporting information can be downloaded at https://www.mdpi.com/article/10.3390/fermentation9100903/s1, Figure S1. The change in pH along with the promotion of OLR; Figure S2. Rarefaction analysis of 16S rDNA OTUs at different taxonomic resolutions: (a) bacterial community; (b) archaeal community. The letters A, B, C, and D represent 15 °C, 20 °C, 25 °C, and 35 °C, respectively; the numbers 1, 2, 3, 4, and 5 represent OLRs 3.30, 8.25, 13.2, 18.15, and 23.10 kg (COD)/m3·d, respectively; Figure S3. Composition of archaeal community under different OLRs at (a) the family level in R15, R20, R25, and R35, respectively. The letters A, B, C, and D represent 15 °C, 20 °C, 25 °C, and 35 °C, respectively; the numbers 1, 2, 3, 4, and 5 represent OLRs 3.30, 8.25, 13.2, 18.15, and 23.10 kg (COD)/m3·d, respectively.
Author Contributions
J.W. conducted most of the experiments and wrote the manuscript. H.Z. conducted a part of the experiments and revised the manuscript. Y.Z. revised the manuscript. X.Y. revised the manuscript. Z.C. revised the manuscript. All authors have read and agreed to the published version of the manuscript.
Funding
This work was supported by the special fund for Agro-scientific Research in the Public Interest (No. 201503137).
Data Availability Statement
Not applicable.
Conflicts of Interest
The authors declare no conflict of interest.
References
- Angenent, L.T.; Karim, K.; Al Dahhan, M.H.; Wrenn, B.A.; Domíguez-Espinosa, R. Production of bioenergy and biochemicals from industrial and agricultural wastewater. Trends Biotechnol. 2004, 22, 477–485. [Google Scholar] [CrossRef] [PubMed]
- Romero-Gueiza, M.S.; Vila, J.J.; Mata-Alvarez, J.; Chimenos, J.; Astals, S. The role of additives on anaerobic digestion: A review. Renew. Sustain. Energy Rev. 2016, 58, 1486–1499. [Google Scholar] [CrossRef]
- Kovalovszki, A.; Treu, L.; Ellegaard, L.; Luo, G.; Angelidaki, I. Modeling temperature response in bioenergy production: Novel solution to a common challenge of anaerobic digestion. Appl. Energy 2020, 263, 114646. [Google Scholar] [CrossRef]
- De Vrieze, J.D.; Saunders, A.M.; He, Y.; Fang, J.; Nielsen, P.H.; Verstraete, W.; Boon, N. Ammonia and temperature determine potential clustering in the anaerobic digestion microbiome. Water Res. 2015, 75, 312–323. [Google Scholar] [CrossRef] [PubMed]
- Pap, B.; Györkei, Á.; Boboescu, I.Z.; Nagy, I.K.; Bíró, T.; Kondorosi, É.; Maróti, G. Temperature-dependent transformation of biogas-producing microbial communities points to the increased importance of hydrogenotrophic methanogenesis under thermophilic operation. Bioresour. Technol. 2015, 177, 375–380. [Google Scholar] [CrossRef] [PubMed]
- Huang, X.; Duan, C.; Yu, J.; Dong, W.; Wang, H. Response of vfas and microbial interspecific interaction to primary sludge fermentation temperature. J. Clean. Prod. 2021, 322, 129081. [Google Scholar] [CrossRef]
- Zi-Yan, L.; Daisuke, I.; Michihiko, I. Mitigating ammonia-inhibition in anaerobic digestion by bioaugmentation: A review. J. Water Process Eng. 2023, 52, 103506. [Google Scholar] [CrossRef]
- Robles, A.; Ruano, M.V.; Ribes, J.; Ferrer, J. Performance of industrial scale hollow-fibre membranes in a submerged anaerobic MBR (HF-SAnMBR) system at mesophilic and psychrophilic conditions. Sep. Purif. Technol. 2013, 104, 290–296. [Google Scholar] [CrossRef][Green Version]
- Kamyab, B.; Zilouei, H.; Rahmanian, B. Investigation of the effect of hydraulic retention time on anaerobic digestion of potato leachate in two-stage mixed-uasb system. Biomass Bioenergy 2019, 130, 105383. [Google Scholar] [CrossRef]
- Jang, H.M.; Kim, J.H.; Ha, J.H.; Park, J.M. Bacterial and methanogenic archaeal communities during the single-stage anaerobic digestion of high-strength food wastewater. Bioresour. Technol. 2014, 165, 174–182. [Google Scholar] [CrossRef]
- Liu, A.; Chou, C.; Chen, L.; Kuo, C. Bacterial community dynamics in a swine wastewater anaerobic reactor revealed by 16S rDNA sequence analysis. J. Biotechnol. 2015, 194, 124–131. [Google Scholar] [CrossRef] [PubMed]
- Huang, Q.; Liu, Y.; Dhar, B.R. Pushing the organic loading rate in electro -chemically assisted anaerobic digestion of blackwater at ambient temperature: Insights into microbial community dynamics. Sci. Total Environ. 2021, 781, 146694. [Google Scholar] [CrossRef] [PubMed]
- Han, Z.; Chen, F.; Zhong, C.; Zhou, J.; Wu, X.; Yong, X.; Zhou, H.; Jiang, M.; Jia, H.; Wei, P. Effects of different carriers on biogas production and microbial community structure during anaerobic digestion of cassava ethanol wastewater. Environ. Technol. 2016, 38, 2253–2262. [Google Scholar] [CrossRef]
- Van, D.P.; Fujiwara, T.; Tho, B.L.; Toan, P.; Minh, G.H. A review of anaerobic digestion systems for biodegradable waste: Configurations, operating parameters, and current trends. Environ. Eng. Res. 2020, 25, 1–17. [Google Scholar] [CrossRef]
- Trego, A.C.; Holohan, B.C.; Keating, C.; Graham, A.; O’Flaherty, V. First proof of concept for full-scale, direct, low-temperature anaerobic treatment of municipal wastewater. Bioresour. Technol. 2021, 341, 125786. [Google Scholar] [CrossRef] [PubMed]
- Connaughton, S.; Collins, G.; O’Flaherty, V. Development of microbial community structure and actvity in a high-rate anaerobic bioreactor at 18°C. Water Res. 2006, 40, 1009–1017. [Google Scholar] [CrossRef] [PubMed]
- McKeown, R.M.; Hughes, D.; Collins, G.; Mahony, T.; O’Flaherty, V. Low-temperature anaerobic digestion for wastewater treatment. Curr. Opin. Biotechnol. 2012, 23, 444–451. [Google Scholar] [CrossRef] [PubMed]
- Akila, G.; Chandra, T.S. Performance of an UASB reactor treating synthetic wastewater at low-temperature using cold-adapted seed slurry. Process Biochem. 2007, 42, 466–471. [Google Scholar] [CrossRef]
- Madden, P.; Chinalia, F.A.; Enright, A.; Collins, G.; O’Flaherty, V. Perturbation-independent Community Development in Low-Temperature Anaerobic Biological Wastewater Treatment Bioreactors. Biotechnol. Bioeng. 2010, 105, 79–87. [Google Scholar] [CrossRef]
- Bialek, K.; Cysneiros, D.; O’Flaherty, V. Low-temperature (10°C) anaerobic digestion of dilute dairy wastewater in an EGSB bioreactor: Microbial community structure, population dynamics, and kinetics of methanogenic populations. Archaea 2013, 2013, 346171. [Google Scholar] [CrossRef]
- Enright, A.; McGrath, V.; Gill, D.; Collins, G.; O’Flaherty, V. Effect of seed sludge and operation conditions on performance and archaeal community structure of low-temperature anaerobic solvent-degrading bioreactors. Syst. Appl. Microbiol. 2009, 32, 65–79. [Google Scholar] [CrossRef] [PubMed]
- Yun, H.; Liang, B.; He, Z.W.; Li, M.H.; Zong, S.M.; Wang, Z.F.; Ge, B.; Zhang, P.; Li, X.K.; Wang, A.J. Insights into methanogenesis of mesophilic-psychrophilic varied anaerobic digestion of municipal sludge with antibiotic stress. J. Environ. Manag. 2023, 331, 117278. [Google Scholar] [CrossRef] [PubMed]
- Liu, Y.-C.; Ramiro-Garcia, J.; Paulo, L.M.; Braguglia, C.M.; Gagliano, M.C.; O’Flaherty, V. Psychrophilic and mesophilic anaerobic treatment of synthetic dairy wastewater with long chain fatty acids: Process performances and microbial community dynamics. Bioresour. Technol. 2023, 3801, 129124. [Google Scholar] [CrossRef] [PubMed]
- Quispe-Cardenas, E.; Rogers, S. Microbial adaptation and response to high ammonia concentrations and precipitates during anaerobic digestion under psychrophilic and mesophilic conditions. Water Res. 2021, 204, 117596. [Google Scholar] [CrossRef] [PubMed]
- Jiang, Q.; Xin, Y.; Jiang, Y.; Huang, L.; Shen, P. Improving the efficiency of anaerobic digestion of Molasses alcohol wastewater using Cassava alcohol wastewater as a mixed feedstock. Bioresour. Technol. 2022, 344, 126179. [Google Scholar] [CrossRef] [PubMed]
- Nagao, N.; Tajima, N.; Kawai, M.; Niwa, C.; Kurosawa, N.; Matsuyama, T.; Yusoff, F.M.; Toda, T. Maximum organic loading rate for the single-stage wet anaerobic digestion of food waste. Bioresour. Technol. 2012, 118, 110–218. [Google Scholar] [CrossRef]
- Carballa, M.; Regueiro, L.; Lema, J.M. Microbial management of anaerobic digestion: Exploiting the microbiome-functionality nexus. Curr. Opin. Biotechnol. 2015, 33, 103–111. [Google Scholar] [CrossRef]
- Haegeman, B.; Hamelin, J.; Moriarty, J.; Neal, P.; Dushoff, J.; Weitz, J.S. Robust estimation of microbial diversity in theory and in practice. ISME J. 2013, 7, 1092–1101. [Google Scholar] [CrossRef]
- Chao, A.; Chiu, C.H.; Jost, L. Phylogenetic diversity measures based on Hill numbers. Philos. Trans. R. Soc. Lond. B Biol. Sci. 2010, 365, 3599–3609. [Google Scholar] [CrossRef]
- Hill, M.O. Diversity and evenness: A unifying notation and its consequences. Ecology 1973, 54, 427–432. [Google Scholar] [CrossRef]
- Jost, L. Entropy and diversity. Oikos 2006, 113, 363–375. [Google Scholar] [CrossRef]
- Yuan, X.; Cao, Y.; Li, J.; Wen, B.; Cui, Z. Effect of pretreatment by a microbial consortium on methane production of waste paper and cardboard. Bioresour. Technol. 2012, 118, 281–288. [Google Scholar] [CrossRef]
- Zhang, H.; Wu, J.W.; Gao, L.J.; Yu, J.D.; Yuan, X.F.; Zhu, W.B.; Wang, X.; Cui, Z.J. Aerobic deterioration of corn stalk silage and its effect on methane production and microbial community dynamics in anaerobic digestion. Bioresour. Technol. 2018, 250, 828–837. [Google Scholar] [CrossRef] [PubMed]
- Joel, T. Van’t Hoff analysis of K°(T): How good…or bad? Biophysical Chemistry. 2006, 120, 114–120. [Google Scholar] [CrossRef]
- Zuo, X.Y.; Yuan, H.R.; Wachemo, A.C.; Wang, X.T.; Zhang, L.; Li, J.; Wen, H.L.; Wang, J.X.; Li, X.J. The relationships among sCOD, VFAs, microbial community, and biogas production during anaerobic digestion of rice straw pretreated with ammonia. Chin. J. Chem. Eng. 2020, 8, 286–292. [Google Scholar] [CrossRef]
- Weiland, P. Production and energetic use of biogas from energy crops andwastes in Germany. Appl. Biochem. Biotechnol. 2003, 109, 263–274. [Google Scholar] [CrossRef] [PubMed]
- Streckienė, G.; Martinaitis, V.; Andersen, A.N.; Katz, J. Feasibility of CHP-plantswith thermal stores in the German spot market. Appl. Energy 2009, 86, 2308–2316. [Google Scholar] [CrossRef]
- Li, H.; Liu, T.; Sun, H. Reducing the thermal conductivity of rock wool insulation boards: CN201520630474.4 [P]. CN204940569U (2023-10-03). Available online: https://kns.cnki.net/kcms2/article/abstract?v=kxaUMs6x7-4I2jr5WTdXti3zQ9F92xu0W4dJebv7J62u0sSxe4_ew0htP0HjOpCBGWikk0hK9q0EO6NUUDPmbv36PkkszP9S&uniplatform=NZKPT (accessed on 4 October 2023).
- Chen, W.; Xu, R. Clean coal technology development in China. Energy Policy 2010, 38, 2123–2130. [Google Scholar] [CrossRef]
- Li, Y.; Liu, H.; Yan, F.; Su, D.F.; Wang, Y.F.; Zhou, H.G. High-calorific biogas production from anaerobic digestion of food waste using a two-phase pressurized biofilm (TPPB) system. Bioresour. Technol. 2017, 224, 56–62. [Google Scholar] [CrossRef]
- D’Amico, S.; Collins, T.; Marx, J.C.; Feller, G.; Gerday, C. Psychrophilic microorganisms: Challenges for life. EMBO Rep. 2006, 7, 385–389. [Google Scholar] [CrossRef]
- Luo, G.; De Francisci, D.; Kougias, P.G.; Laura, T.; Zhu, X.; Angelidaki, I. New steady-state microbial community compositions and process performances in biogas reactors induced by temperature disturbances. Biotechnol. Biofuels 2015, 8, 3. [Google Scholar] [CrossRef] [PubMed]
- Zhou, J.; Deng, Y.; Shen, L.; Wen, C.; Yan, Q.; Ning, D.; Qin, Y.; Xue, K.; Wu, L.; He, Z.; et al. Temperature mediates continental-scale diversity of microbes in forest soils. Nat. Commun. 2016, 7, 12083. [Google Scholar] [CrossRef] [PubMed]
- Riviere, D.; Desvignes, V.; Pelletier, E.; Chaussonnerie, S.; Guermazi, S.; Weissenbach, J.; Li, T.; Camacho, P.; Sghir, A. Towards the definition of a core of microorganisms involved in anaerobic digestion of sludge. ISME J. 2009, 3, 700–714. [Google Scholar] [CrossRef] [PubMed]
- Sekiguchi, Y.; Yamada, T.; Hanada, S.; Ohashi, A.; Harada, H.; Kamagata, Y. Anaerolinea thermophila gen. nov., sp nov and Caldilinea aerophila gen. nov., sp nov., novel filamentous thermophiles that represent a previously uncultured lineage of the domain Bacteria at the subphylum level. Int. J. Syst. Evol. Microbiol. 2003, 53, 1843–1851. [Google Scholar] [CrossRef] [PubMed]
- Yamada, T.; Sekiguchi, Y.; Hanada, S.; Imachi, H.; Ohashi, A.; Harada, H.; Kamagata, Y. Anaerolinea thermolimosa sp nov., Levilinea saccharolytica gen. nov., sp nov and Leptolinea tardivitalis gen. nov., so. nov., novel filamentous anaerobes, and description of the new classes Anaerolineae classis nov and Caldilineae classis nov in the bacterial phylum Chloroflexi. Int. J. Syst. Evol. Microbiol. 2006, 56, 1331–1340. [Google Scholar] [PubMed]
- Jannasch, H.W.; Huber, R.; Belkin, S.; Stetter, K.O. Thermotoga neapolitana sp. nov. of the extremely thermophilic, eubacterial genus Thermotoga. Arch. Microbiol. 1988, 150, 103–104. [Google Scholar] [CrossRef]
- Pradhan, N.; Dipasquale, L.; d’Ippolito, G.; Fontana, A.; Panico, A.; Pirozzi, F.; Lens, P.N.; Esposito, G. Model development and experimental validation of capnophilic lactic fermentation and hydrogen synthesis by Thermotoga neapolitana. Water Res. 2016, 99, 225–234. [Google Scholar] [CrossRef] [PubMed]
- Werner, J.J.; Knights, D.; Garcia, M.L.; Scalfone, N.B.; Smith, S.; Yarasheski, K.; Cummings, T.A.; Beers, A.R.; Knight, R.; Angenent, L.T. Bacterial community structures are unique and resilient in full-scale bioenergy systems. Proc. Natl. Acad. Sci. USA 2011, 108, 4158–4163. [Google Scholar] [CrossRef]
- Jumas-Bilak, E.; Roudiere, L.; Marchandin, H. Description of ‘Synergistetes’ phyl. nov. and emended description of the phylum ‘Deferribacteres’ and of the family Syntrophomonadaceae, phylum ‘Firmicutes’. Int. J. Syst. Evol. Microbiol. 2009, 59, 1028–1035. [Google Scholar] [CrossRef]
- Maukonen, J.; Saarela, M.; Raaska, L. Desulfovibrionales-related bacteria in a paper mill environment as detected with molecular techniques and culture. J. Ind. Microbiol. Biotechnol. 2006, 33, 45–54. [Google Scholar] [CrossRef]
- Li, J.; Ban, Q.; Zhang, L.; Jha, A.K. Syntrophic Propionate Degradation in Anaerobic Digestion: A Review. Int. J. Agric. Biol. 2012, 14, 843–850. [Google Scholar] [CrossRef]
- Honda, T.; Fujita, T.; Tonouchi, A. Aminivibrio pyruvatiphilus gen. nov., sp. nov., an anaerobic, amino-acid-degrading bacterium from soil of a Japanese rice field. Int. J. Syst. Evol. Microbiol. 2013, 63, 3679–3686. [Google Scholar] [CrossRef] [PubMed]
- Vanwonterghem, I.; Jensen, P.D.; Dennis, P.G.; Hugenholtz, P.; Rabaey, K. Deterministic processes guide long-term synchronised population dynamics in replicate anaerobic digesters. ISME J. 2014, 8, 2015–2028. [Google Scholar] [CrossRef] [PubMed]
- Hanreich, A.; Schimpf, U.; Zakrzewski, M.; Schlüter, A.; Benndorf, D.; Heyer, R.; Rapp, E.; Pühler, A.; Reichl, U.; Klocke, M. Metagenome and metaproteome analyses of microbial communities in mesophilic biogas-producing anaerobic batch fermentations indicate concerted plant carbohydrate degradation. Syst. Appl. Microbiol. 2013, 36, 330–338. [Google Scholar] [CrossRef] [PubMed]
- Demain, A.L.; Newcomb, M.; Wu, J.D. Cellulase, clostridia, and ethano. Microbiol. Mol. Biol. Rev. 2005, 69, 124–154. [Google Scholar] [CrossRef] [PubMed]
- Muller, V. Energy Conservation in Acetogenic Bacteria. Appl. Environ. Microbiol. 2003, 69, 6345–6353. [Google Scholar] [CrossRef]
- Vital, M.; Howe, A.C.; Tiedje, J.M. Revealing the Bacterial Butyrate Synthesis Pathways by Analyzing (Meta) genomic Data. mBio 2014, 5, e00889-14. [Google Scholar] [CrossRef] [PubMed]
- Salvetti, E.; Fondi, M.; Fani, R.; Torriani, S.; Felis, G.E. Evolution of lactic acid bacteria in the order Lactobacillales as depicted by analysis of glycolysis and pentose phosphate pathways. Syst. Appl. Microbiol. 2013, 36, 291–305. [Google Scholar] [CrossRef]
- André, L.; Ndiaye, M.; Pernier, M.; Lespinard, O.; Pauss, A.; Lamy, E.; Ribeiro, T. Methane production improvement by modulation of solid phase immersion in dry batch anaerobic digestion process: Dynamic of methanogen populations. Bioresour. Technol. 2016, 207, 353–360. [Google Scholar] [CrossRef]
- Song, M.; Shin, S.G.; Hwang, S. Methanogenic population dynamics assessed by real-time quantitative PCR in sludge granule in upflow anaerobic sludge blanket treating swine wastewater. Bioresour. Technol. 2010, 1011, S23–S28. [Google Scholar] [CrossRef]
- Fournier, G.P.; Gogarten, J.P. Evolution of acetoclastic methanogenesis in Methanosarcina via horizontal gene transfer from cellulolytic Clostridia. J. Bacteriol. 2008, 190, 1124–1127. [Google Scholar] [CrossRef]
- Karakashev, D.; Batstone, D.J.; Angelidaki, I. Influence of environmental conditions on methanogenic compositions in anaerobic biogas reactors. Appl. Environ. Microbiol. 2005, 71, 331–338. [Google Scholar] [CrossRef]
- Lee, H.; Rittmann, B.E. Evaluation of Metabolism Using Stoichiometry in Fermentative Biohydrogen. Biotechnol. Bioeng. 2009, 102, 749–758. [Google Scholar] [CrossRef]
Disclaimer/Publisher’s Note: The statements, opinions and data contained in all publications are solely those of the individual author(s) and contributor(s) and not of MDPI and/or the editor(s). MDPI and/or the editor(s) disclaim responsibility for any injury to people or property resulting from any ideas, methods, instructions or products referred to in the content. |
© 2023 by the authors. Licensee MDPI, Basel, Switzerland. This article is an open access article distributed under the terms and conditions of the Creative Commons Attribution (CC BY) license (https://creativecommons.org/licenses/by/4.0/).