
Batch Simultaneous Saccharification and Fermentation of Primary Sludge at Very High Solid Concentrations for Bioethanol Production

Abstract
:1. Introduction
2. Materials and Methods
2.1. Raw Material, Enzymes, and Microorganisms
2.2. Simultaneous Saccharification and Fermentation (SSF)
2.2.1. SSF in Shake Flasks
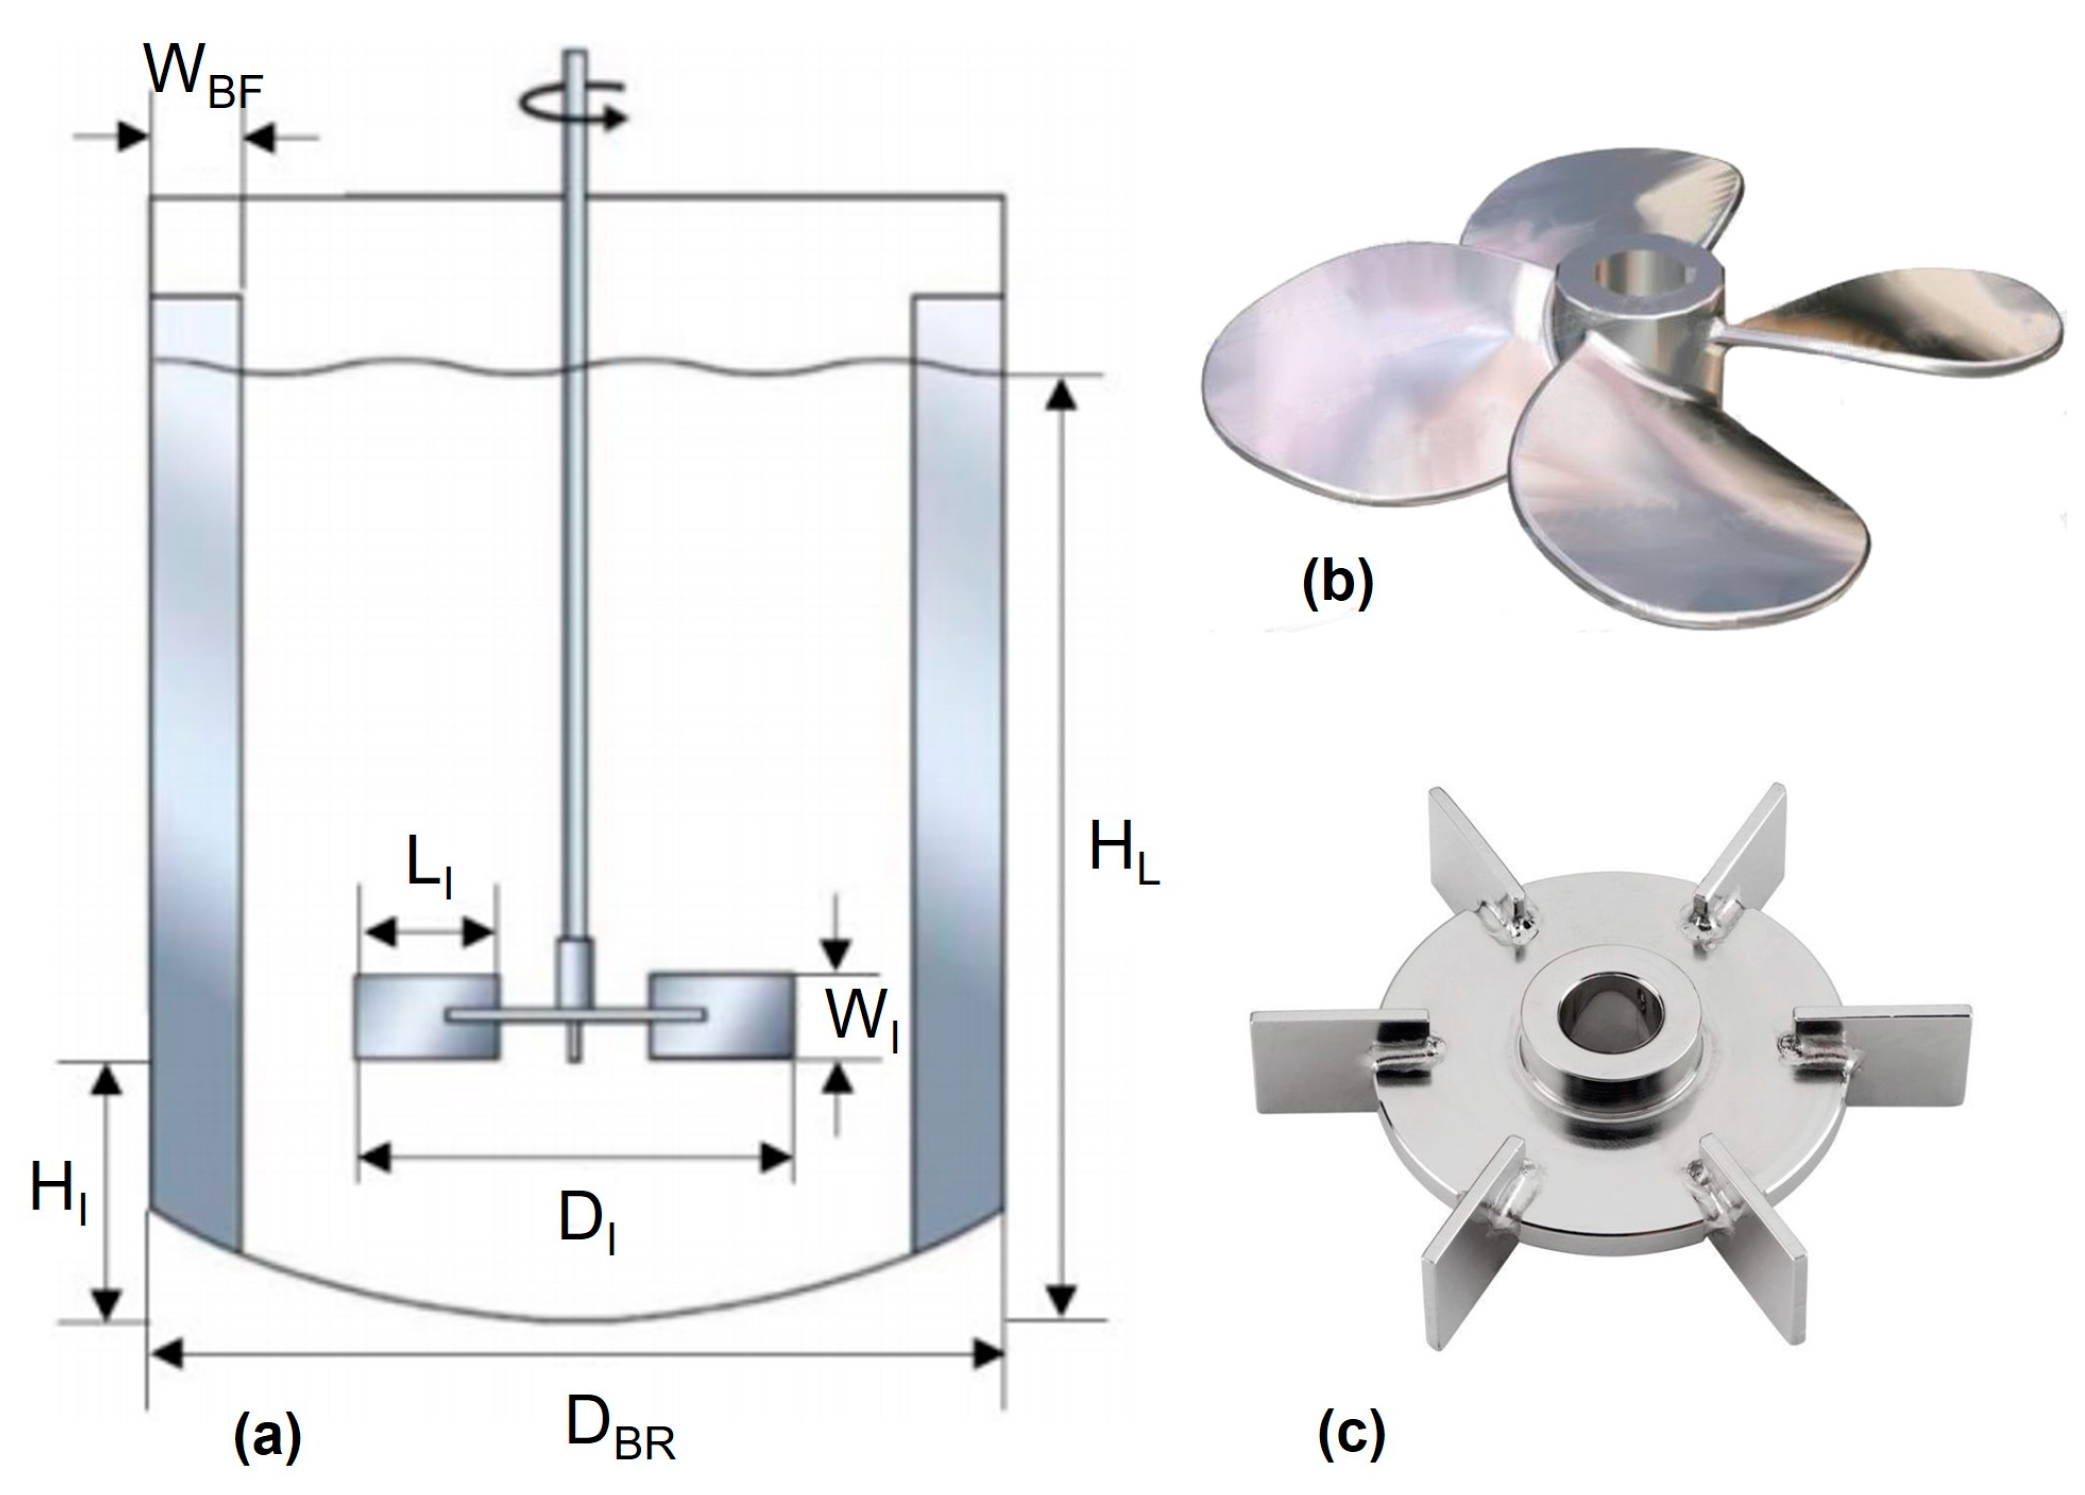
2.2.2. SSF in Stirred Tank Bioreactors
2.3. Preliminary Scale-Up Strategy
2.4. Analytical Procedures
3. Results and Discussion
3.1. PS Characterization
3.2. Batch SSF in Shake Flasks
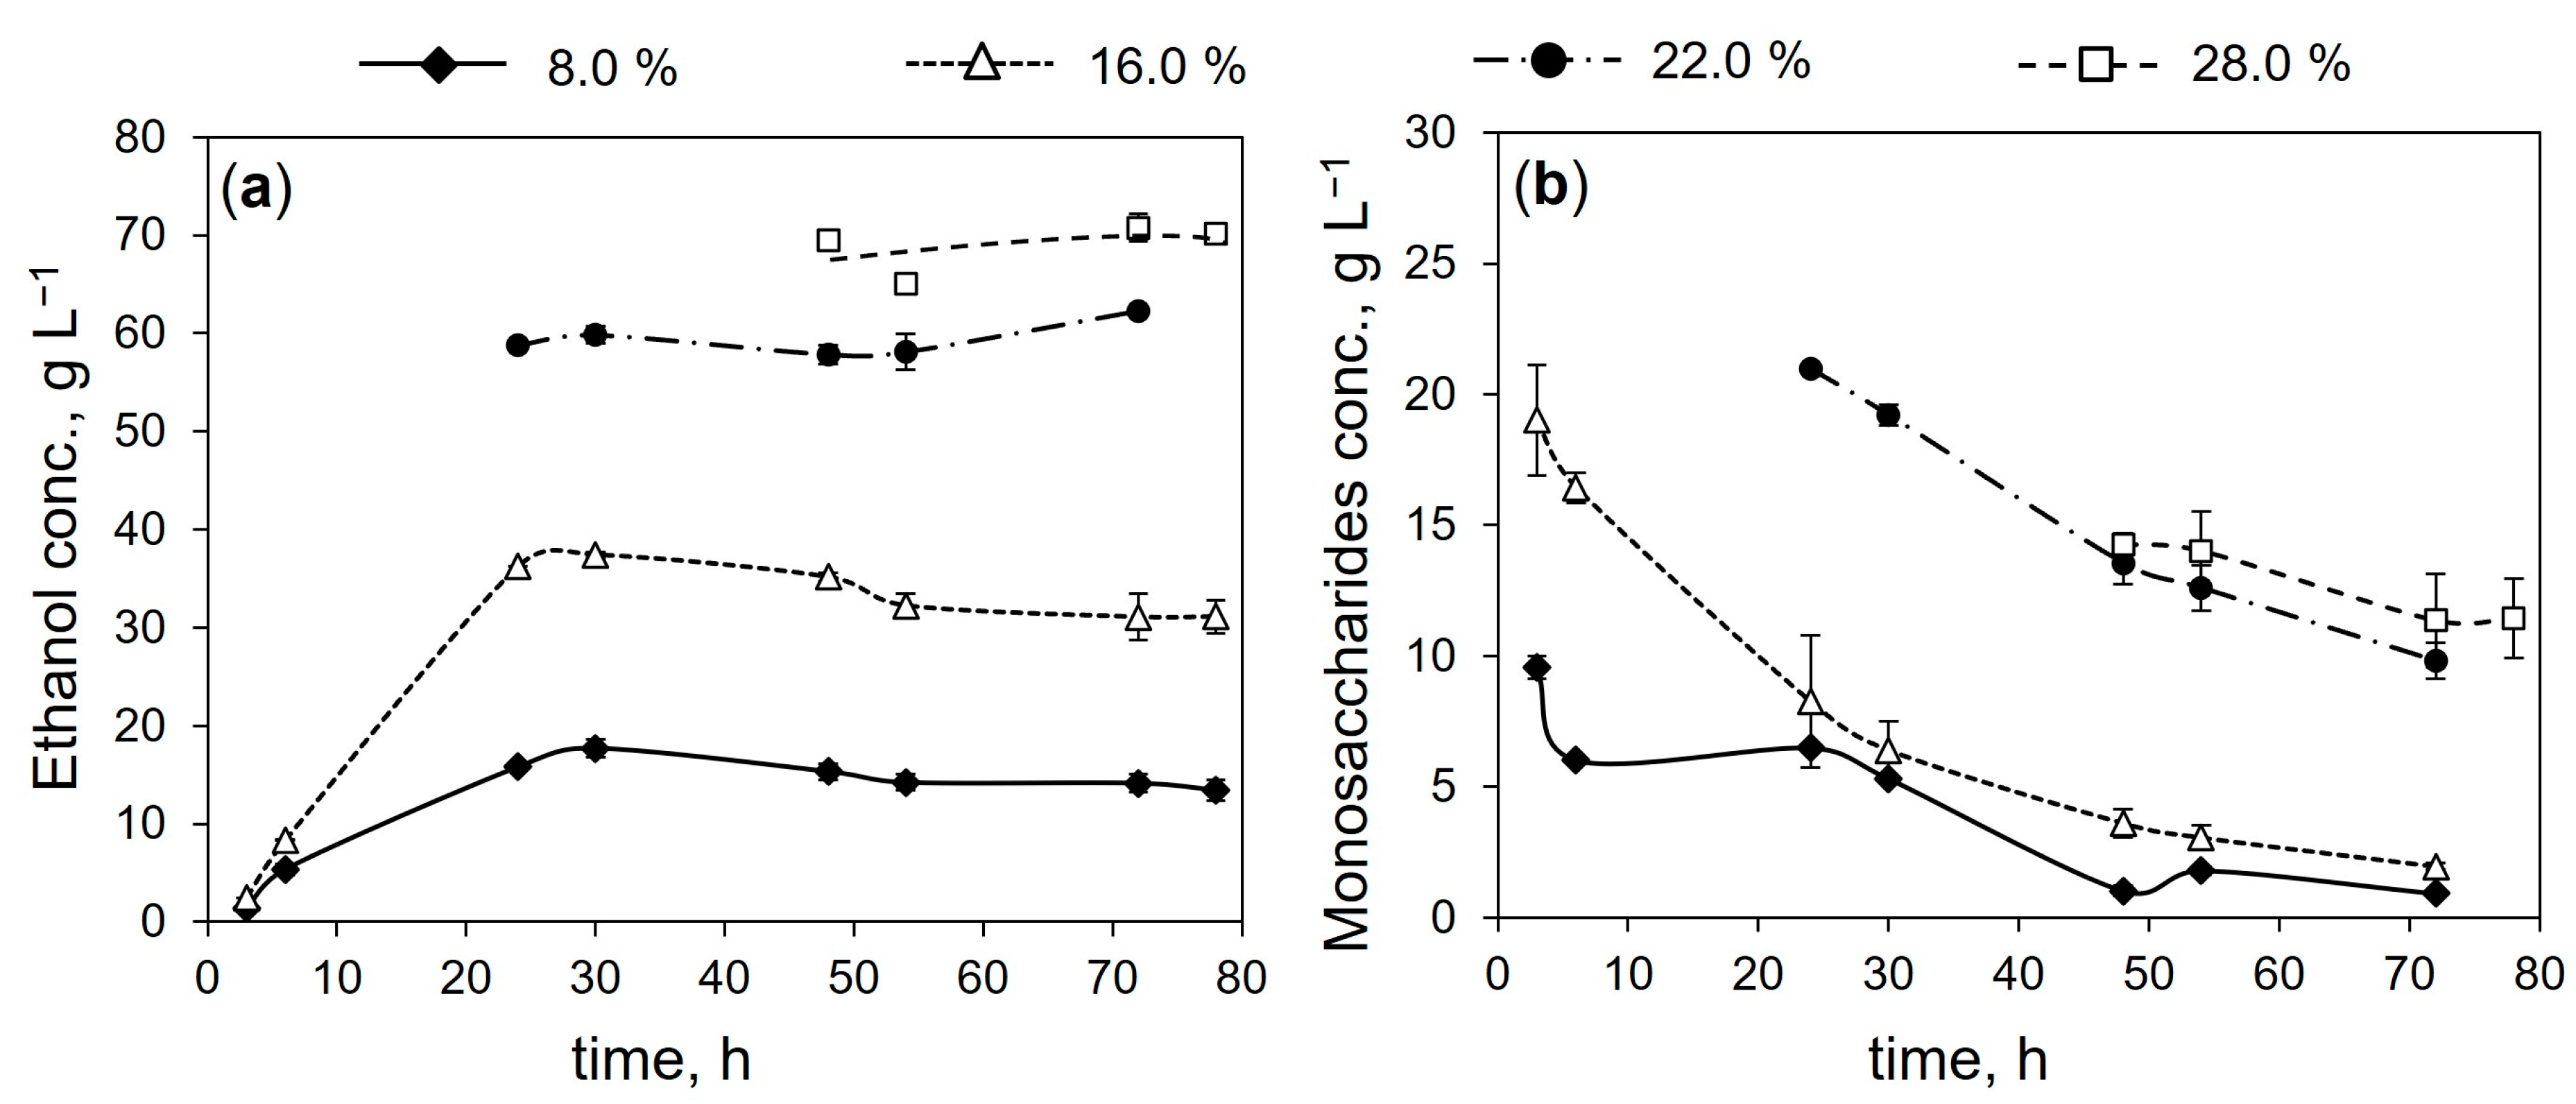
3.2.1. Effect of Initial Solid Concentration
3.2.2. Effect of Different Variables at the Highest Solids Concentration (28.0%)
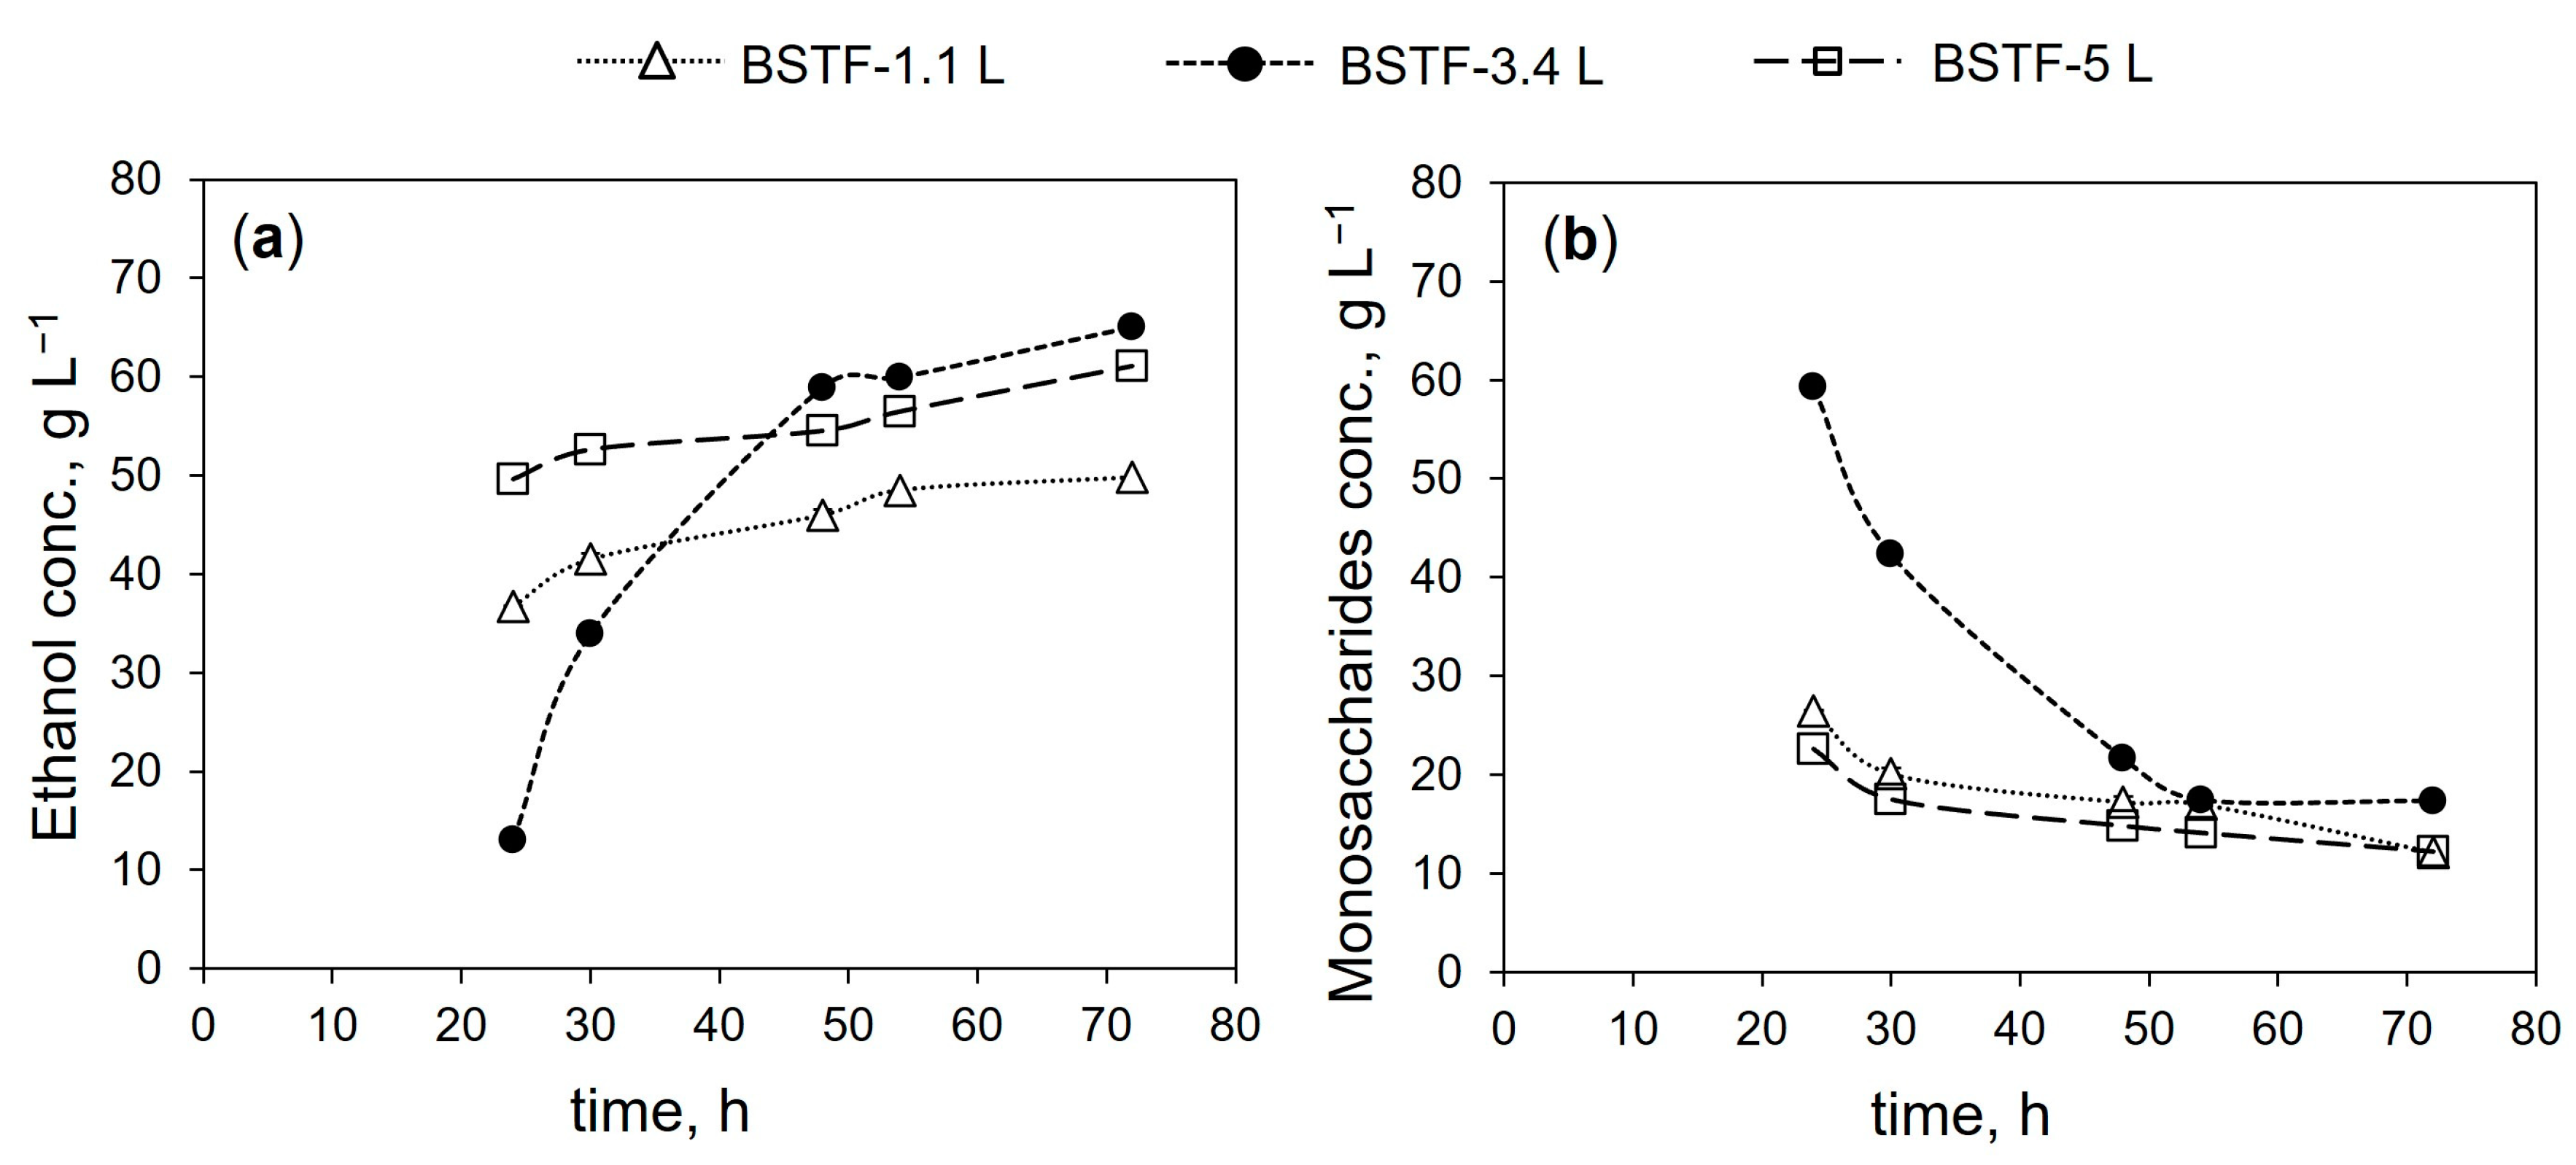
3.3. Batch SSF in Stirred Tank Fermenters
4. Conclusions
Author Contributions
Funding
Institutional Review Board Statement
Informed Consent Statement
Data Availability Statement
Acknowledgments
Conflicts of Interest
References
- Hassan, S.S.; Williams, G.A.; Jaiswal, A.K. Moving towards the second generation of lignocellulosic biorefineries in the EU: Drivers, challenges, and opportunities. Renew. Sustain. Energy Rev. 2019, 101, 590–599. [Google Scholar] [CrossRef]
- Liguori, R.; Amore, A.; Faraco, V. Waste valorization by biotechnological conversion into added value products. Appl. Microbiol. Biotechnol. 2013, 97, 6129–6147. [Google Scholar] [CrossRef] [PubMed]
- Moreau, A.; Montplaisir, D.; Sparling, R.; Barnabé, S. Hydrogen, ethanol and cellulase production from pulp and paper primary sludge by fermentation with Clostridium thermocellum. Biomass Bioenergy 2015, 72, 256–262. [Google Scholar] [CrossRef]
- Saha, N.; Saba, A.; Saha, P.; McGaughy, K.; Franqui-Villanueva, D.; Orts, W.J.; Hart-Cooper, W.M.; Reza, M.T. Hydrothermal Carbonization of Various Paper Mill Sludges: An Observation of Solid Fuel Properties. Energies 2019, 12, 858. [Google Scholar] [CrossRef]
- Wang, L.; Wang, J.G.; Littlewood, J.; Cheng, H.B. Co-production of biorefinery products from kraft paper sludge and agricultural residues: Opportunities and challenges. Green Chem. 2014, 16, 1527–1533. [Google Scholar] [CrossRef]
- Boni, M.R.; D’Aprile, L.; De Casa, G. Environmental quality of primary paper sludge. J. Hazard. Mater. 2004, B108, 125–128. [Google Scholar] [CrossRef]
- Azevedo, A.R.G.; Alexandre, J.; Pessanha, L.S.P.; Manhães, R.S.T.; Brito, J.; Marvila, M.T. Characterizing the paper industry sludge for environmentally-safe disposal. Waste Manag. 2019, 95, 43–52. [Google Scholar] [CrossRef]
- Boshoff, S.; Gottumukkala, L.D.; van Rensburg, E.; Görgens, J. Paper sludge (PS) to bioethanol: Evaluation of virgin and recycle mill sludge for low enzyme, high-solids fermentation. Bioresour. Technol. 2016, 203, 103–111. [Google Scholar] [CrossRef]
- Gottumukkala, L.D.; Haigh, K.; Collard, F.; van Rensburg, E.; Görgens, J. Opportunities and prospects of biorefinery-based valorisation of pulp and paper sludge. Bioresour. Technol. 2016, 215, 37–49. [Google Scholar] [CrossRef]
- Gurram, R.N.; Al-Shannag, M.; Lecher, N.J.; Duncan, S.M.; Singsaas, E.L.; Alkasrawi, M. Bioconversion of paper mill sludge to bioethanol in the presence of accelerants or hydrogen peroxide pretreatment. Bioresour. Technol. 2015, 193, 529–539. [Google Scholar] [CrossRef]
- Mendes, C.V.T.; Rocha, J.M.S.; Carvalho, M.G.V.S. Valorization of Residual Streams from Pulp and Paper Mills: Pretreatment and Bioconversion of Primary Sludge to Bioethanol. Ind. Eng. Chem. Res. 2014, 53, 19398–19404. [Google Scholar] [CrossRef]
- Chen, H.; Venditti, R.; Gonzalez, R.; Phillips, R.; Jameel, H.; Park, S. Economic evaluation of the conversion of industrial paper sludge to ethanol. Energy Econ. 2014, 44, 281–290. [Google Scholar] [CrossRef]
- Dey, P.; Rangarajan, V.; Nayak, J.; Das, D.B.; Wood, S.B. An improved enzymatic pre-hydrolysis strategy for efficient bioconversion of industrial pulp and paper sludge waste to bioethanol using a semi-simultaneous saccharification and fermentation process. Fuel 2021, 294, 120581–120593. [Google Scholar] [CrossRef]
- Kang, L.; Wang, W.; Lee, Y.Y. Bioconversion of Kraft Paper Mill Sludges to Ethanol by SSF and SSCF. Appl. Biochem. Biotechnol. 2010, 161, 53–66. [Google Scholar] [CrossRef]
- Zhang, J.; Lynd, L.R. Ethanol Production from Paper Sludge by Simultaneous Saccharification and Co-Fermentation Using Recombinant Xylose-Fermenting Microorganisms. Biotechnol. Bioeng. 2010, 107, 235–244. [Google Scholar] [CrossRef]
- Kang, L.; Wang, W.; Pallapolu, V.R.; Lee, Y.Y. Enhanced ethanol production from de-ashed paper sludge by simultaneous saccharification and fermentation and simultaneous saccharification and co-fermentation. Bioresources 2011, 6, 3791–3808. [Google Scholar] [CrossRef]
- Chen, H.; Han, Q.; Daniel, K.; Venditti, R.; Jameel, H. Conversion of Industrial Paper Sludge to Ethanol: Fractionation of Sludge and Its Impact. Appl. Biochem. Biotechnol. 2014, 174, 2096–2113. [Google Scholar] [CrossRef]
- Dwiarti, L.; Boonchird, C.; Harashima, S.; Park, E.Y. Simultaneous saccharification and fermentation of paper sludge without pretreatment using cellulase from Acremonium cellulolyticus and thermotolerant Saccharomyces cerevisiae. Biomass Bioenergy 2012, 42, 114–122. [Google Scholar] [CrossRef]
- Mendes, C.V.T.; Rocha, J.M.S.; Carvalho, M.G.V.S.C. Batch and fed-batch simultaneous saccharification and fermentation of primary sludge from pulp and paper mills. Environ. Technol. 2017, 38, 1498–1506. [Google Scholar] [CrossRef]
- Hou, W.; Kan, J.; Bao, J. Rheology evolution of high solids content and highly viscous lignocellulose system in biorefinery fermentations for production of biofuels and biochemicals. Fuel 2019, 253, 1565–1569. [Google Scholar] [CrossRef]
- Elliston, A.; Collins, S.R.A.; Wilson, D.R.; Roberts, I.N.; Waldron, K.W. High concentrations of cellulosic ethanol achieved by fed batch semi simultaneous saccharification and fermentation of waste-paper. Bioresour. Technol. 2013, 134, 117–126. [Google Scholar] [CrossRef] [PubMed]
- Prasetyo, J.; Naruse, K.; Kato, T.; Boonchird, C.; Harashima, S.; Park, E.Y. Bioconversion of paper sludge to biofuel by simultaneous saccharification and fermentation using a cellulase of paper sludge origin and thermotolerant Saccharomyces cerevisiae TJ14. Biotechnol. Biofuels 2011, 4, 35–48. [Google Scholar] [CrossRef] [PubMed]
- Mendes, C.V.T.; Cruz, C.H.G.; Reis, D.F.N.; Carvalho, M.G.V.S.; Rocha, J.M.S. Integrated bioconversion of pulp and paper primary sludge to second generation bioethanol using Saccharomyces cerevisiae ATCC 26602. Bioresor. Technol. 2016, 220, 161–167. [Google Scholar] [CrossRef] [PubMed]
- Ghose, T.K. Measurement of cellulase activities. Pure Appl. Chem. 1987, 59, 257–268. [Google Scholar] [CrossRef]
- Ghose, T.K.; Bisaria, V.S. Measurement of hemicellulase activities, Part 1: Xylanases. Pure Appl. Chem. 1987, 59, 1739–1752. [Google Scholar] [CrossRef]
- Bradford, M.M. A rapid and sensitive method for the quantitation of microgram quantities of protein utilizing the principle of protein-dye binding. Anal. Biochem. 1976, 72, 248–254. [Google Scholar] [CrossRef]
- Pino, M.S.; Rodríguez-Jasso, R.M.; Michelin, M.; Flores-Gallegos, A.C.; Morales-Rodriguez, R.; Teixeira, J.A.; Ruiz, H.A. Bioreactor design for enzymatic hydrolysis of biomass under the biorefinery concept. Chem. Eng. J. 2018, 347, 119–136. [Google Scholar] [CrossRef]
- Imamoglu, E.; Sukan, F.V. Scale-up and kinetic modeling for bioethanol production. Bioresour. Technol. 2013, 144, 311–320. [Google Scholar] [CrossRef]
- Giese, H.; Klöckner, W.; Peña, C.; Galindo, E.; Lotter, S.; Wetzel, K.; Meissner, L.; Peter, C.P.; Büchs, J. Effective shear rates in shake flasks. Chem. Eng. Sci. 2014, 118, 102–113. [Google Scholar] [CrossRef]
- Wilkens, R.J.; Henry, C.; Gates, L.E. How to Scale-up Mixing Processes in Non-Newtonian Fluids. Chem. Eng. Prog. 2003, 99, 44–52. [Google Scholar]
- Sluiter, J.B.; Ruiz, R.O.; Scarlata, C.J.; Sluiter, A.D.; Templeton, D.W. Compositional Analysis of Lignocellulosic Feedstocks. 1. Review and Description of Methods. J. Agric. Food Chem. 2010, 58, 9043–9053. [Google Scholar] [CrossRef] [PubMed]
- TAPPI T 230 om-08. Viscosity of Pulp (Capillary Viscometer Method). Available online: https://webstore.ansi.org/standards/tappi/230om08 (accessed on 15 January 2023).
- Moreira, R.; Mendes, C.V.T.; Banaco, M.B.F.; Carvalho, M.G.V.S.; Portugal, A. New insights in the fractionation of Pinus pinaster wood: Sequential autohydrolysis, soda ethanol organosolv and acidic precipitation. Ind. Crops Prod. 2020, 152, 112499–112511. [Google Scholar] [CrossRef]
- Chemical Analysis and Testing Laboratory. Analytical Procedures (LAPs); National Renewable Energy Laboratory (NREL): Washington, DC, USA, 2008. Available online: https://www.nrel.gov/bioenergy/laboratory-analytical-procedures.html (accessed on 15 January 2023).
- Neiva, D.M.; Gominho, J.; Pereira, H. Modeling and optimization of Eucalyptus globulus bark and wood delignification using response surface methodology. BioRes 2014, 9, 2907–2921. [Google Scholar] [CrossRef]
- Deniz, I.; Imamoglu, E.; Sukan, F.V. Evaluation of scale-up parameters of bioethanol production from Escherichia coli KO11. Turk. J. Biochem. 2015, 40, 74–80. [Google Scholar] [CrossRef]
- Barba, F.C.; Rodríguez-Jasso, R.M.; Sukumaran, R.K.; Ruiz, H.A.R. High-solids loading processing for an integrated lignocellulosic biorefinery: Effects of transport phenomena and rheology—A review. Bioresour. Technol. 2022, 351, 127044–127058. [Google Scholar] [CrossRef]
- Afedzi, A.E.K.; Rattanaporn, K.; Parakulsuksatid, P. Impeller selection for mixing high-solids lignocellulosic biomass in stirred tank bioreactor for ethanol production. Bioresour. Technol. Rep. 2022, 17, 100935–100948. [Google Scholar] [CrossRef]
- Lin, Y.; Wang, D.; Wang, T. Ethanol production from pulp & paper sludge and monosodium glutamate waste liquor by simultaneous saccharification and fermentation in batch condition. Chem. Eng. J. 2012, 192, 31–37. [Google Scholar] [CrossRef]
- Yamashita, Y.; Sasaki, C.; Nakamura, Y. Development of efficient system for ethanol production from paper sludge pretreated by ball mill and phosphoric acid. Carbohydr. Polym. 2010, 79, 250–254. [Google Scholar] [CrossRef]


| NS 22,192 Dosage | Cellic® HTec2 Dosage | |
|---|---|---|
| FPU gCH−1 | Protein Conc. % (w/w) | Protein Conc. % (w/w) |
| 10.0 | 1.00 | 0.00 |
| 8.5 | 0.85 | 0.15 |
| 7.0 | 0.70 | 0.30 |
| 5.0 | 0.50 | 0.50 |
| Dimensions | STBR-1.1L | STBR-3.4L | STBR-5.0L |
|---|---|---|---|
| VL, L | 0.48 | 1.40 | 2.50 |
| Impeller | 4-blade small propeller | 4-blade large propeller | Rushton |
| Number of impellers | 1 | 1 | 2 |
| Blades per impeller | 4 | 4 | 6 |
| DBR, cm | 10 | 17 | 16 |
| DI, cm | 6.0 | 11 | 6.5 |
| HL, cm | 6.1 | 6.2 | 31.8 |
| HI, cm | 1.5 | 2.0 | 5.0 |
| HI-I, cm | n.a. | n.a. | 10 |
| LI, cm | 2.7 | 5.2 | 1.6 |
| WI, cm | 1.9 | 3.3 | 1.5 |
| DBR/DI | 1.7 | 1.5 | 2.5 |
| HL/DI | 1.0 | 0.6 | 4.9 |
| Total Solids % | Initial Sugars 1 g L−1 | [Ethanol]max g L−1 | Time h | PEtOH g L−1 h−1 | YEtOH/sug gEtOH gsug−1 | Y′EtOH/sug % | YEtOH/PS gEtOH gPS−1 |
|---|---|---|---|---|---|---|---|
| 8 | 49 | 17.7 ± 0.8 | 30 | 0.59 | 0.36 | 70.6 | 0.22 |
| 16 | 98 | 37.4 ± 0.5 | 30 | 1.25 | 0.38 | 74.5 | 0.23 |
| 22 | 135 | 59.1 ± 1.0 | 30 | 1.97 | 0.44 | 86.3 | 0.27 |
| 28 | 172 | 69.5 ± 1.4 | 48 | 1.45 | 0.40 | 78.4 | 0.25 |
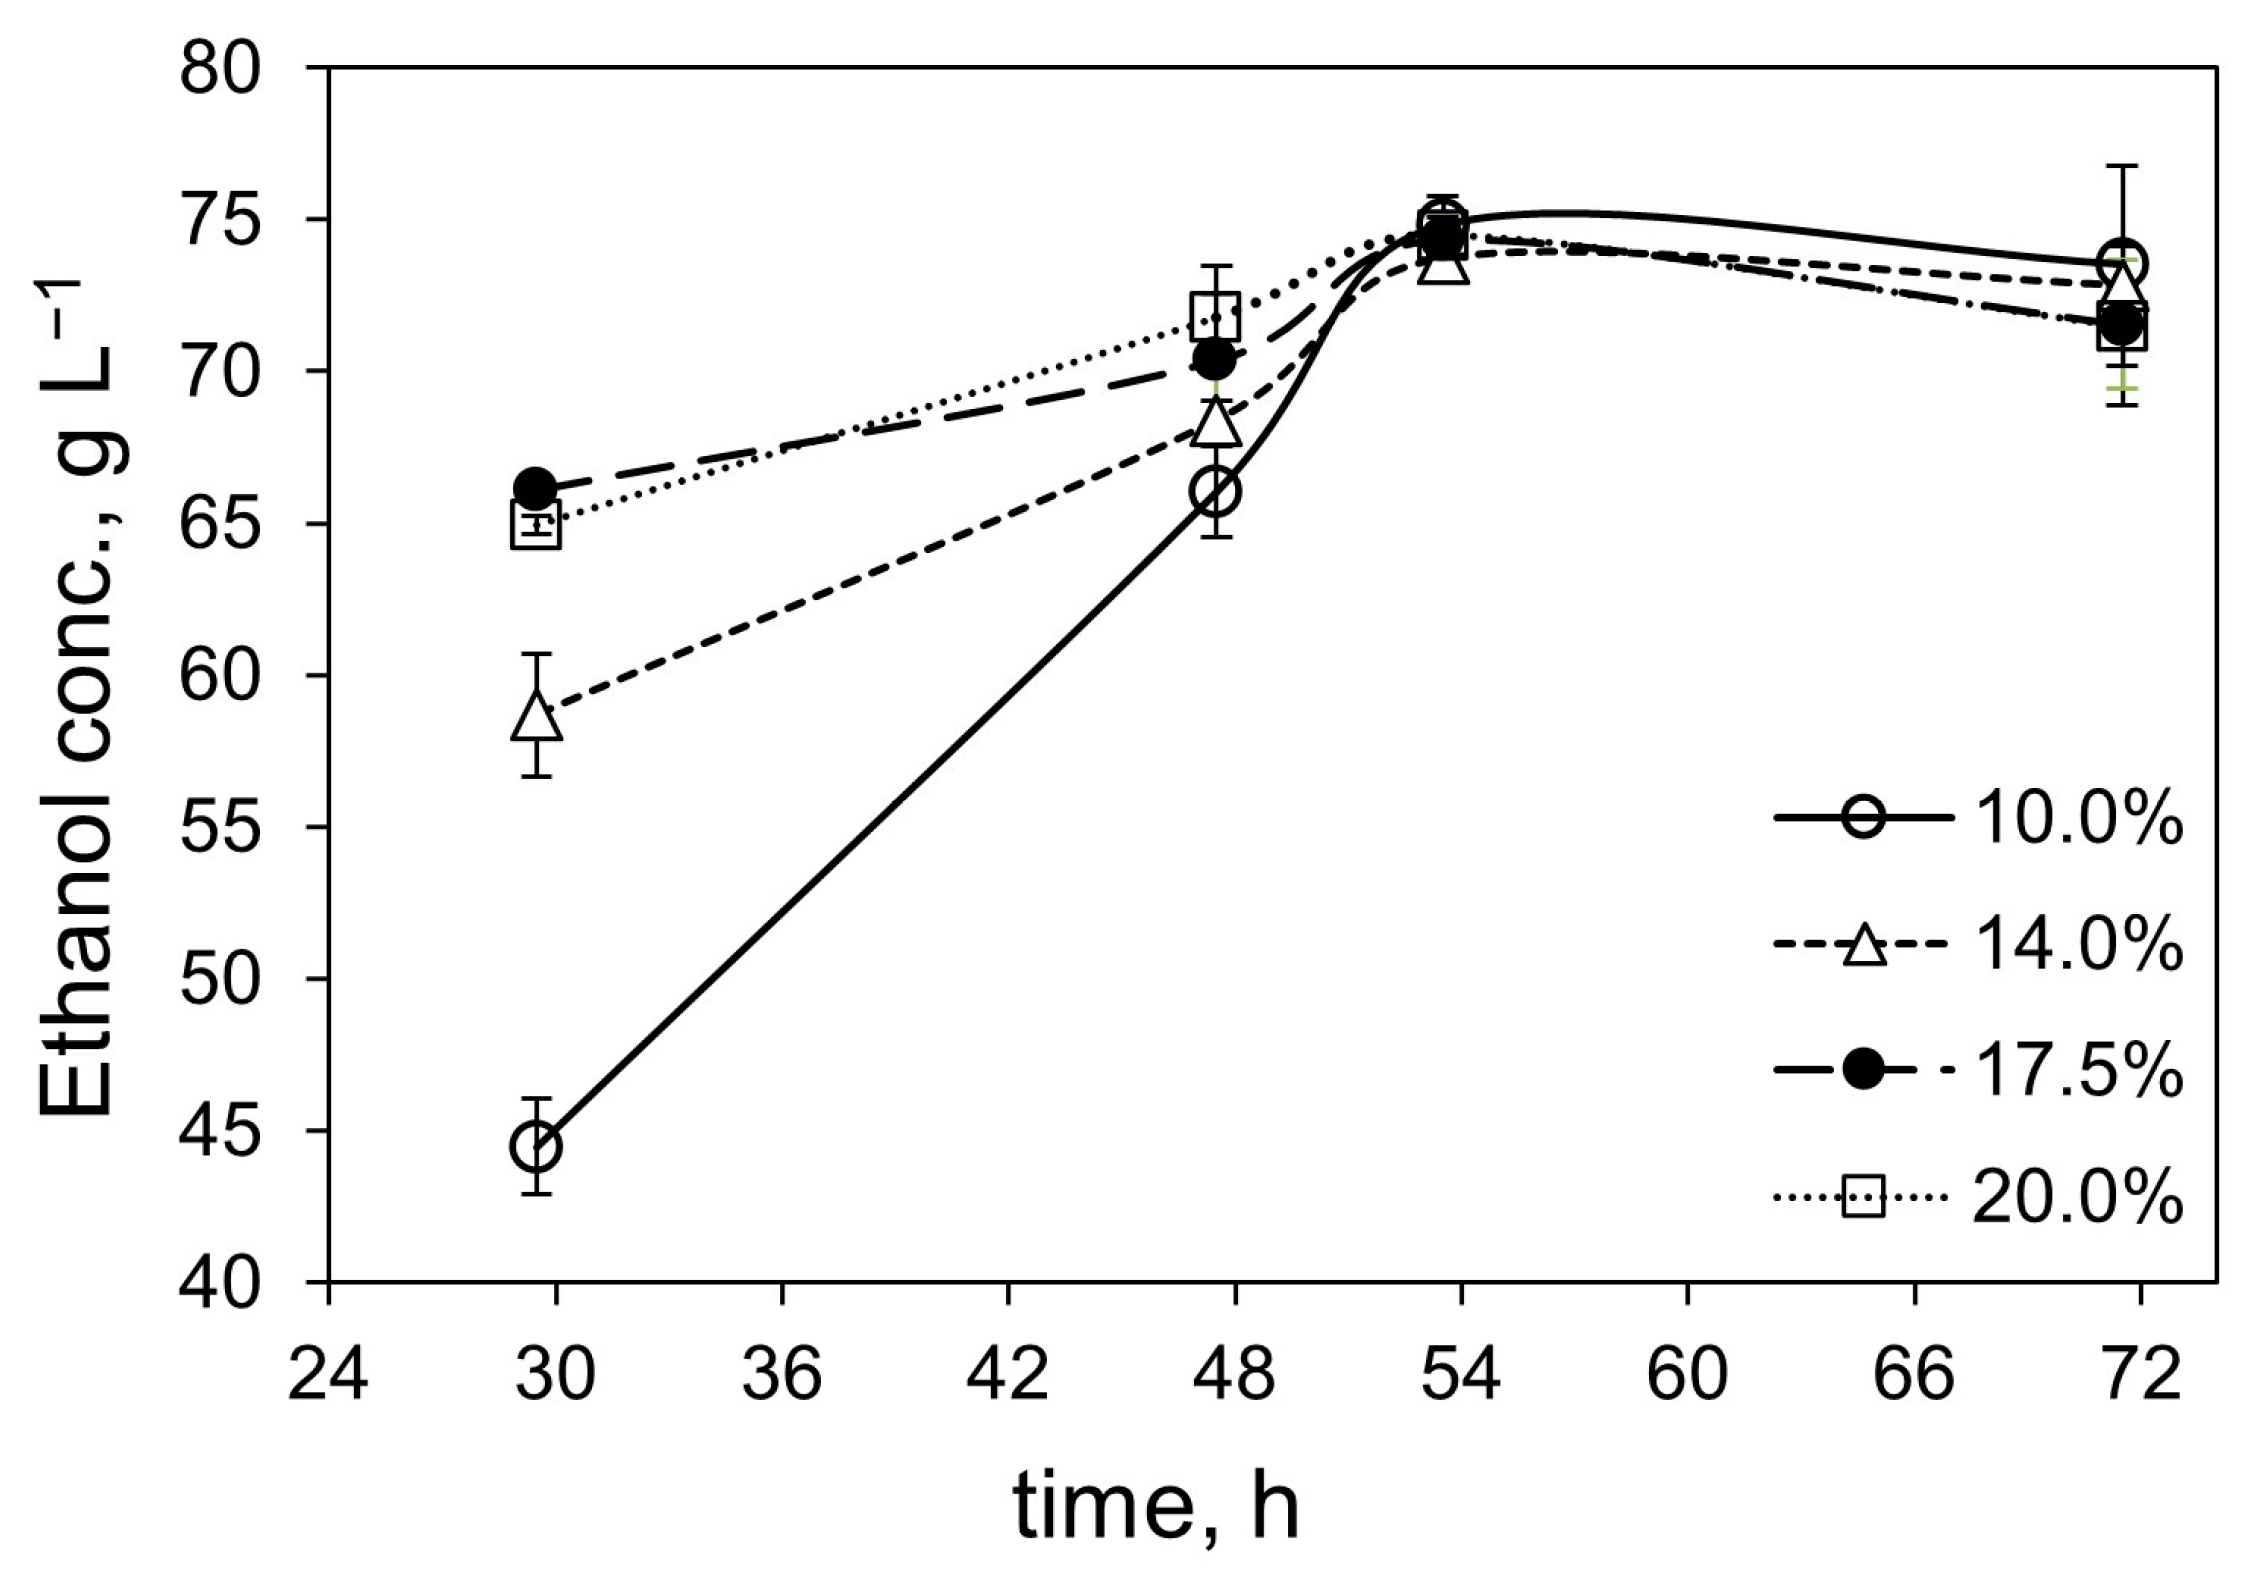
| Inoculum Percentage % | [Ethanol]max g L−1 | PEtOH g L−1 h−1 | YEtOH/sug gEtOH gsug−1 | Y′EtOH/sug % | YEtOH/PS gEtOH gPS−1 |
|---|---|---|---|---|---|
| 10.0 | 74.8 ± 1.0 | 1.40 | 0.44 | 85.3 | 0.27 |
| 14.0 | 73.1 ± 0.7 | 1.37 | 0.43 | 83.3 | 0.26 |
| 17.5 | 74.3 ± 0.8 | 1.39 | 0.43 | 84.7 | 0.27 |
| 20.0 | 74.5 ± 0.6 | 1.39 | 0.43 | 84.9 | 0.27 |
| NS 22,192 Dosage FPU gCH−1 | Cellic® HTec2 Dosage Protein Conc., % (w/w) | [Ethanol]max g L−1 | Time h | PEtOH g L−1 h−1 | YEtOH/sug gEtOH gsug−1 | Y′EtOH/sug % | YEtOH/PS gEtOH gPS−1 |
|---|---|---|---|---|---|---|---|
| 15.0 | 74.3 ± 1.3 | 48 | 1.55 | 0.43 | 84.7 | 0.27 | |
| 10.0 | 0.00 | 73.1 ± 1.5 | 54 | 1.35 | 0.43 | 84.3 | 0.26 |
| 5.0 | 65.9 ± 4.0 | 72 | 0.92 | 0.38 | 75.1 | 0.24 | |
| 8.5 | 0.15 | 73.8 ± 2.1 | 48 | 1.54 | 0.43 | 84.3 | 0.26 |
| 7.0 | 0.30 | 72.0 ± 3.4 | 72 | 1.00 | 0.42 | 82.1 | 0.26 |
| 5.0 | 0.50 | 73.2 ± 1.3 | 72 | 1.02 | 0.43 | 84.3 | 0.26 |
| Bioreactors | Shake Flask | BSTF-1.1L | BSTF-3.4L | BSTF-5L |
|---|---|---|---|---|
| Hydrodynamic parameters 1 | ||||
| Re | 785 | 785 | 1032 | 735 |
| ϑtip (m s−1) | n.a | 0.83 | 0.83 | 0.83 |
| γ (s−1) | 84.6 | 48.4 | 26.4 | 46.7 |
| η (Pa.s) | 0.017 | 0.022 | 0.028 | 0.022 |
| N (rpm) | 150 (orbital) | 264 | 144 | 243 |
| SSF efficiency parameters | ||||
| [Ethanol]max, g L−1 | 59.1 | 48.5 | 59.9 | 54.5 |
| PEtOH, g L−1 h−1 | 1.97 | 1.01 | 1.25 | 1.82 |
| YEtOH/sug, gEtOH gsug−1 | 0.38 | 0.31 | 0.38 | 0.35 |
| Y’EtOH/sug, % | 73.8 | 60.6 | 74.9 | 68.0 |
| YEtOH/PS, gEtOH gPS−1 | 0.27 | 0.22 | 0.27 | 0.25 |
| Substrate | Bioprocess Conditions | Main Results | Refs. |
|---|---|---|---|
| Primary sludge (untreated) | Batch SSF; 38 °C with 22–28% (w/w) solids; cellulase NS 22,192 at 5–15 FPU g−1; S. cerevisiae ATCC 26602 | 54.5–74 g L−1 ethanol; 68–84% yield; 1.00–1.97 g L−1 h−1 productivity | This work |
| Primary paper sludge (pretreated by sequential steam explosion and NaOH) | Fed-batch S-SSCF; 48 h pre-hydrolysis; up to 18% (w/w) solids; crude cellulase at 158 FPU g−1; P. stipitis NCIM 3499 and S. cerevisiae | 42.3 g L−1 ethanol; 0.53 g g−1 yield; 0.71 g L−1 h−1 productivity | [13] |
| Corrugated recycle mill paper sludge | Fed-batch SSF; 37 °C; 27% (w/w) solids; cellulase Optiflow RC 2.0 at 11 FPU g−1; S. cerevisiae MH1000 | 45.5 g L−1 ethanol; 78.2% yield; 0.45 g L−1 h−1 productivity | [8] |
| Shredded copier paper | Fed-batch SSSF; up to 65% (w/v) solids; final effective Accelerase 1500 dosage at 3.7 FPU g−1; S. cerevisiae NCYC 2826 | 91.5 g L−1 ethanol; 54% yield; 0.22 g L−1 h−1 productivity | [21] |
| Pulp and paper sludge | Batch SSF; 40 °C; 6% (w/w) solids; cellulase at 40 U g−1; S. cerevisiae CICC1001 | 42.5 g L−1 ethanol | [39] |
| Paper sludge | Fed-batch SSF; 16% (w/v) solids; non-commercial cellulase at 15 FPU g−1; 20% inoculum S. cerevisiae TJ14 | 40 g L−1 ethanol; 64% yield; 0.52 g L−1 h−1 productivity | [22] |
| Paper sludge (de-ashed) | Fed-batch SSF; 23.1% (w/v) solids; cellulase Spezyme CP at 10 FPU g−1 + β-glucosidase Novozyme 188 at 20 CBU g−1 | 60 g L−1 ethanol; 70% yield; 0.50 g L−1 h−1 productivity | [16] |
| Paper sludge (pretreated by sequential ball milling and phosphoric acid) | Batch SSF; 40 °C; 20% (w/v) solids; cellulase Meicelase at 20 FPU g−1; S. cerevisiae AM12 | 30.5 g L−1 ethanol; 82% yield; 1.27 g L−1 h−1 productivity | [40] |
| Paper sludge | SSCF; 37 °C; 17% (w/v) solids; cellulase Spezyme CP at 10 FPU g−1 + β-glucosidase Novozyme 188 at 60 IU g−1; S. cerevisiae RWB222 | 45 g L−1 ethanol; 76% yield; 0.33 g L−1 h−1 productivity | [15] |
Disclaimer/Publisher’s Note: The statements, opinions and data contained in all publications are solely those of the individual author(s) and contributor(s) and not of MDPI and/or the editor(s). MDPI and/or the editor(s) disclaim responsibility for any injury to people or property resulting from any ideas, methods, instructions or products referred to in the content. |
© 2023 by the authors. Licensee MDPI, Basel, Switzerland. This article is an open access article distributed under the terms and conditions of the Creative Commons Attribution (CC BY) license (https://creativecommons.org/licenses/by/4.0/).
Share and Cite
Mendes, C.V.T.; Rocha, J.M.S.; Carvalho, M.G.V.S. Batch Simultaneous Saccharification and Fermentation of Primary Sludge at Very High Solid Concentrations for Bioethanol Production. Fermentation 2023, 9, 888. https://doi.org/10.3390/fermentation9100888
Mendes CVT, Rocha JMS, Carvalho MGVS. Batch Simultaneous Saccharification and Fermentation of Primary Sludge at Very High Solid Concentrations for Bioethanol Production. Fermentation. 2023; 9(10):888. https://doi.org/10.3390/fermentation9100888
Chicago/Turabian StyleMendes, Cátia V. T., Jorge M. S. Rocha, and M. Graça V. S. Carvalho. 2023. "Batch Simultaneous Saccharification and Fermentation of Primary Sludge at Very High Solid Concentrations for Bioethanol Production" Fermentation 9, no. 10: 888. https://doi.org/10.3390/fermentation9100888
APA StyleMendes, C. V. T., Rocha, J. M. S., & Carvalho, M. G. V. S. (2023). Batch Simultaneous Saccharification and Fermentation of Primary Sludge at Very High Solid Concentrations for Bioethanol Production. Fermentation, 9(10), 888. https://doi.org/10.3390/fermentation9100888