Article

Deeper Insights into the Effect of Humic Acid on Kitchen Waste Anaerobic Digestion: Enzyme Activities, Microbial Community Dynamics, and Key Metabolic Pathways

1
College of Harbour and Coastal Engineering, Jimei University, Xiamen 361021, China
2
Institute of Urban Environment, Chinese Academy of Sciences, Xiamen 361021, China
*
Author to whom correspondence should be addressed.
These authors contributed equally to this work.
Fermentation 2023, 9(10), 881; https://doi.org/10.3390/fermentation9100881
Submission received: 7 September 2023 / Revised: 24 September 2023 / Accepted: 25 September 2023 / Published: 29 September 2023
(This article belongs to the Section Microbial Metabolism, Physiology & Genetics)

Abstract

:
Anaerobic digestion (AD) represents one of the most eco-friendly approaches for recovering the energy from kitchen waste (KW). This study investigated the impact of humic acid (HA) on AD of KW. Batch experiments were conducted using KW as the substrate, with varying HA dosages. The results revealed that an increase in HA dosage led to an inhibition of methanogenic efficiency by 29.51% and a delayed start-up of AD. The HA exhibited dual effects on enzyme activities during AD, inhibiting hydrolytic enzymes while stimulating acidogenic enzymes. This unique interaction ultimately resulted in a significant 12.32% increase in volatile fatty acid production. Furthermore, HA induced the generation of reactive oxygen species and had a discernible impact on the activity of the electron transfer system. A bioinformatics analysis highlighted that HA promoted the abundance of microorganisms with mediated interspecies electron transfer ability, including DMER64 and Methanosaeta, as well as the Firmicutes phylum, while significantly reducing the abundance of Methanobacterium. Moreover, the KEGG pathway analysis revealed a decrease in hydrolysis and methanogenesis-related genes and an increase in acidogenesis-related genes.

1. Introduction

The quantity of kitchen waste (KW) has been progressively rising, reaching 127 million tons in China by 2021 [1]. In comparison to other organic solid wastes, such as activated sludge and swine dung, KW contains more oil, cellulose, and protein [2]. Although sanitary landfills and aerobic composting are viable disposal methods for KW, anaerobic digestion (AD) has garnered significant attention due to its ability to concurrently achieve waste reduction, harmlessness, and resource recovery objectives for KW.
Humic acid (HA) is a type of polymer heterocyclic organic compound that exists abundantly in the natural environment [3]. Macromolecular organics, such as protein, cellulose, and lignin, serve as major precursors for HA formation [4]. Several prominent theories, including the lignin–protein, polyphenol, and sugar–amine condensation theories, have been proposed to elucidate the humification process [5]. HA molecules possess various functional groups, such as hydroxyl, carbonyl, and quinone, which endow electron-donating and electron-accepting capacities to HA [3]. However, limited research has explored the relationship between HA and the electron transport system (ETS) of microorganisms. The impact of HA on AD has also garnered attention in recent years. Certain existing studies have investigated the interaction of HA with AD by incorporating commercial HA or HA analogues into the AD process [6]. Xu et al. discovered that HA can improve the methanogenic activities by 7.3% due to its ability both to enhance mediated interspecies electron transfer (MIET) and to activate acidification enzymes [7]. However, HA inhibited methane production by reducing the hydrolytic and methanogenic efficiency of waste-activated sludge by 38.2% and 52.2%, respectively [3]. This inhibition was also attributed to HA’s competition for the electrons with microorganisms in the AD system based on its high ETC (Electron transfer capacity) value [4]. Moreover, HA concentrations in the range of 1 kg/m3–3 kg/m3 were identified to inhibit methanogenesis in pure cultures of Methanobacterium formicicum, Methanobrevibacter arboriphilicus, and Methanosarcina barkeri [8].
Degli Esposti et al. suggested that submicromolar oxygen concentrations persisted in the medium subsequent to the succinate respiration, where they continued to interact with active functional groups and reduced iron in mitochondria, thereby triggering the generation of reactive oxygen species (ROS), such as superoxide (O2), hydroxyl radical (OH•), and hydrogen peroxide (H2O2) [9]. Lennicke et al. revealed that ROS can result in damage to essential cellular components, including DNA, proteins, and lipids [10]. Notably, the presence of anthraquinones and carboxyl groups in HA enhanced its chemical reactivity, allowing HAs to interact with and transform other chemical species more readily [7]. Chen et al. further discovered a strong association between HA and additional ROS production [11]. However, to date, no studies have examined the impact of HA on ROS metabolism in AD systems. Additionally, further investigation is warranted to explore the effects of HA on the activity of ROS-metabolizing enzymes, such as superoxide dismutase (SOD), as these enzymes serve as the primary defense line of microorganisms against external oxidative damage [12].
It is noteworthy that KW contains abundant precursors of HA, which are inevitably generated during the AD process [5]. Existing research has indicated that KW can be digested into low-molecular-weight compounds with certain characteristics similar to HA, such as polysaccharide-like, aliphatic-like, and amide substances, which then undergo condensation reactions to become attached to the carbon skeleton of HA [13]. Furthermore, KW can also modify the existing extracellular HA through bridging protein condensation within AD systems [5]. However, given that AD is a dynamic and continuous process characterized by ongoing changes, further exploration is required to comprehend the effects of different HA doses on each stage of the AD process. To address knowledge gaps, batch experiments were conducted using KW as the substrate, biogas slurry (BS) as the inoculum, and various doses of HA as an additive. The focus was initially on methane production and short-chain fatty acids (VFAs). Subsequently, the effects of HA exposure were elucidated by the evolution of key enzyme activities during AD. Thirdly, the relative production of ROS and the activity of SOD with varying HA doses were also investigated. Finally, the impact of extra HA on the microbial community and functional metabolic pathways in the AD process was investigated using Illumina HiSeq 2500 sequencing of the 16S rRNA gene.

2. Materials and Methods

2.1. Substrate and Inoculum

The BS adopted as the inoculum was obtained from a KW anaerobic tank (Xiamen Renewable Energy Co., Ltd., Xiamen, China). With the hydraulic retention time of 30 d, 150 tons of fresh waste from Xiamen was fed daily to generate biogas. To ensure substrate homogeneity, the batch experiments were conducted with laboratory-prepared KW, which included 35% rice, 12% lean meat, 14% soybeans, 4% fish meat and 35% vegetables (including equal amounts of celery, spinach, and cabbage) according to our previous research [14]. The composition and characteristics of the BS and KW are presented in Table 1. The HA obtained from Shanghai Yuanye Bio-Technology (YYHA) was adopted to replace the genuine HA in the BS (BSHA). The similarity and differences between YYHA and BSHA (Figure S1), as well as the changes in HA before and after the AD process (Figure S2), were evaluated via a Fourier-transform infrared (FTIR) spectrometer (IS10, Thermo Elemental, Waltham, MA, USA) and fluorescence spectrometer (F-4600, HITACHI, Tokyo, Japan). The quantitative analysis performed with the FTIR spectrometer identification software OMNIC revealed a high similarity of 89.31% between YYHA and BSHA in the wavenumber range from 500 to 3500 cm−1, indicating that YYHA can effectively serve as a replacement for BSHA [3].

2.2. Design of Batch Anaerobic Digestion Experiments

The substrate-to-inoculum ratio was set at 1:3 based on volatile solids, which was determined to be the optimal ratio in our previous research [15]. Six different operation groups were established with varying ratios of HA to volatile solid (VS), including 0% (CK), 5% (R1), 10% (R2), 20% (R3), 50% (R4), and 100% (R5). Following inoculation, the pH of the fermentation broth was adjusted to 7.0 ± 0.2 by 5M NaOH. Each anaerobic bottle was purged with N2 for 5 min to reduce the oxidation–reduction potential of the fermentation broth to less than 300 mV, and immediately sealed to ensure anaerobic conditions. A 5 L air sampling bag was utilized to collect the generated biogas. All bottles were placed in a constant temperature water bath shaker (SHA-BA; Shanghai, China) at 37 ± 1°C, with the subsequent continuous shaking at a speed of 120 rpm. Each group was technically replicated three times with a working volume of 500 mL. Samples were collected on the 1st, 5th, 9th, and 15th day, and stored in a −20 °C freezer for future analysis.

2.3. Physical, Chemical, and Enzymatic Analysis

The composition of biogas in the air sampling bags, primarily consisting of H2, CO2, and CH4, was analyzed via gas chromatography (GC9790II, FULI instruments, Taizhou, Zhejiang, China) equipped with a thermal conductivity detector [15]. Prior to the VFAs analysis, the digestates was thawed and diluted with ultrapure water 200 times, centrifuged at 10,000 rpm for 10 min at room temperature, filtered through a 0.22 μm filter membrane, and acidified with 5 M hydrochloric acid to maintain a pH of approximately 1.5. VFAs, including acetate, propionate, iso-butyrate, n-butyrate, n-valeric, and iso-valeric acids, were determined via ion chromatography (ICS-3000, DIONEX, Tokyo, Japan). The water content, total solids, and VS were measured according to standard methods [16]. pH, salinity, and electrical conductivity values were determined using the Hash parameter portable water quality analyzer (HQ40d; HACH; Loveland, Colorado, USA). The concentration of ROS was detected and analyzed according to Wei et al. [17] (Text S1), while the ETS activity was analyzed by iodonitrotetrazolium chloride as described by Lizama et al. [18].
The enzyme activities associated with the AD process, including amylase, lipase, protease, and cellulase during the hydrolytic phase, as well as acetate kinase (AK), CoA transferase (CoAT), and butyrate kinase (BK) during the acidogenic phase, were selected for analysis. The activity of SOD was also assessed. All of the aforementioned indicators were measured by utilizing the specific kits in accordance with the manufacturer’s instructions (Sino Best Biological Technology Co., Ltd., Shanghai, China). Among them, the activities of amylase, lipase, protease, cellulase, and SOD were detected by micro-method, and the activities of AK, BU, and CoAT were detected by enzyme-linked immunosorbent assay.

2.4. High-Throughput 16S rRNA Gene Sequencing and Analysis

All groups in the batch experiments were included for analysis. The samples designated for DNA extraction were collected at the end of the experiments. The DNA extraction was performed by utilizing the HiPure Soil DNA Kits (Magen, Guangzhou, China) according to the manufacturer’s instructions. The V3–V4 region of the bacterial 16S rRNA gene was amplified by PCR utilizing the primers 341F (5′-CCTACGGGNGGCWG-CAG-3′) and 806R (5′-GGACTACHVGGGTWTCTA AT-3′), while the V4–V5 region of the archaeal 16S rRNA gene was amplified with primers Arch519F (5′-CAGCMGCCGCGGTAA-3′) and Arch915R (5′-GTGCTCCCCCGC CAATTCCT-3′). After purification, the amplified products were subjected to sequencing on an Illumina platform (Novaseq 6000; Gene Denovo, Guangzhou, China). Microbial community composition and microbial metabolic functions were investigated through the Omicsmart platform (http://www.omicsmart.com, accessed on 1 November 2022) and the KEGG databases based on the obtained results.

2.5. Statistical Analysis

All experiments were performed in triplicate. The results are presented as the mean ± standard deviation (standard deviation of the technical triplicates). Data processing and analysis of variance (ANOVA) were conducted by utilizing Microsoft Excel 2019 and SPSS 25, respectively. Statistical significance was determined at a significance level of p-value < 0.05. The graphical representations were generated via Origin 2019.

3. Results and Discussion

3.1. Impact of HA on KW Anaerobic Digestion Performance

A series of batch experiments were conducted to investigate the cumulative methane yield, daily methane yield, and methanogenic inhibition rate of the AD system at different HA dosages. Additionally, the concentrations of VFAs and key enzyme activities in the fermentation broth were measured on the 1st, 5th, 9th, and 15th days of the experiment.

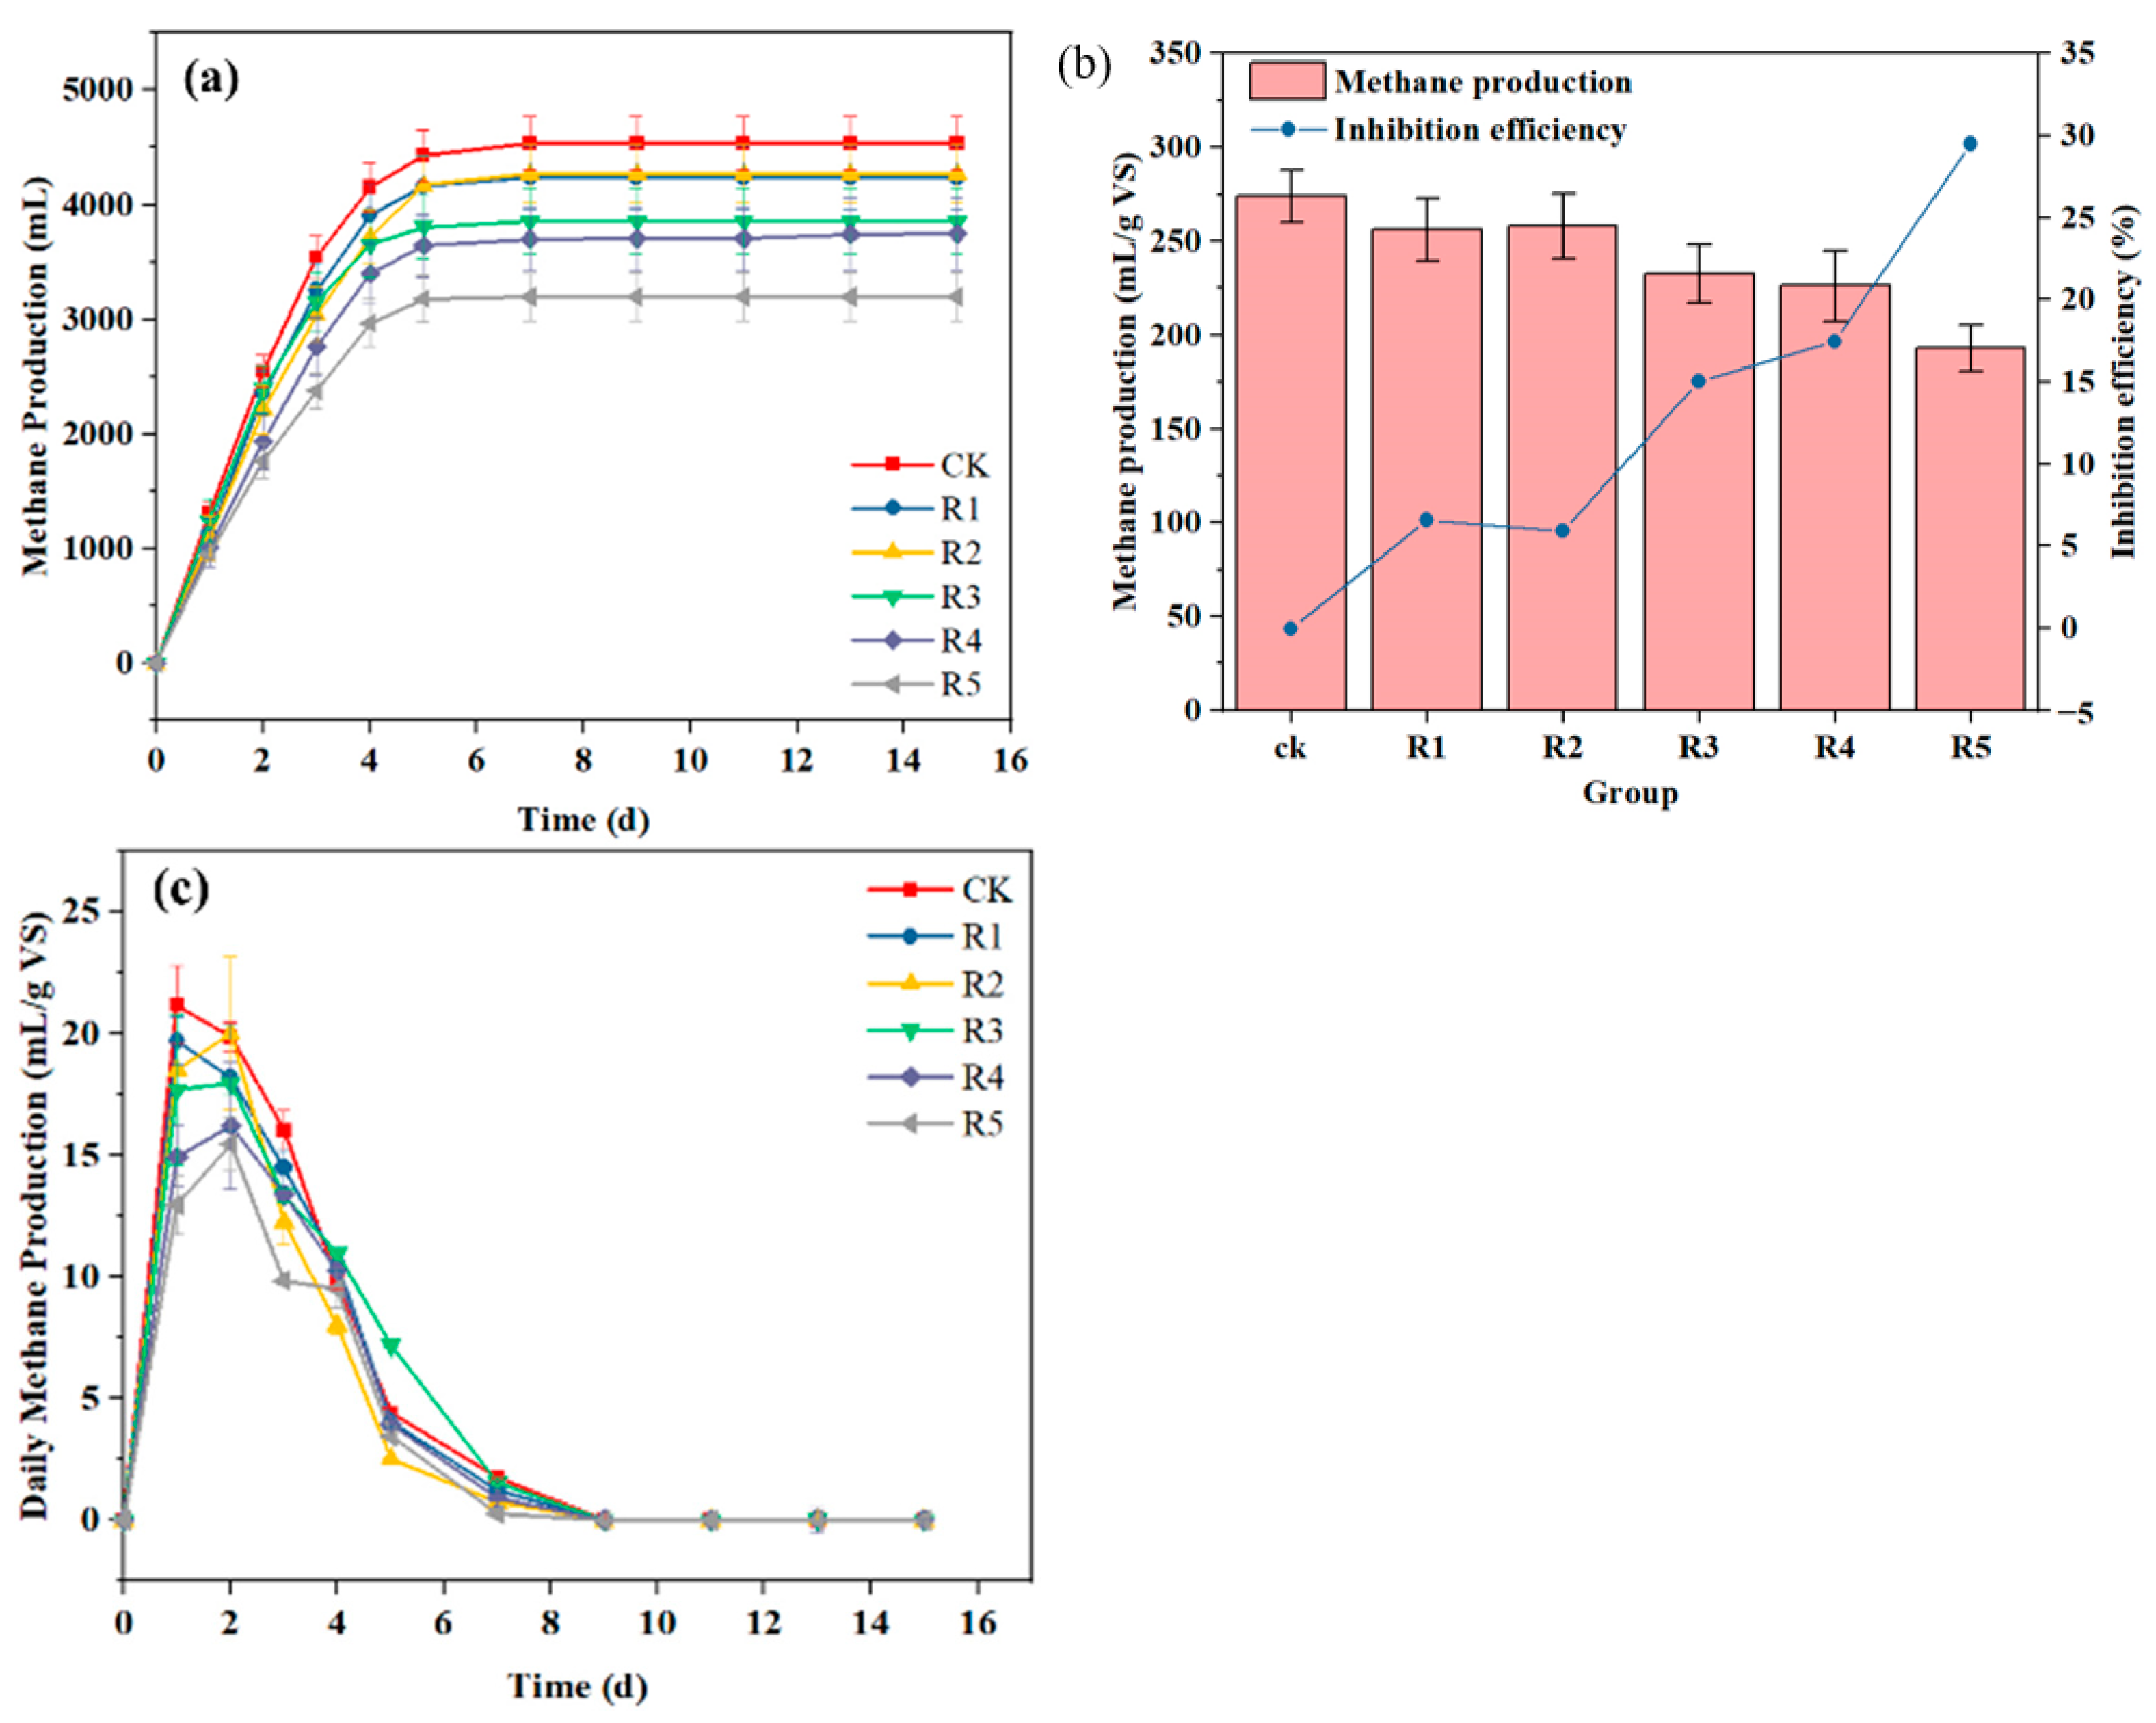
3.1.1. Methanogenic Performance Analysis

The cumulative methane production exhibited rapid growth during the initial five days of the AD in all groups, followed by a slower methane production stage. The cumulative methane production for the CK, R1, R2, R3, R4, and R5 was 4537.99, 4239.16, 4269.25, 3856.31, 3745.37, and 3198.74 mL, respectively (Figure 1a). This indicated that the HA resulted in methanogenic inhibition, with a maximum inhibition rate of 29.51%, and the inhibition rate increased with higher HA dosages (Figure 1b). Figure 1c illustrates the changes in daily methane production under different HA dosages. It was observed that the daily CH4 yield decreased with increasing HA dosage. Moreover, although higher HA dosages did not result in a longer lag time for methanogenesis, they did delay the onset of the peak methane production rate. The maximum methane production rates for the CK and R1 occurred on the 1st day of AD, at 21.16 and 19.69 mL/g VS, respectively. Subsequently, the methane production rates for the CK and R1 decreased due to substrate depletion. In contrast, the maximum methane production rates for the R3, R4, and R5 occurred on the 2nd day of AD, at 20.02, 17.68, and 16.21 mL/g VS, respectively. This could be attributed to the presence of HA, which decreased the efficiency of the hydrolysis stage [3], resulting in a lack of substrate for methane production by methanogens in the R2, R3, R4, and R5 on the 1st day of fermentation, thereby delaying the appearance of the maximum methane production rate [3]. Khadem et al. demonstrated that the anthraquinone group present in HA exerted bactericidal effects on microorganisms, with higher HA dosages resulting in lower methanogen activities [8]. Additionally, Liu et al. discovered that HA impeded the regeneration of ferredoxin by competing for electrons, thereby hindering the conversion of acetyl-CoA to 5-methylene-THMPT [19]. This disruption ultimately affected the acetate metabolism pathway.

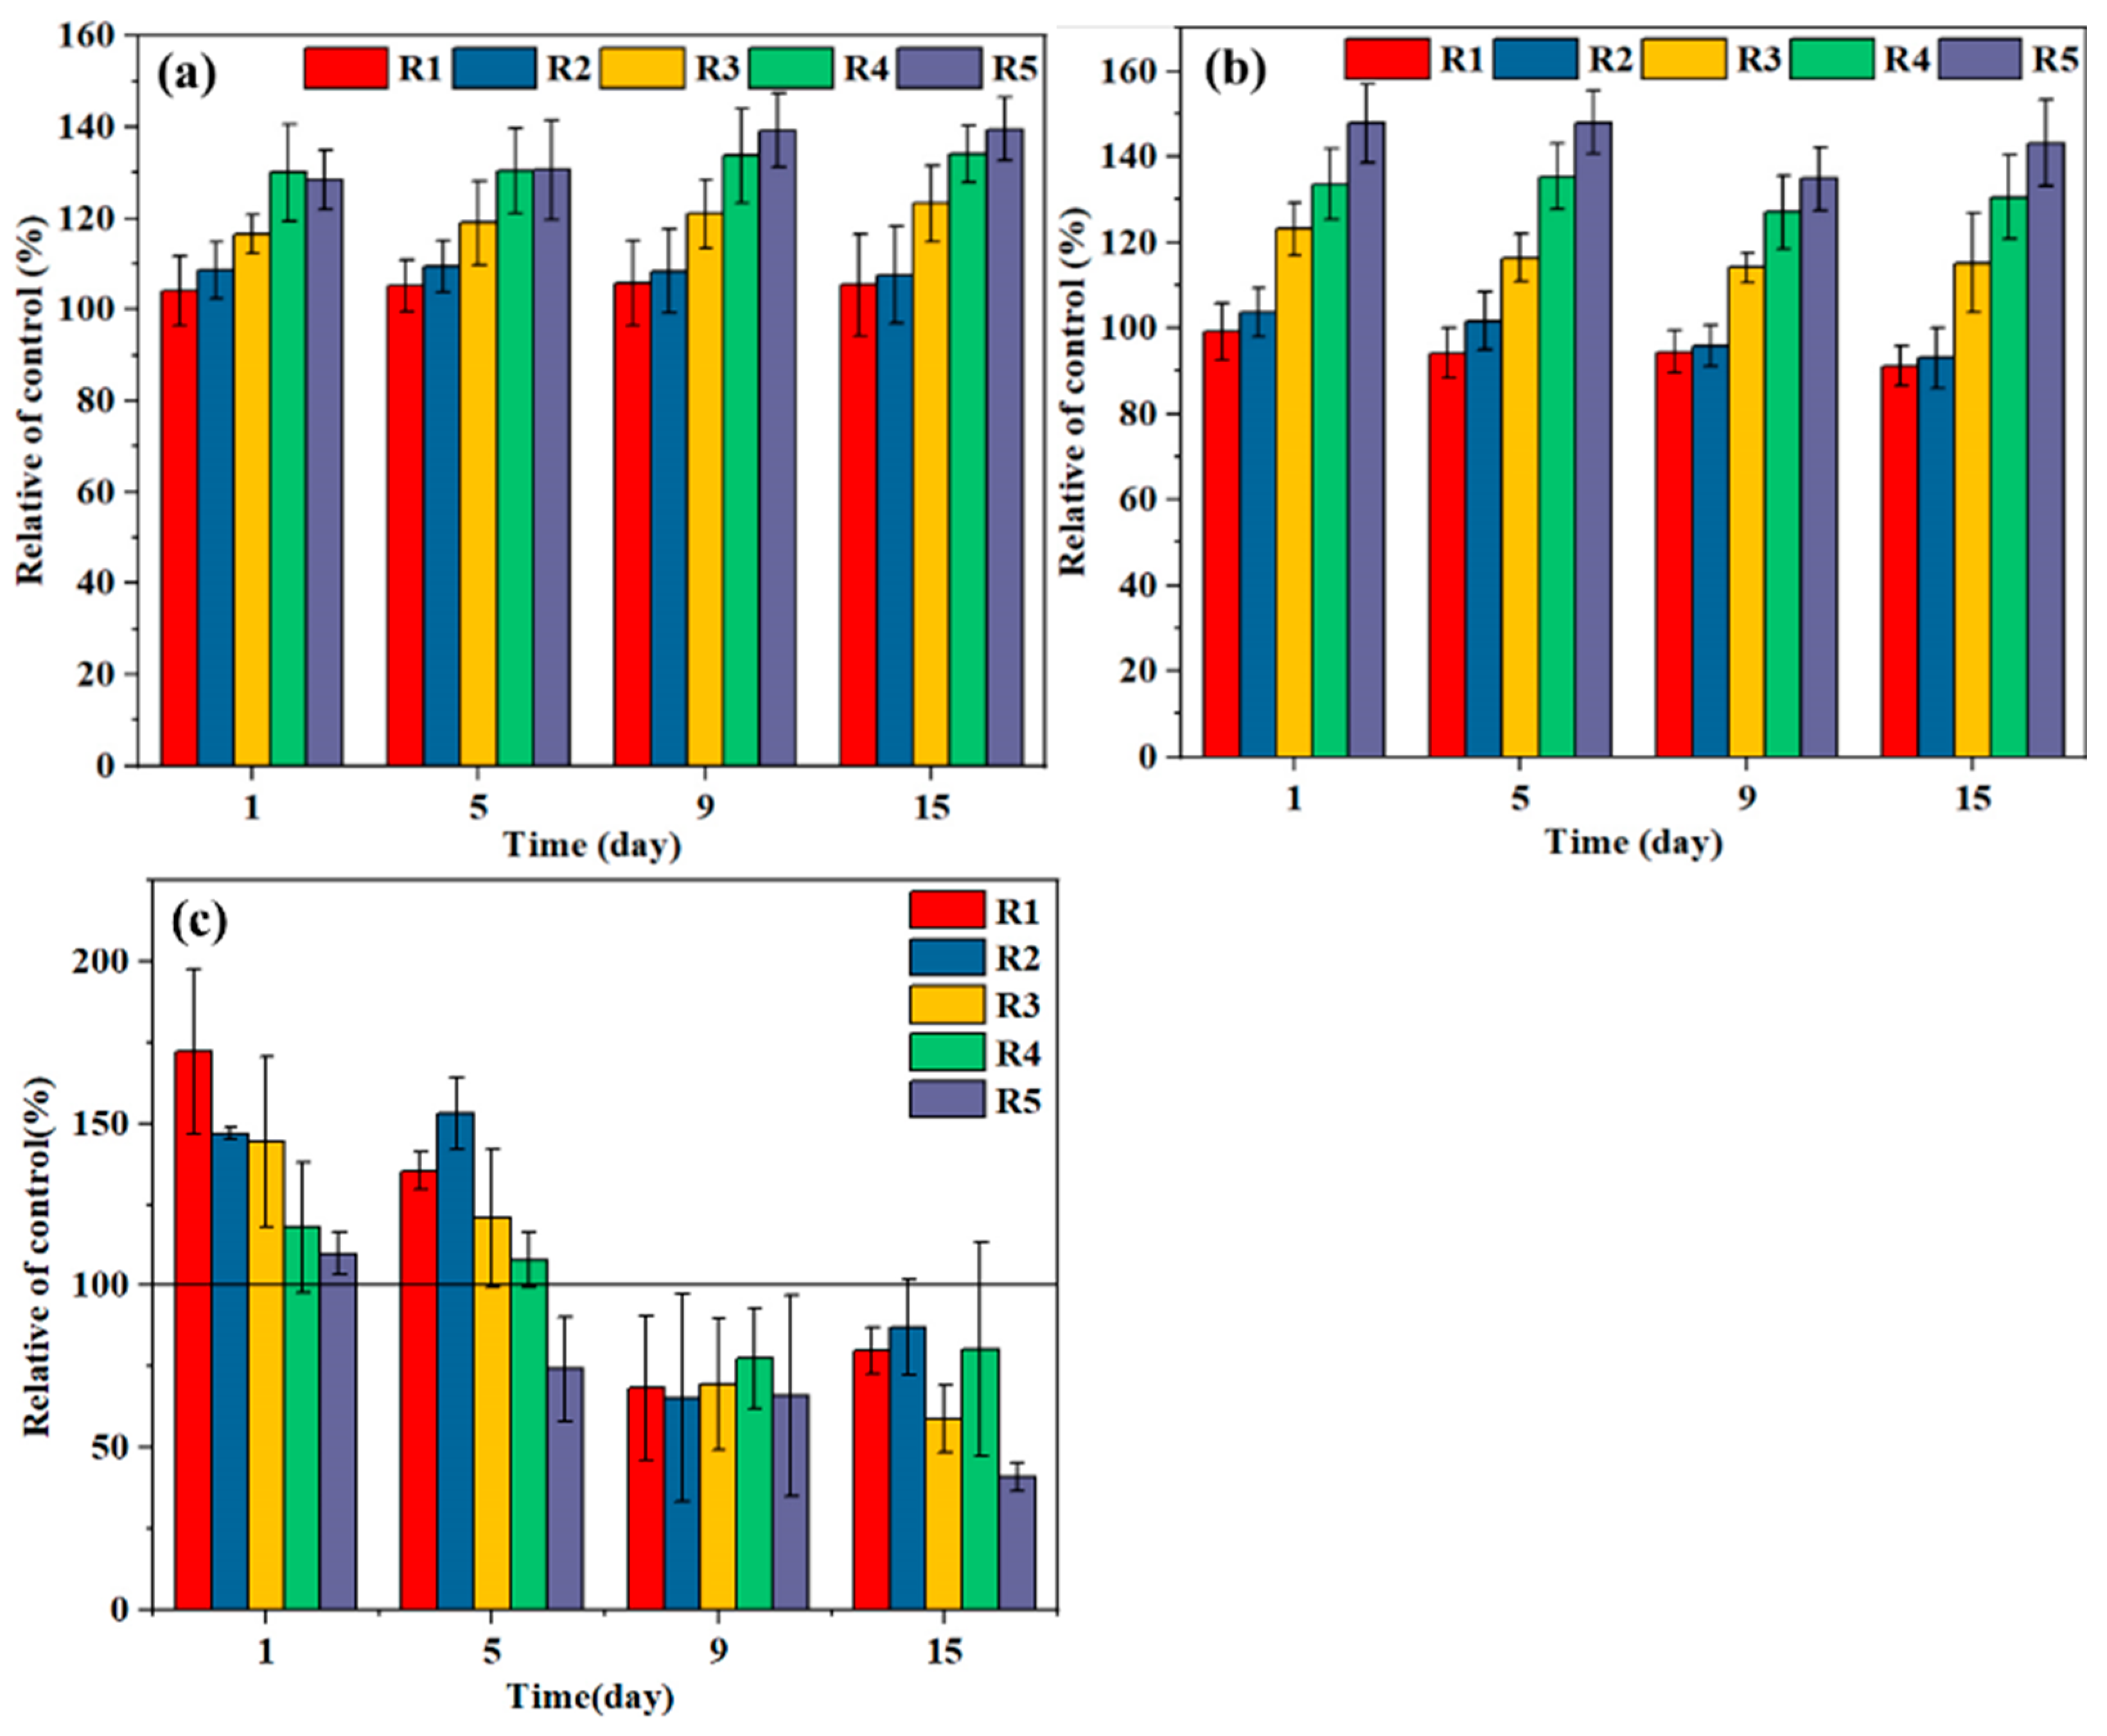
3.1.2. Activities of Key Enzymes and Production of VFAs in AD

The hydrolysis step plays a crucial role in the AD process as it provides essential substrates such as glucose, amino acids, and glycerol for subsequent stages. HA has been observed to decrease the hydrolytic efficiency of the AD system by reducing the activities of hydrolase, resulting in a decrease in available substrate for the acidification and methanogenic phases. Among the enzymes involved in the AD process of KW, protease and amylase exhibited the highest activities. In the CK, the activities of protease and amylase were measured at 107.80 and 106.93 U/mL, respectively, indicating that starch and protein hydrolysis were the primary pathways (Figure 2a,b). These findings aligned with the study conducted by Li et al. [15].
Among the four hydrolytic enzymes analyzed, the protease indicated the highest sensitivity to the presence of HA, which was consistent with the results reported by Piccolo [20]. For example, on the 1st day of AD with an HA:VS ratio of 100%, the activities of protease, α-amylase, cellulase, and lipase decreased by 43.21%, 33.97%, 33.73%, and 8.62%, respectively, compared to the CK. This observation can be attributed to the enhanced sensitivities of proteases to the net sweeping effect, adsorption, and charge neutralization exhibited by HA flocs. As a result, proteases were extensively captured by HA flocs, hindering their binding with substrates [21]. The activities of lipase and cellulase were minimally affected by low HA supplementation (Figure 2c,d). This can be attributed to a decrease in the binding affinity between HA and the enzymes when the electrostatic repulsion between HA and negatively charged enzymes surpasses the hydrophobic interactions of HA with the enzymes [22]. However, at high concentrations of HA (R4 and R5), the activities of lipase and cellulase were reduced. This could be due to the formation of irreversible covalent bonds between HA and the enzymes, resulting in permanent inactivation of lipase and cellulase [22].
Furthermore, as the AD process progressed, the enzymatic activities of protease, amylase, and lipase gradually decreased. This can be attributed to several factors. (i) Microorganisms reduced the secretion of hydrolases as the substrate was consumed, resulting in a decrease in their ability to gain energy through the utilization of secreted enzymes [23]. (ii) Binding of humic substances to the bacterial cell wall disrupted the integrity of the cell membrane and hindered essential cellular transport processes [24]. Unlike other hydrolytic enzymes that reached their peak activities on the 1st day of AD, cellulase exhibited higher activity only on the 5th day of the AD process, which was consistent with the findings of Parawira et al. [25]. Bansal et al. [26] demonstrated, through model-guided experiments, that the high substrate concentration in the early stages of AD caused cellulase blocking, resulting in a decrease in cellulase accessibility. However, this reversible blocking phenomenon disappeared as the substrate concentration decreased, thereby allowing the recovery of cellulase activity.
The acidification step represents the second phase of the AD process, during which various substrates, such as glucose, amino acids, and glycerol, can undergo conversion into VFAs, including acetate, propionate, and butyrate, through different metabolic pathways [27]. As depicted in Figure 2h, the effect of HA dosage on VFA production followed a hormesis pattern, whereby higher HA:VS ratios resulted in decreased VFA production, while lower HA:VS ratios exhibited a promotive effect on VFA production [28]. On the 1st day of AD, the concentrations of acetate, propionate, and butyrate in R1, R2, and R3 were significantly higher compared to the CK, with total VFA concentrations being 2.05%, 10.24%, and 12.32% higher than the CK, respectively. Moreover, the CK, R1, R2, and R3 reached their peak VFA concentrations on the 1st day of AD, indicating their higher efficiency in acidification processes. In contrast, the R4 and R5 reached their maximum VFA concentrations on the 5th day of AD, suggesting that excessively high doses of HA resulted in a reduced rate of acidogenesis. As the AD process progressed, the concentrations of VFAs gradually decreased, indicating that the presence of HA did not lead to acid accumulation. This observation provided evidence that the reduction in methane production was not caused by acid accumulation but rather by the presence of additional HA (Figure 1a).
Figure 2e–g illustrate the temporal changes in the activities of AK, CoAT, and BK. The results revealed that HA exhibited an inhibitory effect on AK activity until the 9th day, after which it demonstrated a hormesis effect, with the maximum promotion rate reaching 12.91% in the R3. Interestingly, HA dosing facilitated the activities of both CoAT and BK. Specifically, the activity of CoAT presented a positive correlation with the HA concentration (p < 0.05). On the 15th day, the activity of CoAT in the R5 was 29.10% higher compared to the CK. Although lower HA dosages (R1 and R2) did not significantly affect the activity of BK, higher concentrations of HA (R3, R4, and R5) significantly promoted the activity of BK (p < 0.05), achieving a promotion rate of up to 13.51% in the R3 on the 5th day.

3.2. ROS Production and Related Enzyme Activities

ROS can impede microbial activities and reduce the efficiency of AD by damaging the cell structure. In this study, the relative concentrations of ROS in the supernatant of the fermentation broth and the microbial cells, as well as the relative activity of SOD, were continuously monitored. This was conducted to investigate the impact of HA on the oxidative stress capacity of the AD system.

ROS Production and SOD Activities

ROS can arise from both biological (e.g., unbalanced metabolism or stress) and non-biological processes (e.g., photooxidation of colored dissolved organic matter) [29]. It has been demonstrated that humic substances can enhance the production of ROS [11]. As shown in Figure 3a,b, the production of ROS exhibited a positive correlation with the HA dosage, indicating that HA stimulated the AD system to generate more ROS. This could be due to the interaction between HA and lipid molecules in the cell membrane, leading to lipid peroxidation and the formation of lipid free radicals (-ROOH), which, subsequently, triggered ROS production [30]. On the 5th day, the relative concentration of ROS in R1 and R2 reached their peaks at 105.29% and 109.48%, respectively. However, in R3, R4, and R5, the relative concentration of ROS continued to increase, with the highest relative concentrations observed at the end of the fermentation period, reaching 123.25%, 134.11%, and 139.60%, respectively (Figure 3a). Shah et al. demonstrated that high-molecular-weight HA with a high degree of humification produced more ROS compared to low-molecular-weight HA [31], and the AD process was observed to enhance the humification process (Figure S3). Regarding the relative concentration of intracellular ROS (Figure 3b), it steadily decreased in R1 and R2, reaching the lowest relative concentrations on the 15th day at 91.11% and 93.08%, respectively. In other groups, the relative concentration of intracellular ROS decreased from the 1st to the 9th day and then rebounded afterwards.
In AD systems, the presence of ROS can lead to the deterioration of cellular structures, resulting in decreased microbial activities and reduced AD efficiency [32]. The activity of SOD has been commonly applied as an indicator to assess the toxicity of pollutants, and an increase in its activity can indicate that microorganisms are experiencing oxidative damage from external sources [12]. As depicted in Figure 3c, the presence of HA in the initial five days of AD was identified to enhance the relative activity of SOD, while excessive dosages of HA diminished this promotion. On the 1st day of AD, the relative SOD activity in R1 reached its peak at 172.29%, while it was only 109.84% in R5. This could be attributed to the fact that the addition of HA boosts the self-repairing capacity of microorganisms by promoting the production of ROS, though these capabilities are insufficient to offset the excessive ROS. From the 9th to the 15th day of AD, the relative activity of SOD decreased, possibly because of the pH of the digestates no longer being suitable for the SOD’s optimal pH of 6.5 [33], or excessive HA dosages leading to a reduction in the gene abundance of SOD (Figure S4).

3.3. Relationship between ETS Activity and SCOD

The activity of ETS is a reliable indicator of microbial activities in AD systems, as it correlates closely with the microorganisms’ ability to degrade organic substances [34]. Generally, the ETS activity increases in direct proportion to the availability of organic matter in an AD system. Figure 4 illustrates the relationship between ETS activity and the proportion of soluble chemical oxygen demand (SCOD) in total chemical oxygen demand (TCOD) under different HA dosages. The proportion of SCOD in TCOD gradually decreased throughout the AD process, which can be attributed to microbial metabolism. Furthermore, the proportion of SCOD in TCOD was inversely correlated with the concentration of HA, which can be attributed to the inhibitory effect of HA on hydrolytic enzyme activities (Figure 2a–d). HA exhibited a negative correlation with ETS activity. On the 1st day of AD, ETS activity reached a maximum of 358.50 mg/(g·h) (CK) and a minimum of 130.59 mg/(g·h) (R5), with an inhibition rate of 63.57%. Baek et al. has suggested that higher ETS activity can effectively promote the synthesis and metabolism of propionate and butyrate, which contributes to the stability of AD systems [35]. This is attributed to the higher Gibbs free energy required for the conversion of propionate and butyrate to acetate and hydrogen gas (T = 35 °C, pH = 7, 1 atm; CH3CH2COOH + 2H2O→CH3COOH + 2H2↑ + 2CO2↑, ΔG0 = 76.1 kJ/mol; CH3CH2CH2COOH + 2H2O→2CH3 COOH + 2H2↑, ΔG0 = 48.1 kJ/mol). However, the presence of HA significantly inhibited ETS activity (Figure 4a), leading to the accumulation of propionate and butyrate (Figure 2h). Additionally, Zhao et al. have discovered that the decrease in ETS activity can result in electron leakage from the electron transport chain, promoting the generation of ROS [36]. This finding aligned with the proportional relationship observed in Figure 3a,b between ROS production and HA dosage.

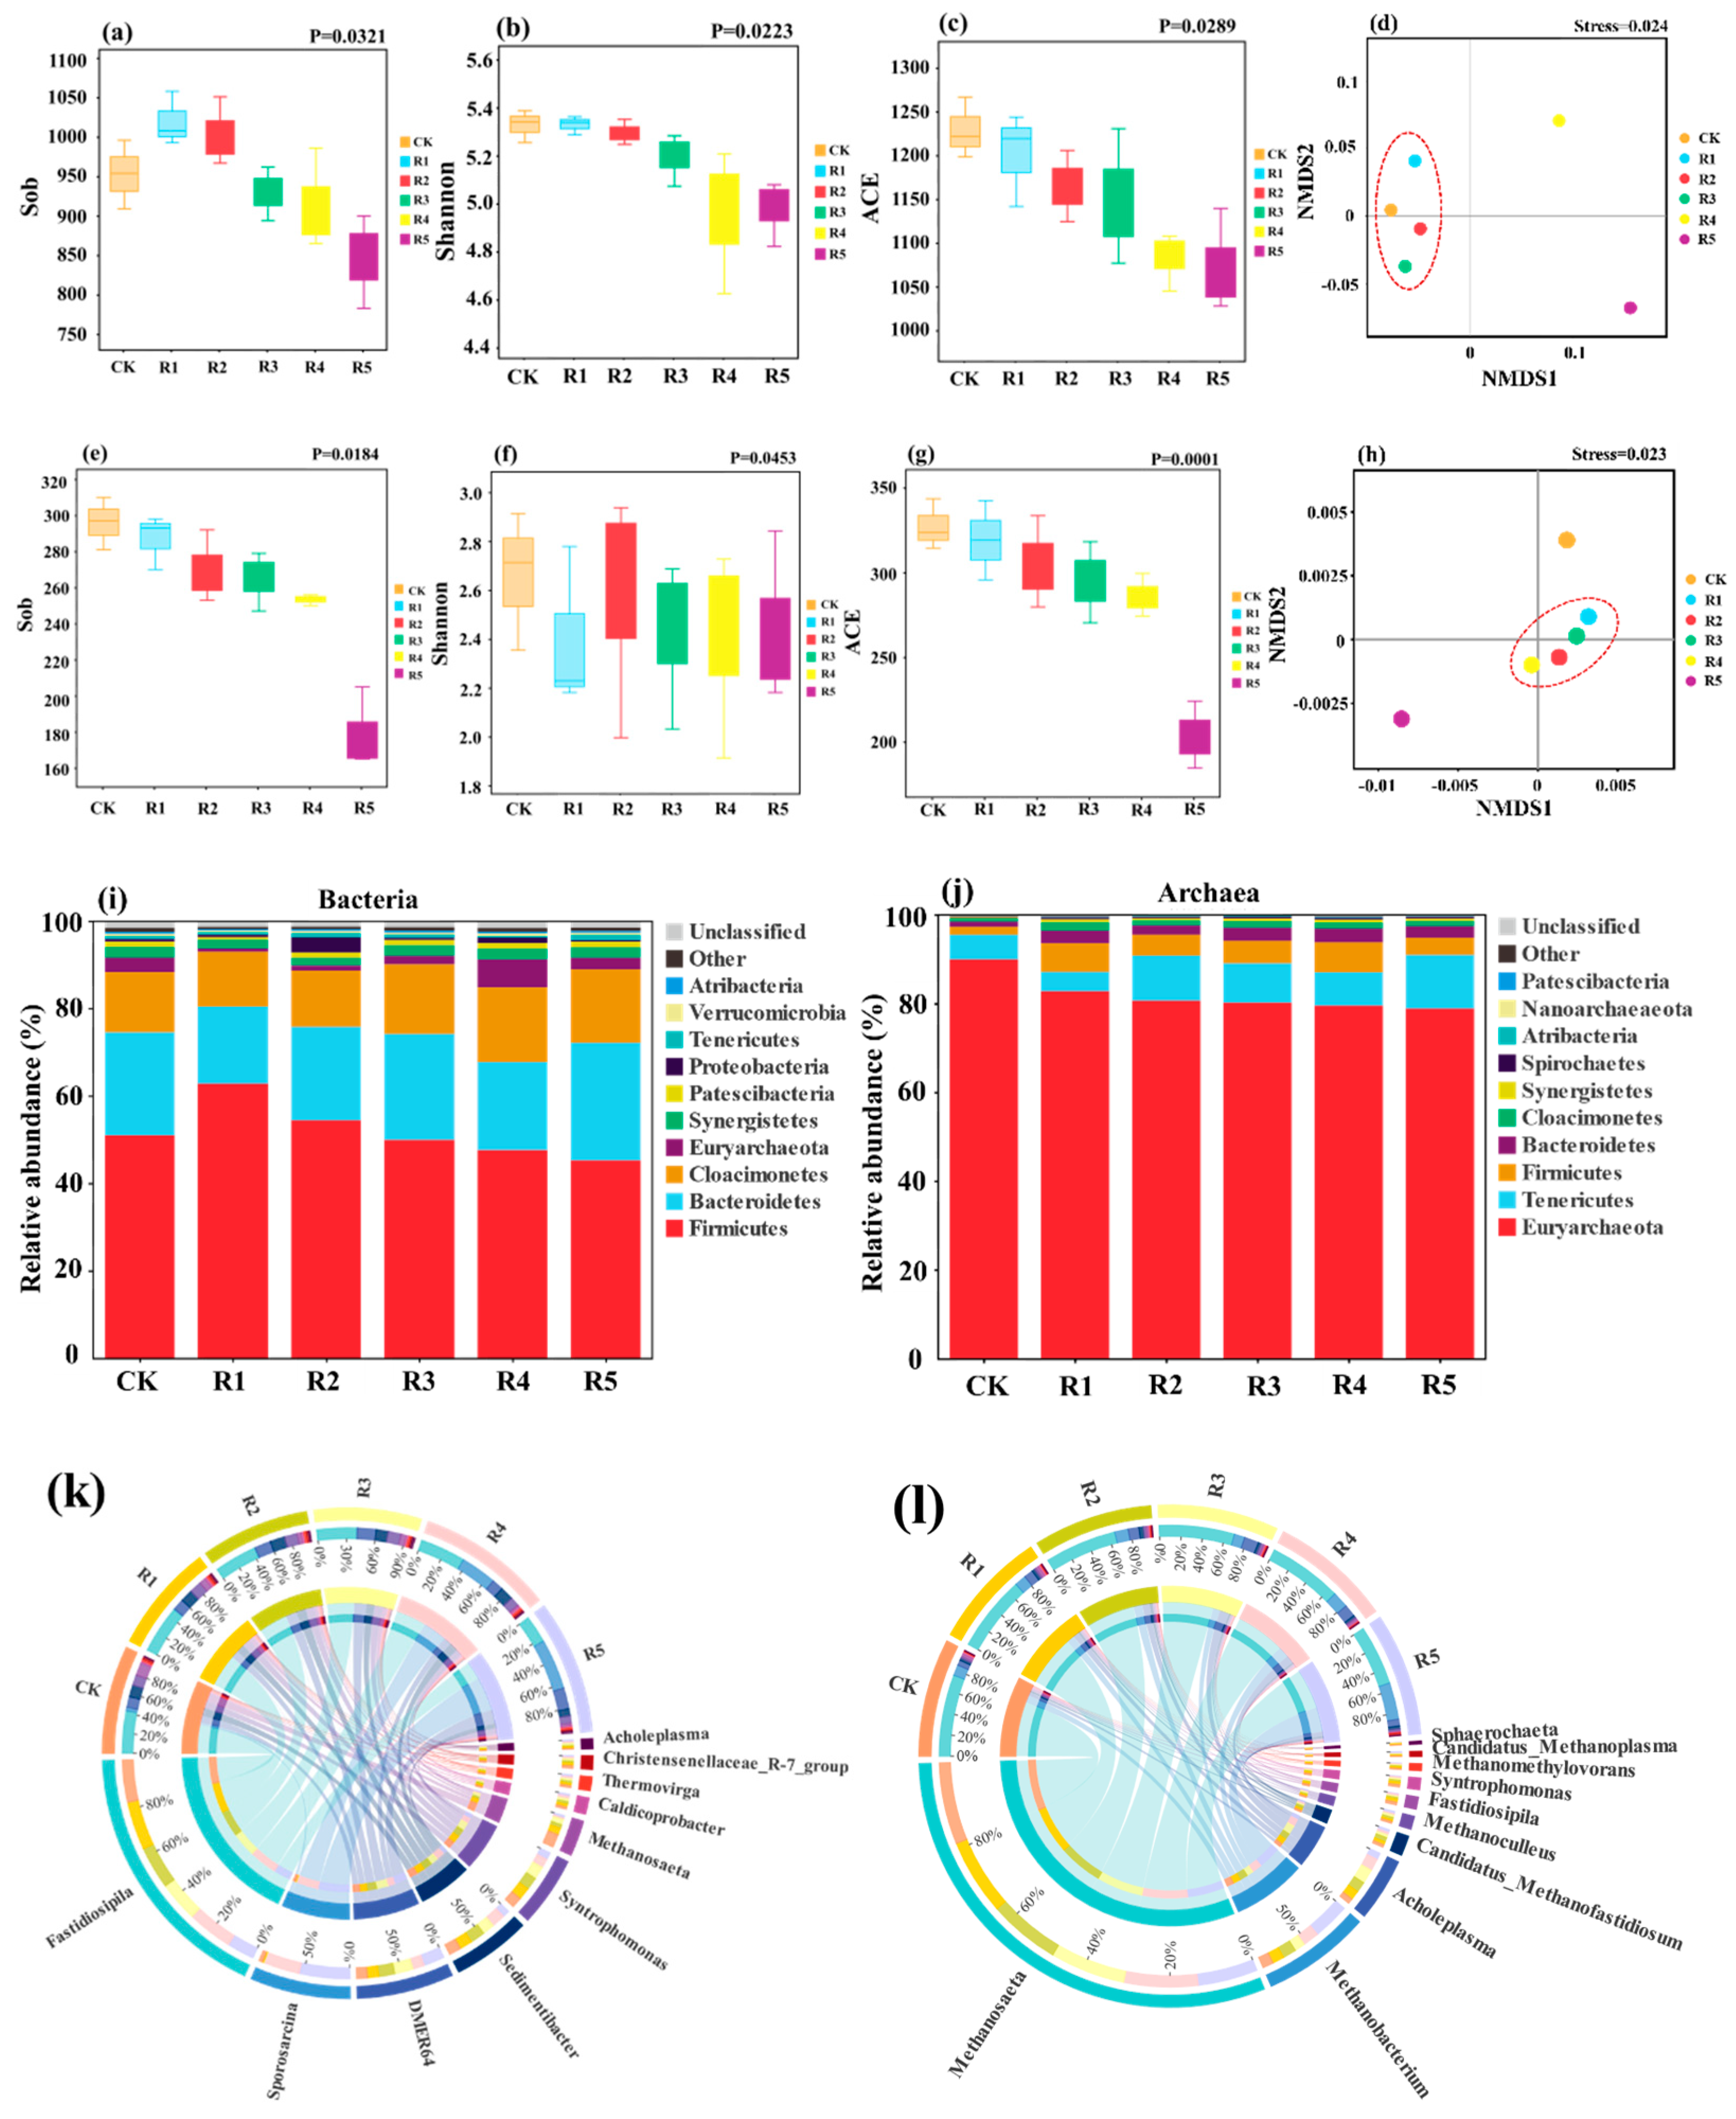
3.4. Microbial Community Structure Analysis

Amplicon sequencing was performed for all experimental groups to evaluate the dynamics of bacterial and archaeal communities. The high coverage values (>0.99) indicated that the sequencing depth was sufficient, ensuring the inclusion of the majority of operational taxonomic units (OTUs).

3.4.1. Composition and Variation of Bacterial Communities

The indicators related to the alpha diversity of bacterial communities are presented in Figure 5. The Sobs index represents the number of OTUs in each group. The highest Sobs values were observed in R1, indicating that lower concentrations of HA had a slight positive effect on increasing species richness in the AD system (Figure 5a). The Shannon index, which evaluated species evenness, decreased with increasing HA dosages, though the Shannon index of the R1 was similar to that of the CK (Figure 5b). The ACE index represents the abundance of the microbial community. The ACE index of bacterial communities decreased with increasing HA concentration, with the highest ACE value observed in CK at 1229.1, and the lowest ACE value observed in R5 at 1072.3 (Figure 5c). These findings suggested that an HA:VS ratio of 5% created a favorable environment for bacterial colonization and growth, leading to increased species abundance in the bacterial community. This could be attributed to (i) HA’s involvement in transforming the non-spontaneous acetate generation process (ΔG0 > 0) into a spontaneous process (ΔG0 < 0) [37], thus promoting bacterial metabolic activity; or (ii) HA’s ability to accept excess electrons from MIET bacteria, triggering acid production processes [3] and further enhancing microbial activity.
Figure 5d presents the non-metric multidimensional scaling (NMDS) analysis of bacterial communities, which can be employed to assess the beta diversity by measuring dissimilarities between bacterial communities. A stress value below 0.1 demonstrates the reliability of the model, and, in this study, the stress value was 0.024, indicating that concentration changes of HA induced significant differences in microbial composition (p < 0.001). Additionally, no significant differences in beta diversity were observed among CK, R1, R2, and R3 (p = 0.373). However, significant differences in beta diversity were observed between R4 (p = 0.044) and R5 (p = 0.004) and the aforementioned groups, indicating that higher HA dosages had a significant impact on the microbial species in AD systems.
Firmicutes was the dominant bacterial phylum, followed by Bacteroidetes, Cloacimonetes, etc. (Figure 5i). These phyla are known for their ability to degrade carbohydrates and synthesize VFAs in AD processes [38,39]. Firmicutes, in particular, play a crucial role in cellulose degradation during AD processes [40] and have the capability to sporulate, enabling their survival in extreme environments [11]. When the VS:HA ratio increased from 0% to 5%, the relative abundance of Firmicutes increased from 51.05% to 62.84%. However, higher VS:HA ratios resulted in a decrease in the relative abundance of Firmicutes. Interestingly, the relative abundance of DMER64 at the genus level was higher in the HA-added group compared to the CK (Figure 5k). DMER64 is known to be involved in MIET [41]. This suggests that HA, acting as electron shuttles, may facilitate the growth of microorganisms possessing MIET capabilities.

3.4.2. Composition and Variation of Archaeal Communities

The Sobs, ACE, and Shannon indices of the archaeal microbial communities all decreased with HA dosages (Figure 5e–g). Remarkably, archaea were discovered to be more sensitive to the presence and dosage of HA compared to bacteria. This can be attributed to the structural differences in cell membranes between bacteria and archaea, as archaea lack the peptidoglycan cell wall characteristic of bacteria. Moreover, the sn1 stereochemistry of the glycerol backbone, a unique feature of archaeal cell membranes, may render archaea more sensitive to the presence of hydrophobic compounds [42]. Figure 5h illustrates the NMDS analysis of the archaeal community, revealing significant differences in beta diversity among all groups (stress value = 0.023). The presence of HA may be the underlying cause for these observed differences, as no significant differences in beta diversity were found among R1, R2, R3, and R4 (p = 0.152). In addition, the beta diversity of the archaeal community in R5 significantly differed from that of R1, R2, R3, and R4, indicating that high concentrations of HA can lead to more pronounced changes in the community structure of archaea.
As depicted in Figure 5j, at the phylum level, Euryarchaeota emerged as the predominant archaeal phylum, with relative abundance ranging from 78.86% (R5) to 89.96% (CK). It has been observed that Euryarchaeota can be highly sensitive to environmental disturbances, resulting in a significant negative correlation between its abundance and HA concentration [43]. At the genus level, as shown in Figure 5l, the dominant archaeal genera were Methanosaeta (acetoclastic methanogens) and Methanobacterium (hydrogenotrophic methanogens). This indicated that acetoclastic methanogenesis was the main methanogenic pathway in this study, compared to hydrogenotrophic methanogenesis. Furthermore, the relative abundance of Methanobacterium decreased while the relative abundance of Methanosaeta increased in the presence of HA. Methanosaeta has been reported to be associated with MIET [7], and it was not surprising that the relative abundance of Methanosaeta was elevated in the presence of electron shuttles such as humic substances. In addition to converting H2 to CH4, Methanobacterium possesses the capability to reduce humic substances [44]. During humic respiration, Methanobacterium competes with acetoclastic methanogenesis for substrate acetate, leading to a decrease in CH4 production in groups with high concentrations of HA (Figure 1a).

3.5. Analysis of the Key Metabolic Pathways under Different HA Levels

To elucidate the impact of various dosing levels of HA on KW AD, a combination of Tax4Fun and KEGG metabolic pathways was used to analyze the metabolic functions during the hydrolytic, acidification, and methanogenesis phases.
In the hydrolytic phase (Figure 6a), the presence of HA exerted a negative influence on the gene abundance of all hydrolytic enzymes. Notably, cellulase, comprising endoglucanase and β-glucosidase, exhibited the highest gene abundance. This observation can be attributed to the prevalence of Firmicutes, known for their role in anaerobic cellulose degradation [39]. Lipase presented the lowest gene abundance among the hydrolytic enzymes, consistent with its lower activity compared to other hydrolytic enzymes (Figure 2d).
During the acidification phase, the impact of HA dosages on the abundance of relevant genes exhibited greater diversity. Small organic molecules generated during the hydrolysis stage, such as glucose, amino acids, and glycerol, undergo conversion to pyruvate through pyruvate kinase. Pyruvate can then be utilized for the production of H2 and CO2 via formate dehydrogenase, alpha subunit, serving as substrates for hydrogenotrophic methanogenesis (Figure 6c). However, HA was identified to inhibit the gene abundance of formate dehydrogenase, alpha subunit (p < 0.05), thereby impeding the hydrogenotrophic methanogenic processes. Thirdly, pyruvate can be converted to acetate by Acetyl-CoA synthetase and acetate kinase, providing substrates for the acetoclastic methanogenic pathway. On the 15th day of AD, HA exhibited a promoting effect on the activity of AK (Figure 2e), while it reduced the abundance of genes encoding AK. This suggested that AK appeared to be sensitive to adverse external factors [45]. Pyruvic acid can also be employed to produce butyric acid by BK (Figure 6b). The gene abundance of BK was increased by HA dosages, corresponding to the activity of BK and the butyrate content. Propionate can be generated through two pathways: (i) the direct conversion of pyruvate in the presence of the succinyl-CoA synthetase alpha subunit; and (ii) the conversion of pyruvate to lactate by L-lactate/D-lactate dehydrogenase, followed by lactate degradation by propionate CoA-transferase to form propionate. The gene abundance of enzymes involved in both pathways was significantly promoted by HA (p < 0.05), and this result was supported by the activity of CoAT (Figure 2f) and propionate concentrations (Figure 2h). Furthermore, as propionate lacked the ability to spontaneously convert into acetate (ΔG0′ > 0), the accumulation of propionate can hinder the metabolic activity of methane-producing bacteria. This further elucidated the mechanism behind the inhibitory effect of HA on the efficiency of AD.
The abundance of enzyme-encoding genes related to methanogenesis in CK was significantly higher than that in other groups, further confirming the negative impact of HA on AD. In the hydrogenotrophic methanogenic pathway, H2 acted as an electron donor to reduce CO2 to CH4. This pathway was mediated by the genes encoding indolepyruvate ferredoxin oxidoreductase, alpha subunit, coenzyme F420 hydrogenase beta subunit, tetrahydromethanopterin S-methyltransferase subunit A, and methyl-coenzyme M reductase alpha subunit in sequential steps [11]. However, HA obstructed this pathway by reducing the production of substrates (H2 and CO2) (Figure 6b), thereby inhibiting the conversion of these substrates into CH4 (Figure 6c) and decreasing the relative abundance of Methanobacterium (Figure 5i). In the acetolactic pathway, acetate was converted to acetyl coenzyme A by acetyl-CoA synthetase. Interestingly, within a certain range of HA concentrations (0% < HA:VS < 20%), this process was facilitated. However, HA hindered the conversion of acetyl-CoA to CO2 by decreasing the gene abundance of indolepyruvate ferredoxin oxidoreductase alpha subunit, and it also inhibited the conversion of acetyl-CoA to CH4 by decreasing the gene abundance of tetrahydromethanopterin S-methyltransferase subunit A and methyl-coenzyme M reductase alpha subunit. These effects can be attributed to the competition of humus respiration for acetate [44] and the competition of HA with ETC properties for the electrons of intermediate metabolites [4]. These findings indicated that, although HA promoted the abundance of genes related to the acidification stage, it also inhibited the functional gene abundance of both the hydrogenotrophic and acetolactic methanogenesis pathways, which was unfavorable for the stable operation of AD systems.

4. Conclusions

In the AD of KW, the presence of HA exhibited inhibitory effects on methane production, hydrolytic enzyme activities, and ETS activity. Therefore, the concentration of HA should be minimized during the AD process. The degree of inhibition increased with the amount of HA added. However, HA enhanced the activities of acidogenic enzymes and the production of ROS. Firmicutes were identified to be the predominant bacterial flora, while Euryarchaeota was the dominant archaeal flora. HA increased the abundance of Firmicutes and bacteria with MIET capabilities, such as DMER64, while decreasing the abundance of Euryarchaeota. Although HA promoted the abundance of genes related to the acidogenic phase, it significantly reduced the abundance of genes associated with the hydrolytic and methanogenic phases.

Supplementary Materials

The following supporting information can be downloaded at: https://www.mdpi.com/article/10.3390/fermentation9100881/s1, Figure S1: FTIR spectra of BAHS and YYHA; Figure S2: Comparison of the FTIR spectra among all experiment groups (a) before and (b) after AD; Figure S3: 3D-EEM Characteristics of HA in (a) CK, (b) R1, (c) R2, (d) R3, (e) R4, and (f) R5 before and after AD process; Figure S4: the key enzyme-encoding gene abundance of SOD.

Author Contributions

Conceptualization, L.L.; methodology, L.L., Y.L., and Z.C.; data curation, L.L.; writing—original draft preparation, L.L. and Y.L.; writing—review and editing, L.L. and S.Z.; visualization, L.L.; funding acquisition, S.Z. All authors have read and agreed to the published version of the manuscript.

Funding

This research was supported by the Natural Science Foundation of China (Grant numbers: 52070177), the Key Natural Science Foundation of Fujian (Grant number: 2020J02009), and the Science and Technology Service (STS) Network Initiative Project of Fujian Province (Grant number: 2022T3023).

Institutional Review Board Statement

Not applicable

Informed Consent Statement

Not applicable

Data Availability Statement

Data are available upon request.

Conflicts of Interest

The authors declare that they have no known competing financial interests or personal relationships that could have appeared to influence the work reported in this paper.

References

  1. Zhang, S.Y.; Xiao, M.Y.; Liang, C.Y.; Chui, C.M.; Wang, N.; Shi, J.P.; Liu, L. Multivariate insights into enhanced biogas production in thermophilic dry anaerobic co-digestion of food waste with kitchen waste or garden waste: Process properties, microbial communities and metagenomic analyses. Bioresour. Technol. 2022, 361, 127684. [Google Scholar] [CrossRef] [PubMed]
  2. Chen, Z.; Li, Y.Z.; Peng, Y.Y.; Mironov, V.; Chen, J.X.; Jin, H.X.; Zhang, S.H. Feasibility of sewage sludge and food waste aerobic co-composting: Physicochemical properties, microbial community structures, and contradiction between microbial metabolic activity and safety risks. Sci. Total Environ. 2022, 825, 154047. [Google Scholar] [CrossRef] [PubMed]
  3. Li, J.; Hao, X.D.; van Loosdrecht, M.C.M.; Luo, Y.Q.; Cao, D.Q. Effect of humic acids on batch anaerobic digestion of excess sludge. Water Res. 2019, 155, 431–443. [Google Scholar] [CrossRef]
  4. Wang, X.Q.; Lyu, T.; Dong, R.J.; Wu, S.B.A. Revealing the link between evolution of electron transfer capacity of humic acid and key enzyme activities during anaerobic digestion. J. Environ. Manag. 2022, 301, 113914. [Google Scholar] [CrossRef] [PubMed]
  5. Wang, X.Q.; Muhmood, A.; Lyu, T.; Dong, R.J.; Liu, H.T.; Wu, S.B. Mechanisms of genuine humic acid evolution and its dynamic interaction with methane production in anaerobic digestion processes. Chem. Eng. J. 2021, 408, 127322. [Google Scholar] [CrossRef]
  6. Efremenko, E.; Stepanov, N.; Senko, O.; Maslova, O.; Volikov, A.; Zhirkova, A.; Perminova, I. Strategies for variable regulation of methanogenesis efficiency and velocity. Appl. Microbiol. Biot. 2022, 106, 6833–6845. [Google Scholar] [CrossRef]
  7. Xu, J.; Xie, J.; Wang, Y.P.; Xu, L.; Zong, Y.; Pang, W.H.; Xie, L. Effect of anthraquinone-2,6-disulfonate (AQDS) on anaerobic digestion under ammonia stress: Triggering mediated interspecies electron transfer (MIET). Sci. Total Environ. 2022, 828, 154158. [Google Scholar] [CrossRef]
  8. Khadem, A.F.; Azman, S.; Plugge, C.M.; Zeeman, G.; van Lier, J.B.; Stams, A.J. Effect of humic acids on the activity of pure and mixed methanogenic cultures. Biomass Bioenergy 2017, 99, 21–30. [Google Scholar] [CrossRef]
  9. Degli Esposti, M.; McLennan, H. Mitochondria and cells produce reactive oxygen species in virtual anaerobiosis: Relevance to ceramide-induced apoptosis. FEBS Lett. 1998, 430, 338–342. [Google Scholar] [CrossRef]
  10. Lennicke, C.; Cochemé, H.M. Redox metabolism: ROS as specific molecular regulators of cell signaling and function. Mol. Cell. 2021, 81, 3691–3707. [Google Scholar] [CrossRef]
  11. Chen, Z.; Chen, Z.W.; Sun, H.Y.; Xing, R.Z.; Zhou, S.G. Degradation of microplastics by hydroxyl radicals generated during microbially driven humus redox transformation. Water Res. 2022, 221, 118731. [Google Scholar] [CrossRef] [PubMed]
  12. Tan, Z.; Liu, Y.W.; Liu, H.Y.; Yang, C.P.; Niu, Q.Y.; Cheng, J.J. Effects of 5-hydroxymethylfurfural on removal performance and microbial community structure of aerobic activated sludge treating digested swine wastewater. J. Environ. Chem. Eng. 2021, 9, 106104. [Google Scholar] [CrossRef]
  13. Gao, X.T.; Tan, W.B.; Zhao, Y.; Wu, J.Q.; Sun, Q.H.; Qi, H.S.; Xie, X.Y.; Wei, Z.M. Diversity in the Mechanisms of Humin Formation during Composting with Different Materials. Environ. Sci. Technol. 2019, 53, 3653–3662. [Google Scholar] [CrossRef] [PubMed]
  14. Chen, Z.; Li, Y.; Peng, Y.; Ye, C.; Zhang, S. Effects of antibiotics on hydrolase activity and structure of microbial community during aerobic co-composting of food waste with sewage sludge. Bioresour. Technol. 2012, 321, 124506. [Google Scholar] [CrossRef]
  15. Li, Y.Z.; Chen, Z.; Peng, Y.Y.; Huang, W.Z.; Liu, J.X.; Mironov, V.; Zhang, S.H. Deeper insights into the effects of substrate to inoculum ratio selection on the relationship of kinetic parameters, microbial communities, and key metabolic pathways during the anaerobic digestion of food waste. Water Res. 2022, 217, 118440. [Google Scholar] [CrossRef]
  16. APHA Standard Methods for the Examination of Water and Wastewater; American Public Health Association: Washington, DC, USA, 2005.
  17. Wei, W.; Huang, Q.S.; Sun, J.; Dai, X.H.; Ni, B.J. Revealing the Mechanisms of Polyethylene Microplastics Affecting Anaerobic Digestion of Waste Activated Sludge. Environ. Sci. Technol. 2019, 53, 9604–9613. [Google Scholar] [CrossRef]
  18. Lizama, A.C.; Figueiras, C.C.; Pedreguera, A.Z.; Espinoza, J.E.R. Enhancing the performance and stability of the anaerobic digestion of sewage sludge by zero valent iron nanoparticles dosage. Bioresour. Technol. 2019, 275, 352–359. [Google Scholar] [CrossRef]
  19. Liu, K.; Chen, Y.G.; Xiao, N.D.; Zheng, X.; Li, M. Effect of Humic Acids with Different Characteristics on Fermentative Short-Chain Fatty Acids Production from Waste Activated Sludge. Environ. Sci. Technol. 2015, 49, 4929–4936. [Google Scholar] [CrossRef]
  20. Piccolo, A. The supramolecular structure of humic substances. Soil Sci. 2001, 166, 810–832. [Google Scholar] [CrossRef]
  21. Potts, L.G.A.; Jolly, M. Controlling and monitoring anaerobic digesters fed with thermally hydrolysed sludge. Water Environ. J. 2004, 18, 68–72. [Google Scholar] [CrossRef]
  22. Dwyer, J.; Starrenbury, D.; Tait, S.; Barr, K.; Batstone, D.J.; Lant, P. Decreasing activated sludge thermal hydrolysis temperature reduces product colour, without decreasing degradability. Water Res. 2008, 42, 4699–4709. [Google Scholar] [CrossRef]
  23. Cezairliyan, B.; Ausubel, F.M. Investment in secreted enzymes during nutrient-limited growth is utility dependent. Proc. Natl. Acad. Sci. USA 2017, 114, E7796–E7802. [Google Scholar] [CrossRef] [PubMed]
  24. Yap, S.D.; Astals, S.; Lu, Y.; Peces, M.; Jensen, P.D.; Batstone, D.J.; Tait, S. Humic acid inhibition of hydrolysis and methanogenesis with different anaerobic inocula. Waste Manag. 2018, 80, 130–136. [Google Scholar] [CrossRef] [PubMed]
  25. Parawira, W.; Murto, M.; Read, J.S.; Mattiasson, B. Profile of hydrolases and biogas production during two-stage mesophilic anaerobic digestion of solid potato waste. Process Biochem. 2005, 40, 2945–2952. [Google Scholar] [CrossRef]
  26. Bansal, P.; Vowell, B.J.; Hall, M.; Realff, M.J.; Lee, J.H.; Bommarius, A.S. Elucidation of cellulose accessibility, hydrolysability and reactivity as the major limitations in the enzymatic hydrolysis of cellulose. Bioresour. Technol. 2012, 107, 243–250. [Google Scholar] [CrossRef] [PubMed]
  27. Luo, J.Y.; Cao, W.B.; Guo, W.; Fang, S.Y.; Huang, W.X.; Wang, F.; Cheng, X.S.; Du, W.; Cao, J.S.; Feng, Q.; et al. Antagonistic effects of surfactants and CeO2 nanoparticles co-occurrence on the sludge fermentation process: Novel insights of interaction mechanisms and microbial networks. J. Hazard Mater. 2022, 438, 129556. [Google Scholar] [CrossRef]
  28. Crump, K. Evaluating the evidence for hormesis: A statistical perspective. Crit. Rev. Toxicol. 2001, 31, 669–679. [Google Scholar] [CrossRef] [PubMed]
  29. Morris, J.J.; Rose, A.L.; Lu, Z. Reactive oxygen species in the world ocean and their impacts on marine ecosystems. Redox Biol. 2022, 52, 102285. [Google Scholar] [CrossRef]
  30. Timofeyev, M.A.; Shatilina, Z.M.; Kolesnichenko, A.V.; Bedulina, D.S.; Kolesnichenko, V.V.; Pflugmacher, S.; Steinberg, C.E.W. Natural organic matter (NOM) induces oxidative stress in freshwater amphipods Gammarus lacustris Sars and Gammarus tigrinus (Sexton). Sci. Total Environ. 2006, 366, 673–681. [Google Scholar] [CrossRef]
  31. Shah, Z.H.; Rehman, H.M.; Akhtar, T.; Alsamadany, H.; Hamooh, B.T.; Mujtaba, T.; Daur, I.; Al Zahrani, Y.; Alzahrani, H.A.; Ali, S. Humic substances: Determining potential molecular regulatory processes in plants. Front. Plant Sci. 2018, 9, 263. [Google Scholar] [CrossRef]
  32. Nagao, H.; Ninomiya, M.; Sugiyama, H.; Itabashi, A.; Uno, K.; Tanaka, K.; Koketsu, M. Comparative analysis of p-terphenylquinone and seriniquinone derivatives as reactive oxygen species-modulating agents. Bioorg. Med. Chem. Lett. 2022, 76, 128992. [Google Scholar] [CrossRef] [PubMed]
  33. Li, Y.; Chen, D.; Li, J.; Zhang, X.X.; Wang, C.F.; Wang, J.M. Changes in superoxide dismutase activity postpartum from Laoshan goat milk and factors influencing its stability during processing. J. Anim. Sci. 2018, 17, 835–844. [Google Scholar] [CrossRef]
  34. Wang, Y.L.; Zhao, J.W.; Wang, D.B.; Liu, Y.W.; Wang, Q.L.; Ni, B.J.; Chen, F.; Yang, Q.; Li, X.M.; Zeng, G.M.; et al. Free nitrous acid promotes hydrogen production from dark fermentation of waste activated sludge. Water Res. 2018, 145, 113–124. [Google Scholar] [CrossRef]
  35. Baek, G.; Kim, J.; Kim, J.; Lee, C. Role and potential of direct interspecies electron transfer in anaerobic digestion. Energies 2018, 11, 107. [Google Scholar] [CrossRef]
  36. Zhao, R.Z.; Jiang, S.; Zhang, L.; Yu, Z.B. Mitochondrial electron transport chain, ROS generation and uncoupling. Int. J. Mol. Med. 2019, 44, 3–15. [Google Scholar] [CrossRef] [PubMed]
  37. Thauer, R.K.; Jungermann, K.; Decker, K. Energy-conservation in chemotropic anaerobic bacteria. Bacteriol. Rev. 1977, 41, 100–180. [Google Scholar] [CrossRef] [PubMed]
  38. Wang, J.H.; Wang, L.; Cui, E.Y.; Lu, H. Bioactivity kinetics of organic matter biodegradation and nitrification. Korean J. Chem. Eng. 2018, 35, 1274–1280. [Google Scholar] [CrossRef]
  39. Li, Y.X.; Huang, W.X.; Fang, S.Y.; Li, Z.Z.; Li, Z.Y.; Wang, F.; Cheng, X.S.; Cao, J.S.; Feng, L.Y.; Luo, J.Y.; et al. Zinc pyrithione induced volatile fatty acids promotion derived from sludge anaerobic digestion: Interrelating the affected steps with microbial metabolic regulation and adaptive responses. Water Res. 2023, 234, 119816. [Google Scholar] [CrossRef]
  40. Azman, S.; Khadem, A.F.; Plugge, C.M.; Stams, A.J.M.; Bec, S.; Zeeman, G. Effect of humic acid on anaerobic digestion of cellulose and xylan in completely stirred tank reactors, inhibitory effect, mitigation of the inhibition and the dynamics of the microbial communities. Appl. Microbiol. Biotechnol. 2017, 101, 889–901. [Google Scholar] [CrossRef]
  41. Xie, Z.J.; Huang, S.Y.; Wan, Y.Q.; Deng, F.; Cao, Q.; Liu, X.; Li, D. Power to biogas upgrading, Effects of different H2/CO2 ratios on products and microbial communities in anaerobic fermentation system. Sci. Total Environ. 2023, 865, 161305. [Google Scholar] [CrossRef]
  42. Albers, S.V.; Meyer, B.H. The archaeal cell envelope. Nat. Rev. Microbiol. 2011, 9, 414–426. [Google Scholar] [CrossRef] [PubMed]
  43. Vanwonterghem, I.; Jensen, P.D.; Dennis, P.G.; Hugenholtz, P.; Rabaey, K.; Tyson, G.W. Deterministic processes guide long-term synchronised population dynamics in replicate anaerobic digesters. ISME J. 2014, 8, 2015–2028. [Google Scholar] [CrossRef] [PubMed]
  44. Lovley, D.R.; Coates, J.D.; BluntHarris, E.L.; Phillips, E.J.P.; Woodward, J.C. Humic substances as electron acceptors for microbial respiration. Nature 1996, 382, 445–448. [Google Scholar] [CrossRef]
  45. Yang, W.W.; Huang, J.; Pan, F.K. Polychlorinated biphenyls affects anaerobic methane production from waste activated sludge through suppressing hydrolysis-acidification and methanation processes. J. Environ. Manag. 2019, 251, 109616. [Google Scholar] [CrossRef] [PubMed]
Figure 1. The variation in (a) cumulative methane production, (b) methane production and inhibited efficiency, and (c) the daily production of methane at different HA dosages.
Fermentation 09 00881 g001
Figure 2. Evolution of key enzyme activities of (a) protease, (b) amylase, (c) cellulase, (d) lipase, (e) AK, (f) CoAT, and (g) BK during AD, and (h) changes of VFAs concentrations under different HA dosages over time.
Fermentation 09 00881 g002
Figure 3. Evolution of relative concentrations of (a) ROS in the supernatant of the fermentation broth and (b) intracellular ROS, as well as the (c) evolution of relative activities of SOD.
Fermentation 09 00881 g003
Figure 4. Evolution of (a) ETS activity and (b) proportion of SCOD in TCOD under different HA dosages.
Fermentation 09 00881 g004
Figure 5. The (a) Sob index, (b) Shannon index, (c) ACE index, and (d) Unweighted UniFrac metrics NMDS analysis of bacteria under various HA levels and the abundance of bacteria in the (i) phylum level and the (k) genus level under different HA dosages. The (e) Sob index, (f) Shannon index, (g) ACE index, and (h) Unweighted UniFrac metrics NMDS analysis of archaea under various HA levels, and the abundance of archaea in the (j) phylum level and the (l) genus level under various HA levels.
Fermentation 09 00881 g005
Figure 6. The abundance of key enzyme-encoding genes in the (a) Hydrolytic, (b) Acidogenic, and (c) Methanogenic phases with different HA dosage.
Fermentation 09 00881 g006
Table 1. The composition and characteristics of KW and BS.
KWBS
pH4.66 ± 0.068.07 ± 0.01
Salinity (‰)0.20 ± 0.0117.94 ± 0.11
EC (ms/cm)481.67 ± 12.5830.30 ± 0.53
VS (%)94.60 ± 1.0735.48 ± 10.19
Water content (%)80.40 ± 0.1297.05 ± 0.4
C (%)35.97 ± 0.1418.84 ± 1.49
N (%)4.85 ± 0.022.99 ± 0.35
S (%)0.33 ± 0.010.25 ± 0.04
C/N7.42 ± 0.056.31 ± 0.24
Lipid(mg/g)81.28 ± 0.131.88 ± 0.47
Protein(mg/g)46.98Not determined
Starch(mg/g)372.21Not determined
Disclaimer/Publisher’s Note: The statements, opinions and data contained in all publications are solely those of the individual author(s) and contributor(s) and not of MDPI and/or the editor(s). MDPI and/or the editor(s) disclaim responsibility for any injury to people or property resulting from any ideas, methods, instructions or products referred to in the content.

