Article

Mixed Fermentation of Lactiplantibacillus plantarum and Bacillus licheniformis Changed the Chemical Composition, Bacterial Community, and Rumen Degradation Rate of Tea Residue

College of Animal Science and Technology, Anhui Agricultural University, Hefei 230036, China
*
Author to whom correspondence should be addressed.
These authors contributed equally to this work.
Fermentation 2022, 8(8), 380; https://doi.org/10.3390/fermentation8080380
Submission received: 24 June 2022 / Revised: 3 August 2022 / Accepted: 4 August 2022 / Published: 9 August 2022
(This article belongs to the Special Issue In Vitro Fermentation)

Abstract

:
Tea residue, as a byproduct in tea processing, is highly nutritious and can be used as a good raw material for ruminant feed. This study aimed to investigate the effects of Lactiplantibacillus plantarum (L. plantarum) and Bacillus licheniformis (B. licheniformis) mixed fermentation of tea residue mixture (tea residue:wheat bran, 7:3) on chemical composition, bacterial community, and rumen degradation rate. Changes in chemical composition and bacterial community were evaluated after 0 (F0), 1 (F1), 3 (F3), and 5 (F5) days of fermentation. The rumen degradation rate was studied by the in situ nylon bag method. Compared with group F0, acid soluble protein in other groups increased while pH and neutral detergent fiber decreased (p < 0.05). The group F5 was the best. The diversity of bacterial communities in group F0 was significantly lower than those in the other groups (p < 0.05). The relative abundance of phylum Firmicutes and the genus Lactobacillus increased with increasing fermentation time. The rumen degradation rates of dry matter, crude protein, neutral detergent fiber, and acid detergent fiber were increased after fermentation. In conclusion, mixed fermentation of tea residue by L. plantarum and B. licheniformis can ameliorate chemical composition, reduce bacterial community diversity, and improve the rumen degradation rate.

1. Introduction

Tea is one of the most popular beverages in the world. It has a huge consumer group and market demand. During 2020, the global tea area harvested exceeded 5 million hectares, and its production exceeded 7 million tons [1]. China is one of the major tea producers. In 2020, the tea plantation area in China was 3.2 million hectares, and tea production was 2.9 million tons, ranking first in the world. The above two indicators increased by 3.6% and 5.6%, respectively, compared to 2019 [2]. Tea residues are produced from tea after drinking, extracting the active ingredients, or making tea beverages [3], and they increase along with the increase in the annual tea consumption and the development of processing technology in the tea industry. Along with having the largest tea consumption, China produces more than 5 million tons of tea waste each year [4]. Undesirably, most tea residues are discarded or burned as industrial waste, which not only causes waste of resources but also contributes to environmental pollution [5].
Ramdani [6] showed that black tea residue was nutrient-rich and contained 25.2% crude protein, 2.3% ether extract, 39.4% neutral detergent fiber, 28.5% acid detergent fiber, 13.0% total phenols, 10.5% total tannins, 0.9% calcium, and 0.22% phosphorus. Fortunately, people are increasingly seeking ways to reuse tea residue resources. At present, tea residues are mainly used as fertilizer [7], fuel [8], adsorbent [4], and sources of active ingredients [9]. Kondo et al. [10] showed that tea residue has a high crude protein content and has potential as a source of feed protein. Nasehi et al. [11] also showed that replacing alfalfa hay in lamb diets with green tea residue improved its digestibility and nitrogen retention, and improved growth performance. However, fresh tea residue often has high fiber and moisture content, making it difficult to store and poorly utilized. Microbial fermentation of plant feed protein can degrade its constituent bio-logical macromolecules, such as polysaccharides and proteins, into easily absorbed small molecules, reducing anti-nutritional factors [12].
The most critical technology for solid-state fermentation is the selection of microbial strains and process parameters. Lactobacillus is a group of Gram-positive, anaerobic, or facultative aerobic cocci or rods, which can use carbohydrates to produce large amounts of lactic acid [13]. They can produce bacteriocins, which inhibit the growth of spoilage and pathogenic bacteria [14]. Therefore, Lactobacillus is often added to feeds in order to prolong their storage time. Bacillus is a group of Gram-positive, rod-shaped endospore-formers and are facultative anaerobes or aerobes [15]. They show strong tolerances to extremes in temperature, organic solvents, and pH [16]. Bacillus can secrete many enzymes, such as amylases, xylanases, chitinase, β-1, 3-glucanase, β-glucosidase, lipase, protease, cellulase, and others, which play important roles in the feed, food, pharmaceutical, and textiles industries [17].
Preliminary results (unpublished) from our laboratory showed that good fermentation can be achieved with a 1:1 ratio of Bacillus licheniformis (B. licheniformis) to Lactiplantibacillus plantarum (L. plantarum), a total inoculum of 5 × 10⁷ CFU/g, a water content of 57%, and 5 day of fermentation at 34 °C. However, the fermentation process entails many types of microorganisms, produces various metabolites, and is extremely complex [18]. The rumen degradation rate of fermented tea residue is also unknown. Therefore, the aim of this study was to investigate the effects of L. plantarum and B. licheniformis mixed fermentation of tea residue mixture (tea residue: wheat bran, 7:3) on chemical composition, bacterial community, and rumen degradation rate.

2. Materials and Methods

2.1. Preparation of Tea Residue and Fermentation

20-kg fresh black tea residue was provided by Sanan Sino-Science Co., Ltd. (Luan, Anhui, China). It was mainly the residue from the production of black tea beverages by leaching. The chemical composition of the tea residue is shown in Table 1. A 10 kg amount of wheat bran was purchased from Hefei Huaren Agriculture and Animal Husbandry Group Co., Ltd. (Hefei, Anhui, China). It was used as subsidiary material to control the moisture content and to provide a carbon source. B. licheniformis was purchased from Jiangsu Lvkee Biotechnology Co., Ltd. (Yangzhou, Jiangsu, China). Its live bacteria content was ≥2 × 10¹⁰ CFU/g. L. plantarum (ACCC 11016) was obtained from the Agriculture Culture Collection of China (Beijing, China). 70-g fresh black tea residue and 30-g wheat bran were mixed and used as fermentation substrates. The 100-g mixture was placed into polyethylene bags (18 mm × 25 mm). Subsequently, B. licheniformis and L. plantarum were uniformly added to the tea residue mixture in a ratio of 1:1 and at a final concentration of 5 × 10⁷ CFU/g. Finally, the tea residue mixture was fermented at 34 °C for 1 day (F1), 3 day (F3), and 5 day (F5). The tea residue mixture was fermented without bacteria for 0 d (F0) as a control group. Each treatment was performed in three replicates.

2.2. Chemical Composition Analysis

A fermentation sample (10 g) per bag was mixed with 90 mL of sterilized distilled water and stored at 4 °C for 24 h. The supernatant was filtered through four layers of gauze [19]. The pH values were determined using a pH meter (pHS-3C; SHENGCI Instrument Co., Ltd., Shanghai, China). Another 10 g fermentation sample per bag was stored in a −80 °C freezer for backup. The residual material was dried at 45 °C for 48 h then crushed in a grinder (QE-100; Zhejiang Yili Industry and Trade Co., Ltd., Jinhua, Zhejiang, China) and passed through a 1.0 mm sieve to determine the chemical composition. The samples of tea residue mixture (F0, F1, F3, and F5) were analyzed for dry matter (DM), crude protein (CP), ether extract (EE), and ash (Ash) [20]. The neutral detergent fiber (NDF) and acid detergent fiber (ADF) contents were determined using the method reported by Van Soest et al. [21]. Protease activity (PA) and cellulase activity (CA) were determined according to GB/T 28715-2012 and NY/T 912-2020, respectively [22,23]. The acid-soluble protein (ASP) and tea tannin (TTN) contents were determined according to the protocols described by NY/T 3801-2020 and GB/T 27985-2011, respectively [24,25]. A standard curve was made using tannic acid to determine TTN. (y = 0.0949x − 0.0357 R2 = 0.9992)

2.3. Bacterial Community Analysis

To assess the bacteria community by next-generation sequencing, we measured a 10 g sample of each treatment and stored it in a freezer at −80 °C. Samples were sent to Shanghai Majorbio Technology Co., Ltd. (Shanghai, China) for analysis.

2.3.1. DNA Extraction and Sequencing

Total microbial genomic DNA was extracted from tea residue mixture samples using the E.Z.N.A.® soil DNA Kit (Omega Bio-tek, Norcross, GA, USA) according to manufacturer’s instructions. The quality and concentration of DNA were determined by 1.0% agarose gel electrophoresis and a NanoDrop® ND-2000 spectrophotometer (Thermo Scientific Inc., Wilmington, CA, USA) and kept at −80 °C prior to further use. Bacterial 16S rRNA genes spanning a hypervariable (V3–V4) region were amplified using the 338F (5’-ACTCCTACGGGAGGCAGCAG-3’) and 806R (5’-GGACTACHVGGGTWTCTAAT-3’) primers [26]. For the V3–V4 region of bacterial 16S rRNA genes, the PCR conditions were as follows: initial denaturation at 95 °C for 3 min, followed by 27 cycles at 95 °C for 30 s, 50 °C for 30 s, 72 °C for 45 s, and a final extension step at 72 °C for 10 min, ending at 4 °C. All samples were amplified in triplicate. The PCR product was extracted from 2% agarose gel and purified using the AxyPrep DNA Gel Extraction Kit (Axygen Biosciences, Union City, CA, USA) according to manufacturer’s instructions and quantified using Quantus™ Fluorometer (Promega, Madison, USA). The purified amplicons were pooled in equal amounts and paired-end sequenced on an Illumina MiSeq PE300 platform/NovaSeq PE250 platform (Illumina, San Diego, CA, USA) according to the standard protocols by Majorbio Bio-Pharm Technology Co., Ltd. (Shanghai, China).

2.3.2. Sequence Analysis

Raw FASTQ files were de-multiplexed using an in-house perl script, and then quality-filtered by FASTQ version 0.19.6 [27] and merged by FLASH version 1.2.7 [28]. Bioinformatic analysis of the tea residue mixture microbiota was implemented using the Majorbio Cloud platform (https://cloud.majorbio.com) (accessed on 30 January 2022). Based on the OTUs information, rarefaction curves and alpha diversity indices including observed OTUs, Chao1 richness, Shannon index and Good’s coverage were calculated with Mothur version 1.30.1 (Patrick Schloss, Ann Arbor, MI, USA) [29].

2.4. Animals and Experimental Design

2.4.1. Ethics Statement

The animal experiment was reviewed and approved by the Institutional Animal Care and Use Committee of Anhui Agricultural University (No. SYDW-P20190600601). The experiments were performed in accordance with the Regulations for the Administration of Affairs Concerning Experimental Animals and the Standards for the Administration of Experiment Practices.

2.4.2. Animal Management

Three 45-month-old healthy Holstein dairy cows (about 650 kg) with permanent rumen cannulas were used. The experimental diet was provided by Shanghai Xinghuo Dairy Farm (Shanghai, China). The composition and nutrient levels of the basic diet are shown in Table 2.

2.4.3. In Situ Nutrient Degradability

In this study, the nylon bag method [30,31,32] was used to reanalyze the rumen degradation characteristics of DM, CP, ADF, and NDF. Each cow was regarded as a replicate, each forage three replicates, and each forage had two parallel replicates per cow (n = 6). A total of 54 nylon bags were prepared. The nylon bags (size: 10 cm × 15 cm; pore: 50 µm) were numbered, dried at 65 °C, then weighed. We weighed 10 g of unfermented tea residue (UTR) (F0) and fermented tea residue (FTR) (F5) into nylon bags. A maximum of six bags were attached to 50-cm-long plastic tubes that retained bags within the liquid phase of the ruminal content. The nylon bags were placed in the rumen of fistulated cattle at 08:00 a.m. and incubated for 2 h, 4 h, 8 h, 16 h, 24 h, 30 h, 36 h, and 48 h. The bags were then washed, dried at 65°C, and weighed. A control group was set for 0 h (not incubated in the rumen). Once retrieved from rumen at each time point, the bags were rinsed in cool water, then dried to a constant weight at 65 °C for 48 h. The dried residues were crushed in a grinder and passed through a 1 mm sieve for further use.

2.4.4. Rumen Degradation Rate Analysis

We calculated the degradation rate using Equation (1):
A = ( B C ) B × 100 %
where A is the rumen degradation rate of a nutrient in the material tested (%), B is the mass of a nutrient in the material tested (g), and C is the mass of a nutrient in the residue (g).
Ruminal degradation parameters and effective degradation rates of feeds were determined and calculated according to the mathematical index model of rumen kinetics proposed by Ørskov et al. [33].
D p = a + b ( 1 e c t )
E D = a + b × c / ( k + c )
where a is the rapidly degradable component (%), b is the potentially degradable component (%), c is the constant rate of degradation of b (%/h), a + b is total degradable component (%), Dp is the nutrient disappearance rate in the rumen at time “t”. The effective degradability (ED, %) was determined using Equation (3), where k is the rumen outflow rate of the nutrient component (%/h), rendered as k = 0.031%/h [34].

2.5. Statistical Analysis

Statistical analyses were performed using the statistical program IBM SPSS 25.0 (IBM Co., Armonk, NY, USA). The chemical composition and alpha diversity of bacteria were analyzed using a one-way analysis of variance (ANOVA). The ruminal degradation kinetics (i.e., a, b, c, a + b, dp, and ED) of DM, CP, ADF, and NDF within various feeds were estimated using the NLIN procedure (Equations (2) and (3)). The data are expressed as mean ± standard deviation. Significance was declared at p < 0.05.

3. Results

3.1. Chemical Composition of Tea Residue Mixture during Fermentation

As shown in Table 3, DM loss, ASP, CP, and EE increased with the extension of fermentation time from day 0 to day 5. Except for CP, the above indexes in group F5 were significantly higher than those in group F0 (p < 0.05). However, with the prolongation of fermentation time, the pH, CA, ADF, and NDF decreased (p < 0.05). PA first increased, then decreased, and reached a peak in group F3.

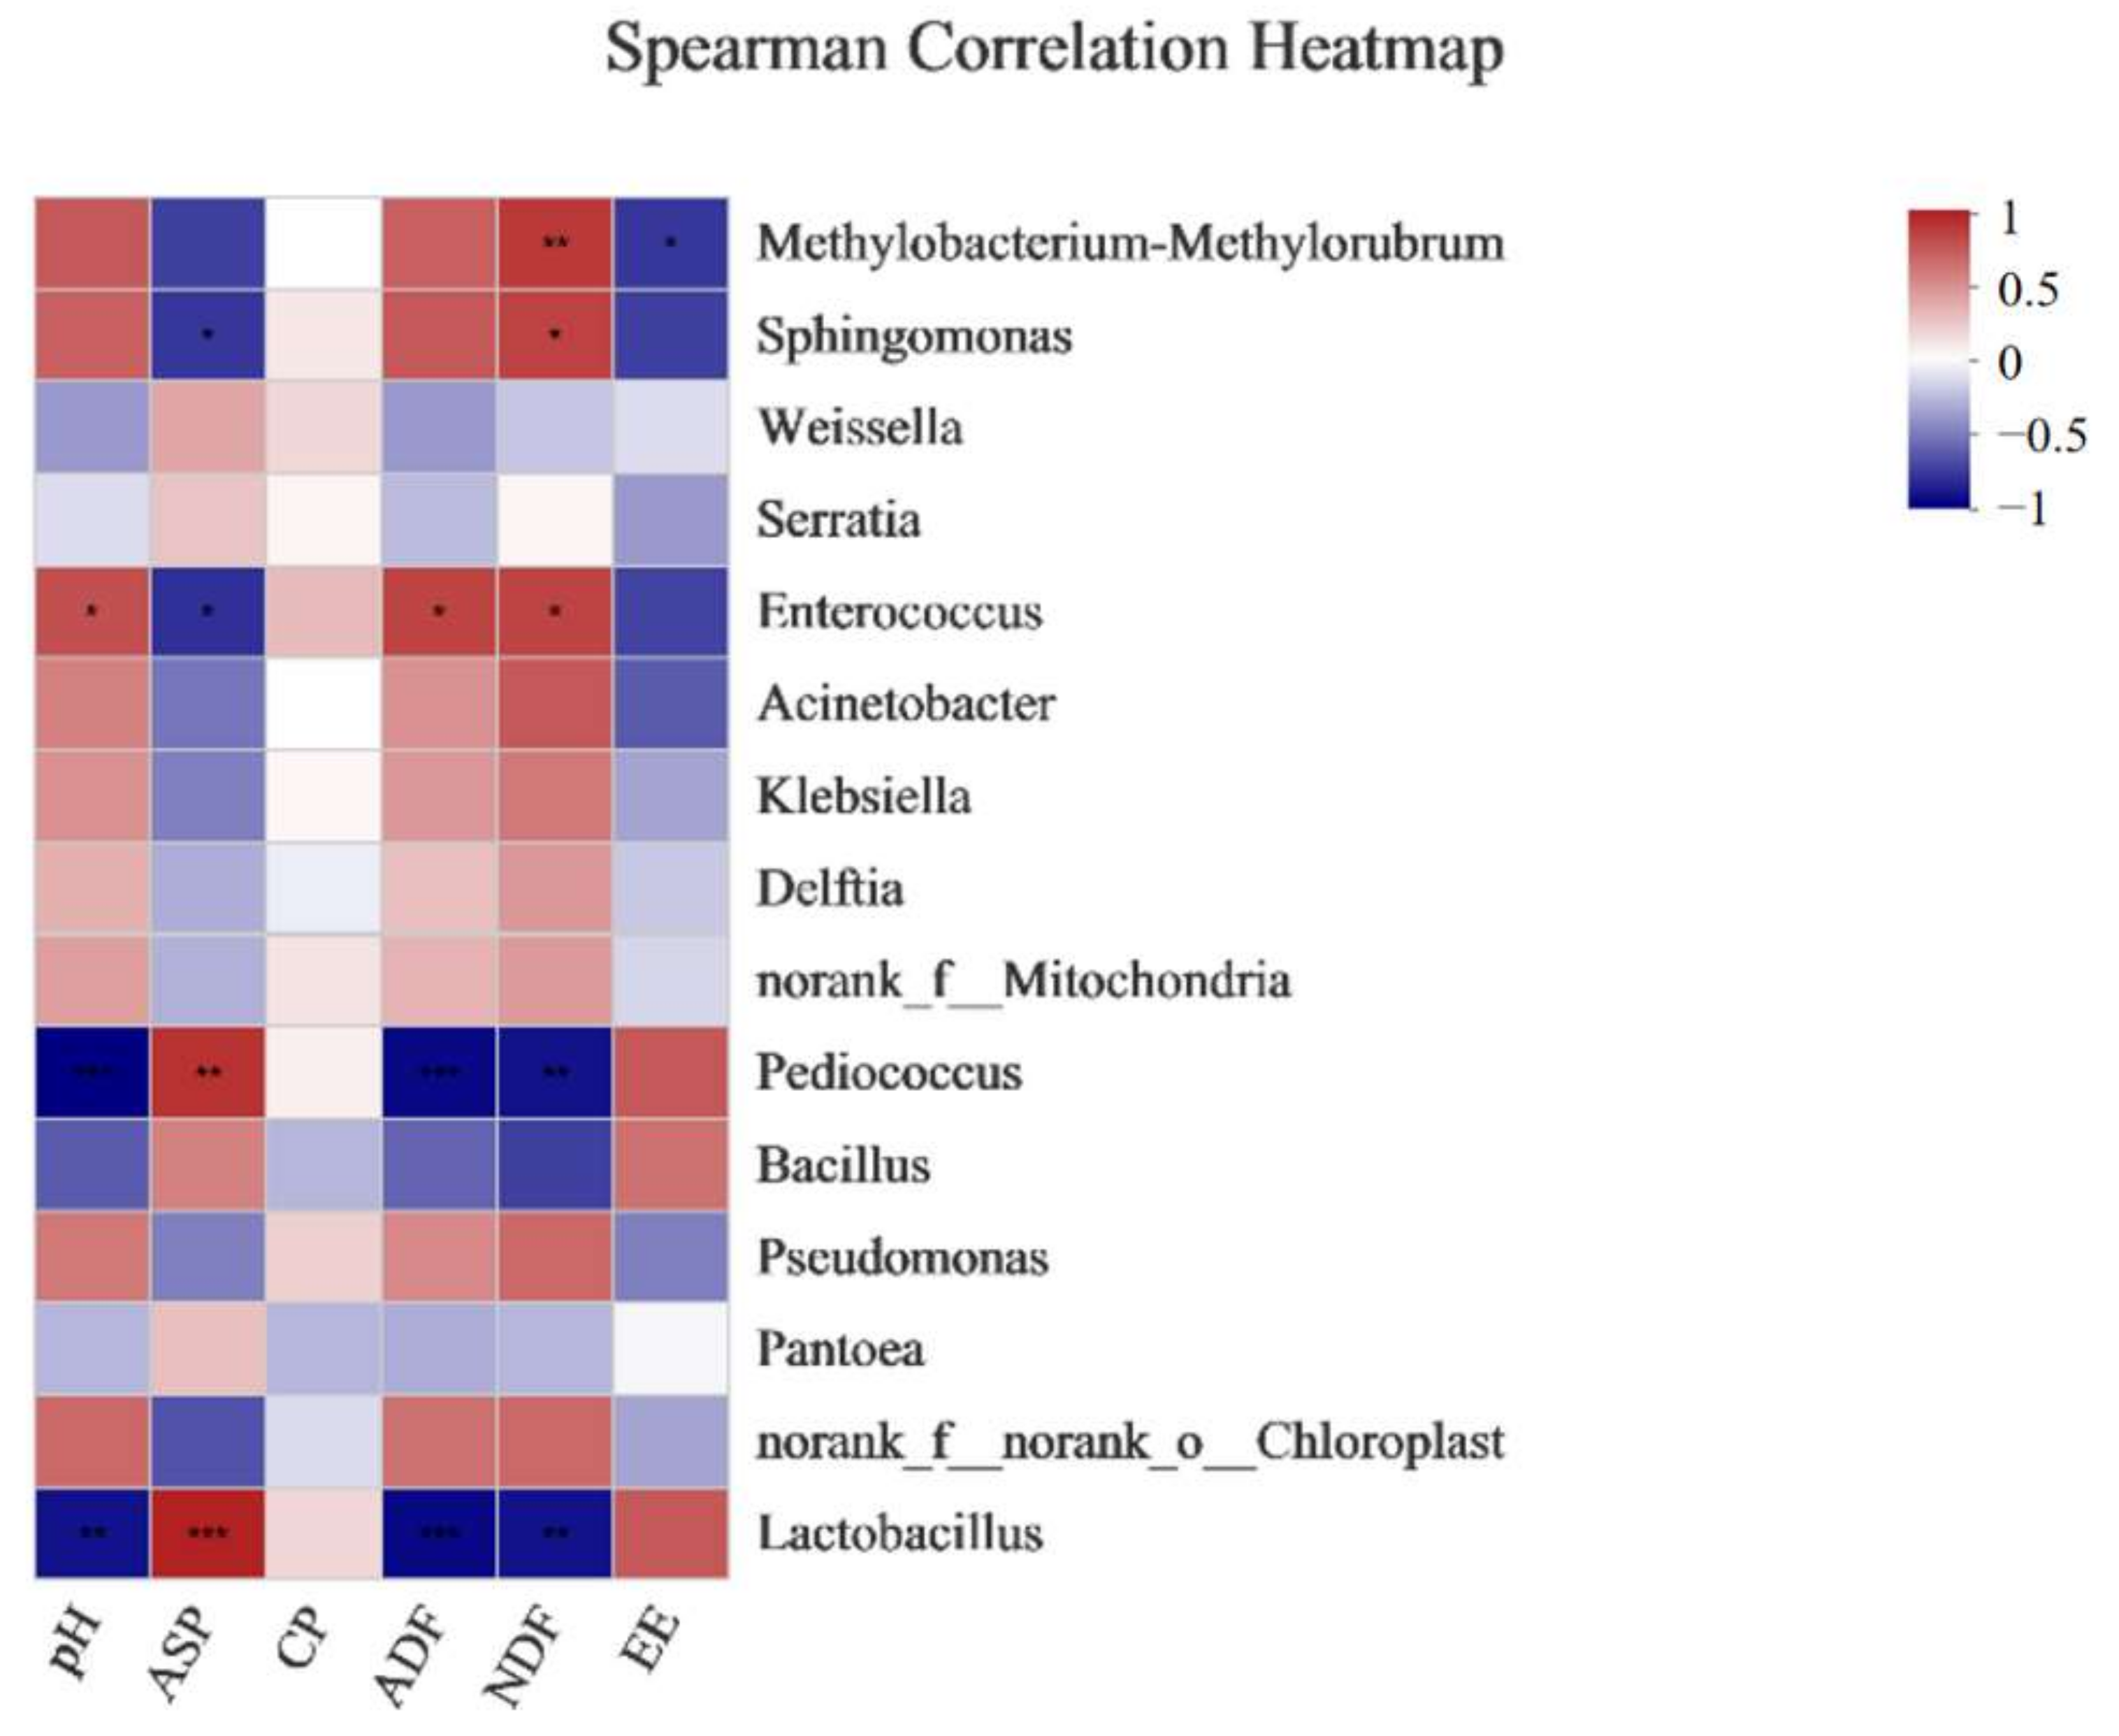
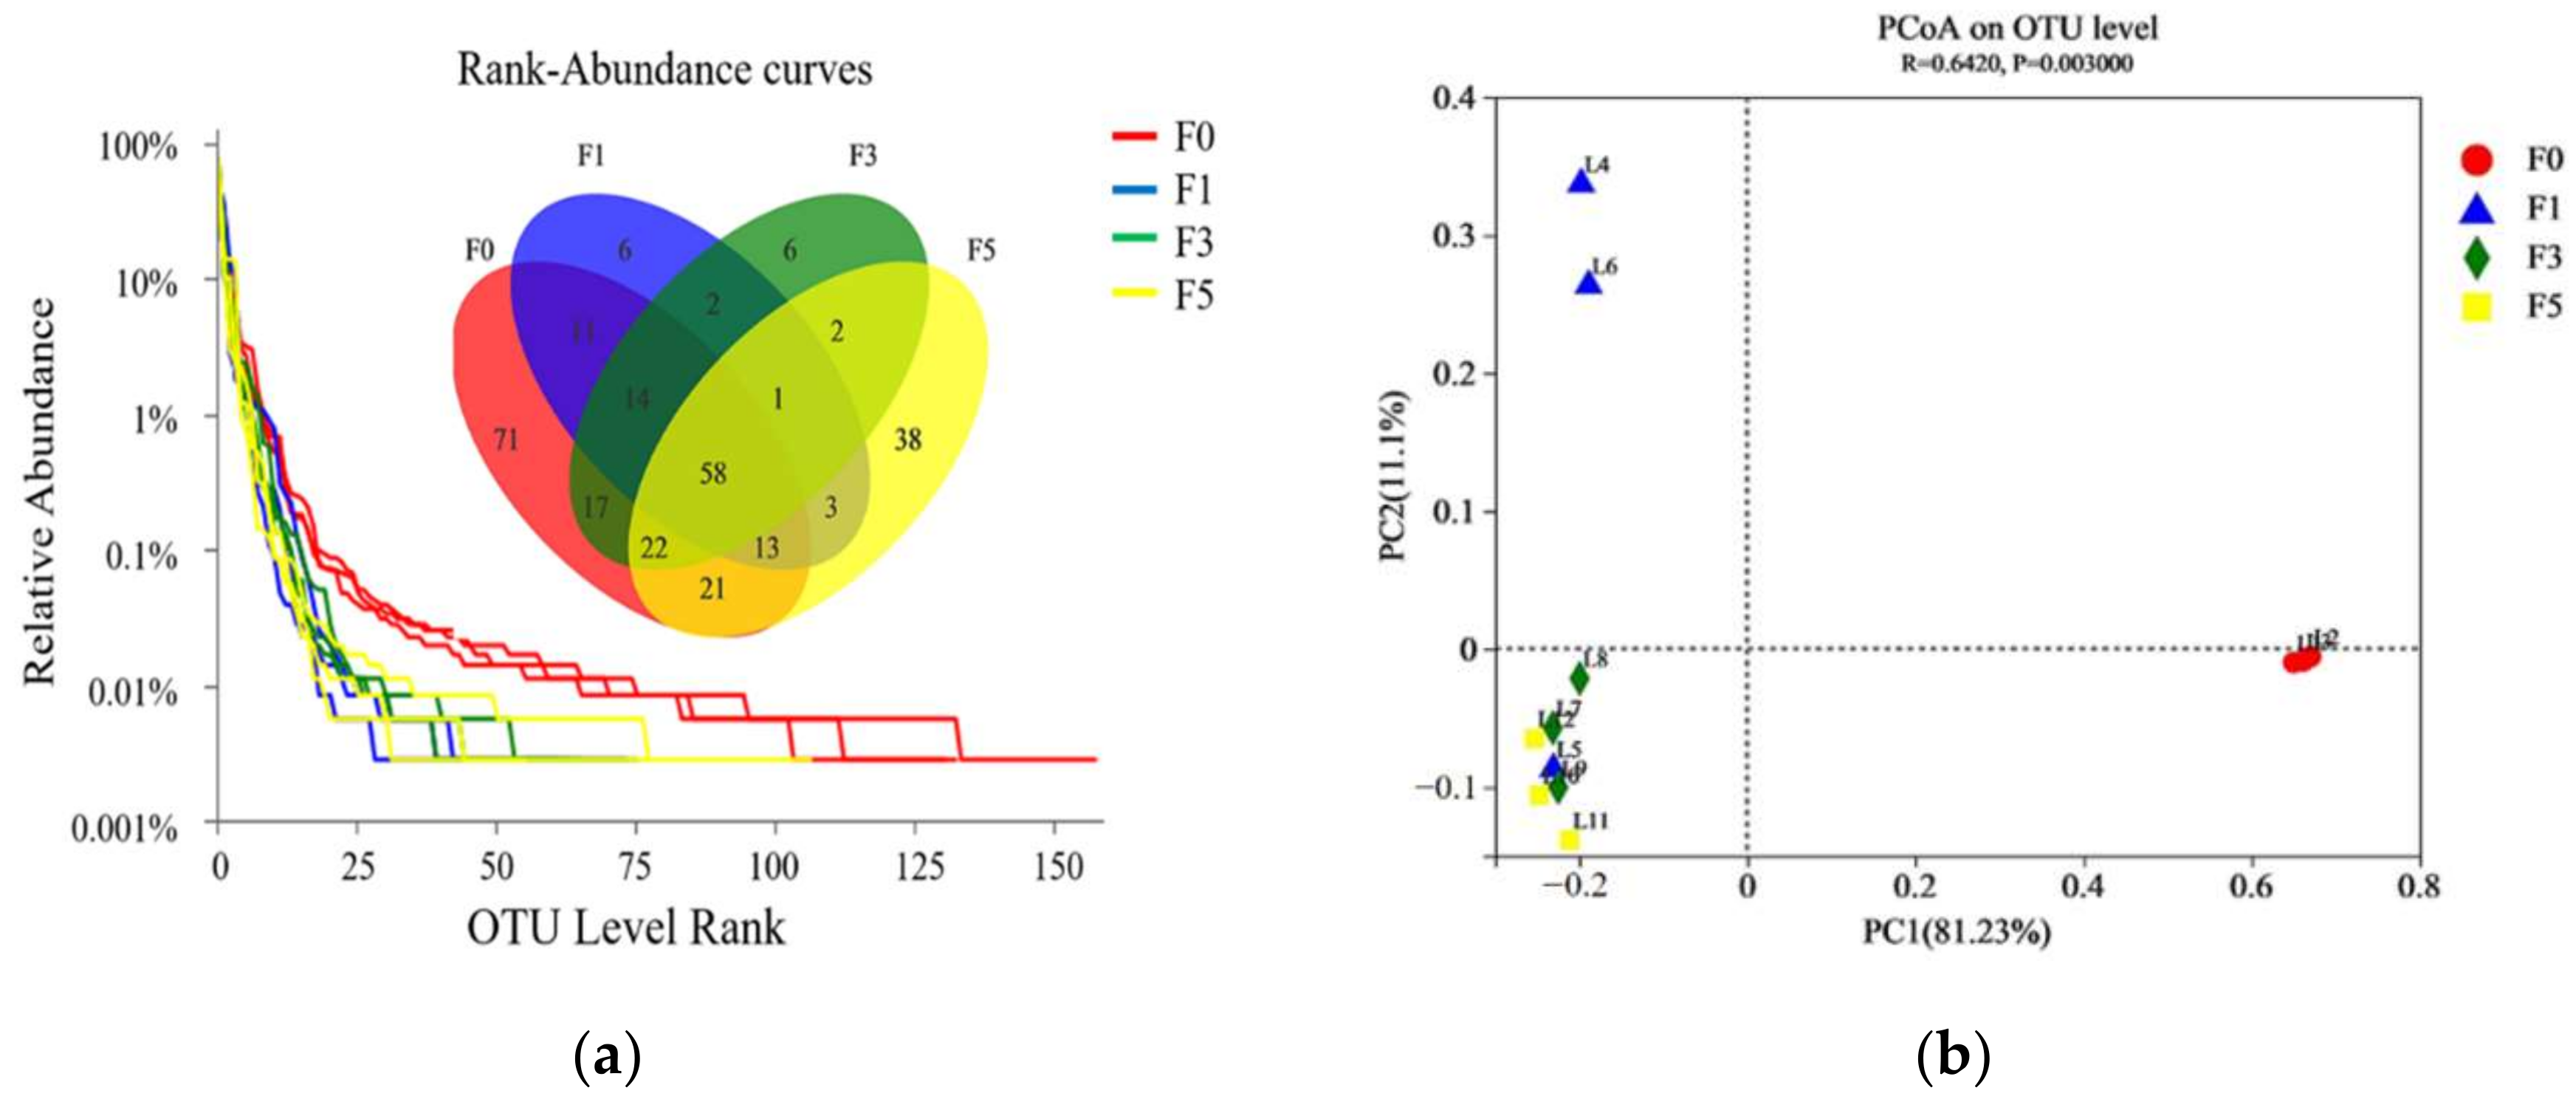
3.2. Bacterial Community of Tea Residue Mixture during Fermentation

A total of 285 OTUs were identified in the four groups from day 0 to day 5. Among these, 58 OTUs were found in all groups, accounting for 20.35% of the total OTUs (Figure 1a). Based on the PCoA graph (Figure 1b), the clouds of the four groups were divided into three main sections, with groups F3 and F5 close together. This indicated that the difference in the bacterial community succession was evident between group F0 and other groups, but that between group F3 and group F5 was minor.
As shown in Table 4, the coverage values of all groups were around 99.9%, indicating that the analysis of the bacterial community was credible. The Chao1, Ace, and Shannon indices were significantly higher in group F0 than in group F1, F3, and F5 (p < 0.05), indicating that the diversity of bacteria community contained in group F0 was significantly higher than in the other groups. The diversity of the bacteria community contained in groups F1, F3, and F5 were not significantly different (p > 0.05).
The bacterial communities of the tea residue mixture at different fermentation times are displayed in Figure 2. Three bacterial phyla (Firmicutes, Proteobacteria, and Cyanobacteria) were identified in the tea residue with a relatively high abundance (>1%) (Figure 2a). The main bacteria in group F0 were Cyanobacteria (60.02%) and Proteobacteria (35.03%). As the fermentation time increased, Cyanobacteria and Proteobacteria gradually decreased, while Firmicutes gradually increased. The top ten dominant bacterial genera are shown in Figure 2b. The main microbiota in group F0 was norank_f_norank_o_Chloroplast (60.02%) and Pseudomonas (18.15%). The main bacteria in group F1 were Lactobacillus (39.07%), Pantoea (42.30%), and Bacillus (13.51%). However, Lactobacillus, Bacillus, and Pediococcus were the main bacteria in groups F3 and F5.
The bacterial communities were mainly correlated with pH and ASP, ADF, and NDF content (Figure 3). Enterococcus, Pediococcus, and Lactobacillus were the main organisms that affected these indicators. Enterococcus was positively correlated with pH, ADF, and NDF, and negatively correlated with ASP (p < 0.05). Pediococcus and Lactobacillus were positively correlated with ASP but negatively correlated with pH, ADF, and NDF. Methylobacterium-Methylorubrum and Sphingomonas were positively correlated with NDF. However, Methylobacterium-Methylorubrum had a negative effect on EE and Sphingomonas had a negative effect on ASP.

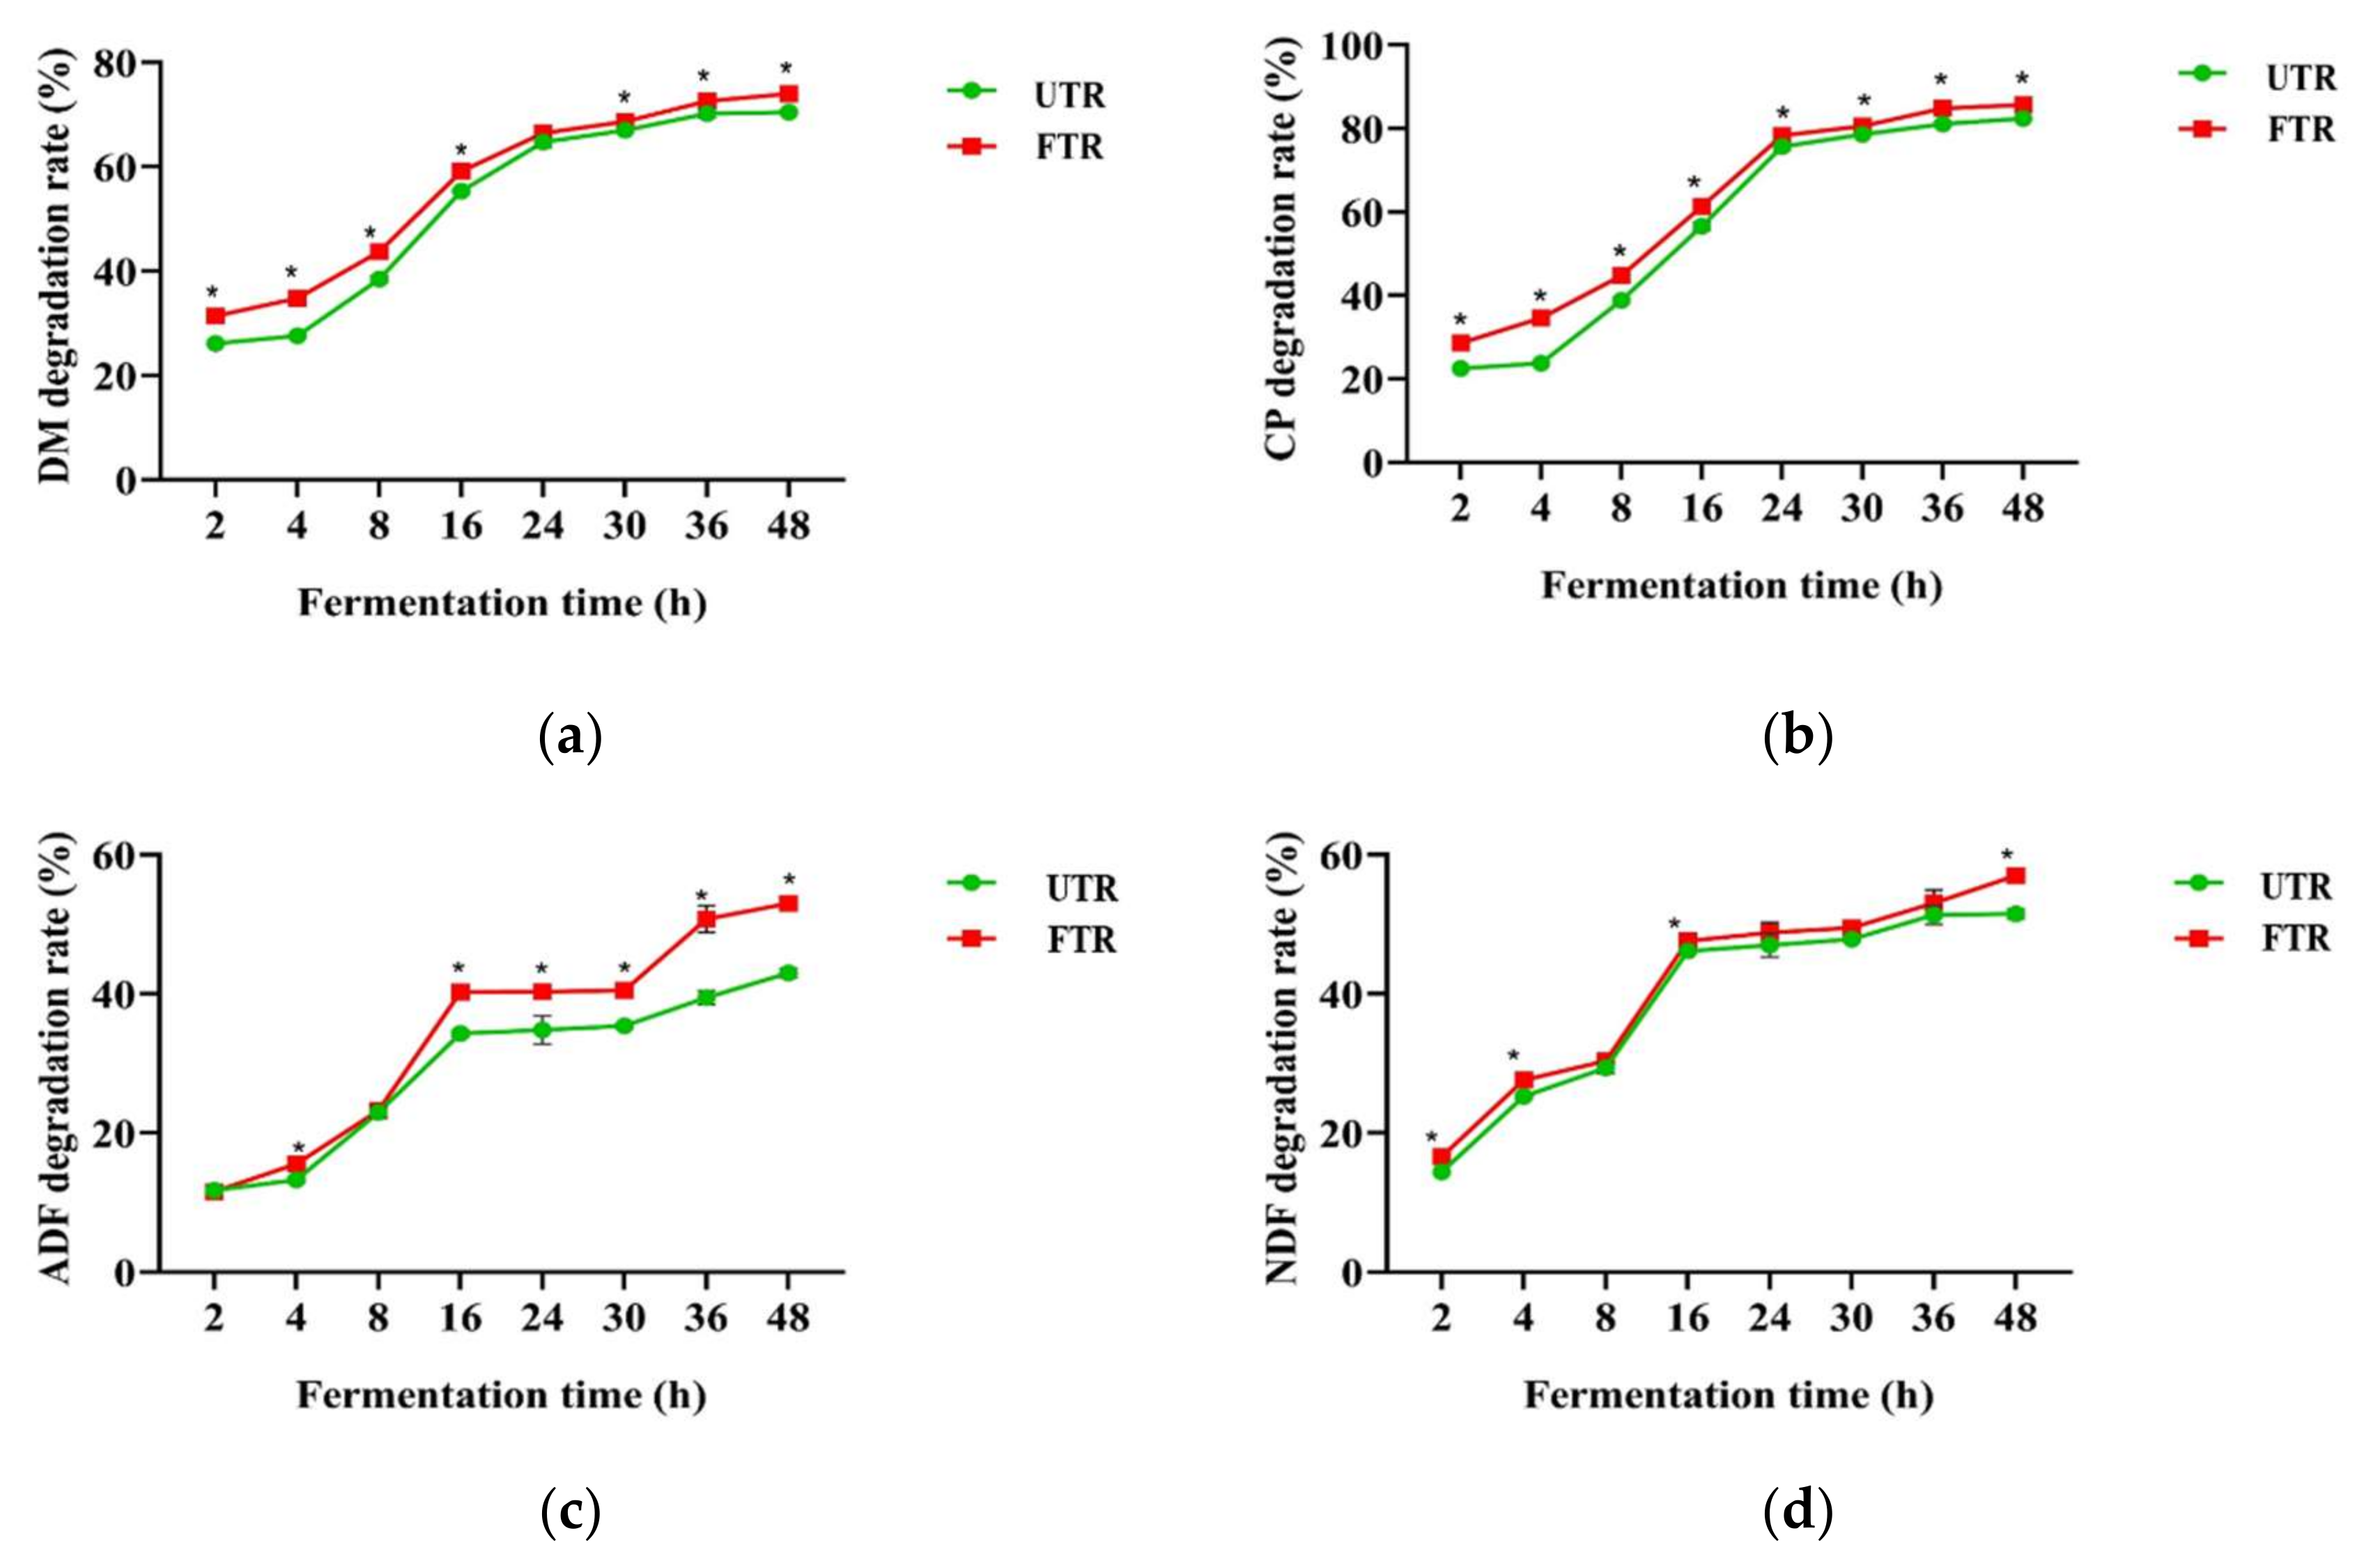
3.3. Rumen Degradation Rates of Unfermented and Fermented Tea Residue Mixtures

As shown in Figure 4, the rumen degradation rates of DM, CP, ADF, and NDF increased with the extension of the incubation time from 0 to 48 h. All of the above indicators were higher in the FTR than in the UTR. The rumen degradation rate of DM was significantly higher in FTR than in the UTR for all incubation times except 24 h (p < 0.05). The rumen degradation rate of CP was significantly higher in the FTR than in the UTR at all incubation times (p < 0.05). The rumen degradation rate of ADF was significantly higher in the FTR than in the UTR for all incubation times except 2 h and 8 h (p < 0.05). The rumen degradation rate of ADF was significantly higher in the FTR than in the UTR when the incubation time was 2 h, 4 h, 16 h, or 48 h (p < 0.05).
The rumen degradation parameters are presented in Table 5. Compared to the UTR, the rapidly degradable components (a) of DM, CP, and NDF were all significantly higher in the FTR (p < 0.05). Furthermore, the total degradable component (a + b) and effective degradability (ED) of DM, CP, ADF, and NDF were also higher in the FTR (p < 0.05). However, the potentially degradable components (b) of DM and CP were significantly lower in the FTR (p < 0.05). The constant rate of degradation of b (c) of ADF and NDF of FTR were also significantly decreased (p < 0.05).

4. Discussion

Tea residue is a byproduct of tea processing and is mostly discarded as industrial waste. Tea residue still contains many nutrients, and its rational processing can be expected to produce excellent animal feed. This study investigated the effect of the fermentation of tea residue mixed with wheat bran by B. licheniformis and L. plantarum on its chemical composition, bacterial community, and ruminal degradation rate.
In our study, ASP, CP, and EE of tea residue mixture were increased after fermentation, while pH, ADF, and NDF were decreased. Microbial fermentation of sugars and organic acids in crops releases gases such as carbon dioxide and hydrogen, which can cause dry matter loss [35]. As shown in this study, DM loss increased cumulatively, and the contents of ASP, CP, and EE in the tea residue wheat bran mixture also increased with the increase of DM loss. L. plantarum can produce lactic acid, acetic acid, propionic acid, phenyllactic acid, formic acid, and succinic acid, and then reduce the pH value [36]. In our study, the L. plantarum population increased with the duration of fermentation, which in turn caused a constant decrease in pH. In addition, Inca-Torres et al. [37] showed that B. licheniformis can inherently produce protease, cellulase, and lipase. Proteases decompose proteins by hydrolyzing them into amino acids and peptides [16], thus increasing the acid-soluble protein content [38]. In this study, protease activity increased and then decreased, reaching a maximum at 3 d of fermentation. Hao et al. [39] used B. licheniformis to anaerobically ferment litchi pomace. Their results, similar to the results of our experiment, showed that protease activity first increased and then decreased, and reached a maximum at 2.5 d of fermentation. Cellulase activity showed a decreasing trend. The results of our previous trials showed that both B. licheniformis and L. plantarum used in the current experiment reached their peak enzyme activity at 2 d of fermentation. The addition of L. plantarum and B. licheniformis to the tea residue mixture produced cellulase, which degraded cellulose to monosaccharides or oligosaccharides, thereby reducing the ADF and NDF content. Low fiber content can promote the utilization of the feed by rumen microorganisms, resulting in higher fermentation rates [40]. Shi et al. [41] fermented wheat bran with a complex bacterial solution containing Bacillus subtilis, which increased the EE and ASP content of the wheat bran and reduced the NDF content, similar to the results of our current study.
This current study showed that the diversity of the bacterial community in the tea residue mixture was lower after fermentation (F1, F3, and F5) than before (F0), which was similar to the results reported by Xu et al. [42]. Prior to fermentation, there was a considerable abundance of aerobic and facultative anaerobic bacteria, such as norank_f_norank_o_Chloroplast, Pseudomonas, norank_f_Mitochondria, Delftia, and Klebsiella, but limited abundance of Lactobacillus. However, anaerobic bacteria became the dominant bacterial community due to the constant depletion of oxygen during fermentation [43]. Li et al. [44] also showed that the absolute dominant bacteria of the raw Pu-erh tea sample was norank_o_Chloroplast. Bacillus, Pantoea, Pediococcus, Pseudomonas, and other genera were also identified in raw Pu-erh tea and its fermented variety. Same as our results, Sun et al. [45] reported that after anaerobic fermentation of paper mulberry silage, the relative bacterial abundance of Lactobacillus was enhanced.
Firmicutes, Proteobacteria, and Cyanobacteria were shown to be the dominant phyla in the tea residue mixture. Bacteria of the bacterial phyla Firmicutes are associated with fiber degradation and polysaccharide degradation [46]. In addition, Proteobacteria are involved in the formation of biofilms and the digestion of soluble carbohydrates [47]. Tong et al. [48] identified the main bacterial phyla from black and green tea leaves as Protobacteria, Firmicutes, and Cyanobacteria along with Actinobacteria and Bacteroidetes, somewhat consistent with the results of our study. In our study, Firmicutes increased after fermentation. The reason for this result may be the addition of B. licheniformis and L. plantarum to groups F1, F3, and F5. Sperman correlation analysis demonstrated that Pediococcus and Lactobacillus were positively correlated with ASP but negatively correlated with pH, ADF, and NDF. However, Enterococcus had the opposite effect.
The in situ nylon bag method is an approach used to evaluate the difficulty of feed utilization and the degradation and utilization efficiency of feed in the rumen [49]. Ruminal microbes degrade dietary nutrients and convert them into ammonia nitrogen, microbial crude protein, and volatile fatty acids to provide nutrition for ruminants [46]. Dry matter degradability is an important index that can reflect the degradation extent of feed in the rumen [50]. In our study, the rumen degradation rates of DM, CP, ADF, and NDF for both FTR and UTR increased with the extension of the incubation time. Furthermore, the rumen degradation rate of DM, CP, ADF, and NDF for FTR were higher than those of UTR. It is possible that the B. licheniformis and L. plantarum used in fermentation in this study disrupted the cell wall structure of the tea residue, releasing more plant proteins and cellulose. Microorganisms use these plant proteins to synthesize microbial proteins that are better digested and absorbed by the animals, thereby increasing the rumen degradation rates of CP [51]. Furthermore, Lactobacillus can degrade part of lignin and release hemicellulose and cellulose. These sugars are broken down by rumen microorganisms into monosaccharides that are more easily absorbed by ruminants, accelerating the rumen degradation rates of ADF and NDF [52]. Li et al. [53] used L. plantarum for cassava silage and significantly improved its DM and CP degradation rate in the rumen of Hainan black goats. Zhao et al. [54] improved the rumen degradation rates of DM, CP, and NDF in dairy cows using lactic acid bacteria mixed with silage soybean residue and corn stover. In addition, the use of L. plantarum (Chikuso-1) for silage of stylo also increased the rumen degradation rates of DM, CP, ADF, and NDF in Hainan black goats by Li et al. [55], which was similar to the results of this experiment.

5. Conclusions

The mixed fermentation of tea residue mixture using L. plantarum and B. licheniformis can produce proteases and cellulase that degrade large molecules of protein and fiber, thereby improving the chemical composition and rumen degradation rate of the tea residue mixture. In addition, pH of the tea residue mixture decreased after fermentation which inhibits the growth of some harmful bacteria and reduces the diversity of the bacterial community. As such, L. plantarum and B. licheniformis can be used to develop tea residue fermented feed.

Author Contributions

Conceptualization, X.H.; methodology, X.H., Y.X. (Yinying Xu) and X.W.; software, X.H., Y.X. (Yinying Xu), X.W. and Y.D.; validation, Y.X. (Yinying Xu) and X.W.; investigation, X.H., Y.X. (Yinying Xu), X.W. and Y.D.; resources, X.H., Y.D. and X.W.; data curation, X.H., Y.X. (Yinying Xu) and X.W.; writing—original draft preparation, X.H. and Y.X. (Yinying Xu); writing—review and editing, J.C.; supervision, J.C., C.F., Z.Z. and Y.X. (Yanfeng Xue); funding acquisition, J.C. All authors have read and agreed to the published version of the manuscript.

Funding

This research was funded by Key Research and Development Program of Anhui Province (202004a06020006; 202004a06020012) and the Shanghai Science and Technology Promotion Project for Agriculture (Shanghai Agriculture Science Promotion Project (2019) No. 1-2).

Institutional Review Board Statement

Not applicable.

Informed Consent Statement

Not applicable.

Data Availability Statement

The data presented in this study are available on request from the first author. The data are not publicly available due to restrictions by the research group.

Conflicts of Interest

The authors declare no conflict of interest.

References

  1. Food and Agriculture Organization of the United Nations, Statistics Division. World Tea Production in 2020. Available online: http://www.fao.org/faostat/en/#data/QCL (accessed on 30 January 2022).
  2. Statistical Bureau of the People’s Republic of China. China Statistical Yearbook; China Statistics Press: Beijing, China, 2021.
  3. Ding, X.; Li, H.; Wen, Z.; Hou, Y.; Wang, G.; Fan, J.; Qian, L. Effects of fermented tea residue on fattening performance, meat quality, digestive performance, serum antioxidant capacity, and intestinal morphology in fatteners. Animals 2020, 10, 185. [Google Scholar] [CrossRef] [PubMed] [Green Version]
  4. Li, L.; Guo, X.; Zhao, T.; Li, T. Green waste composting with bean dregs, tea residue, and biochar: Effects on organic matter degradation, humification and compost maturity. Environ. Technol. 2021, 24, 101887. [Google Scholar] [CrossRef]
  5. Kondo, M.; Kita, K.; Yokota, H.O. Effects of tea leaf waste of green tea, oolong tea, and black tea addition on sudangrass silage quality and in vitro gas production. J. Sci. Food. Agric. 2004, 84, 721–727. [Google Scholar] [CrossRef]
  6. Ramdani, D.; Chaudhry, A.S.; Seal, C.J. Chemical composition, plant secondary metabolites, and minerals of green and black teas and the effect of different tea-to-water ratios during their extraction on the composition of their spent leaves as potential additives for ruminants. J. Agric. Food Chem. 2013, 61, 4961–4967. [Google Scholar] [CrossRef]
  7. Basumatary, V.; Saikia, R.; Narzari, R.; Bordoloi, N.; Gogoi, L.; Sut, D.; Bhuyan, N.; Kataki, R. Tea factory waste as a feedstock for thermo-chemical conversion to biofuel and biomaterial. Mater. Today 2018, 5, 23413–23422. [Google Scholar] [CrossRef]
  8. Zheng, X.; Xie, X.; Yu, C.; Zhang, Q.; Wang, Y.; Cong, J.; Liu, J. Unveiling the activating mechanism of tea residue for boosting the biological decolorization performance of refractory dye. Chemosphere 2019, 233, 110–119. [Google Scholar] [CrossRef]
  9. Li, S.; Cao, X. Extraction of tea polysaccharides (TPS) using anionic reverse micellar system. Sep. Purif. Technol. 2014, 122, 306–314. [Google Scholar] [CrossRef]
  10. Kondo, M.; Kita, K.; Yokota, H.O. Ensiled or oven-dried green tea by-product as protein feedstuffs: Effects of tannin on nutritive value in goats. Asian Austral. J Anim. 2007, 20, 880–886. [Google Scholar] [CrossRef]
  11. Nasehi, M.; Torbatinejad, N.M.; Rezaie, M.; Ghoorchi, T. Effects of partial substitution of alfalfa hay with green tea waste on growth performance and in vitro methane emission of fat-tailed lambs. Small Rumin. Res. 2018, 168, 52–59. [Google Scholar] [CrossRef]
  12. Sakarika, M.; Delmoitié, B.; Ntagia, E.; Chatzigiannidou, I.; Gabet, X.; Ganigué, R.; Rabaey, K. Production of microbial protein from fermented grass. Chem. Eng. J. 2021, 433, 133631. [Google Scholar] [CrossRef]
  13. Saeed, A.H.; Salam, A.I. Current limitations and challenges with lactic acid bacteria: A review. Pol. J. Food. Nutr. Sci. 2013, 4, 73–87. [Google Scholar]
  14. Hoover, G.; Steenson, L.R. Bacteriocins of Lactic Acid Bacteria; Academic Press Inc.: New York, NY, USA, 1993. [Google Scholar]
  15. Gopal, N.; Hill, C.; Ross, P.R.; Beresford, T.P.; Fenelon, M.A.; Cotter, P.D. The prevalence and control of Bacillus and related spore-forming bacteria in the dairy industry. Front. Microbiol. 2015, 6, 1418. [Google Scholar] [CrossRef]
  16. Contesini, F.J.; Melo, R.R.D.; Sato, H.H. An overview of Bacillus proteases: From production to application. Crit. Rev. Biotechnol. 2018, 38, 321–334. [Google Scholar] [CrossRef]
  17. Su, Y.; Liu, C.; Fang, H.; Zhang, D. Bacillus subtilis: A universal cell factory for industry, agriculture, biomaterials and medicine. Microb. Cell Factories 2020, 19, 1–12. [Google Scholar] [CrossRef]
  18. Guo, X.S.; Ke, W.C.; Ding, W.R.; Ding, L.M.; Xu, D.M.; Wang, W.W.; Zhang, P.; Yang, F.Y. Profiling of metabolome and bacterial community dynamics in ensiled Medicago sativa inoculated without or with Lactobacillus plantarum or Lactobacillus buchneri. Sci. Rep. 2018, 8, 357. [Google Scholar] [CrossRef] [Green Version]
  19. Ren, F.; He, R.C.; Zhou, X.K.; Gu, Q.C.; Xia, Z.S.; Liang, M.Z.; Zhou, J.H.; Lin, B.; Zou, C.X. Dynamic changes in fermentation profiles and bacterial community composition during sugarcane top silage fermentation: A preliminary study. Bioresour. Technol. 2019, 285, 121315. [Google Scholar] [CrossRef]
  20. Zhang, L.Y. Feed Analysis and Quality Test Technology, 4th ed.; China Agricultural University: Beijing, China, 2002; pp. 46–47. [Google Scholar]
  21. Van Soest, P.V.; Robertson, J.B.; Lewis, B.A. Methods for dietary fiber, neutral detergent fiber, and nonstarch polysaccharides in relation to animal nutrition. J. Dairy Sci. 1991, 74, 3583–3597. [Google Scholar] [CrossRef]
  22. GB/T 28715-2012; Determination of Acidic and Neutral Protease Activity of Feed Additives Spectrophotometric Method. China Agriculture Press: Beijing, China, 2012.
  23. NY/T 912-2020; Determination of Cellulase Activity of Feed Additives Spectrophotometric Method. China Agriculture Press: Beijing, China, 2020.
  24. NY/T 3801-2020; Determination of Acid-Soluble Protein in Feed Materials. China Agriculture Press: Beijing, China, 2020.
  25. GB/T 27985-2011; Determination of Tannin in Feeds-Spectrophotometric. China Agriculture Press: Beijing, China, 2011.
  26. Liu, C.; Zhao, D.; Ma, W.; Guo, Y.; Wang, A.; Wang, Q.; Lee, D.J. Denitrifying sulfide removal process on high-salinity wastewaters in the presence of Halomonas sp. AMBA 2016, 100, 1421–1426. [Google Scholar] [CrossRef]
  27. Chen, S.; Zhou, Y.; Chen, Y.; Gu, J. fastp: An ultra-fast all-in-one FASTQ preprocessor. Bioinformatics 2018, 34, i884–i890. [Google Scholar] [CrossRef]
  28. Magoč, T.; Salzberg, S.L. FLASH: Fast length adjustment of short reads to improve genome assemblies. Bioinformatics 2011, 27, 2957–2963. [Google Scholar] [CrossRef]
  29. Schloss, P.D.; Westcott, S.L.; Ryabin, T.; Hall, J.R.; Hartmann, M.; Hollister, E.B.; Lesniewski, R.A.; Oakley, B.B.; Parks, D.H.; Robinson, C.J.; et al. Introducing mothur: Open-source, platform-independent, community-supported software for describing and comparing microbial communities. AEM 2009, 75, 7537–7541. [Google Scholar] [CrossRef] [Green Version]
  30. Ma, J.; Sun, G.; Shah, A.M.; Fan, X.; Li, S.; Yu, X. Effects of different growth stages of amaranth silage on the rumen degradation of dairy cows. Animals 2019, 9, 793. [Google Scholar] [CrossRef] [Green Version]
  31. Ma, Y.; Khan, M.Z.; Liu, Y.; Xiao, J.; Chen, X.; Ji, S.; Cao, Z.; Li, S. Analysis of nutrient composition, rumen degradation characteristics, and feeding value of Chinese rye grass, barley grass, and naked oat straw. Animals 2021, 11, 2486. [Google Scholar] [CrossRef]
  32. Nasehi, M.; Torbatinejad, N.M.; Rezaie, M.; Ghoorchi, T. The effect of green tea waste extract on ruminal degradability and intestinal digestibility of barley grain. Turk. J. Vet. Anim. Sci. 2018, 42, 624–632. [Google Scholar] [CrossRef]
  33. Ørskov, E.R.; McDonald, I. The estimation of protein degradability in the rumen from incubation measurements weighted according to rate of passage. J. Agric. Sci. 1979, 92, 499–503. [Google Scholar] [CrossRef] [Green Version]
  34. Wang, J.L.; Wei, Y.H.; Zhao, G.Q. Comparative study on rumen degradation rates and small intestinal digestibilities of nutrients of different residue feeds of dairy cows. J. Nutr. 2022, 34, 1592–1603. [Google Scholar]
  35. Borreani, G.; Tabacco, E.; Schmidt, R.J.; Holmes, B.J.; Muck, R.E. Silage review: Factors affecting dry matter and quality losses in silages. J. Dairy Sci. 2018, 101, 3952–3979. [Google Scholar] [CrossRef] [Green Version]
  36. Behera, S.S.; Ray, R.C.; Zdolec, N. Lactobacillus plantarum with functional properties: An approach to increase safety and shelf-life of fermented foods. BioMed Res. Int. 2018, 2018, 9361614. [Google Scholar] [CrossRef] [Green Version]
  37. Inca-Torres, A.R.; Urbina-Salazar, A.D.R.; Falcón-García, G.; Carbonero-Aguilar, P.; Morgado, B.R.; Parrado, J.; Bautista, J. Hydrolytic enzymes production by Bacillus licheniformis growth on fermentation media formulated with sewage sludge. J. Biotech Res. 2018, 9, 14–26. [Google Scholar]
  38. Patra, A.K.; Aschenbach, J.R. Ureases in the gastrointestinal tracts of ruminant and monogastric animals and their implication in urea-N/ammonia metabolism: A review. J. Adv. Res. 2018, 13, 39–50. [Google Scholar] [CrossRef]
  39. Hao, S.; Yu, Y.; Chen, W.; Wu, J.; Xiao, G.; Xu, Y.; Zou, Y. Effect of anaerobic fermentation of Bacillus licheniformis on physicochemical properties of litchi pomace. Feed. Res. 2019, 42, 5. [Google Scholar]
  40. Van Soest, P.J. Fibre and physicochemical properties of feeds. In Nutritional Ecology of the Ruminant, 2nd ed.; Thomas, L.P., Ed.; Cornell University Press: Ithaca, NY, USA, 1994. [Google Scholar]
  41. Shi, B.; He, W. Increasing Fat and Acid-Soluble Protein Content in Wheat Bran, by Inoculating Bacteria Liquid Containing Bacillus Subtilis with Sterile Water and Inorganic Salt Nutrient Solution into Wheat Bran, Mixing, and Performing Sealed Fermentation: China, CN112021451-A. 2020. Available online: http://epub.cnipa.gov.cn/ (accessed on 30 January 2022).
  42. Xu, D.; Ding, Z.; Wang, M.; Bai, J.; Ke, W.; Zhang, Y.; Guo, X. Characterization of the microbial community, metabolome and biotransformation of phenolic compounds of sainfoin (Onobrychis viciifolia) silage ensiled with or without inoculation of Lactobacillus plantarum. Bioresour. Technol. 2020, 316, 123910. [Google Scholar] [CrossRef] [PubMed]
  43. Lin, C.; Bolsen, K.K.; Brent, B.E.; Hart, R.A.; Dickerson, J.T.; Feyerherm, A.M.; Aimutis, W.R. Epiphytic microflora on alfalfa and whole-plant corn. J. Dairy Sci. 1992, 75, 2484–2493. [Google Scholar] [CrossRef]
  44. Li, J.; Wu, J.; Xu, N.; Yu, Y.; Brake, J.; Xu, R.; Wu, X. Dynamic evolution and correlation between microorganisms and metabolites during manufacturing process and storage of Pu-erh tea. LWT 2022, 158, 113128. [Google Scholar] [CrossRef]
  45. Sun, W.T.; Huang, Y.; Wu, C.R.; Peng, C.; Zheng, Y.L.; Chen, C.; Hao, J. Addition of lactic acid bacteria can promote the quality and feeding value of Broussonetia papyrifera (Paper Mulberry) Silage. Fermentation 2022, 8, 25. [Google Scholar] [CrossRef]
  46. Xu, Y.; Aung, M.; Sun, Z.; Zhou, Y.; Cheng, Y.; Hao, L.; Padmakumar, V.; Zhu, W. Bio-fermentation improved rumen fermentation and decreased methane concentration of rice straw by altering the particle-attached microbial community. Fermentation 2022, 8, 72. [Google Scholar] [CrossRef]
  47. Pitta, D.W.; Pinchak, W.E.; Indugu, N.; Vecchiarelli, B.; Sinha, R.; Fulford, J.D. Metagenomic analysis of the rumen microbiome of steers with wheat-induced frothy bloat. Front. Microbiol. 2016, 7, 689. [Google Scholar] [CrossRef] [Green Version]
  48. Tong, W.; Yu, J.; Wu, Q.; Hu, L.; Tabys, D.; Wang, Y.; Wei, C.; Ling, T.; Inayat, M.; Bennetzen, J.L. Black tea quality is highly affected during processing by its leaf surface microbiome. J. Agric. Food Chem. 2021, 69, 7115–7126. [Google Scholar] [CrossRef]
  49. Luo, C.; Wang, D.; Lu, N.; Li, H.; Liu, G.; Cao, Z.; Yang, H.; Li, S.; Yu, X.; Shao, W.; et al. Analysis of chemical composition, amino acid content, and rumen degradation characteristics of six organic feeds. Animals 2022, 12, 682. [Google Scholar] [CrossRef]
  50. Wang, W.; Wu, Q.; Li, W.; Wang, Y.; Zhang, F.; Lv, L.; Li, S.; Yang, H. High-gossypol whole cottonseed exhibited mediocre rumen degradability and less microbial fermentation efficiency than cottonseed hull and cottonseed meal with an in vitro gas production technique. Fermentation 2022, 8, 103. [Google Scholar] [CrossRef]
  51. Yu, P.; Christensen, D.A.; McKinnon, J.J. In situ rumen degradation kinetics of timothy and alfalfa as affected by culti-var and stage of maturity. Can. J. Anim. Sci. 2004, 84, 255–263. [Google Scholar] [CrossRef]
  52. Han, L.Y.; Li, J.; Na, R.S.; Yu, Z.; Zhou, H. Effect of two additives on the fermentation, in vitro digestibility and aerobic security of Sorghum-sudan grass hybrid silages. Grass Forage Sci. 2015, 70, 185–194. [Google Scholar] [CrossRef]
  53. Li, M.; Zi, X.; Zhou, H.; Lv, R.; Tang, J.; Cai, Y. Silage fermentation and ruminal degradation of cassava foliage prepared with microbial additive. AMB Express 2019, 9, 180. [Google Scholar] [CrossRef]
  54. Zhao, C.; Wang, L.; Ma, G.; Jiang, X.; Yang, J.; Lv, J.; Zhang, Y. Cellulase interacts with lactic acid bacteria to affect fermentation quality, microbial community, and ruminal degradability in mixed silage of soybean residue and corn stover. Animals 2021, 11, 334. [Google Scholar] [CrossRef]
  55. Li, M.; Zhou, H.; Zi, X.; Cai, Y. Silage fermentation and ruminal degradation of stylo prepared with lactic acid bacteria and cellulase. Anim. Sci. J. 2017, 88, 1531–1537. [Google Scholar] [CrossRef]
Figure 1. The rank-abundance curves were derived from the microbial OTU level. (a) The Venn graph illustrates the overlap of microbial OTUs among the treatment groups F0, F1, F3, and F5 at a 3% dissimilarity level; (b) PCoA analysis of taxonomical classifications in groups F0, F1, F3, and F5. Each group has three replicates. Group F0 contains L1, L2, and L3. Group F1 contains L4, L5, and L6. Group F3 contains L7, L8, and L9. Group F5 contains L10, L11, and L12.
Fermentation 08 00380 g001
Figure 2. Relative abundance, following fermentation of the tea residue mixture treatment groups F0, F1, F3, and F5; bacterial communities at the phylum level (a) and genus level (b).
Fermentation 08 00380 g002
Figure 3. Correlation analyses between the chemical compositions and the top 15 tea residue mixture bacterial genera. The red squares show the positive correlations, while the blue squares show the negative correlations. * p ≤ 0.05; ** p ≤ 0.01; *** p ≤ 0.001. ASP = acid-soluble protein, CP = crude protein, ADF = acid detergent fiber, NDF = neutral detergent fiber, and EE = ether extract.
Fermentation 08 00380 g003
Figure 4. Plots of the cumulative rumen degradation rate of components dry matter (DM) (a), crude protein (CP) (b), acid detergent fiber (ADF) (c), and neutral detergent fiber (NDF) (d) in unfermented (UTR) and fermented (FTR) tea residue mixtures.
Fermentation 08 00380 g004
Table 1. Chemical composition of tea residue (% dry matter).
ItemsContent (%)
Dry matter, DM23.12
Crude protein, CP22.81
Ether extract, EE3.01
Acid detergent fiber, ADF25.74
Neutral detergent fiber, NDF39.12
Ash3.44
Calcium, Ca0.62
Phosphorous, P0.21
Acid-soluble protein, ASP2.35
Tea tannin, TTN6.63
Table 2. Composition and nutrient levels of the basic diet.
IngredientsContent (% of DM)Nutrient LevelsContent (% of DM)
Alfalfa hay21.0NEL (Mcal/kg) 11.73
Barley silage17.5Crude protein, CP17.60
Corn33.6Neutral detergent fiber, NDF29.17
Soybean meal12.8Acid detergent fiber, ADF17.40
Cottonseed meal4.3Calcium, Ca1.02
Rapeseed meal2.5Phosphorous, P0.45
Cottonseed4.5
Beet pulp2.1
Dicalcium phosphate0.52
Salt0.42
Sodium bicarbonate0.41
Vitamin–mineral premix10.35
1 NEL is a calculated value, while the other nutrient levels were measured values.
Table 3. Changes in the chemical composition of tea residue mixture at different times following fermentation by L. plantarum and B. licheniformis.
ItemsF0
(0 day)
F1
(1 day)
F3
(3 day)
F5
(5 day)
p-Value
Dry matter loss, DM Loss (%)-0.98 ± 0.03 b1.08 ± 0.05 b1.86 ± 0.01 a<0.01
pH5.91 ± 0.04 a4.40 ± 0.04 b3.97 ± 0.04 c3.93 ± 0.04 c<0.01
Protease activity, PA (U/g)0.15 ± 0.02 d328.96 ± 0.98 b523.18 ± 2.79 a143.41 ± 13.10 c<0.01
Cellulase activity, CA (U/g)0.11 ± 0.01 d30.85 ± 0.24 a11.78 ± 0.43 b6.48 ± 0.23 c<0.01
Acid-soluble protein, ASP (% DM)1.92 ± 0.04 d2.48 ± 0.13 c3.11 ± 0.03 b4.00 ± 0.15 a<0.01
Crude protein, CP (% DM)18.09 ± 0.5018.32 ± 0.1518.32 ± 0.1518.52 ± 0.400.682
Ether extract, EE (% DM)3.59 ± 0.03 c3.63 ± 0.13 c3.93 ± 0.03 b4.38 ± 0.12 a<0.01
Acid detergent fiber, ADF (% DM)23.16 ± 0.54 a22.18 ± 0.17 ab20.46 ± 0.01 bc19.94 ± 1.29 c0.030
Neutral detergent fiber, NDF (% DM)49.94 ± 1.11 a46.53 ± 1.00 b45.57 ± 0.79 b43.90 ± 0.30 c<0.01
F0: fermentation without bacteria for 0 d; F1: fermentation with bacteria for 1 d; F3: fermentation with bacteria for 3 d; F5: fermentation with bacteria for 5 d. a,b,c,d Means ± SD (n = 3) in rows and with different superscript letters indicate a significant difference at p < 0.05.
Table 4. Alpha diversity of tea residue mixture during L. plantarum and B. licheniformis fermentation.
ItemsF0
(0 day)
F1
(1 day)
F3
(3 day)
F5
(5 day)
p-Value
Chao1153.6 ± 10.58 a90.24 ± 22.52 b92.73 ± 10.16 b107.68 ± 18.32 b<0.01
Ace158.82 ± 12.28 a124.04 ± 21.44 b100.31 ± 9.69 b118.00 ± 20.43 b0.016
Shannon1.65 ± 0.20 a1.27 ± 0.24 b1.24 ± 0.05 b1.13 ± 0.17 b0.034
Simpson0.35 ± 0.080.42 ± 0.150.46 ± 0.040.50 ± 0.120.444
Coverage (%)99.94 ± 0.0199.94 ± 0.0299.93 ± 0.0299.93 ± 0.010.861
F0: fermentation without bacteria for 0 d; F1: fermentation with bacteria for 1 d; F3: fermentation with bacteria for 3 d; F5: fermentation with bacteria for 5 d. a,b Means ± SD (n = 3) in rows and without a common superscript are significantly different (p < 0.05). Alpha diversity is the diversity within a particular region or ecosystem and is a composite indicator of abundance and evenness.
Table 5. The rumen degradation parameters of components in tea residue mixtures.
Items 2a 1
(%)
b
(%)
c
(%)
a + b
(%)
ED
(%)
DMUTR
FTR
16.05 ± 0.32 b58.45 ± 0.68 a0.07 ± 0.00274.50 ± 0.60 b56.13 ± 0.16 b
23.61 ± 0.32 a53.50 ± 0.45 b0.06 ± 0.00377.11 ± 0.55 a59.80 ± 0.39 a
CPUTR
FTR
9.61 ± 0.29 b80.05 ± 0.78 a0.06 ± 0.00289.66 ± 0.80 b62.67 ± 0.05 b
19.13 ± 0.52 a73.26 ± 1.00 b0.06 ± 0.00192.40 ± 0.48 a67.16 ± 0.20 a
ADFUTR
FTR
5.60 ± 0.7336.30 ± 0.28 b0.08 ± 0.010 a41.90 ± 1.01 b31.52 ± 0.14 b
6.31 ± 0.6348.45 ± 1.81 a0.06 ± 0.003 b54.76 ± 1.33 a37.67 ± 0.23 a
NDFUTR
FTR
6.90 ± 1.24 b44.53 ± 0.470.11 ± 0.010 a51.42 ± 1.05 b41.41 ± 0.35 b
11.36 ± 1.28 a44.27 ± 1.780.09 ± 0.009 b55.63 ± 1.37 a43.83 ± 0.46 a
1 a: Rapidly degradable component; b: the potentially degradable component; c: the constant rate of degradation of b; a + b: total degradable component; ED: effective degradability. 2 Dry matter (DM), crude protein (CP), acid detergent fiber (ADF), and neutral detergent fiber (NDF), unfermented (UTR), and fermented (FTR). a,b Means ± SD (n = 3) in columns, with the same component, and without a common superscript are significantly different (p < 0.05).
Publisher’s Note: MDPI stays neutral with regard to jurisdictional claims in published maps and institutional affiliations.

