Article

Shaping an Open Microbiome for Butanol Production through Process Control

by
Tiago Pinto
1,*,
Antonio Grimalt-Alemany
2,
Xavier Flores-Alsina
1,
Hariklia N. Gavala
2,
Krist V. Gernaey
1 and
Helena Junicke
1
1
Process and Systems Engineering Center (PROSYS), Department of Chemical and Biochemical Engineering, Technical University of Denmark (DTU), Søltofts Plads, Building 227, 2800 Kongens Lyngby, Denmark
2
Center for Energy Resources Engineering (CERE), Department of Chemical and Biochemical Engineering, Technical University of Denmark (DTU), Søltofts Plads, Building 227, 2800 Kongens Lyngby, Denmark
*
Author to whom correspondence should be addressed.
Fermentation 2022, 8(7), 333; https://doi.org/10.3390/fermentation8070333
Submission received: 19 June 2022 / Revised: 7 July 2022 / Accepted: 11 July 2022 / Published: 15 July 2022

Abstract

:
The growing awareness of limited resource availability has driven production systems towards greater efficiencies, and motivated the transition of wastewater treatment plants to water resource recovery facilities. Open microbiome fermentation offers a robust platform for resource recovery, due to its higher metabolic versatility, which is capable of dealing with even dilute residual liquid streams. Organic matter, e.g., fatty acids, lost in these streams can potentially be recovered into higher value chemicals such as alcohols. This study aims to shape an open microbiome towards butanol production from butyrate and hydrogen through pH control and continuous hydrogen supply. Two sets of experiments were conducted in Scott bottles (1 L) and a lab-fermenter (3 L). The open microbiome produced up to 4.4 mM butanol in 1 L bottles. More promising conversions were obtained when up-scaling to a lab-fermenter with pH control and an increased hydrogen partial pressure of 2 bar; results included a butanol concentration of 10.9 mM and an average volumetric productivity of 0.68 mmol L−1 d−1 after 16 days. This corresponds to 2.98- and 4.65-fold increases, respectively, over previously reported values. Thermodynamic calculations revealed that product formation from butyrate was unfeasible, but energetically favorable from bicarbonate present in the inoculum. For the first time, this study provides insights regarding the community structure of an open microbiome producing butanol from butyrate and hydrogen. DNA sequencing combined with 16S rRNA gene amplicon analysis showed high correlation between Mesotoga spp. and butanol formation. Microbial diversity can also explain the formation of by-products from non-butyrate carbon sources.

1. Introduction

Conversion of organic and industrial waste into higher value commodities has gained much attention as an alternative to the use of pure substrates (e.g., glucose) and food-derived feedstocks (e.g., corn and wheat). In addition to lowering processing costs and alleviating competition with the food sector, organic and industrial waste conversions help achieve a more sustainable process and production framework [1]. This extends to the energy sector, where our dependency on fossil fuels is the most critical. In 2017, approximately 80% of global energy consumption was supplied by oil, coal, and natural gas [2].
One of our key energy requirements is a sustainable drop-in alternative to current liquid fossil fuels such as gasoline and diesel. For many decades, bioethanol was extolled as a capable alternative to gasoline. However, other than Brazil’s massive sugar cane-based bioethanol program in the 1970s and the corn-based program in the United States, few other countries have adapted it so widely, whether with first generation feedstocks or subsequent generations. Moreover, due to limitations in current combustion engines, ethanol can only be blended up to 15% with gasoline. Butanol, an energy-rich alcohol similar to ethanol, is considered to be a superior alternative liquid fuel, despite having been historically overshadowed by its synthetic counterpart [3] and facing some economic challenges [4]. Compared to ethanol, butanol has a higher energy density and is less hygroscopic, less volatile, and less corrosive, making it more compatible with current infrastructures for gasoline storage and transportation [5]. Furthermore, butanol can be produced from a wide range of organic and industrial wastes; while much research is focused on solid residues, wastewater is also a prime candidate for butanol production [6,7].
Wastewater generated in agriculture, food, and fermentation-based biotechnology sectors is commonly treated with anaerobic digestion (AD) [8,9,10]. As a result of AD, soluble metabolites such as volatile fatty acids (VFAs) are present in fermentation processed wastewater. These metabolites (e.g., butyrate and acetate) are building blocks in alcohol synthesis through acetone–butanol–ethanol (ABE) fermentation by Clostridium species [11,12]. Butyrate is the most promising VFA for butanol production. However, conversion of butyrate in an anaerobic digester results in acetate production (Equation (1)) rather than butanol production. Under mild acidic conditions, butyrate-oxidizing bacteria convert one mole of butyrate to two moles of acetate and two moles of hydrogen (H2).
C 4 H 7 O 2 + 2   H 2 O 2   C 2 H 3 O 2 + H + + 2   H 2
Conversely, if the hydrogen partial pressure, p H 2 , increases substantially, anaerobic conversion of butyrate is inhibited. This is even more interesting when considering that the reduction of butyrate to butanol requires hydrogen (Equation (2)). A high proton concentration (i.e., low pH) renders Equation (1) less favorable and Equation (2) more thermodynamically feasible.
C 4 H 7 O 2 + H + + 2   H 2 C 4 H 9 OH + H 2 O
Previous works have already demonstrated how p H 2 can be used as a control parameter to direct butanol production from butyrate and hydrogen [13,14]. Steinbusch et al. (2008) [13] reported the capability of undefined microbial cultures to mediate the formation of butanol from butyrate and hydrogen, achieving a final butanol concentration of 3.66 mM after 21 days of batch fermentation in serum bottles (37.5 mL working volume). To drive butyrate reduction, the headspace was flushed with pure hydrogen to a final total pressure of 1.5 bar. Methane was the main by-product of this fermentation due to an increase in pH (pH 5 to pH 5.7); less than 10% of the initial butyrate concentration (50 mM) was consumed. Junicke et al. (2016) [14] perturbed a microbial culture enriched with butyrate and ethanol to find that an increase in p H 2 was correlated with an increase in butanol production from butyrate. However, the maximum p H 2 (0.0012 bar) was much inferior to that reported by Steinbusch et al. (2008). Although thermodynamic calculations show that direct conversion of butyrate to butanol is more favorable at elevated hydrogen partial pressures, Junicke et al.’s results (2016) hint at the possibility of a more flexible fermentation culture with lower hydrogen overpressure requirements.
The present study aims to direct an open microbiome, often referred to as an undefined microbial culture or mixed microbial culture, towards the anaerobic production of butanol solely from butyrate and hydrogen through process control. The study goes beyond the state-of-the-art by reporting on the use of a nonconventional carbon source (butyrate) contained in waste streams, the effects of operational parameters (e.g., pH, p H 2 ), and the importance of process control over reaction feasibility. In addition, a detailed thermodynamic assessment based on actual experimental results provides further insights regarding the feasibility of catabolic reactions. The effects of ecological control on the structure of the microbiome are also analyzed via Illumina sequencing of 16S rRNA genes; the dynamics of the main microbial populations are linked to butanol and by-product formation.

2. Methods

2.1. Schott Bottle Fermentation

To start, 1-L Schott (Duran) bottles were inoculated with non-enriched granular sludge (Novozymes, Kalundborg, Denmark) from an anaerobic industrial effluent treatment BIOPAQ®IC reactor (Paques BV, Tjalke de Boerstrjitte, The Netherlands), with either a 15% or 50% volume of sludge (Table 1) in a total working volume of 400 mL. Each condition was performed in duplicate. The biomass elemental composition was taken from Junicke et al. (2016). A medium was designed to fulfill minimum element requirements for microbial growth: butyrate (4405 mg L−1), KH2PO4 (3.7 mg L−1), H3PO4 (7.5 mg L−1), NH4Cl (57.1 mg L−1), NaCl (2.6 mg L−1), CaCl2·2H2O (1.9 mg L−1), MgSO4·7H2O (1.5 mg L−1), MgCl2·6H2O (3.1 mg L−1), FeCl3·6H2O (1.0 mg L−1), ZnSO·7H2O (0.2 mg L−1), MnCl2·4H2O (0.1 mg L−1), H3BO3 (0.2 mg L−1), CoCl2·6H2O (0.2 mg L−1), CuCl2·2H2O (0.1 mg L−1), NiCl2·6H2O (0.2 mg L−1), Na2MoO4·2H2O (0.1 mg L−1), Na2SeO3·5H2O (0.1 mg L−1), thiamine (10 mg L−1), P-aminobenzoic acid (10 mg L−1), Ca-D-pantothenate (10 mg L−1), and biotin (1 mg L−1). Each bottle was buffered (100 mM potassium phosphate, pH 5.5) and the control was inoculated without the presence of butyrate. Prior to inoculation, the bottles and media were sparged with nitrogen to ensure oxygen removal. After inoculation, the headspace was flushed for 10 min at a high flow rate with hydrogen gas to ensure a full hydrogen atmosphere; a final p H 2 of 1.5 bar was built with precise gas injection using a mass flow controller (MFC) (red-y Smart Series, Vögtlin Instruments GmbH, Switzerland) and a hydrogen generator (Precision Hydrogen 100, PEAK® Scientific, UK). The Schott bottles were incubated (Ecotron, Infors HT, Switzerland) at 35 °C and 150 rpm. The pH was adjusted to 5.5 with 2 M HCl prior to sealing the bottles with GL 45 bromobutyl rubber septa (Duran, USA). The experiments were carried out for 10 days, with daily sampling and reflushing of the headspace with hydrogen gas for 10 min to a final p H 2 of 1.5 bar.

2.2. Bioreactor Fermentation

A modified (3 L total volume stainless steel vessel) continuous stirred-tank reactor (CSTR) system (ez-Control, Applikon, The Netherlands) was inoculated (50% v/v) with non-enriched granular sludge (Novozymes, Kalundborg, Denmark) from an anaerobic industrial effluent treatment BIOPAQ®IC reactor (Paques BV, The Netherlands) to a final volume of 2 L. The same medium composition was used as for the Schott bottle fermentations (see Section 2.1) except for the addition of the potassium phosphate buffer. Anaerobic conditions in the reactor were maintained by continuously sparging with hydrogen gas (0.050 LN min−1) derived from a hydrogen generator (Precision Hydrogen 100, PEAK® Scientific, Inchinnan, UK). A total pressure of 2 bar was maintained using a low-pressure proportional relief valve (SS-RL3S4, Swagelok, Solon, OH, USA) coupled to a manometer (WIKA, Klingenberg am Main, Germany). The reactor was operated in batch mode with respect to the liquid phase, at 35 °C, p H 2 of 2 bar, 400 rpm, and the pH was controlled at 5.5 ± 0.1 using 2 M of NaOH and 2 M of HCl. The full experimental set-up is depicted in Figure 1.

2.3. Analytical Methods

Liquid samples were analyzed for VFAs and alcohols using high-performance liquid chromatography (HPLC) with a Dionex Ultimate 3000 (Thermofisher Scientific, Waltham, MA, USA), equipped with a refractive index detector and an Aminex HPX-87H column (Bio-Rad, Hercules, CA, USA) after filtration through a 0.2 µm pore size cellulose acetate filter (Sartorius, Göttingen, Germany). The RI detector temperature was 50 °C, the column temperature was 20 °C, and the mobile phase (5 mM H2SO4) flow rate was maintained at 0.6 mL min−1. The measurement error for HPLC measurements is less than 5%.
The HPR-20 R&D mass spectrometer (MS) (Hiden Analytical, Warrington, UK) was used for online analysis of the bioreactor off-gas stream for hydrogen, water, methane (CH4), and carbon dioxide (CO2). Cumulative gas productions were calculated based on the daily net production rate of each gas, corrected for the total gas outflow rate and the mole fraction of the respective gas. The measurement error for MS measurements is less than 2%.

2.4. Thermodynamic Calculations

The actual Gibbs energy change, ∆G1, for reactions discussed in this study was calculated according to Equation (3):
Δ G 1 = Δ G 0 + RT   y i · ln   c i
where ∆G0 denotes the standard Gibbs energy change, R is the gas constant (8.314 J K−1 mol−1), T is the temperature in Kelvin, y i is the stoichiometric coefficient of compound i, and c i is the concentration of compound i. The correction for the pH dependency of alcohol formation on its corresponding VFA can be described by Equation (3) (the derivation can be found in the Supplementary Material):
Δ G 1 = Δ G 0 + RT · ln [ Alcohol ] [ VFA t ] · p H 2 2 + RT · ln K a + [ H + ] K a · [ H + ]
where K a denotes the acid dissociation constant. The Gibbs–Helmholtz equation was used for ∆G0 temperature correction [15]. The derivation of pH-dependent change in the CO2 partial pressure for the actual Gibbs energy change in participating catabolic reactions can also be found in the Supplementary Material. The standard Gibbs energy of formation for each compound was found in Kleerebezem and van Loosdrecht (2010).

2.5. Carbon and Electron Balances

At each sampling point, carbon and electron balances were determined. The total carbon amount (C-mol) was obtained by multiplying all measured compounds by their number of carbon atoms. The total electron amount (e-mol) was obtained by multiplying all measured compounds by their respective degree of reduction (e-mol/mol-compound). Both C-mol and e-mol gaps in percent were obtained from the difference between the total amount of carbon/electron at each sampling point and the initial total amount of carbon/electron, divided by the initial total amount of carbon/electron.

2.6. DNA Isolation and Amplicon Sequencing

A total of 5 samples of 2 ml each were selected from the bioreactor fermentation for microbial composition analysis. The samples selected for analysis were collected on days 0 (at inoculation), 2, 8, 10, and 20. Microbial genomic DNA was isolated from all samples using the DNeasy Powersoil Kit (Qiagen, Vedbæk, Denmark) following the manufacturer’s recommendations. DNA samples were shipped to Macrogen Inc. (Seoul, Korea) for 16S rRNA amplicon library preparation and sequencing using the Illumina Miseq instrument (300 bp paired-end sequencing). The libraries were constructed according to the 16S Metagenomic Sequencing Library Preparation Protocol (Part #15044223, Rev. B) using Herculase II Fusion DNA Polymerase Nextera XT Index Kit V2. Regions V3 and V4 of the 16S rRNA gene were amplified with primers Pro341F (5′-CCTACGGGNBGCASCAG-3′) and Pro805R (5′-GACTACNVGGGTATCTAATCC-3′) [16]. Raw sequences were uploaded to the NCBI SRA database with BioProject ID PRJNA741687 and BioSample accession SAMN19895498.

2.7. Analysis of 16S rRNA Gene Amplicons

Raw reads were primer-trimmed with cutadapt, discarding all untrimmed reads [17]. Next, low quality tails were trimmed by a fixed length of 15 bases in forward reads and 50 bases in reverse reads. Paired reads were merged using usearch-fastq_mergepairs allowing for 2 mismatches in the alignment, and were quality-filtered using usearch-fastq_filter with a maximum expected error threshold of 1.0 [18]. Unique reads were obtained by dereplicating quality filtered reads using vsearch-derep_fulllength [19]. Generation of amplicon sequence variants (ASVs) (or zero-radius operational taxonomic units (zOTUs)) and mapping of merged reads to ASVs were performed using the UNOISE algorithm [20]; unique sequences with a minimum count of 8 and at least 99% identity were considered in the ASV counts. Taxonomic assignment to ASVs was accomplished using Qiime2 and the SILVAv132 database using classify-consensus-vsearch [19,21]. Downstream analyses, including canonical correspondence analysis (CCA) and statistical correlations, were performed using the Phyloseq, Vegan, ggpubr, and R packages (Phyloseq version 1.28.0, Vegan version 2.5.6, ggpubr version 0.4.0, and R version 3.6.0) [22,23,24].

3. Results and Discussion

3.1. Butanol Production in 1 L Schott Bottles

The non-enriched microbiome was capable of butyrate reduction to butanol (Table 1) at an elevated p H 2 of 1.5 bar. Table 2 shows the measured metabolite concentrations for each condition in the bottle trials. The highest butanol concentration of 4.40 mM was achieved using 50% inoculum; the 15% inoculum was capable of reaching 1.33 mM. The former was similar to the maximum butanol concentration of 3.66 mM reported by Steinbusch et al. (2008) [13], but represented a 3-fold increase in daily average productivity from 0.15 mM d−1 to 0.44 mM d−1. Despite this process improvement, and similar to the findings (<10%) of Steinbusch et al. (2008) [13], substrate consumption was not complete; it amounted to less than 20% for the 50% inoculum and 10% for the 15% inoculum. This can potentially be attributed to the lack of pH control during the bottle trial, as an increase in pH renders butanol formation thermodynamically less feasible. By-product formation recurred in all experiments, with acetate being the most predominant by-product, along with the formation of iso-butyrate, propionate, and iso-valerate.

3.2. Butanol Production under High Hydrogen Partial Pressure

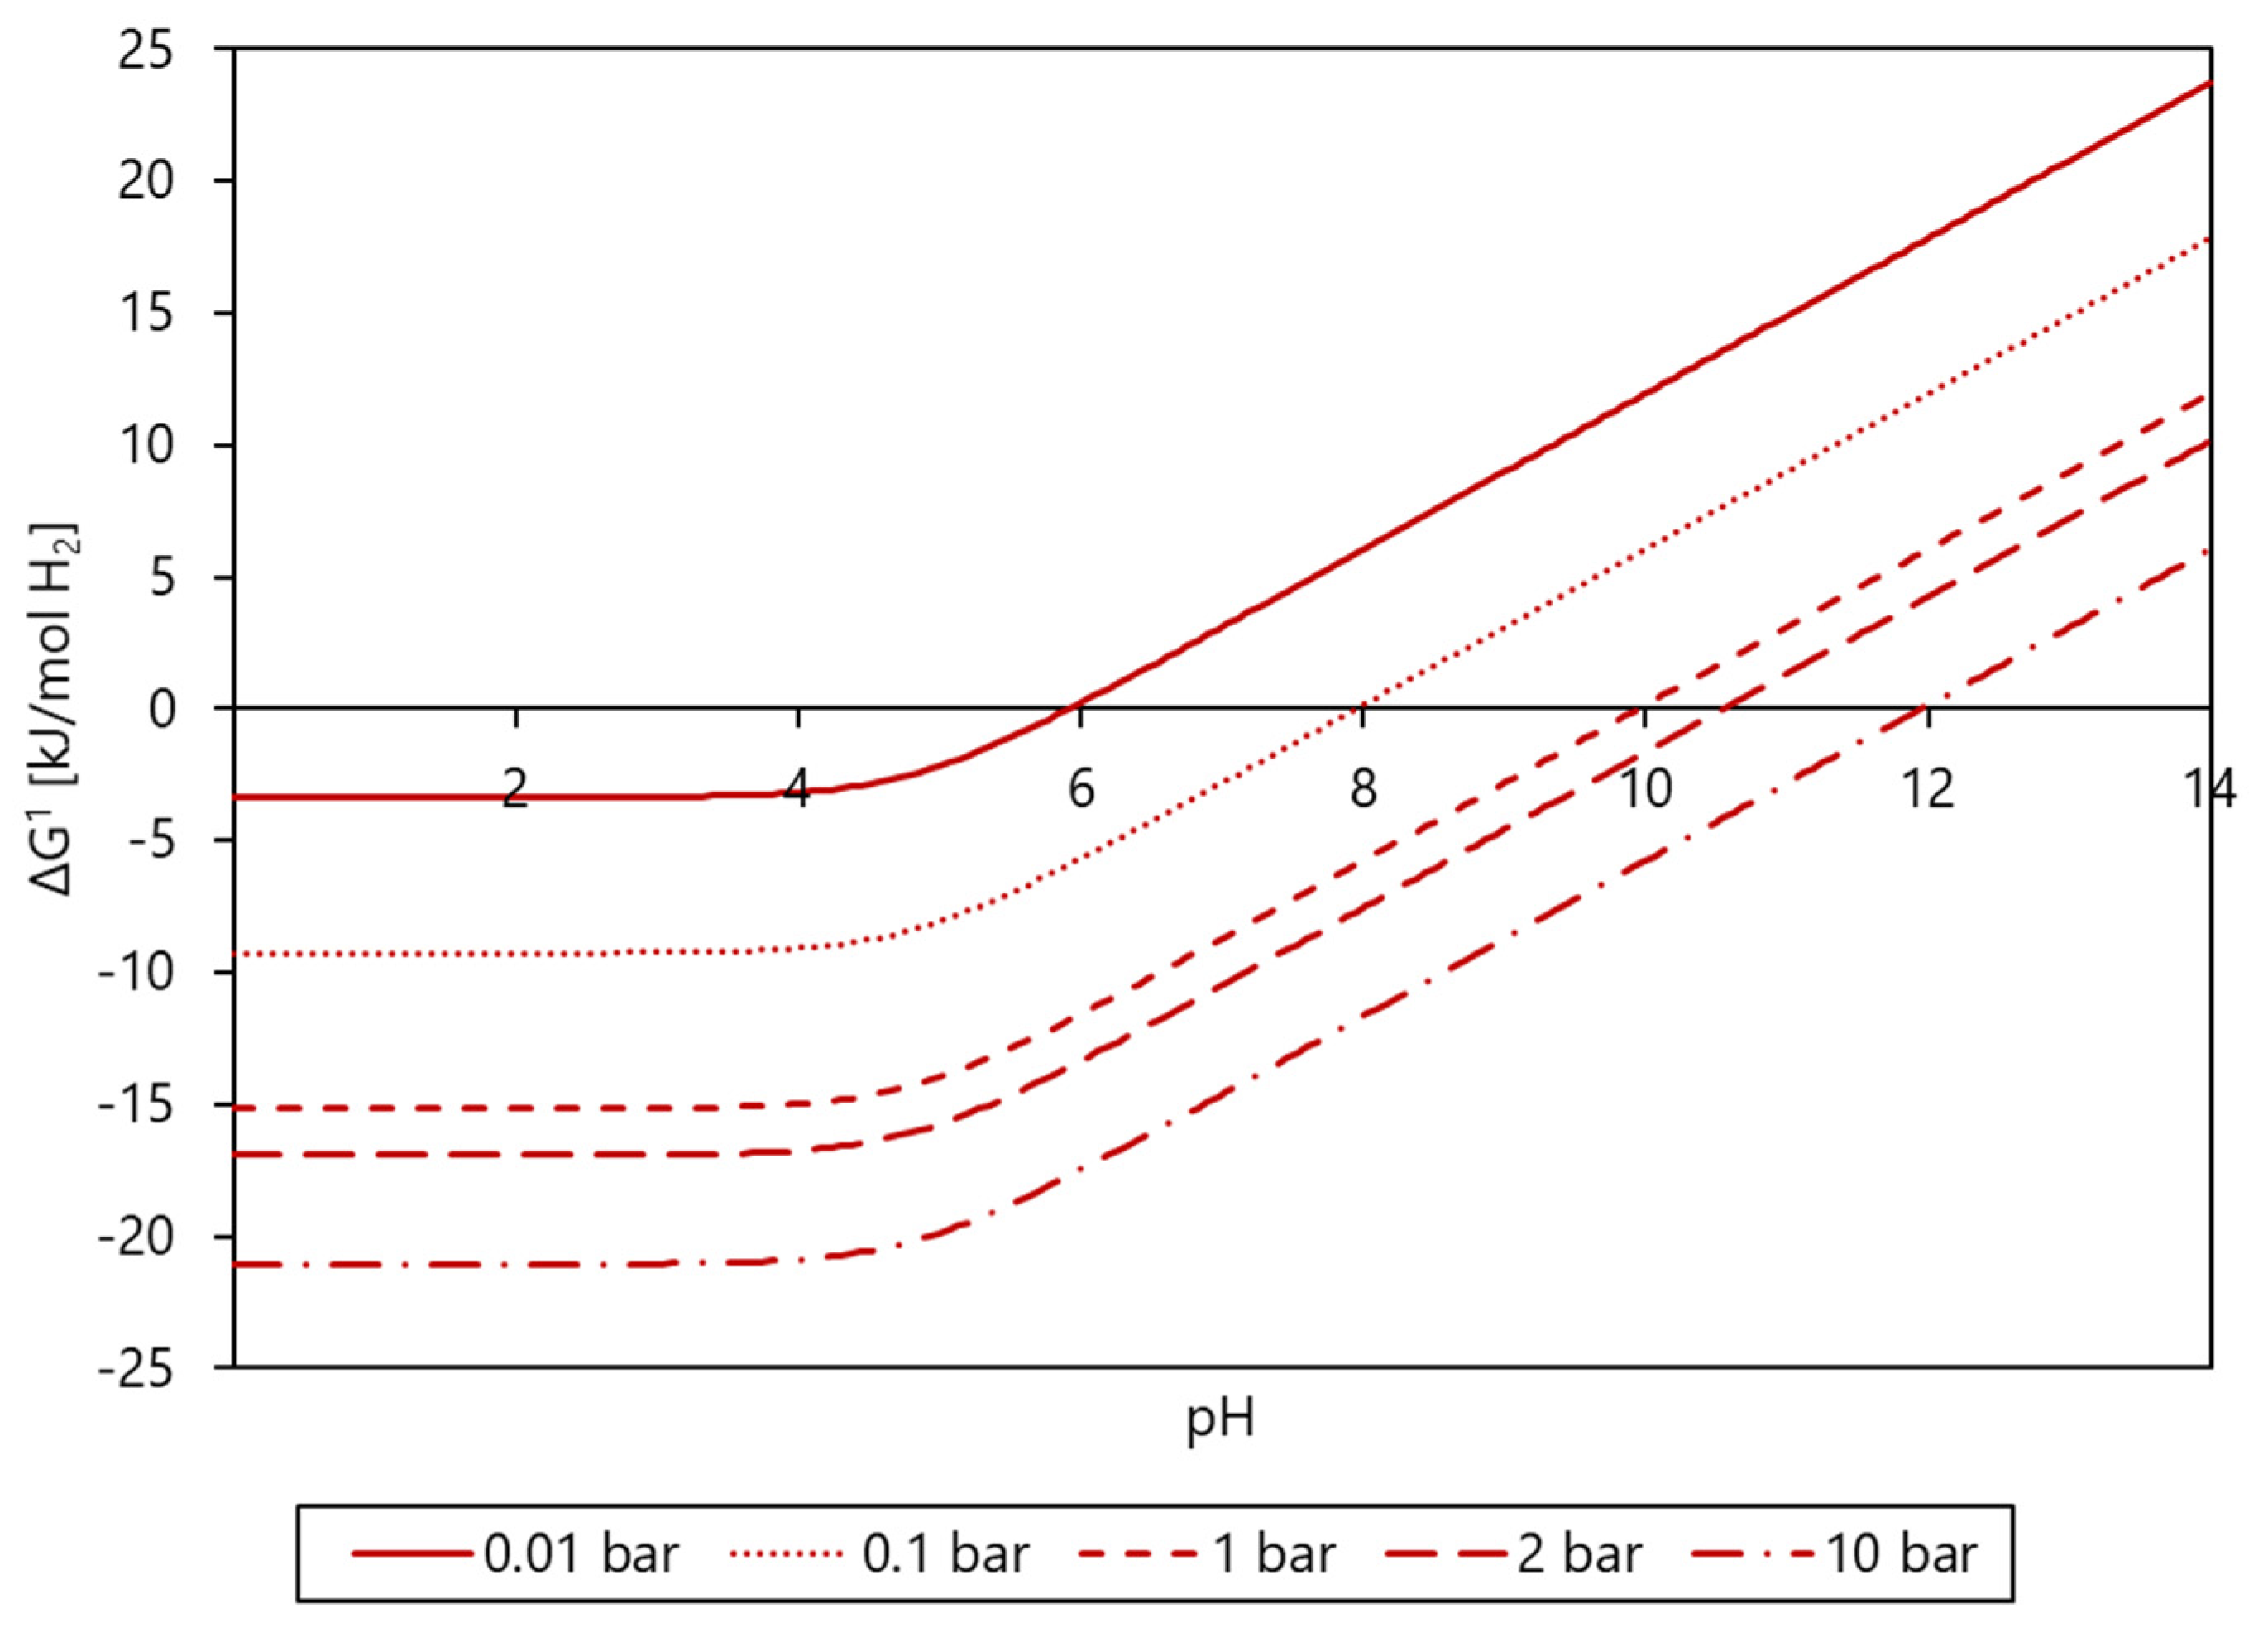
Thermodynamic calculations for butanol formation confirm the experimental observations presented in Table 2. Figure 2 shows how a 10-fold increase in p H 2 , from 0.01 bar to 0.1 bar, brings the reaction closer to the minimum biological energy quantum of −20 kJ mol−1 necessary for ATP synthesis and, thus, cell growth [25]. A further 10-fold increase in p H 2 , to 1 bar, theoretically generates enough excess energy for a thriving microbial community. In practice, microorganisms in natural ecosystems can be metabolically active at lower Gibbs energy changes between −9 to −12 kJ mol−1 [26], ensuring some flexibility to the butanol production system in this study.
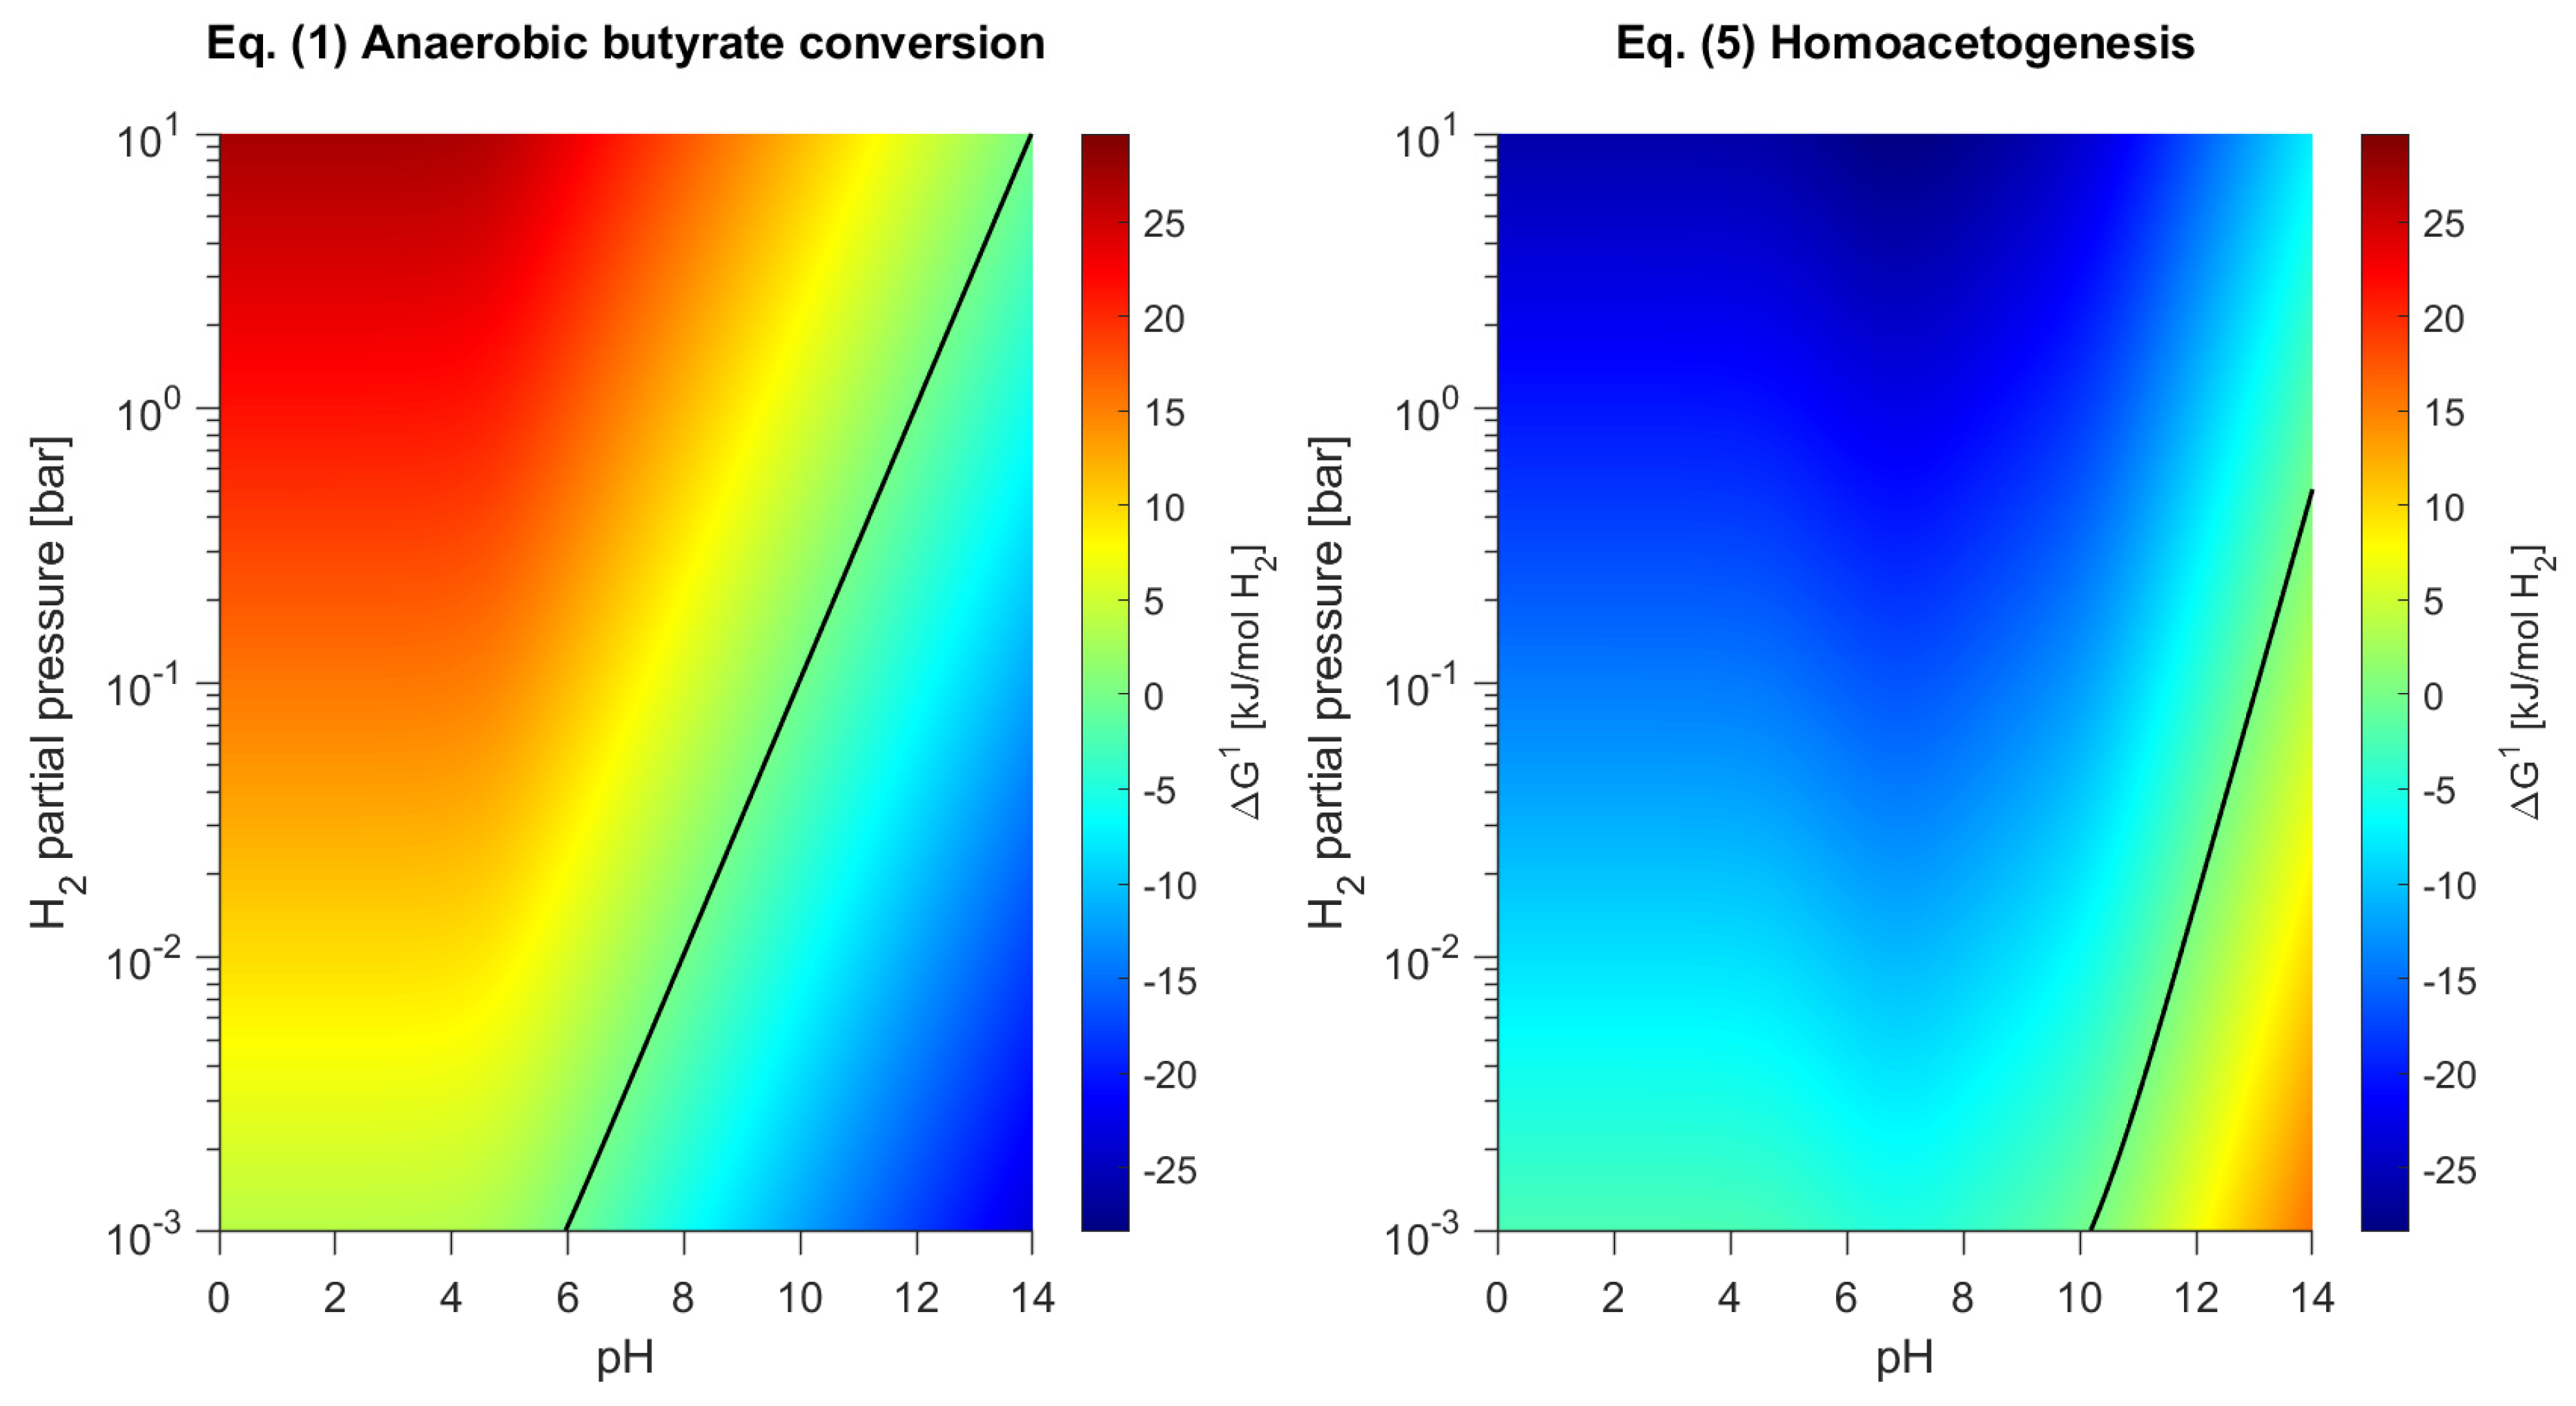
Additional calculations depicted in Figure 3 reveal that at the experimental conditions of pH 5.5 and p H 2 of 1.5 bar, anaerobic butyrate conversion to acetate is endergonic (∆G1 > 0). However, acetate production was significant in the control and in the 50% inoculum experiment, as compared to the 15% inoculum experiment. Granular sludge originating from anaerobic wastewater digesters is known to contain calcium carbonate precipitates [27,28], which can function as building blocks in homoacetogenesis and hydrogenotrophic methanogenesis (Equations (5) and (6)).
2   CO 2 + 4   H 2 C 2 H 3 O 2 + H + + 2   H 2 O
CO 2 + 4   H 2 CH 4 + 2   H 2 O
With the present anaerobic granular sludge, a HCO3- concentration of 50 mM is typically common in the digester of origin (data not shown), and might contribute positively to the formation of acetate. Moreover, homoacetogenesis is a thermodynamically favorable reaction under the applied experimental conditions (Figure 3), hence supporting acetate formation through homoacetogenesis. This is further supported by the lack of an exogenous carbon source present in the control experiment, leaving carbon dioxide as the sole carbon precursor for acetate formation.

3.3. Improved Butanol Formation Using a pH Controlled Bioreactor

A CSTR was used to ensure adequate control of the pH and the hydrogen partial pressure. A pH of 5.5 was selected based on previous finding for the anaerobic sludge used in this work [29]. Figure 4 shows the measured changes in metabolite concentrations in the controlled bioreactor. Butanol formation significantly improved, with the highest butanol concentration of 10.9 mM and an average volumetric productivity of 0.68 mmol L−1 d−1 after 16 days (Figure 4). Compared to previous work by Steinbusch et al. (2008) [13], this corresponds to 2.98- and 4.65-fold increases, respectively, and 2.47- and 1.55-fold improvements over the 1 L Schott bottle trials, respectively (see Experiment 50 in Table 2 for comparison).
By-product formation was largely directed towards ethanol production at the end of the fermentation. Whereas the lack of pH control in the Schott bottles resulted in acetate accumulation, in the bioreactor experiment the acetate produced was further reduced to ethanol (Equation (7)) to a final concentration of 11.9 mM.
C 2 H 3 O 2 + H + + 2   H 2 C 2 H 5 OH + 2   H 2 O
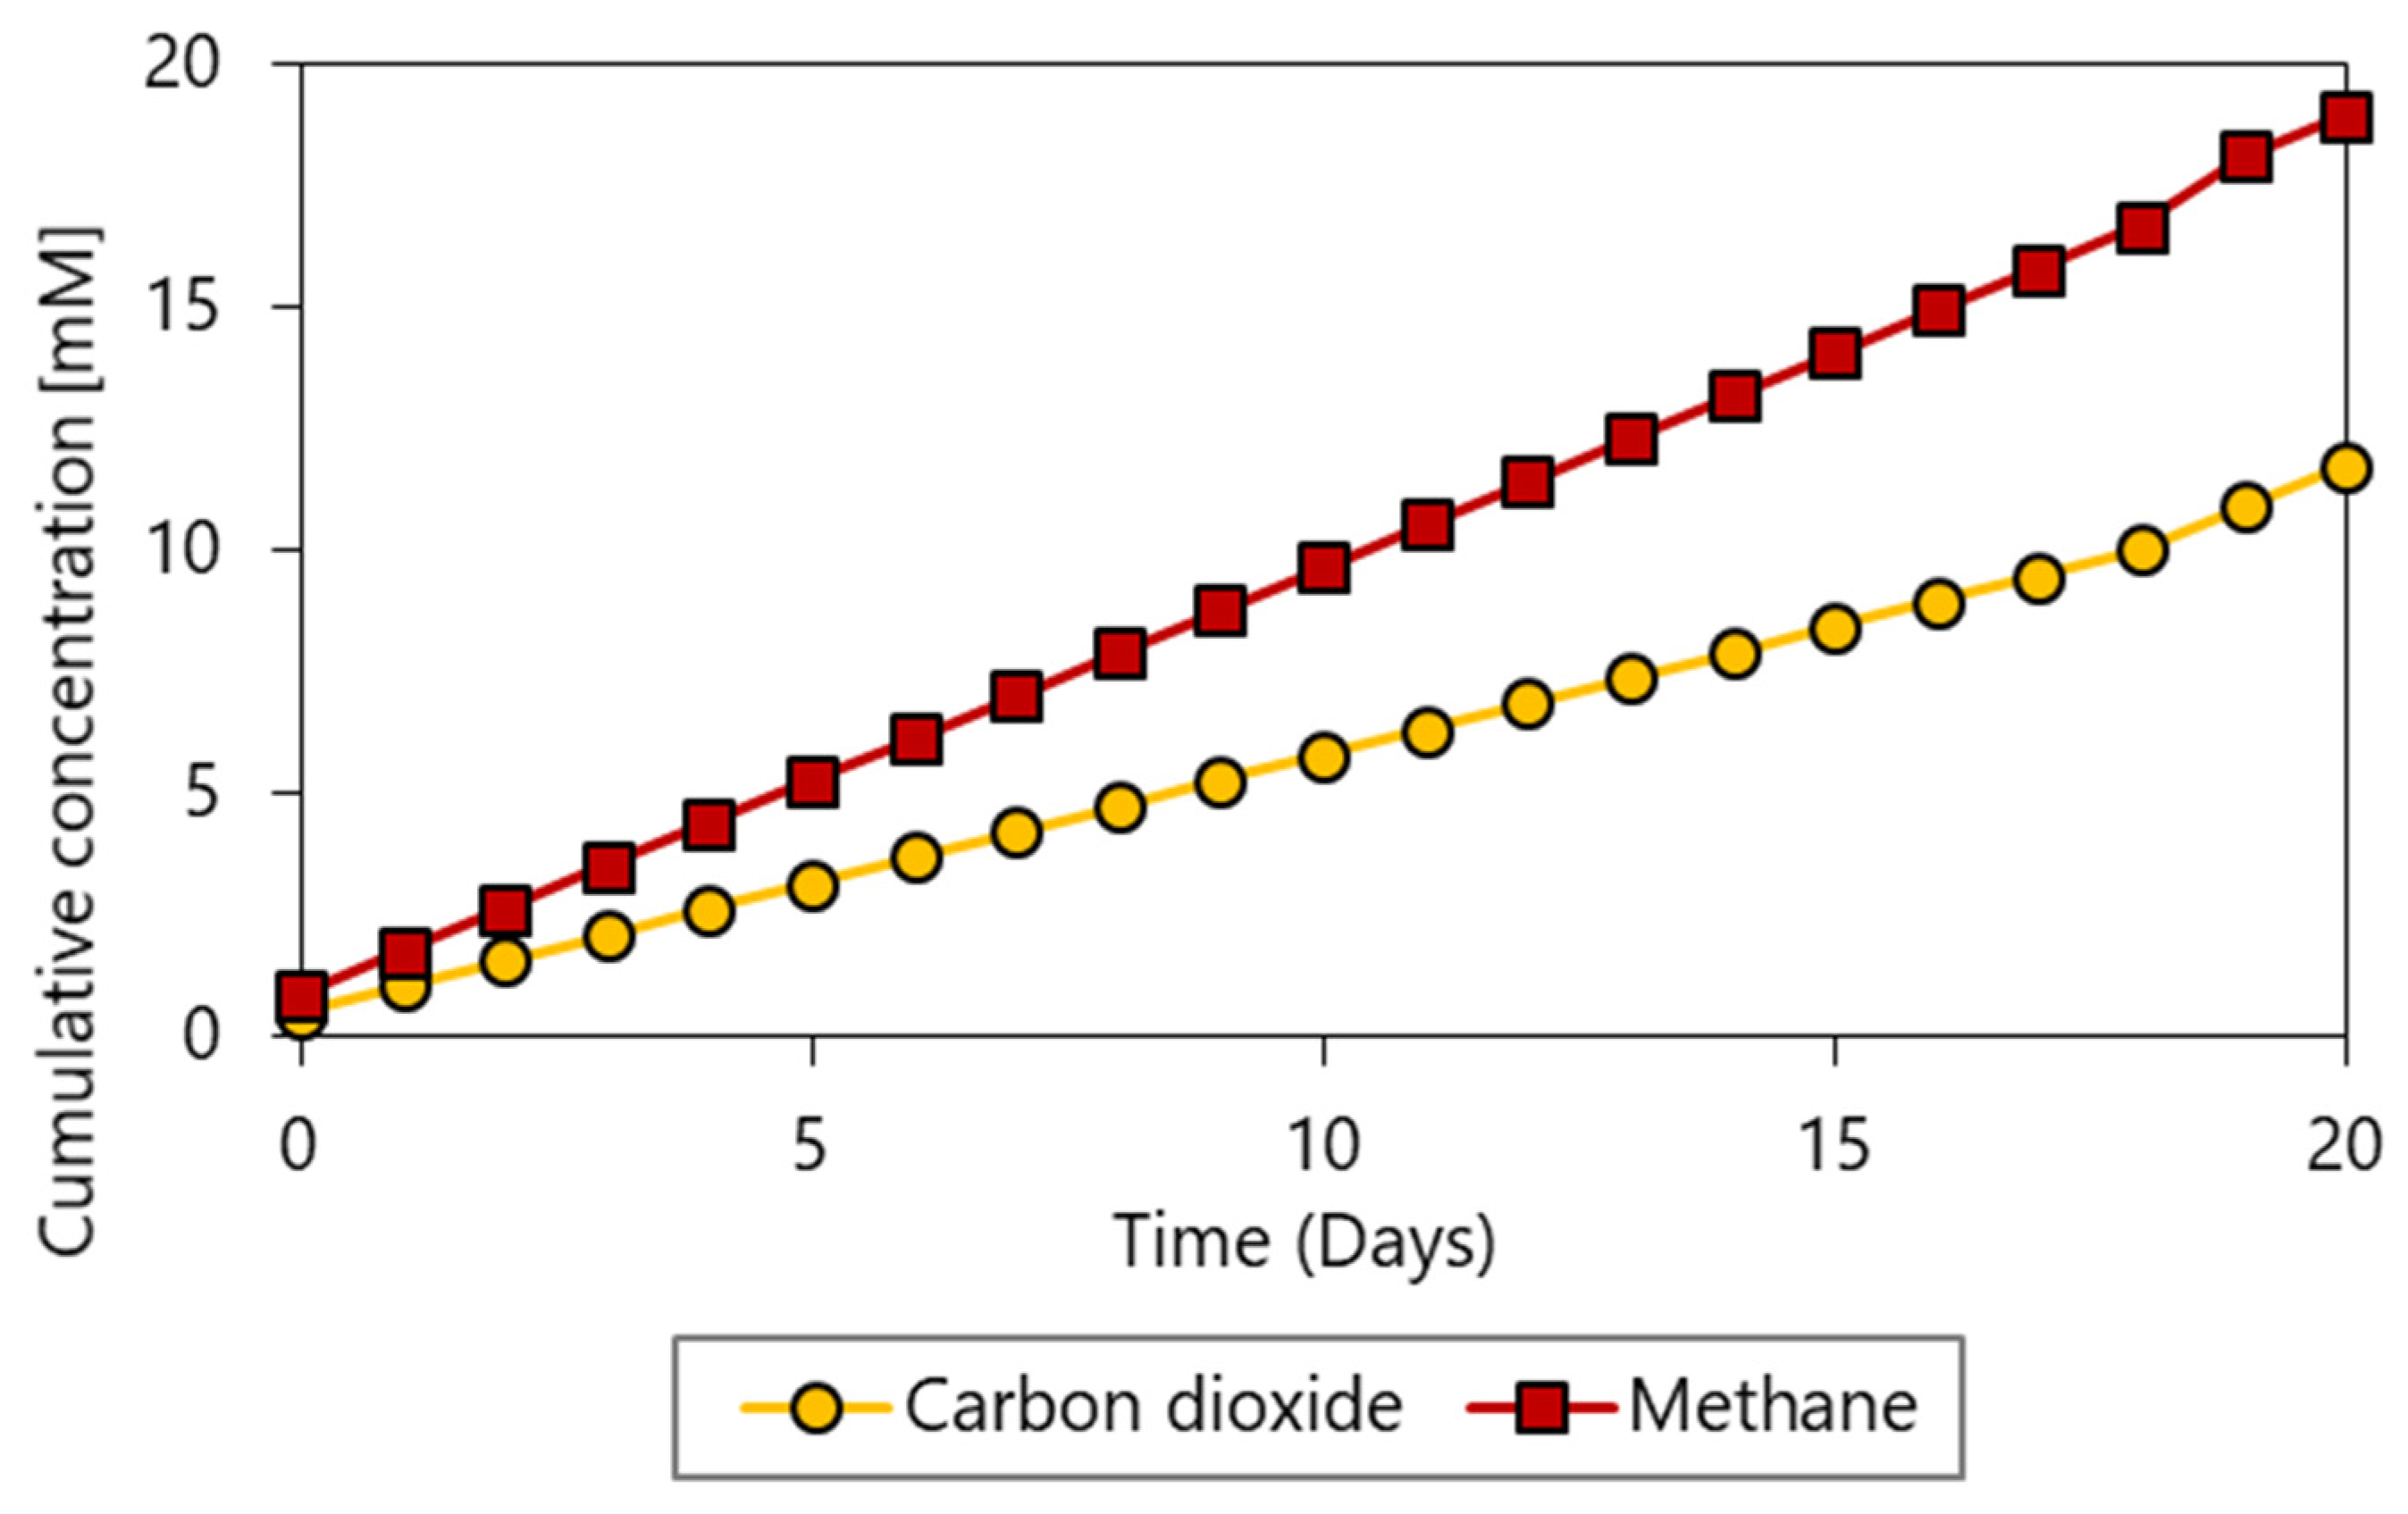
Ethanol formation from acetate and hydrogen was limited by the availability of reducible acetate in the fermentation broth (Figure 4), further evidencing the uncoupling of by-product formation from butyrate consumption. Methane and carbon dioxide formation reached 18.9 mM and 11.8 mM, respectively (Figure 5); lactate production (3.7 mM) was also found.
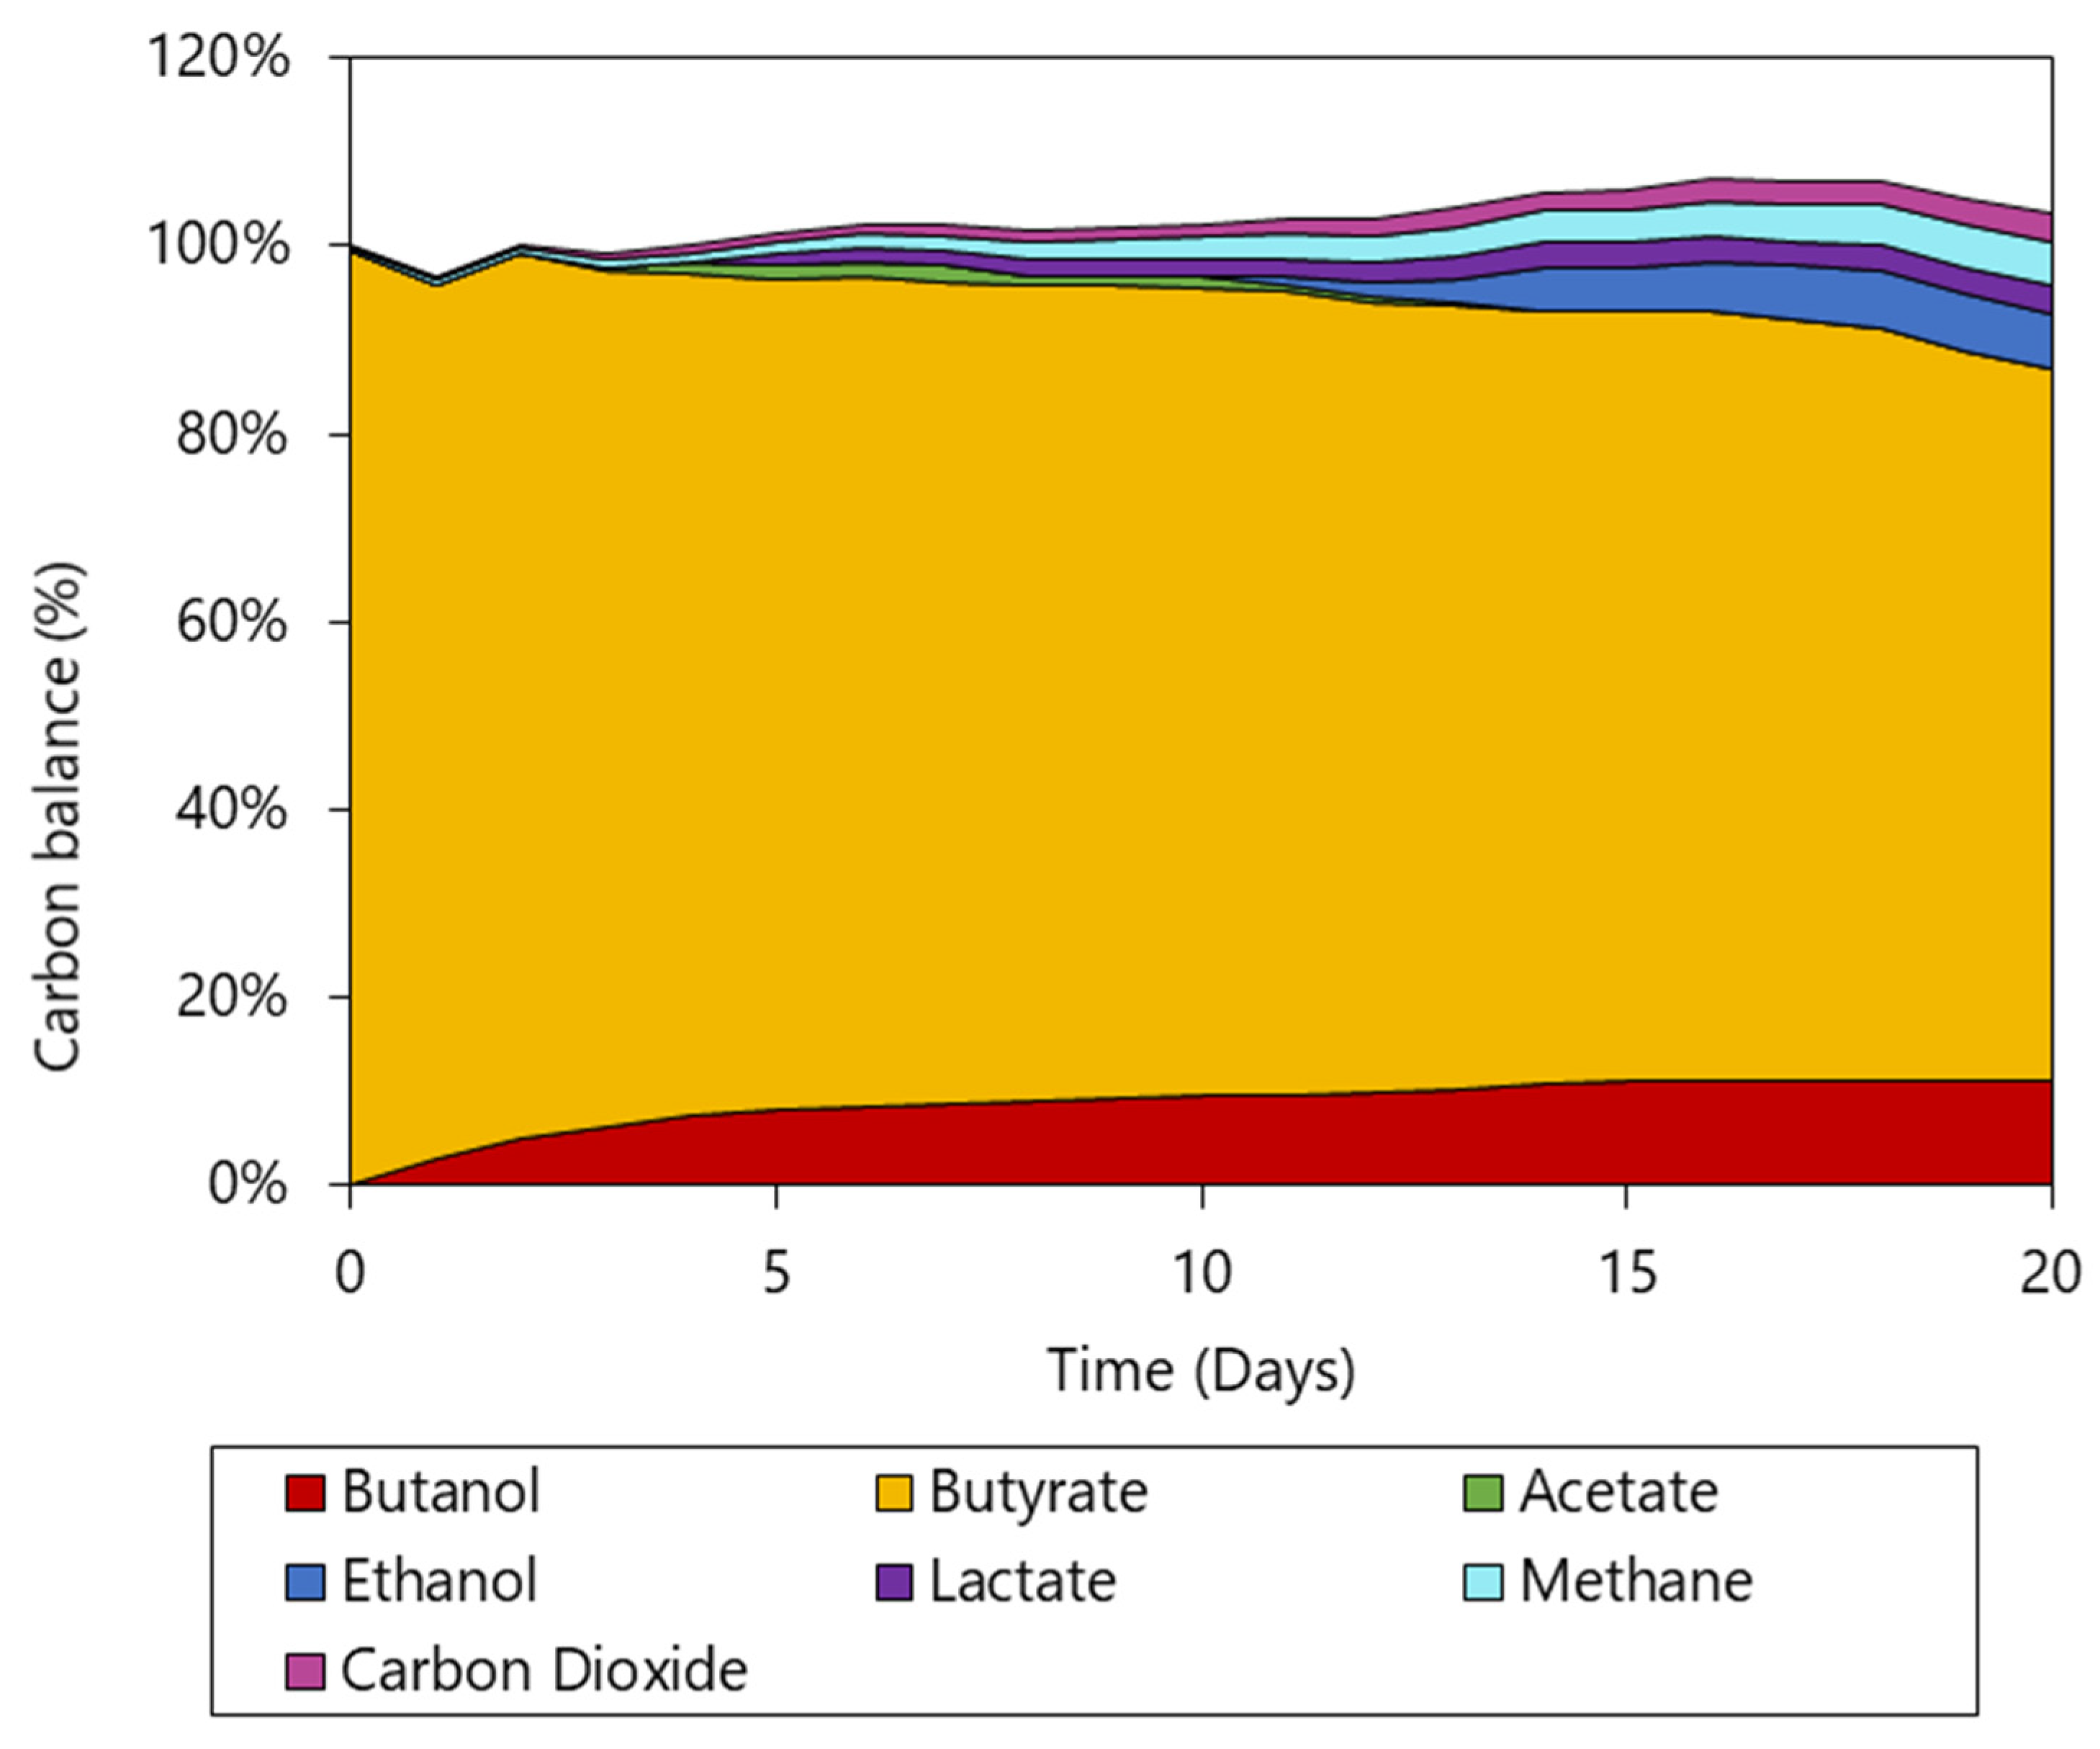
Carbon and electron balances show a gap of less than 7% and 10%, respectively, in the course of the experiment, mostly justified by the formation of by-products (Figure 6). As previously discussed, calcium carbonate precipitates are expected in anaerobic granular sludge and can contribute to the formation of by-products; however, they were not included in the balances due to an inherent difficulty in measuring the precipitates’ c-mol contribution. The same is true for dry weight determination of granular sludge, where the associated sampling/measurement error is higher than the biomass contribution (one carbon atom) to the c-mol balance. In turn, this leads to an underestimation of total c-mol and a consequent overestimation of balance gaps. Nevertheless, a relative analysis shows that lactate and CO2 contributed the least to balance gaps, with ethanol being the most predominant by-product c-mol contributor.

3.4. Product Formation Controlled by Thermodynamics

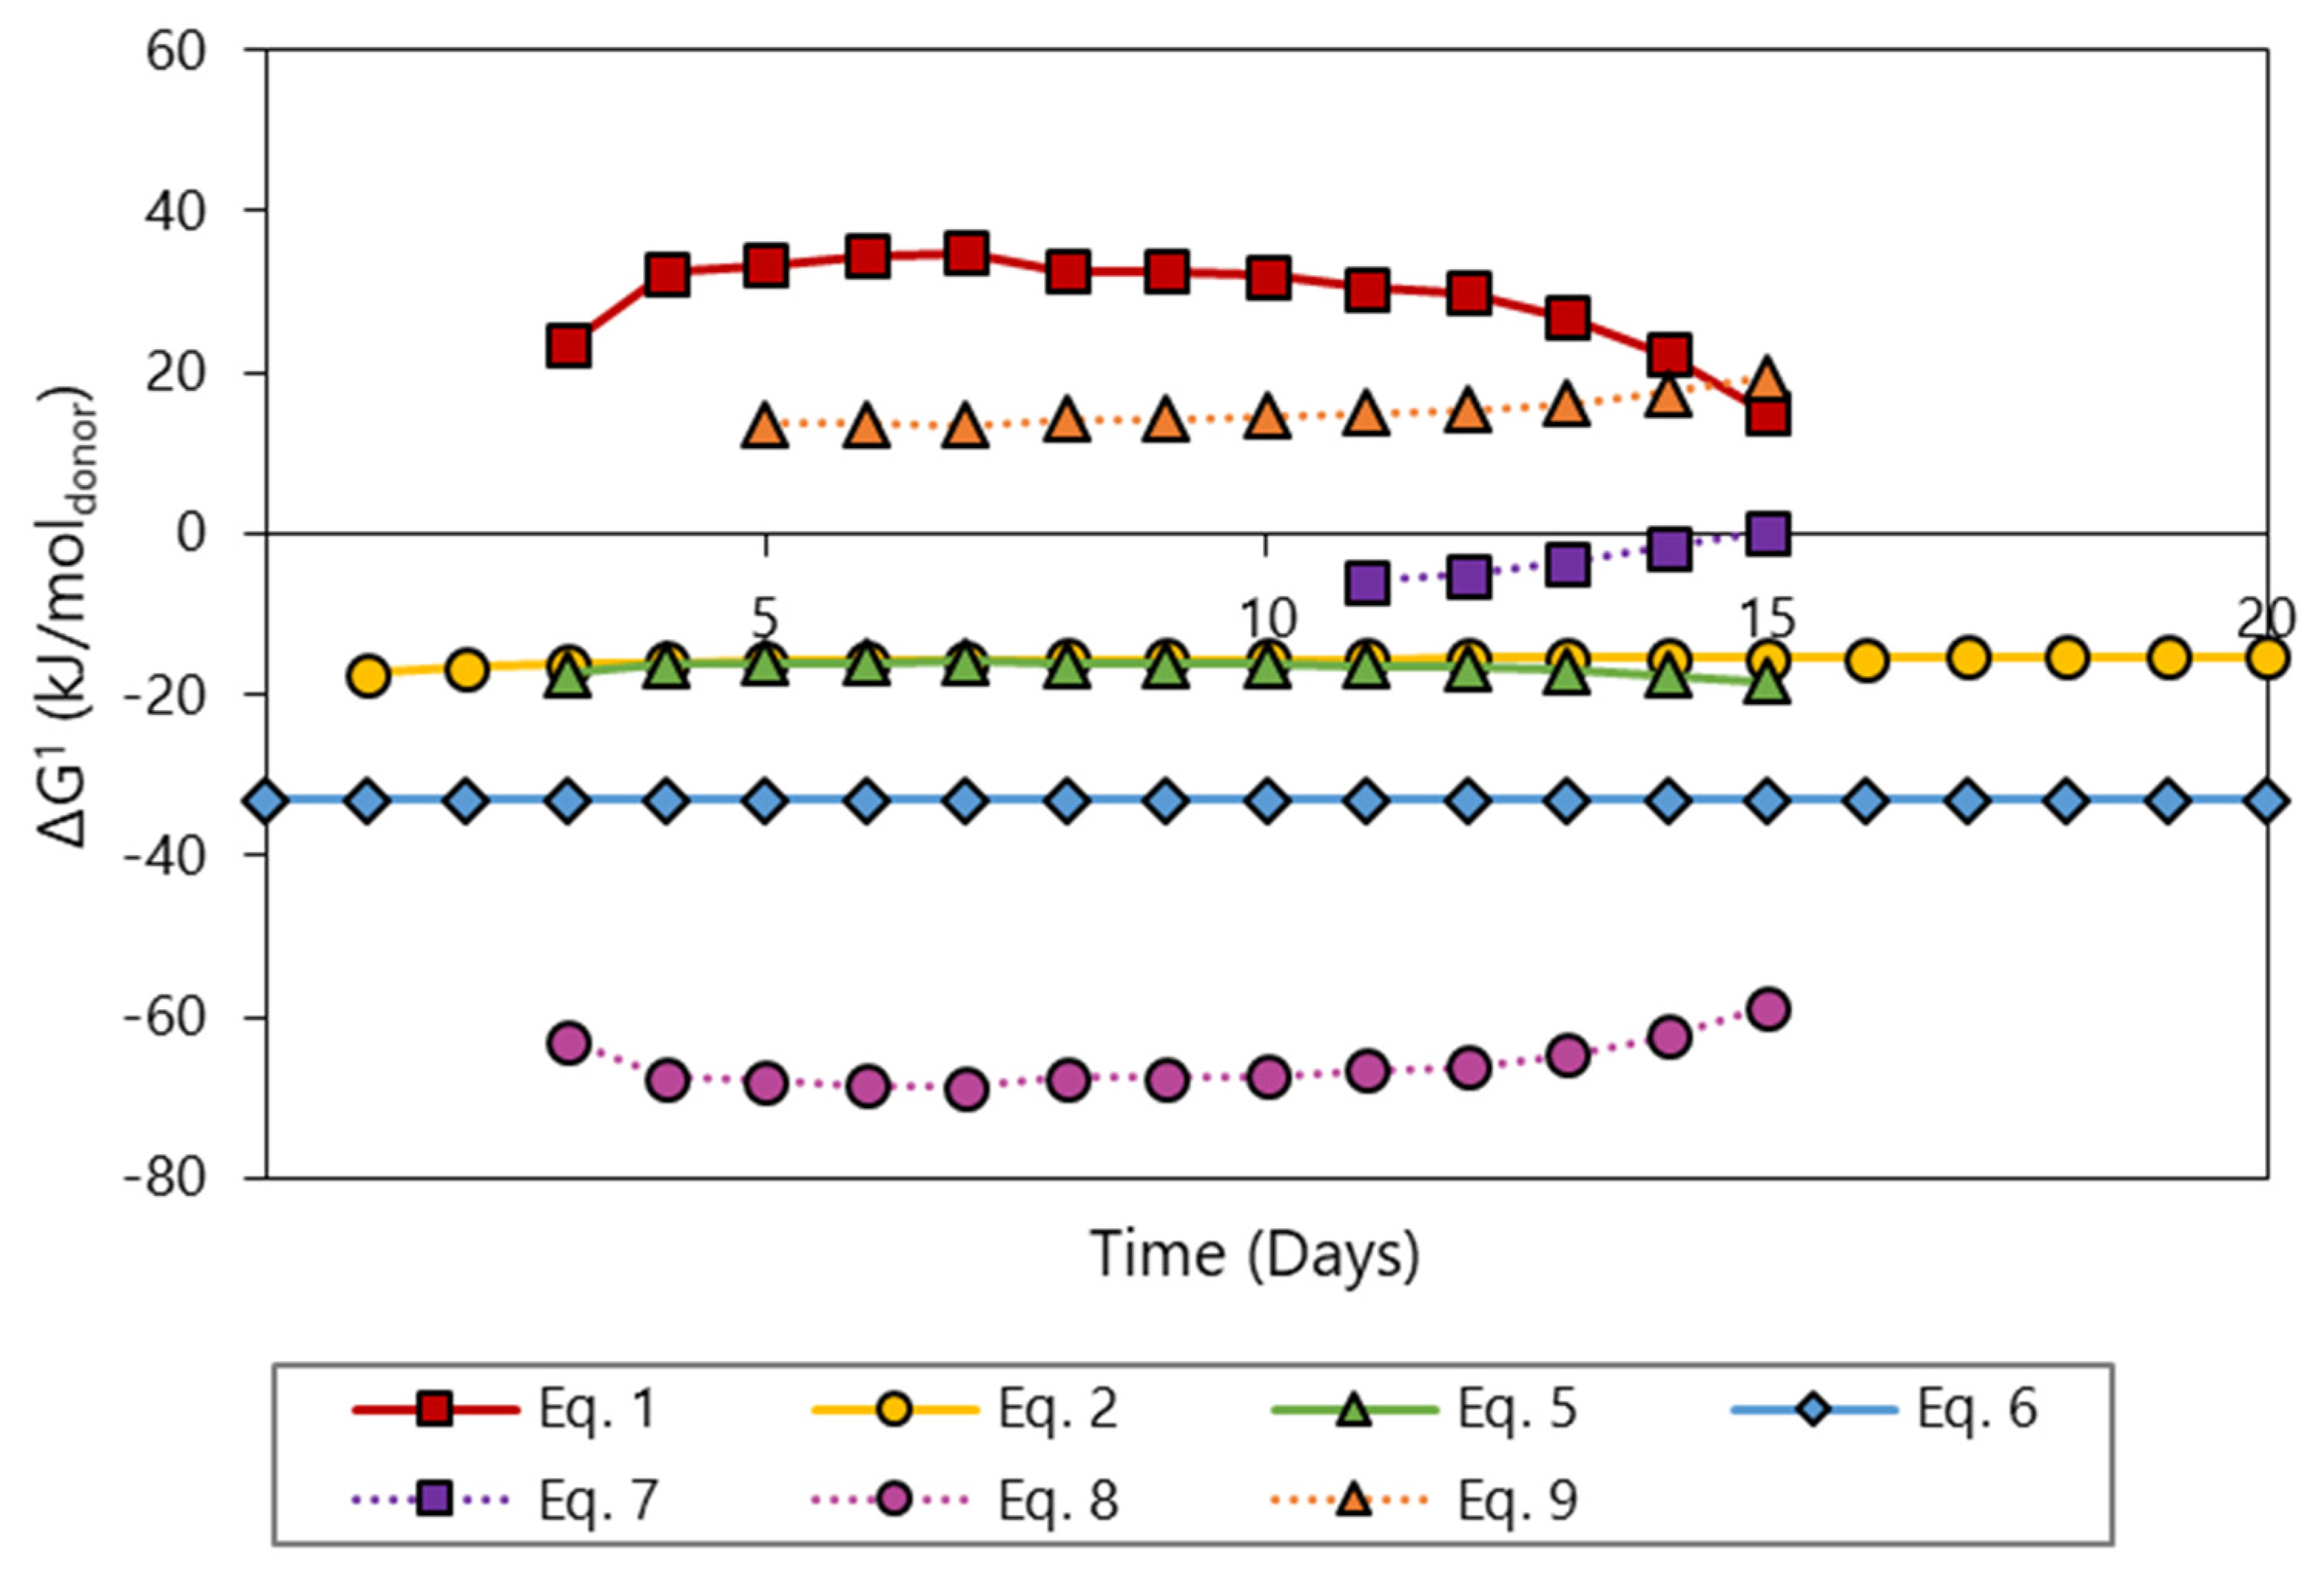
Figure 7 shows the ∆G1 of catabolic reactions outlined in Figure 8 for the bioreactor experiment. Similar to the 1-L bottle trials, acetate formation from butyrate (Equation (1)) is endergonic (∆G1 > +15 kJ mol H2−1) and should be considered a result of homoacetogenesis (Equation (5)) according to the discussion in Section 3.2. Butyrate reduction to butanol (Equation (2)) remained exergonic (∆G1 ≈ −16 kJ mol H2−1) throughout the entire experiment. Interestingly, butanol formation from butyrate and H2 seems to occur below the minimum energy quantum of approximately −20 kJ mol−1 postulated by Schink (1977) [25]. The relatively constant ∆G1 for butanol formation, together with production up to day 14, strongly indicates conversion was restricted by other than thermodynamic limitations. However, the final butanol concentration was considerably higher than in the previous bottle experiments (10.9 mM compared to 4.4 mM, respectively), highlighting again the relevance of pH control. Ethanol formation from acetate and H2 (Equation (7)) is thermodynamically feasible as long as acetate is present in the fermentation broth. The ∆G1 of the ethanol-forming reaction (Equation (7)) increases from −6 to +0.1 kJ mol H2−1, which can be mainly attributed to acetate limitation and ethanol accumulation. Again, ethanol formation from acetate and H2 seems to occur well below −20 kJ mol−1, and much closer to 0 kJ mol−1. These observations give rise to the capability of microbes to survive at life-threatening energy limits.
Figure 8 shows the catabolic reactions used to analyze the thermodynamic system state. Notably, acetate seems to play a key role in the formation of multiple by-products. CH4 formation from acetate via acetoclastic methanogenesis (Equation (8)) and CH4 formation from hydrogen and carbon dioxide via hydrogenotrophic methanogenesis (Equation (6)) are thermodynamically feasible. However, when acetoclastic methanogenesis is normalized to a hydrogen equivalent (i.e., two electrons), ∆G1 for the reaction raises to approximately −17 kJ mol−1. This, combined with acetoclastic methanogens’ inhibition below pH 6 [30], indicates hydrogenotrophic methanogenesis is the more likely reaction leading to CH4 formation.
C 2 H 3 O 2 + H + CO 2 + CH 4
Lactate formation from acetate and CO2 (Equation (9)) is not thermodynamically feasible (Figure 7), despite being detected in the bioreactor. Further investigation is required to determine which catabolic reaction could, in fact, lead to lactate formation, with one possible explanation being the presence of non-measured carbohydrates or proteinaceous material.
C 2 H 3 O 2 + 2 H 2 + CO 2 C 3 H 6 O 3 + H 2 O
Although reduction of by-product formation was the end goal of the controlled fermentation, the current production platform might still be of interest if downstream processing is able to provide feasible separation processes for all produced metabolites.

3.5. Open Microbiome Analysis

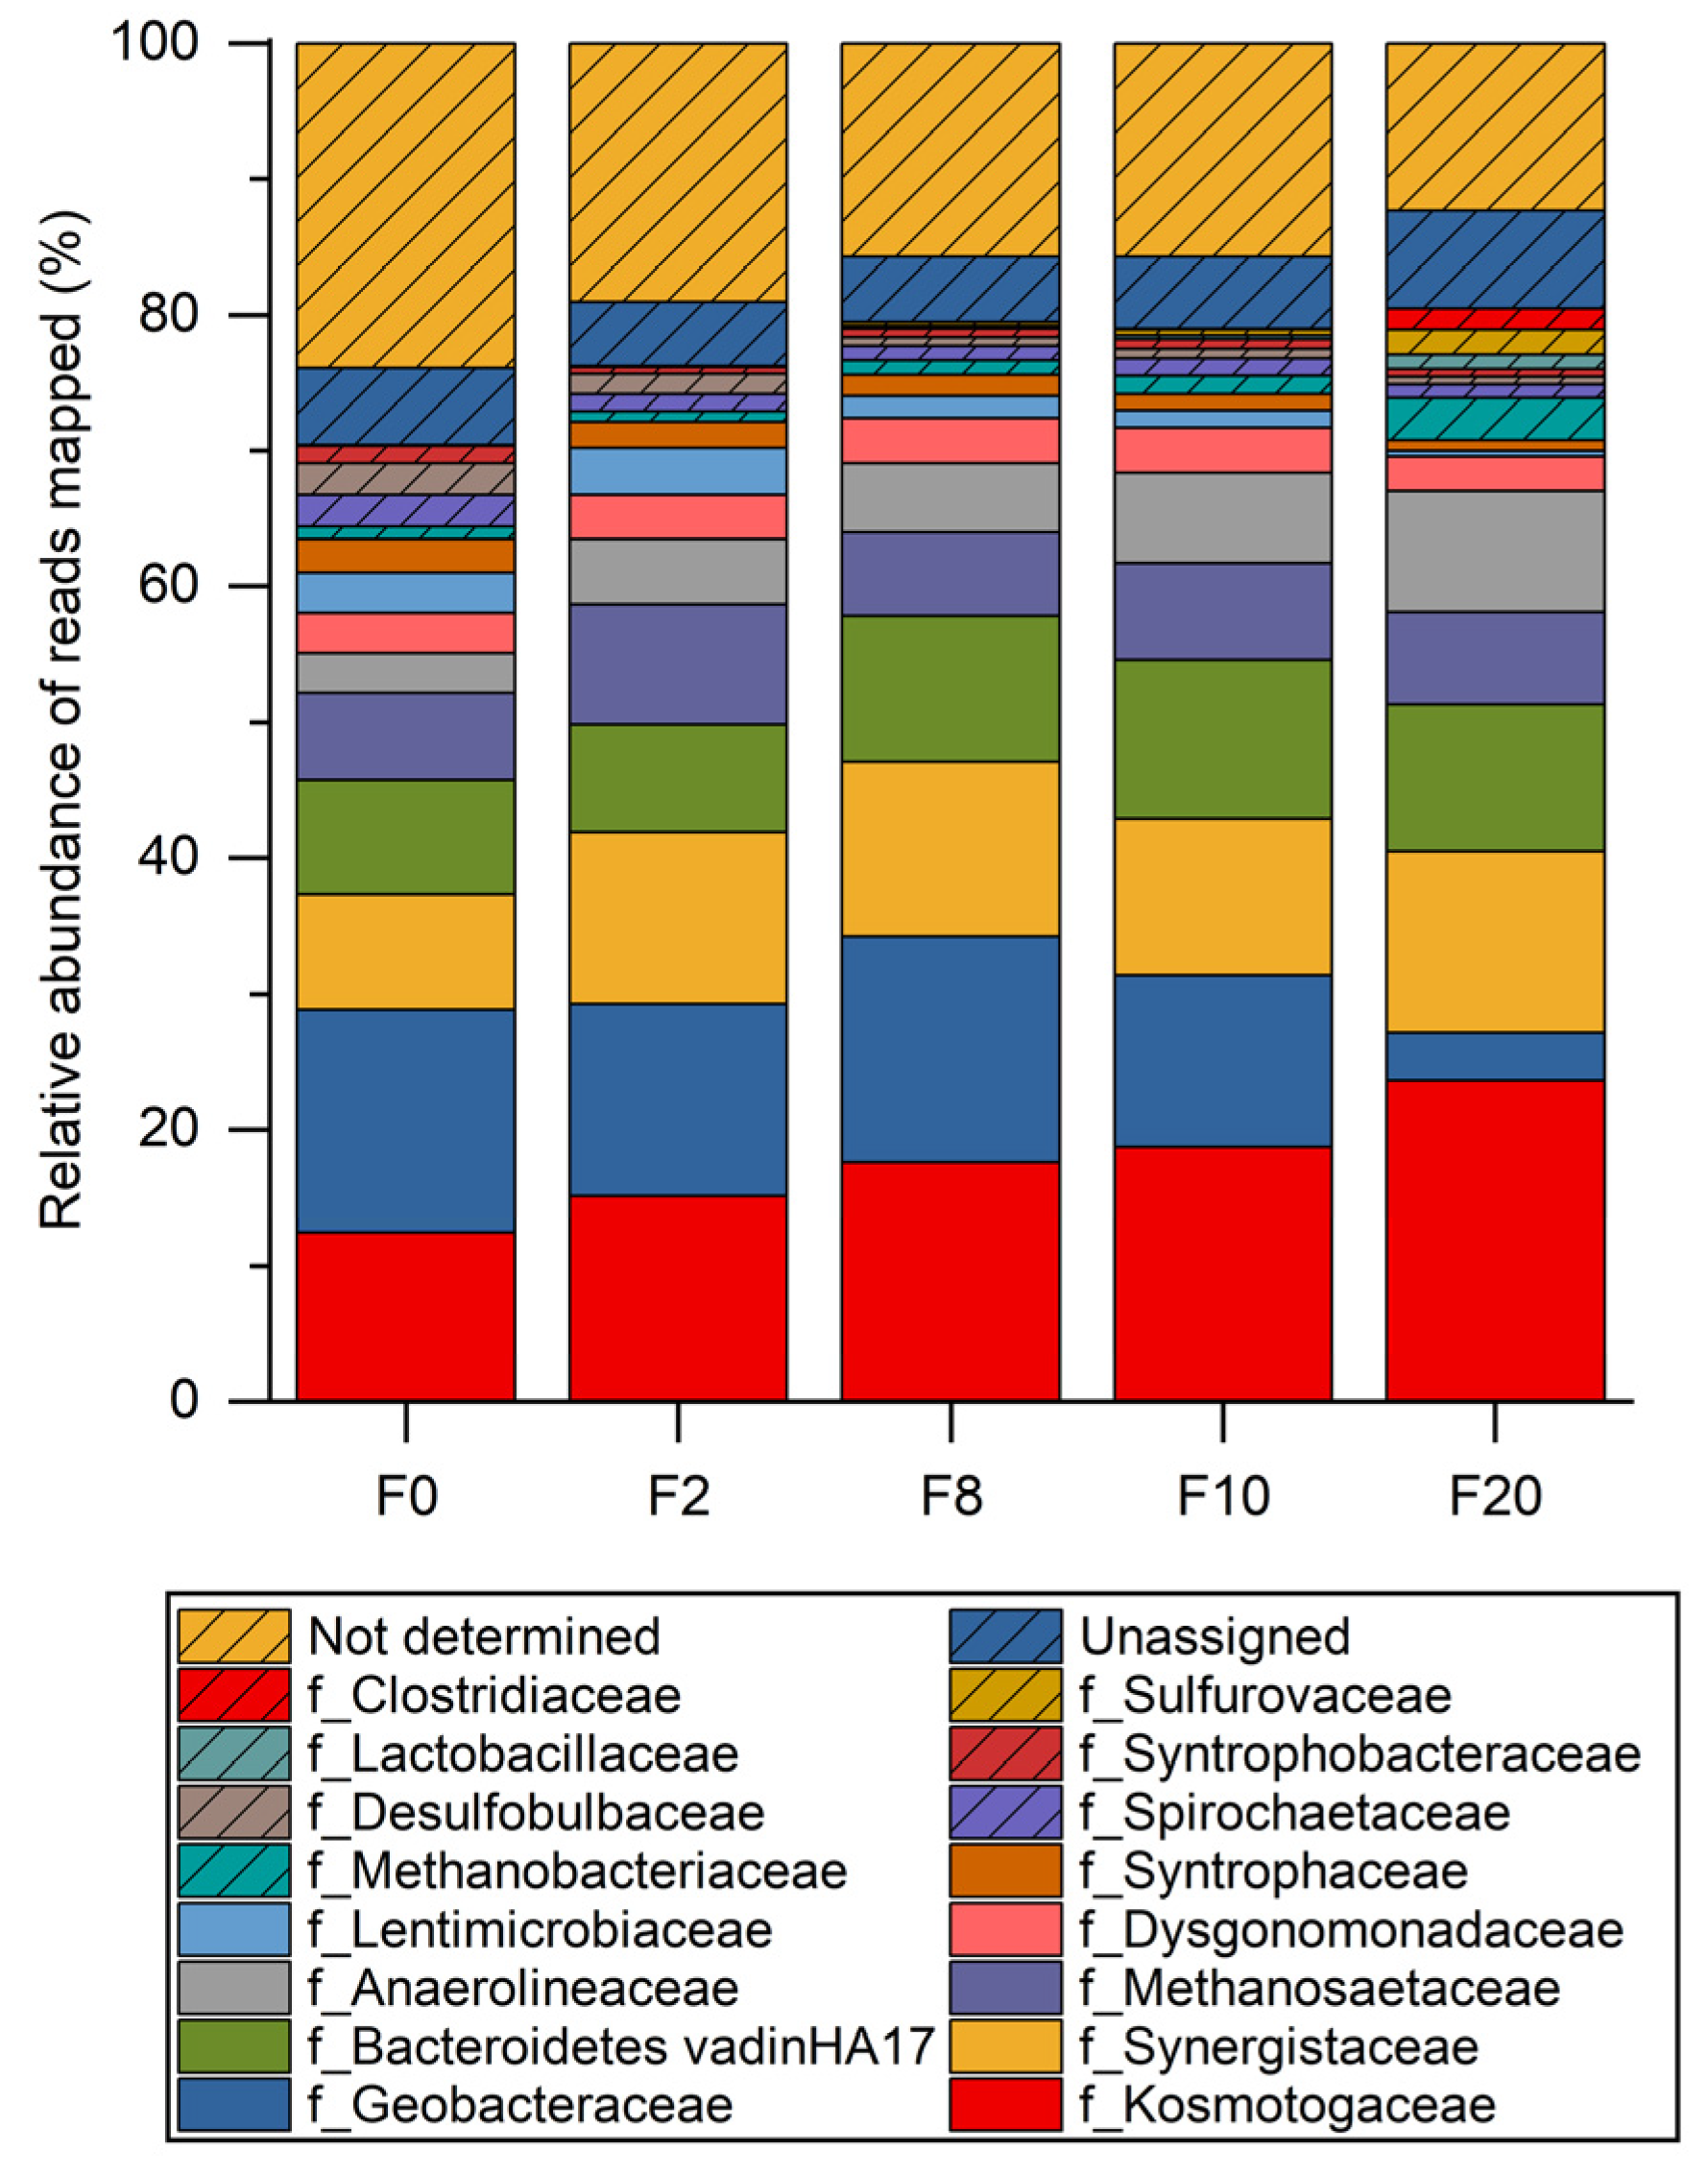
Analysis of the microbiome composition during the bioreactor fermentation showed a high microbial diversity and even composition, with representation of a variety of phyla including Thermotogae, Proteobacteria, and Bacteroidetes, among others. The most abundant families identified corresponded to Kosmotogaceae (12.4–23.6% of reads mapping to their corresponding ASVs), Geobacteraceae (3.5–16.6% of reads mapped), Synergistaceae (8.5–13.4% of reads mapped), Bacteroidaceae (7.9–11.7% of reads mapped) and Methanosaetaceae (6.1–8.9% of reads mapped). However, the percentage of reads mapped to several of these families did not present an increasing trend during the fermentation; this suggests that their presence in the microbial community was due to their high abundance in the granular sludge used as inoculum and the large inoculum size (50% v/v), rather than corresponding to an actual active role during the conversion of butyrate. This is likely the case for the putative Methanosaetaceae, Geobacteraceae, and Bacteroidaceae spp. identified, and several other families with minor representation in the microbial community (Figure 9). A preliminary analysis of the dynamics of the reads mapped suggests that the family Kosmotogaceae, represented exclusively by putative Mesotoga spp., was most probably involved in the conversion of butyrate into butanol, as the percentage of reads mapping to this family increases up to 23.6% during the fermentation (Figure 9).
The results of the microbiome analysis were generally consistent with the product profile obtained experimentally. As mentioned above, the main products of the fermentation were butanol, ethanol, acetate, lactate, and methane. This indicated the presence of several functional groups in the microbial community, namely (i) a variety of fermentative bacteria likely performing the catabolic activities leading to acids and alcohols production, (ii) methanogenic archaea producing methane, and (iii) probably autotrophic bacteria contributing to the production of acetate from CO2 using H2 as an electron donor. The composition of the microbiome was consistent with these observations, as a significant fraction of reads were mapped to several fermentative bacteria corresponding to putative Mesotoga spp. [31], Anaerolineaceae spp. [32], Clostridium spp. [33], and Lactobacillus spp. [34], all of which increased during the fermentation (Figure 9). Reads mapping to methanogenic archaea other than Methanosaetaceae spp. were also identified in small amounts (in line with the limited methane production during the fermentation) and corresponded to Methanobacteriaceae spp. and Methanospirillaceae spp., both likely growing hydrogenotrophically [35,36]. Nevertheless, it was not possible to confirm the presence of autotrophic bacteria, despite the transient accumulation of significant amounts of acetate during the fermentation. Other putative species that might have contributed to the production of acetate and lactate include the aforementioned Anaerolineaceae spp. and Synergistaceae spp., as both families present an increasing percentage of reads mapped along the fermentation and count members that were previously reported to convert amino acids into carboxylic acids anaerobically [32,37] (Figure 9).
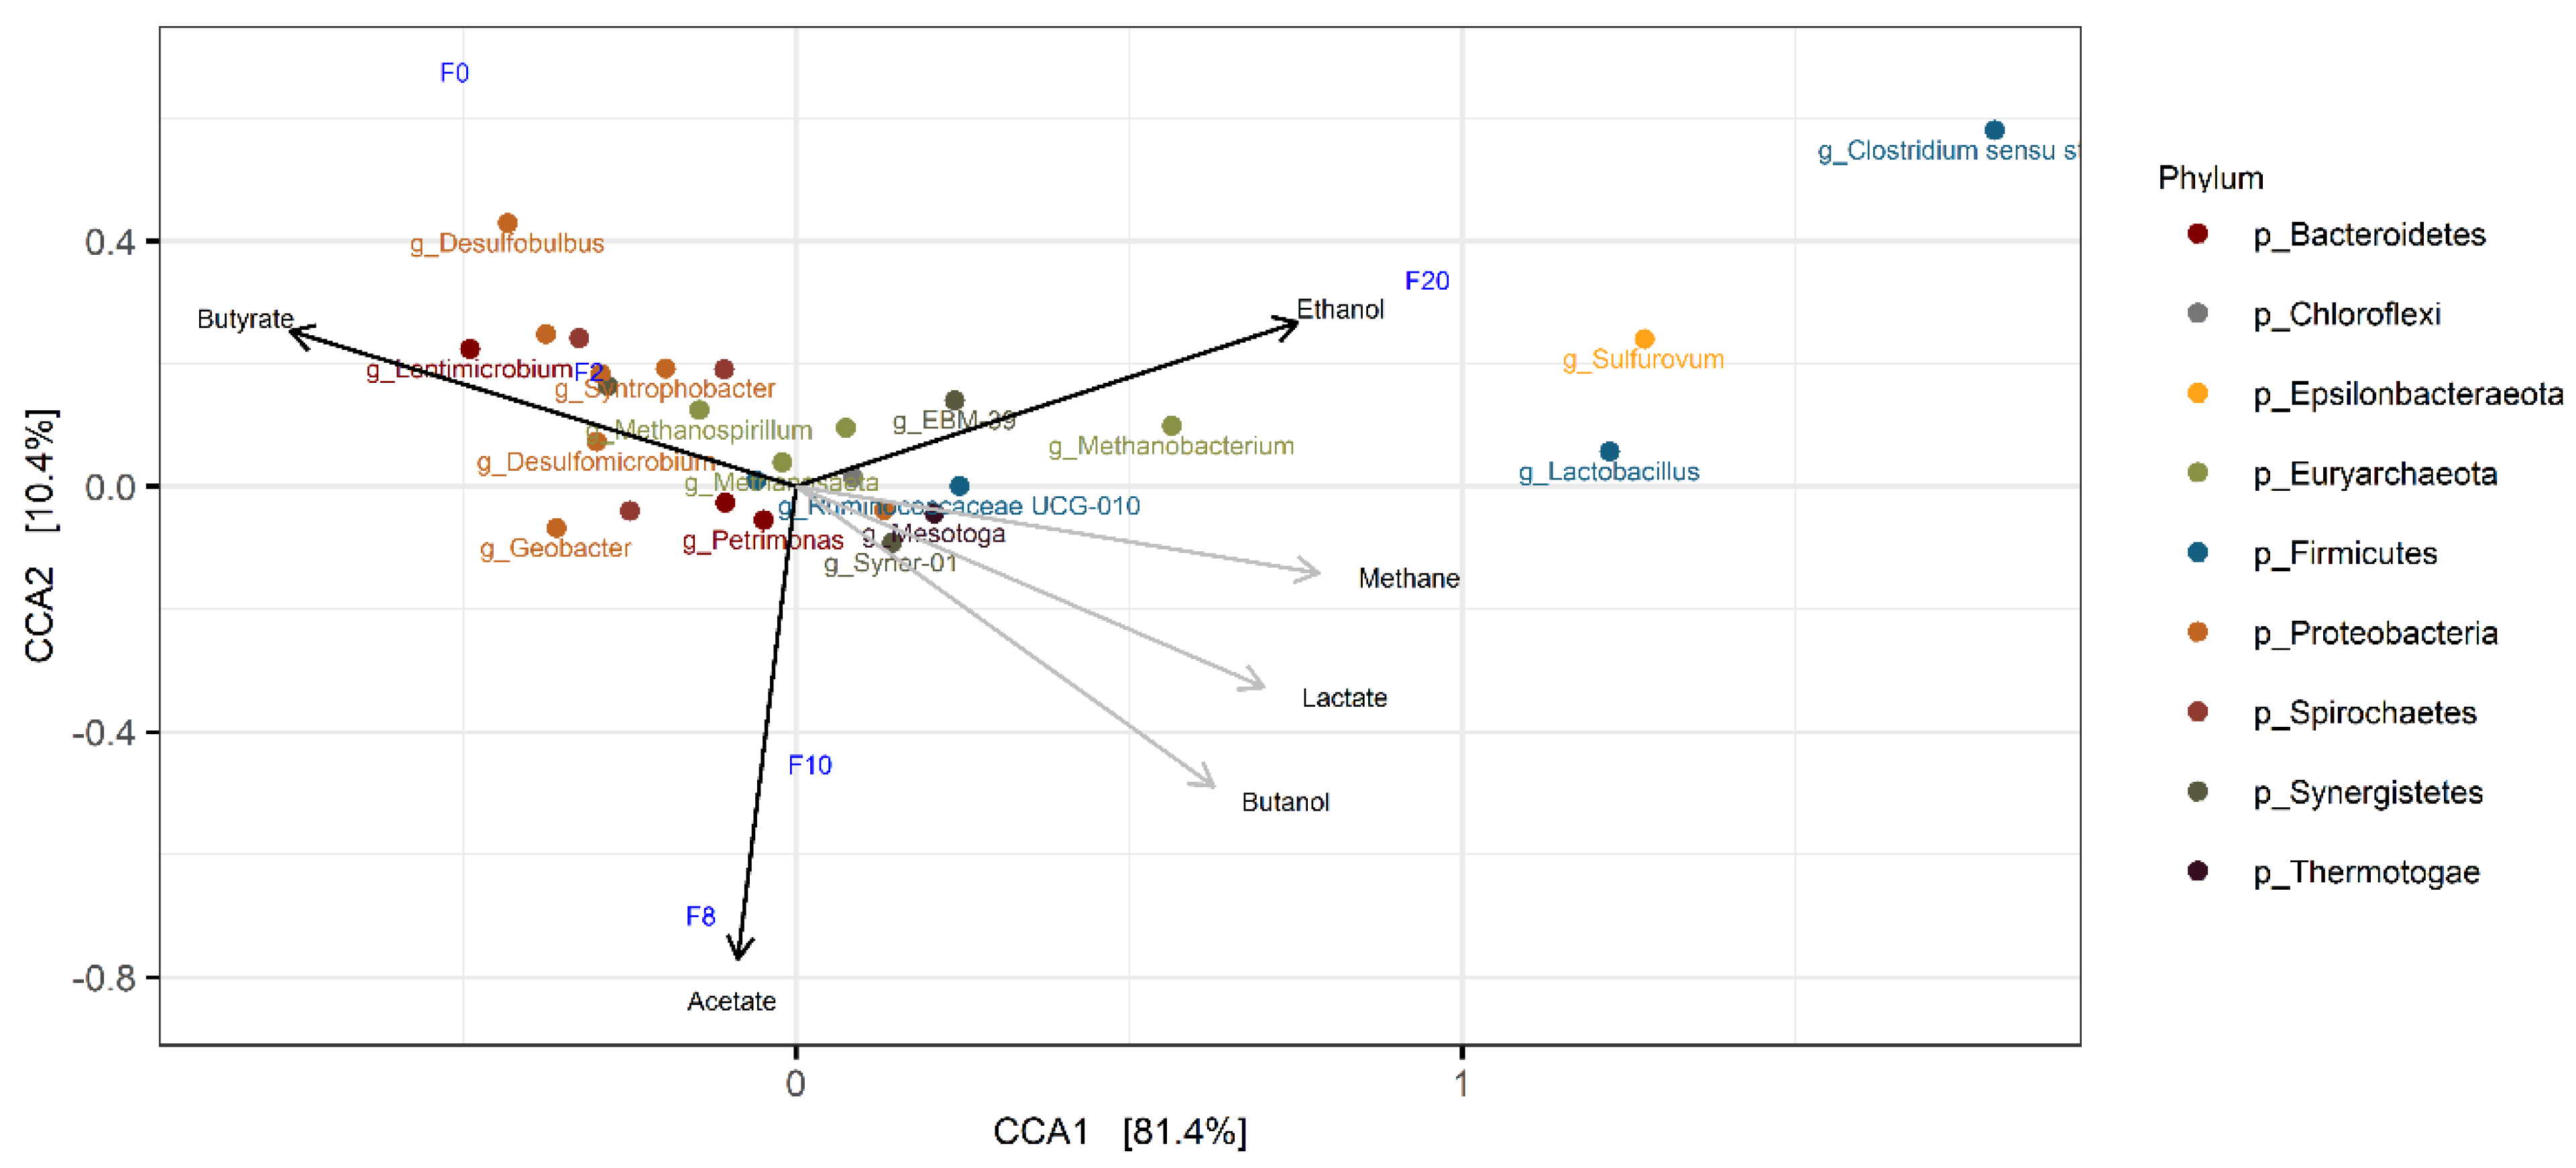
Keeping in mind the limitations of the microbial community analysis strictly based on the abundance of 16S rRNA gene amplicon reads, without considering the microbial load [38], the population dynamics of the microbiome were further investigated through a canonical correspondence analysis (CCA) (Figure 10) and Pearson correlation for selected genera (Figure 11) to infer their potential roles in the fermentation. The CCA shows that the fermentation samples (F0–F20) were ordinated according to the pattern of activity observed along the fermentation, which was characterized by an initial consumption/production of butyrate/butanol, followed by a transient production of acetate and its further reduction into ethanol at the end of the fermentation (Figure 4). The initial fermentation samples (F0 and F2) are located close to and move along the butyrate/butanol vector, followed by the proximity of samples F8 and F10 to the acetate vector; finally, F20 is aligned with the ethanol vector. In turn, the genera scores resulted in a mainly horizontal distribution aligned with the butyrate vector, with few exceptions, such as Clostridium spp. (Figure 10). This indicated that changes in the percentage of reads mapped to these genera are closely related to the changes in butyrate, butanol, and lactate concentrations in the broth, as well as CH4 evolution. However, among those aligned with the butyrate vector, the few genera located in the negative side of the vector, e.g., Mesotoga spp. (family Kosmotogaceae) and Syner-01 spp. (family Synergistaceae), are those that presented an increase in relative abundance as butyrate was converted (Figure 10). This implies that these genera most likely had an active role during the fermentation. As shown in Figure 11A,B, the changes in relative abundance of the putative Mesotoga spp. have a significant correlation with the changes in butyrate and butanol concentration in the broth, which suggests that this genus was responsible for the reduction of butyrate into butanol. Mesotoga spp. were previously reported to produce a variety of acids including butyrate [31], for which the re-assimilation and further reduction of butyrate into butanol is possible. Other genera likely responsible for the reduction of acetate into ethanol and the conversion of H2/CO2 into methane are Clostridium and Methanobacterium, both of which presented a significant correlation with the evolution of ethanol and methane, respectively (Figure 11C,D).
Overall, the results of the microbiome analysis support the fact that butyrate was exclusively converted to butanol, while the synthesis of other products found at the end of the fermentation originated from other carbon sources present in the inoculated sludge, such as carbon dioxide and proteinaceous material.

4. Conclusions

  • Schott bottle experiments showed butanol production from butyrate and hydrogen to a highest titer of 4.4 mM and volumetric productivity of 0.44 mmol L−1 d−1 of butanol. The use of a large inoculum size of anaerobic granular sludge (50% v/v) and lack of pH control contributed largely to by-product formation, with acetate as the most predominant measured by-product.
  • A bioreactor operated at pH 5.5 and a p H 2 of 2 bar showed an increase in butanol titer (10.9 mM) and volumetric productivity (0.68 mmol L−1 d−1); 2.98- and 4.65-fold increases from previously reported values, respectively. By-product formation from granular sludge was still prevalent, but directed towards ethanol production.
  • Butyrate conversion is solely directed at butanol formation according to thermodynamics. Calculations of the actual Gibbs energy changes for the proposed catabolic reactions support the thermodynamic feasibility of by-product formation from bicarbonate in granular sludge, with the exception of lactate formation.
  • Open microbiome analysis further supports exclusive butyrate conversion to butanol, probably by Mesotoga spp., and formation of by-products from residual carbon sources present in the inoculum. Reduced by-products such as ethanol and methane are most likely produced by Clostridium spp. and Methanobacterium spp., respectively.

Supplementary Materials

The following supporting information can be downloaded at: https://www.mdpi.com/article/10.3390/fermentation8070333/s1. File S1: Derivations for Gibbs energy~change.

Author Contributions

Conceptualization, T.P., H.J. and X.F.-A.; methodology, T.P., A.G.-A. and H.J.; software, T.P., A.G.-A. and H.J.; validation, T.P., A.G.-A. and X.F.-A.; formal analysis, T.P., A.G.-A., H.N.G. and H.J.; writing—original draft preparation, T.P., A.G.-A., H.N.G. and X.F.-A.; writing—review and editing, all authors; visualization, T.P., A.G.-A. and H.J.; supervision, K.V.G., X.F.-A. and H.J.; project administration, K.V.G. and H.J.; funding acquisition, K.V.G. and H.J. All authors have read and agreed to the published version of the manuscript.

Funding

This research was funded by the European Union’s Horizon 2020 research and innovation program under the Marie Sklodowska-Curie grant agreement number 713683 (COFUNDfellowsDTU), the Danish Council for Independent Research in the frame of the DFF FTP research project GREENLOGIC (grant agreement No. 7017-00175A) and the DFF-International Postdoc (grant no. 0170-00014B), and the Novo Nordisk Fonden in the frame of the Fermentation-Based Biomanufacturing education initiative (grant agreement No. NNF17SA0031362).

Institutional Review Board Statement

Not applicable.

Informed Consent Statement

Not applicable.

Data Availability Statement

Not applicable.

Acknowledgments

The authors acknowledge support obtained from the European Union’s Horizon 2020 research and innovation program under the Marie Sklodowska-Curie grant agreement number 713683 (COFUNDfellowsDTU), from the Danish Council for Independent Research in the frame of the DFF FTP research project GREENLOGIC (grant agreement No. 7017-00175A) and DFF-International Postdoc (grant no. 0170-00014B), and from the Novo Nordisk Fonden in the frame of the Fermentation-Based Biomanufacturing education initiative (grant agreement No. NNF17SA0031362).

Conflicts of Interest

The authors declare that they have no known competing conflict of interest or personal relationship that could have appeared to influence the work reported in this paper and are aware of the ethics regarding a journal publication.

Abbreviations

ADanaerobic digestion
VFAvolatile fatty acid
ABEacetone, butanol, ethanol
HPLChigh-performance liquid chromatography
MSmass spectrometer
MFCmass flow controller
p H 2 hydrogen partial pressure
∆G1actual Gibbs energy change
∆G0standard Gibbs energy change
Rgas constant
Ttemperature
y i stoichiometric coefficient of compound i
c i concentration of compound i
K a acid dissociation constant
H2hydrogen
HCO3-bicarbonate
CO2carbon dioxide
CH4methane
ASVamplicon sequence variant
CCAcanonical correspondence analysis

References

  1. Mansouri, S.S.; Udugama, I.A.; Cignitti, S.; Mitic, A.; Flores-Alsina, X.; Gernaey, K.V. Resource recovery from bio-based production processes: A future necessity? Curr. Opin. Chem. Eng. 2017, 18, 1–9. [Google Scholar] [CrossRef]
  2. International Energy Agency. Key World Energy Statistics; International Energy Agency: Paris, France, 2019.
  3. Dürre, P. Fermentative butanol production: Bulk chemical and biofuel. Ann. N. Y. Acad. Sci. 2008, 1125, 353–362. [Google Scholar] [CrossRef] [PubMed]
  4. Pugazhendhi, A.; Mathimani, T.; Varjani, S.; Rene, E.R.; Kumar, G.; Kim, S.H.; Ponnusamy, V.K.; Yoon, J.J. Biobutanol as a promising liquid fuel for the future—Recent updates and perspectives. Fuel 2019, 253, 637–646. [Google Scholar] [CrossRef]
  5. Harvey, B.G.; Meylemans, H.A. The role of butanol in the development of sustainable fuel technologies. J. Chem. Technol. Biotechnol. 2011, 86, 2–9. [Google Scholar] [CrossRef]
  6. Pinto, T.; Flores-Alsina, X.; Gernaey, K.V.; Junicke, H. Alone or together? A review on pure and mixed microbial cultures for butanol production. Renew. Sustain. Energy Rev. 2021, 147, 111244. [Google Scholar] [CrossRef]
  7. Udugama, I.A.; Petersen, L.A.H.; Falco, F.C.; Junicke, H.; Mitic, A.; Alsina, X.F.; Mansouri, S.S.; Gernaey, K.V. Resource recovery from waste streams in a water-energy-food nexus perspective: Toward more sustainable food processing. Food Bioprod. Process. 2020, 119, 133–147. [Google Scholar] [CrossRef]
  8. Chen, H.; Hao, S.; Chen, Z.; O-Thong, S.; Fan, J.; Clark, J.; Luo, G.; Zhang, S. Mesophilic and thermophilic anaerobic digestion of aqueous phase generated from hydrothermal liquefaction of cornstalk: Molecular and metabolic insights. Water Res. 2020, 168, 115199. [Google Scholar] [CrossRef]
  9. Amha, Y.M.; Sinha, P.; Lagman, J.; Gregori, M.; Smith, A.L. Elucidating microbial community adaptation to anaerobic co-digestion of fats, oils, and grease and food waste. Water Res. 2017, 123, 277–289. [Google Scholar] [CrossRef]
  10. Feldman, H.; Flores-Alsina, X.; Ramin, P.; Kjellberg, K.; Jeppsson, U.; Batstone, D.J.; Gernaey, K.V. Modelling an industrial anaerobic granular reactor using a multi-scale approach. Water Res. 2017, 126, 488–500. [Google Scholar] [CrossRef] [Green Version]
  11. Jones, D.T.; Woods, D.R. Acetone-butanol fermentation revisited. Microbiol. Rev. 1986, 50, 484–524. Available online: http://www.ncbi.nlm.nih.gov/pubmed/3540574 (accessed on 31 January 2018).
  12. Jankowska, E.; Duber, A.; Chwialkowska, J.; Stodolny, M.; Oleskowicz-Popiel, P. Conversion of organic waste into volatile fatty acids—The influence of process operating parameters. Chem. Eng. J. 2018, 345, 395–403. [Google Scholar] [CrossRef]
  13. Steinbusch, K.J.J.; Hamelers, H.V.M.; Buisman, C.J.N. Alcohol production through volatile fatty acids reduction with hydrogen as electron donor by mixed cultures. Water Res. 2008, 42, 4059–4066. [Google Scholar] [CrossRef] [PubMed]
  14. Junicke, H.; van Loosdrecht, M.C.M.; Kleerebezem, R. Kinetic and thermodynamic control of butyrate conversion in non-defined methanogenic communities. Appl. Microbiol. Biotechnol. 2016, 100, 915–925. [Google Scholar] [CrossRef] [Green Version]
  15. Kleerebezem, R.; van Loosdrecht, M.C.M. A Generalized Method for Thermodynamic State Analysis of Environmental Systems. Crit. Rev. Environ. Sci. Technol. 2010, 40, 1–54. [Google Scholar] [CrossRef]
  16. Takahashi, S.; Tomita, J.; Nishioka, K.; Hisada, T.; Nishijima, M. Development of a Prokaryotic Universal Primer for Simultaneous Analysis of Bacteria and Archaea Using Next-Generation Sequencing. PLoS ONE 2014, 9, e105592. [Google Scholar] [CrossRef] [Green Version]
  17. Martin, M. Cutadapt removes adapter sequences from high-thoughput sequencing reads. EMBnet. J. 2011, 17, 10–12. [Google Scholar] [CrossRef]
  18. Edgar, R.C. UPARSE: Highly accurate OTU sequences from microbial amplicon reads. Nat. Methods 2013, 10, 996–998. [Google Scholar] [CrossRef]
  19. Rognes, T.; Flouri, T.; Nichols, B.; Quince, C.; Mahé, F. VSEARCH: A versatile open source tool for metagenomics. PeerJ 2016, 4, e2584. [Google Scholar] [CrossRef]
  20. Edgar, R.C. UNOISE2: Improved error-correction for Illumina 16S and ITS amplicon sequencing. BioRxiv 2016. [Google Scholar] [CrossRef] [Green Version]
  21. Bolyen, E.; Rideout, J.R.; Dillon, M.R.; Bokulich, N.A.; Abnet, C.C.; Al-Ghalith, G.A.; Alexander, H.; Alm, E.J.; Arumugam, M.; Asnicar, F.; et al. Reproducible, interactive, scalable and extensible microbiome data science using QIIME 2. Nat. Biotechnol. 2019, 37, 852–857. [Google Scholar] [CrossRef]
  22. R Core Team. R: A Language and Environment for Statistical Computing; R Foundation for Statistical Computing: Vienna, Austria, 2013; Available online: http://www.R-project.org/ (accessed on 21 January 2021).
  23. McMurdie, P.J.; Holmes, S. Phyloseq: An R Package for Reproducible Interactive Analysis and Graphics of Microbiome Census Data. PLoS ONE 2013, 8, e61217. [Google Scholar] [CrossRef] [PubMed] [Green Version]
  24. Oksanen, J.; Blanchet, G.F.; Friendly, M.; Kindt, R.; Legendre, P.; McGlinn, D.; Minchin, P.R.; O’Hara, R.B.; Simpson, G.L.; Solymos, P.; et al. Vegan: Community Ecology Package. R package Version 2.5–6. 2019. Available online: https://CRAN.R-project.org/package=vegan (accessed on 21 January 2021).
  25. Schink, B. Energetics of syntrophic cooperation in methanogenic degradation. Microbiol. Mol. Biol. Rev. 1997, 61, 262–280. [Google Scholar] [CrossRef] [PubMed] [Green Version]
  26. Hoehler, T.M. Biological energy requirements as quantitative boundary conditions for life in the subsurface. Geobiology 2004, 2, 205–215. [Google Scholar] [CrossRef]
  27. Feldman, H.; Flores-Alsina, X.; Ramin, P.; Kjellberg, K.; Jeppsson, U.; Batstone, D.J.; Gernaey, K.V. Assessing the effects of intra-granule precipitation in a full-scale industrial anaerobic digester. Water Sci. Technol. 2019, 79, 1327–1337. [Google Scholar] [CrossRef]
  28. Mañas, A.; Pocquet, M.; Biscans, B.; Sperandio, M. Parameters influencing calcium phosphate precipitation in granular sludge sequencing batch reactor. Chem. Eng. Sci. 2012, 77, 165–175. [Google Scholar] [CrossRef]
  29. El-Zouheiri, F.A. Screening of Optimum Process Conditions for Butanol Production in Mixed Microbial Cultures; Danmarks Tekniske Universitet: Copenhagen, Denmark, 2019; Available online: https://findit.dtu.dk/en/catalog/2453508175 (accessed on 15 June 2021).
  30. Batstone, D.J.; Keller, J.; Angelidaki, I.; Kalyuzhnyi, S.V.; Pavlostathis, S.G.; Rozzi, A.; Sanders, W.T.M.; Siegrist, H.; Vavilin, V.A. The IWA Anaerobic Digestion Model No 1 (ADM1). Water Sci. Technol. 2002, 45, 65–73. [Google Scholar] [CrossRef]
  31. Cappelletti, M.; Zannoni, D.; Postec, A.; Ollivier, B. Members of the Order Thermotogales: From Microbiology to Hydrogen Production. In Microbial Bioenergy: Hydrogen Production; Springer: Dordrecht, The Netherlands, 2014; pp. 197–224. [Google Scholar] [CrossRef]
  32. Yamada, T.; Sekiguchi, Y. A naerolineaceae. In Bergey’s Manual of Systematics of Archaea and Bacteria; John Wiley & Sons, Inc.: New York, NY, USA, 2018; pp. 1–5. [Google Scholar] [CrossRef]
  33. Xu, P.-X.; Chai, L.-J.; Qiu, T.; Zhang, X.-J.; Lu, Z.-M.; Xiao, C.; Wang, S.-T.; Shen, C.-H.; Shi, J.-S.; Xu, Z.-H. Clostridium fermenticellae sp. nov., isolated from the mud in a fermentation cellar for the production of the Chinese liquor, baijiu. Int. J. Syst. Evol. Microbiol. 2019, 69, 859–865. [Google Scholar] [CrossRef]
  34. Oki, K.; Kudo, Y.; Watanabe, K. Lactobacillus saniviri sp. nov. and Lactobacillus senioris sp. nov., isolated from human faeces. Int. J. Syst. Evol. Microbiol. 2012, 62, 601–607. [Google Scholar] [CrossRef] [Green Version]
  35. Ma, K.; Liu, X.; Dong, X. Methanobacterium beijingense sp. nov., a novel methanogen isolated from anaerobic digesters. Int. J. Syst. Evol. Microbiol. 2005, 55, 325–329. [Google Scholar] [CrossRef] [Green Version]
  36. Fournier, G.P.; Gogarten, J.P. Evolution of Acetoclastic Methanogenesis in Methanosarcina via Horizontal Gene Transfer from Cellulolytic Clostridia. J. Bacteriol. 2008, 190, 1124–1127. [Google Scholar] [CrossRef] [Green Version]
  37. Honda, T.; Fujita, T.; Tonouchi, A. Aminivibrio pyruvatiphilus gen. nov., sp. nov., an anaerobic, amino-acid-degrading bacterium from soil of a Japanese rice field. Int. J. Syst. Evol. Microbiol. 2013, 63, 3679–3686. [Google Scholar] [CrossRef] [PubMed]
  38. Props, R.; Kerckhof, F.M.; Rubbens, P.; de Vrieze, J.; Sanabria, E.H.; Waegeman, W.; Monsieurs, P.; Hammes, F.; Boon, N. Absolute quantification of microbial taxon abundances. ISME J. 2017, 11, 584–587. [Google Scholar] [CrossRef] [PubMed] [Green Version]
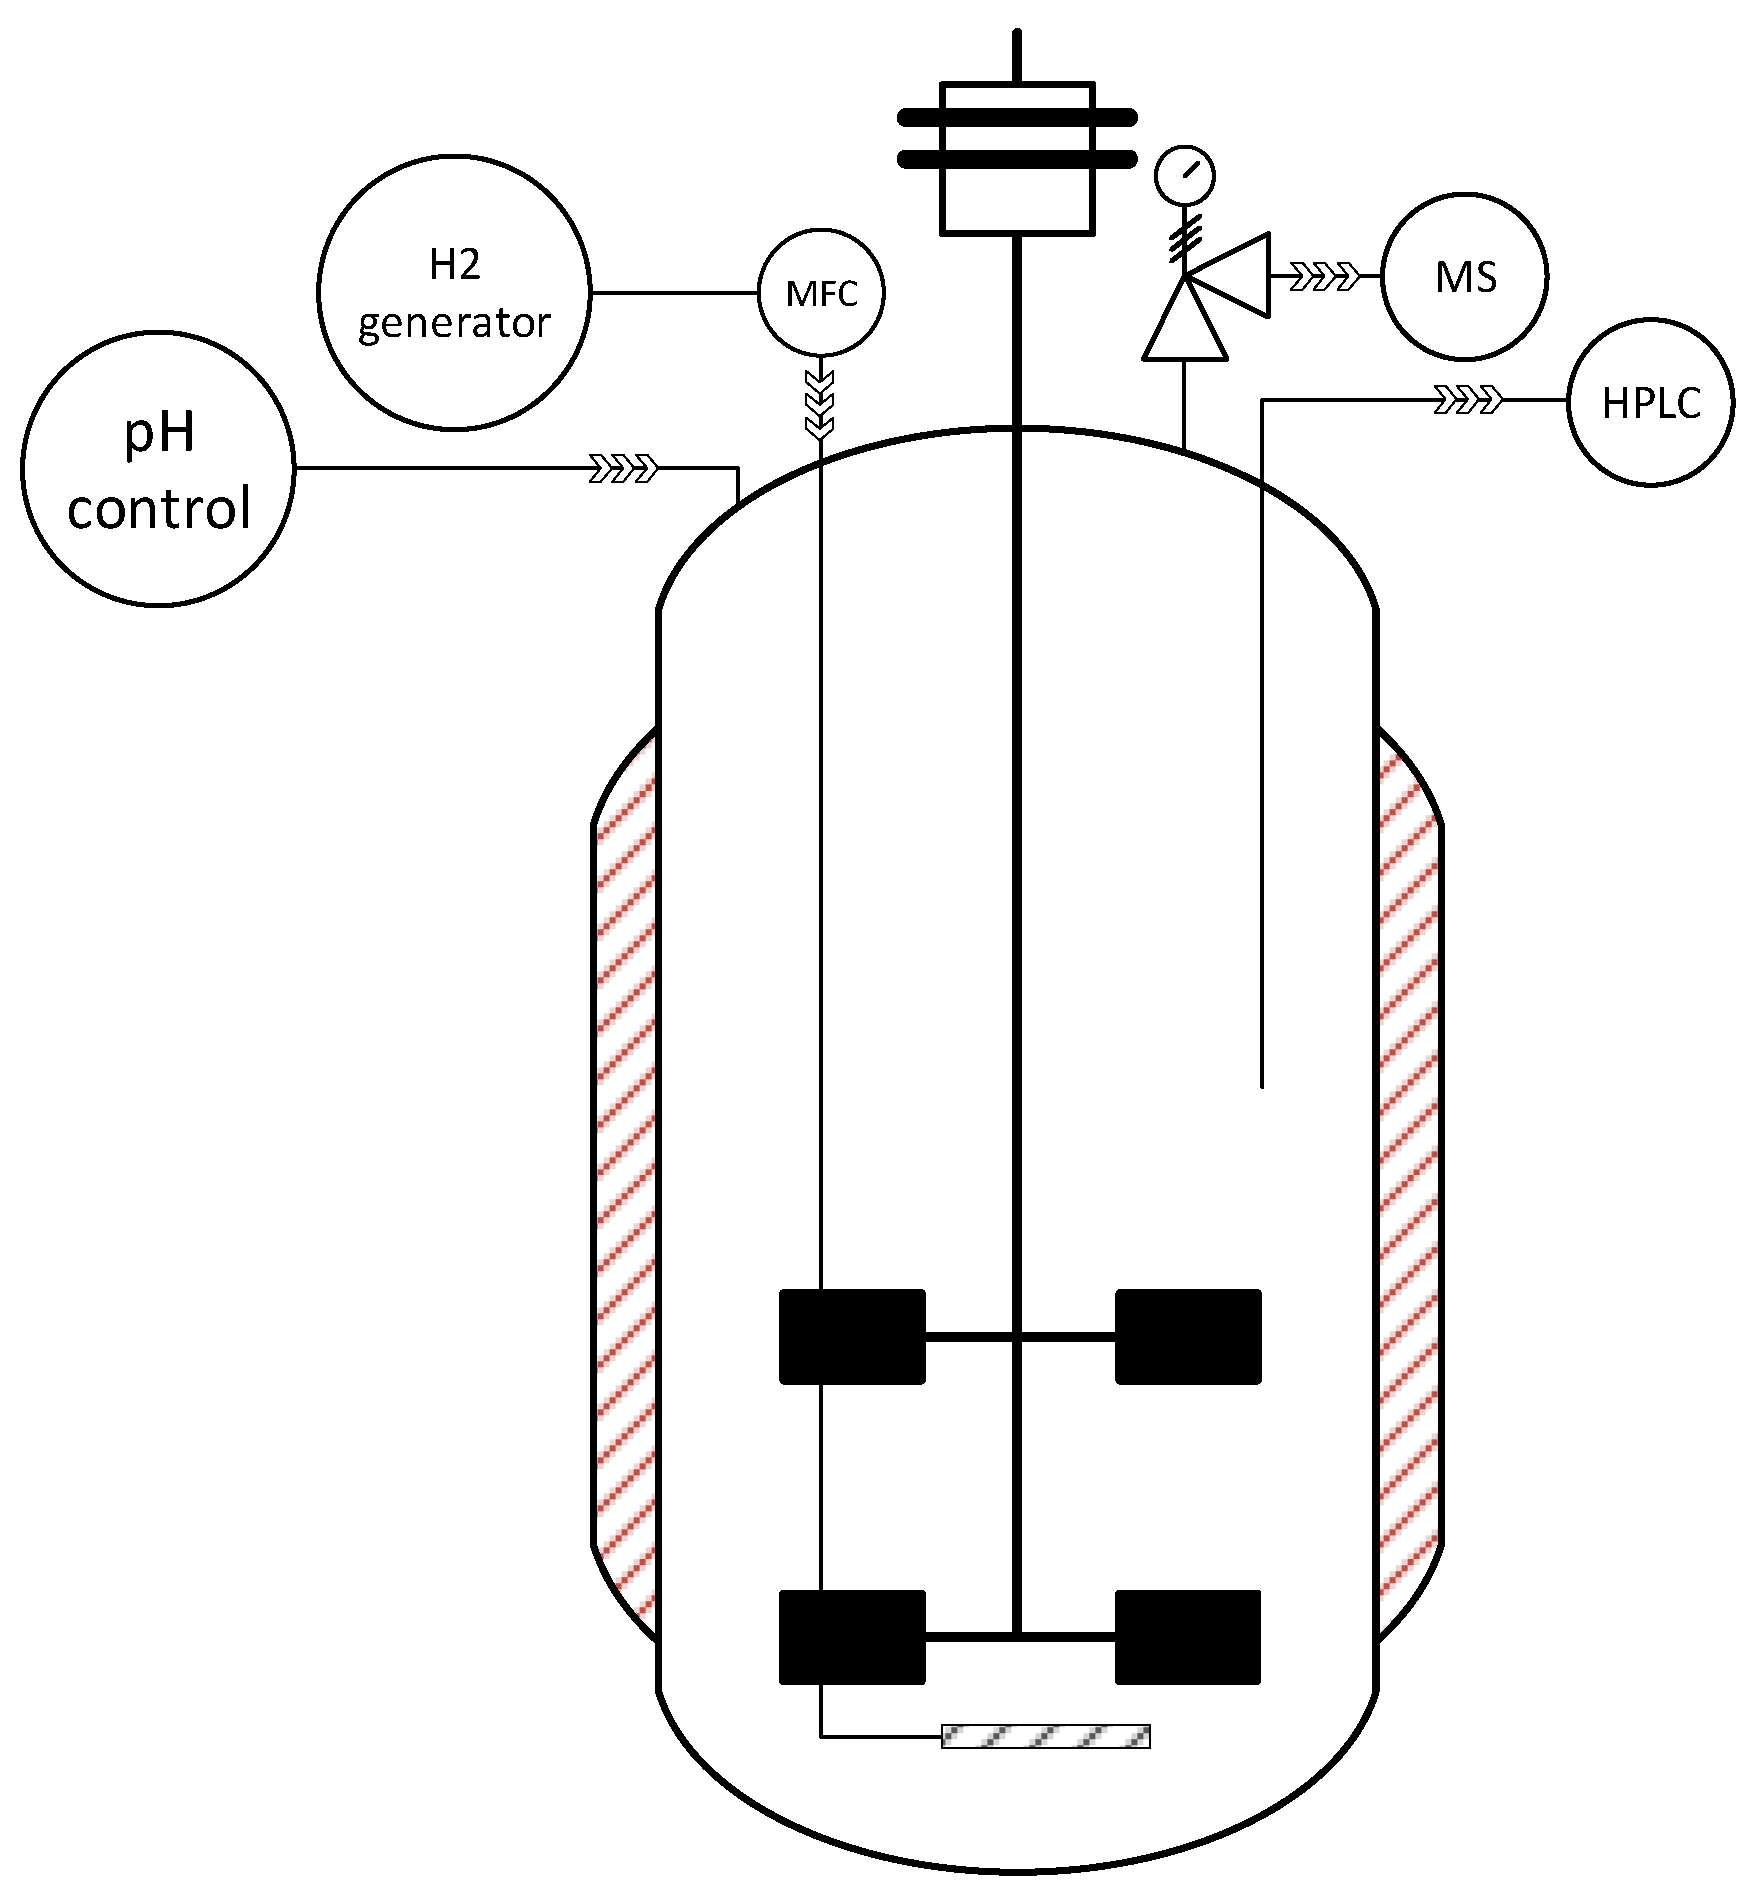
Figure 1. Bioreactor set-up for biobutanol production.
Fermentation 08 00333 g001
Figure 2. Actual Gibbs energy changes for butanol formation from butyrate and hydrogen (Equation (2)) as a function of pH at different H2 partial pressures of 0.01 bar (___), 0.1 bar (…..), 1 bar (----), 2 bar (_ _ _), and 10 bar (_ . _ . _) at 50 mM of butyrate and 10 mM of butanol.
Fermentation 08 00333 g002
Figure 3. Actual Gibbs energy changes for acetate formation from butyrate (Equation (1)) and homoacetogenesis (Equation (5)) at 50 mM butyrate and 10 mM acetate. For the homoacetogenic reaction, the partial pressure of carbon dioxide was calculated according to Equations (S1)–(S20) in the Supplementary Material. Black line represents 0 kJ mol−1 H2 limit.
Fermentation 08 00333 g003
Figure 4. Measured concentrations of butyrate as substrate (primary y-axis) and products (secondary y-axis) with time in the controlled bioreactor.
Fermentation 08 00333 g004
Figure 5. Cumulative concentrations of carbon dioxide and methane with time for the bioreactor run.
Fermentation 08 00333 g005
Figure 6. Carbon balance during the course of the bioreactor experiment. By-products include acetate, ethanol, lactate, and methane.
Fermentation 08 00333 g006
Figure 7. Actual Gibbs energy changes in kJ per mol of electron donor for (Equation (1)) butyrate oxidation to acetate, (Equation (2)) butyrate reduction to butanol, (Equation (5)) homoacetogenesis, (Equation (6)) hydrogenotrophic methanogenesis, (Equation (7)) acetate reduction to ethanol, (Equation (8)) acetoclastic methanogenesis, and (Equation (9)) lactate formation from acetate and CO2, with time according to experimental data in the bioreactor experiment.
Fermentation 08 00333 g007
Figure 8. Catabolic reactions used for the analysis of the thermodynamic system state.
Fermentation 08 00333 g008
Figure 9. Relative abundance of reads mapped to ASVs at family taxonomic level for bioreactor fermentation samples. Samples were collected on days 0, 2, 8, 10, and 20 of the fermentation. The “Unassigned” category corresponds to reads mapped to ASVs assigned to families with a percentage of reads below 1% in any of the samples.
Fermentation 08 00333 g009
Figure 10. Canonical correspondence analysis (CCA) ordination triplot of microbial species at genus level, fermentation samples, and substrate/product concentrations using Bray–Curtis distances. The constrained ordination explains 97.4% of the variation; the corresponding Eigen values for CCA1 and CCA2 are 0.103 and 0.013, respectively. The overall solution has a p-value of 0.0083. ASVs mapped to genera were color-coded according to phyla (given in the legend); fermentation samples are depicted as labels in blue; and substrate/products are shown as arrows. Methane, lactate, and butanol (shown in grey) were not used as ordination constraints due to high collinearity with butyrate. Sample scores and product concentration scores were scaled by a factor of 0.5 and 0.8, respectively, to enhance visualization of the data.
Fermentation 08 00333 g010
Figure 11. (AD) Comparison of the relative abundance of selected genera to substrate/product concentration along the bioreactor fermentation. “R” corresponds to the Pearson correlation coefficient and “p” is the p-value of the correlation.
Fermentation 08 00333 g011
Table 1. Experimental conditions for the 1 L Schott bottle experiments.
ControlExperiment 50Experiment 15
Inoculum size (v/v)50%50%15%
Total suspended solids (g L−1)23.823.87.1
Initial butyrate concentration (mM)05050
MediumYesYesYes
Hydrogen partial pressure (bar)1.51.51.5
Table 2. Measured substrate concentration (butyrate) and maximum product concentrations after 10 days of fermentation in 1 L Schott bottles.
ControlExperiment 50Experiment 15
Butyrate (mM)0.5241.7047.36
Products (mM)
Acetate14.3319.585.19
Butanol0.004.401.33
i-Butyrate0.671.020.26
Propionate0.821.810.34
i-Valerate1.022.270.57
Publisher’s Note: MDPI stays neutral with regard to jurisdictional claims in published maps and institutional affiliations.