
Observation of Residues Content after Application of a Medium-Chain Fatty Acids Mixture at the End of Alcoholic Fermentation


Abstract
:1. Introduction
2. Materials and Methods
2.1. Design of Experiment
2.2. Sensory Analysis
2.3. Determination of the Fatty Acids by GC-MS
2.4. Determination of Glucose and Fructose Content
2.5. Preparation of the MCFA Mixture Solution
2.6. Statistical Analysis
3. Results and Discussion
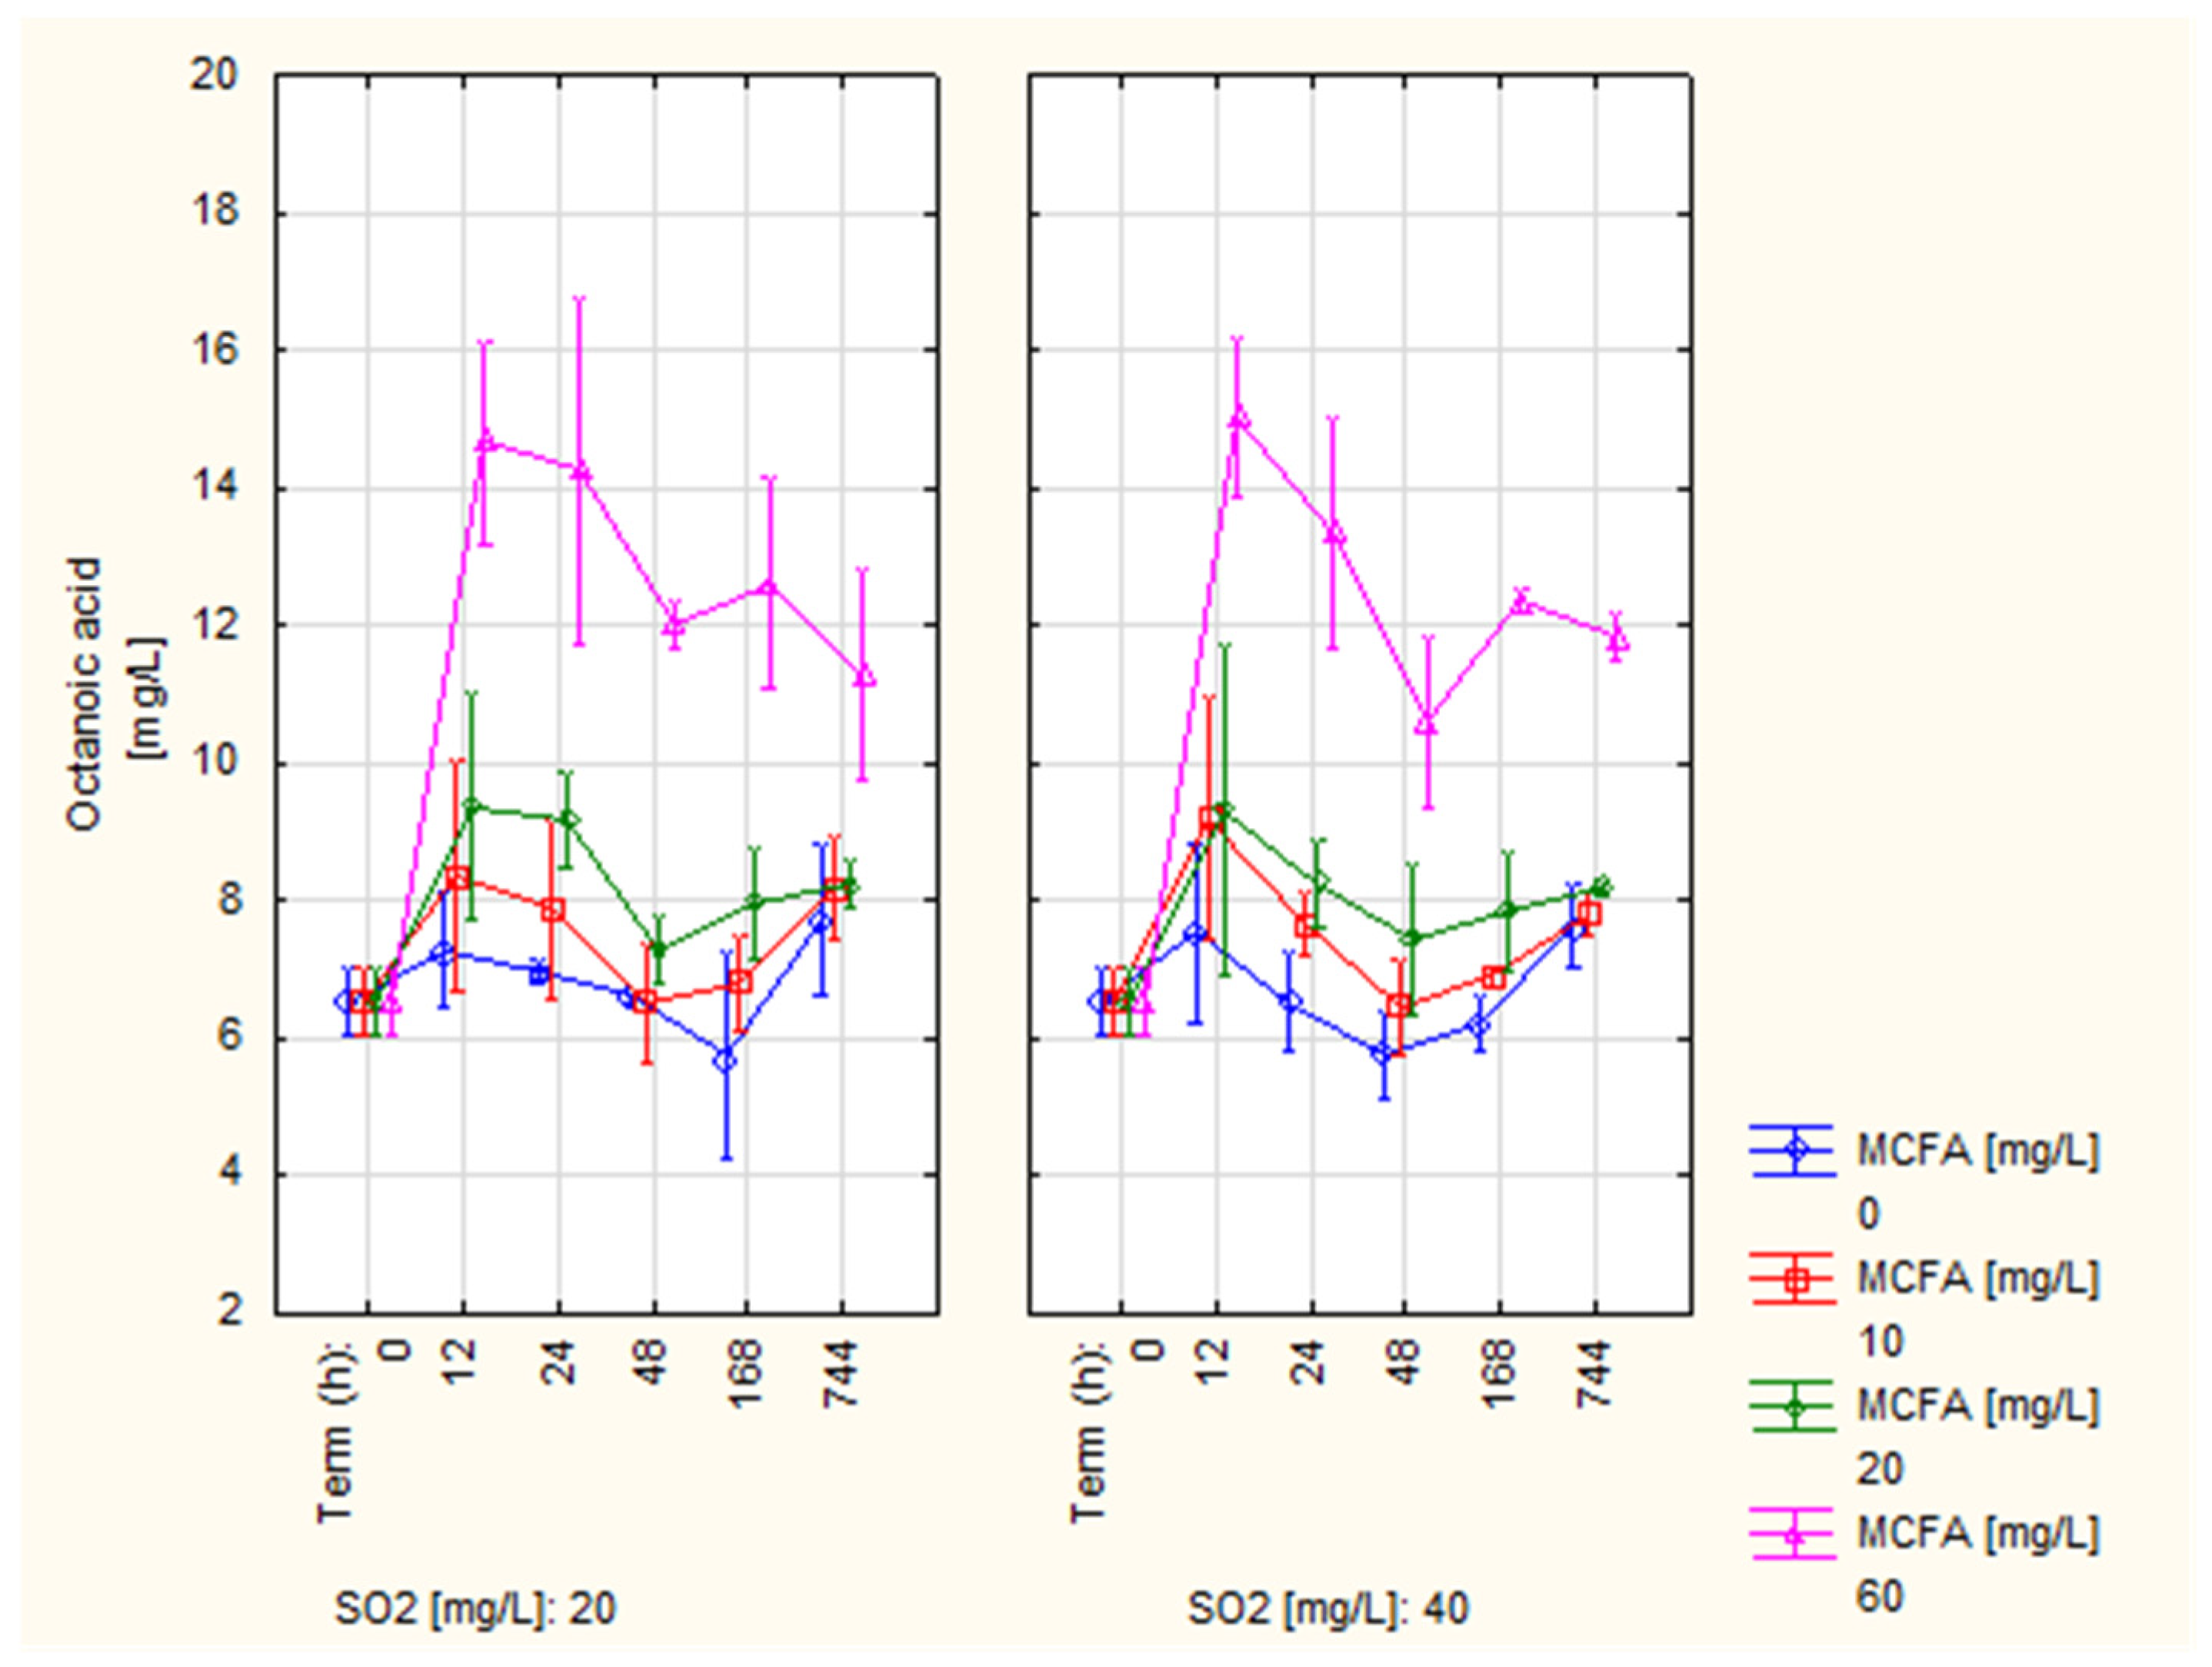
3.1. Octanoic Acid
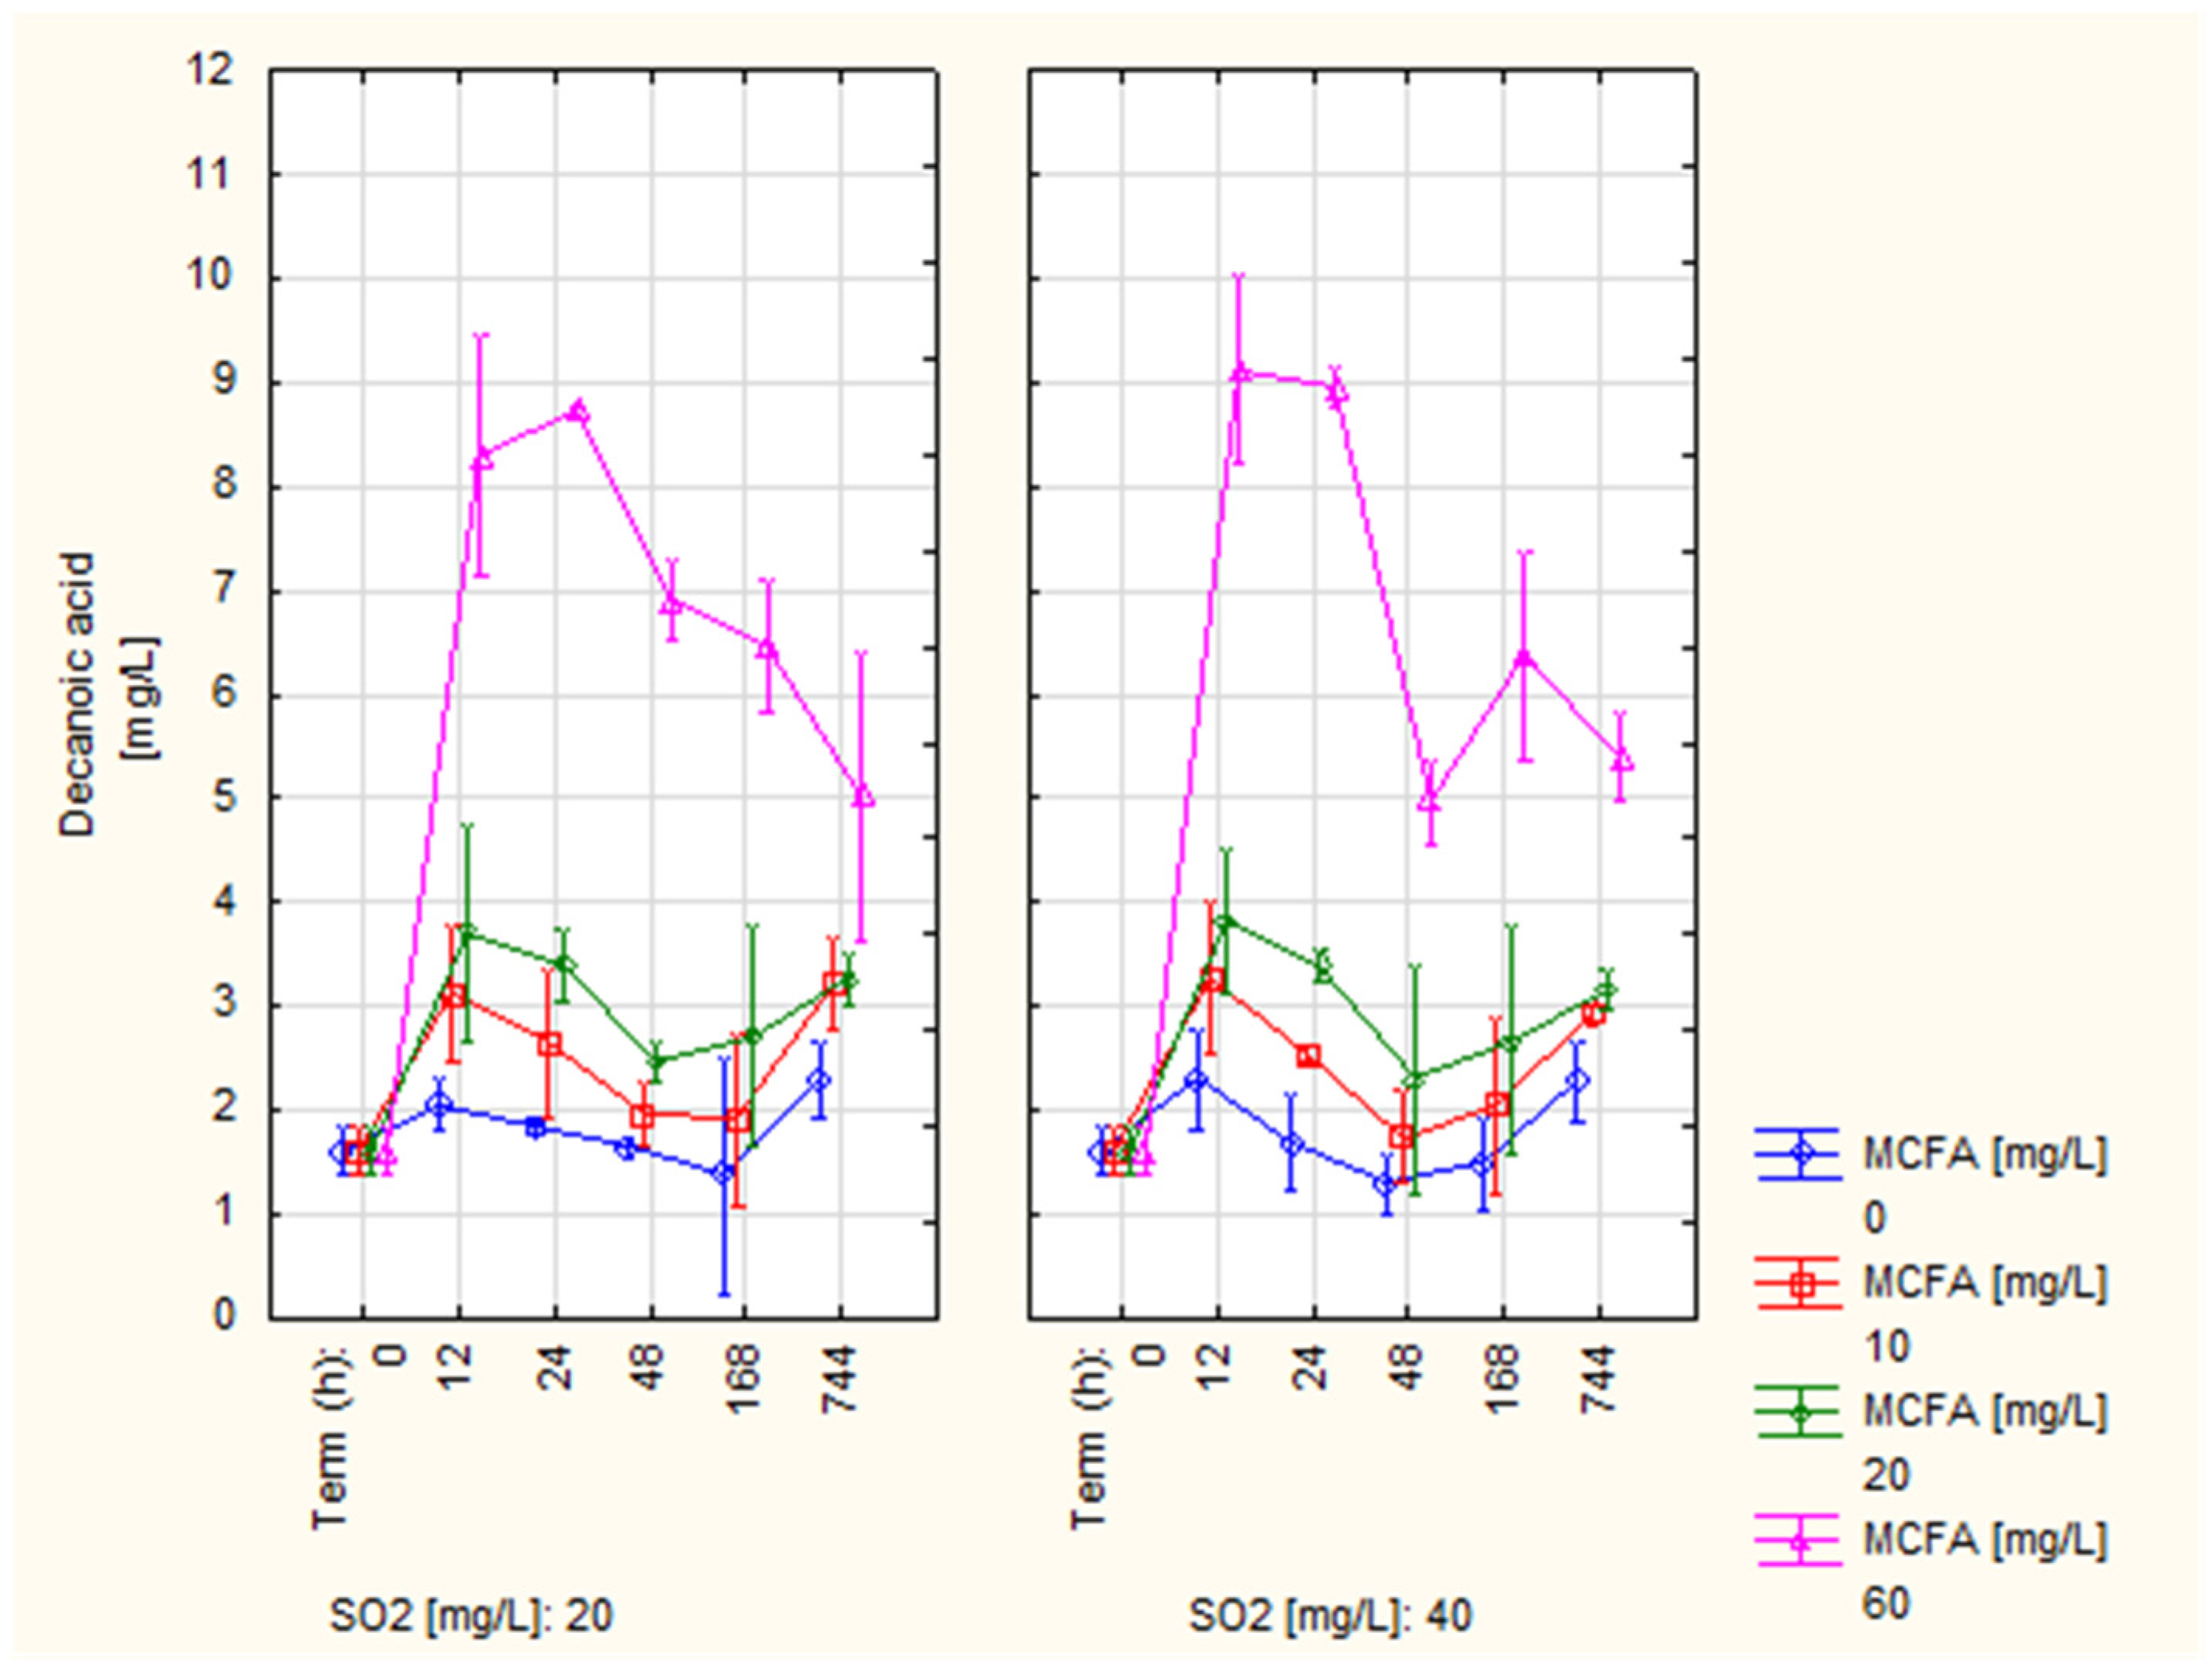
3.2. Decanoic Acid
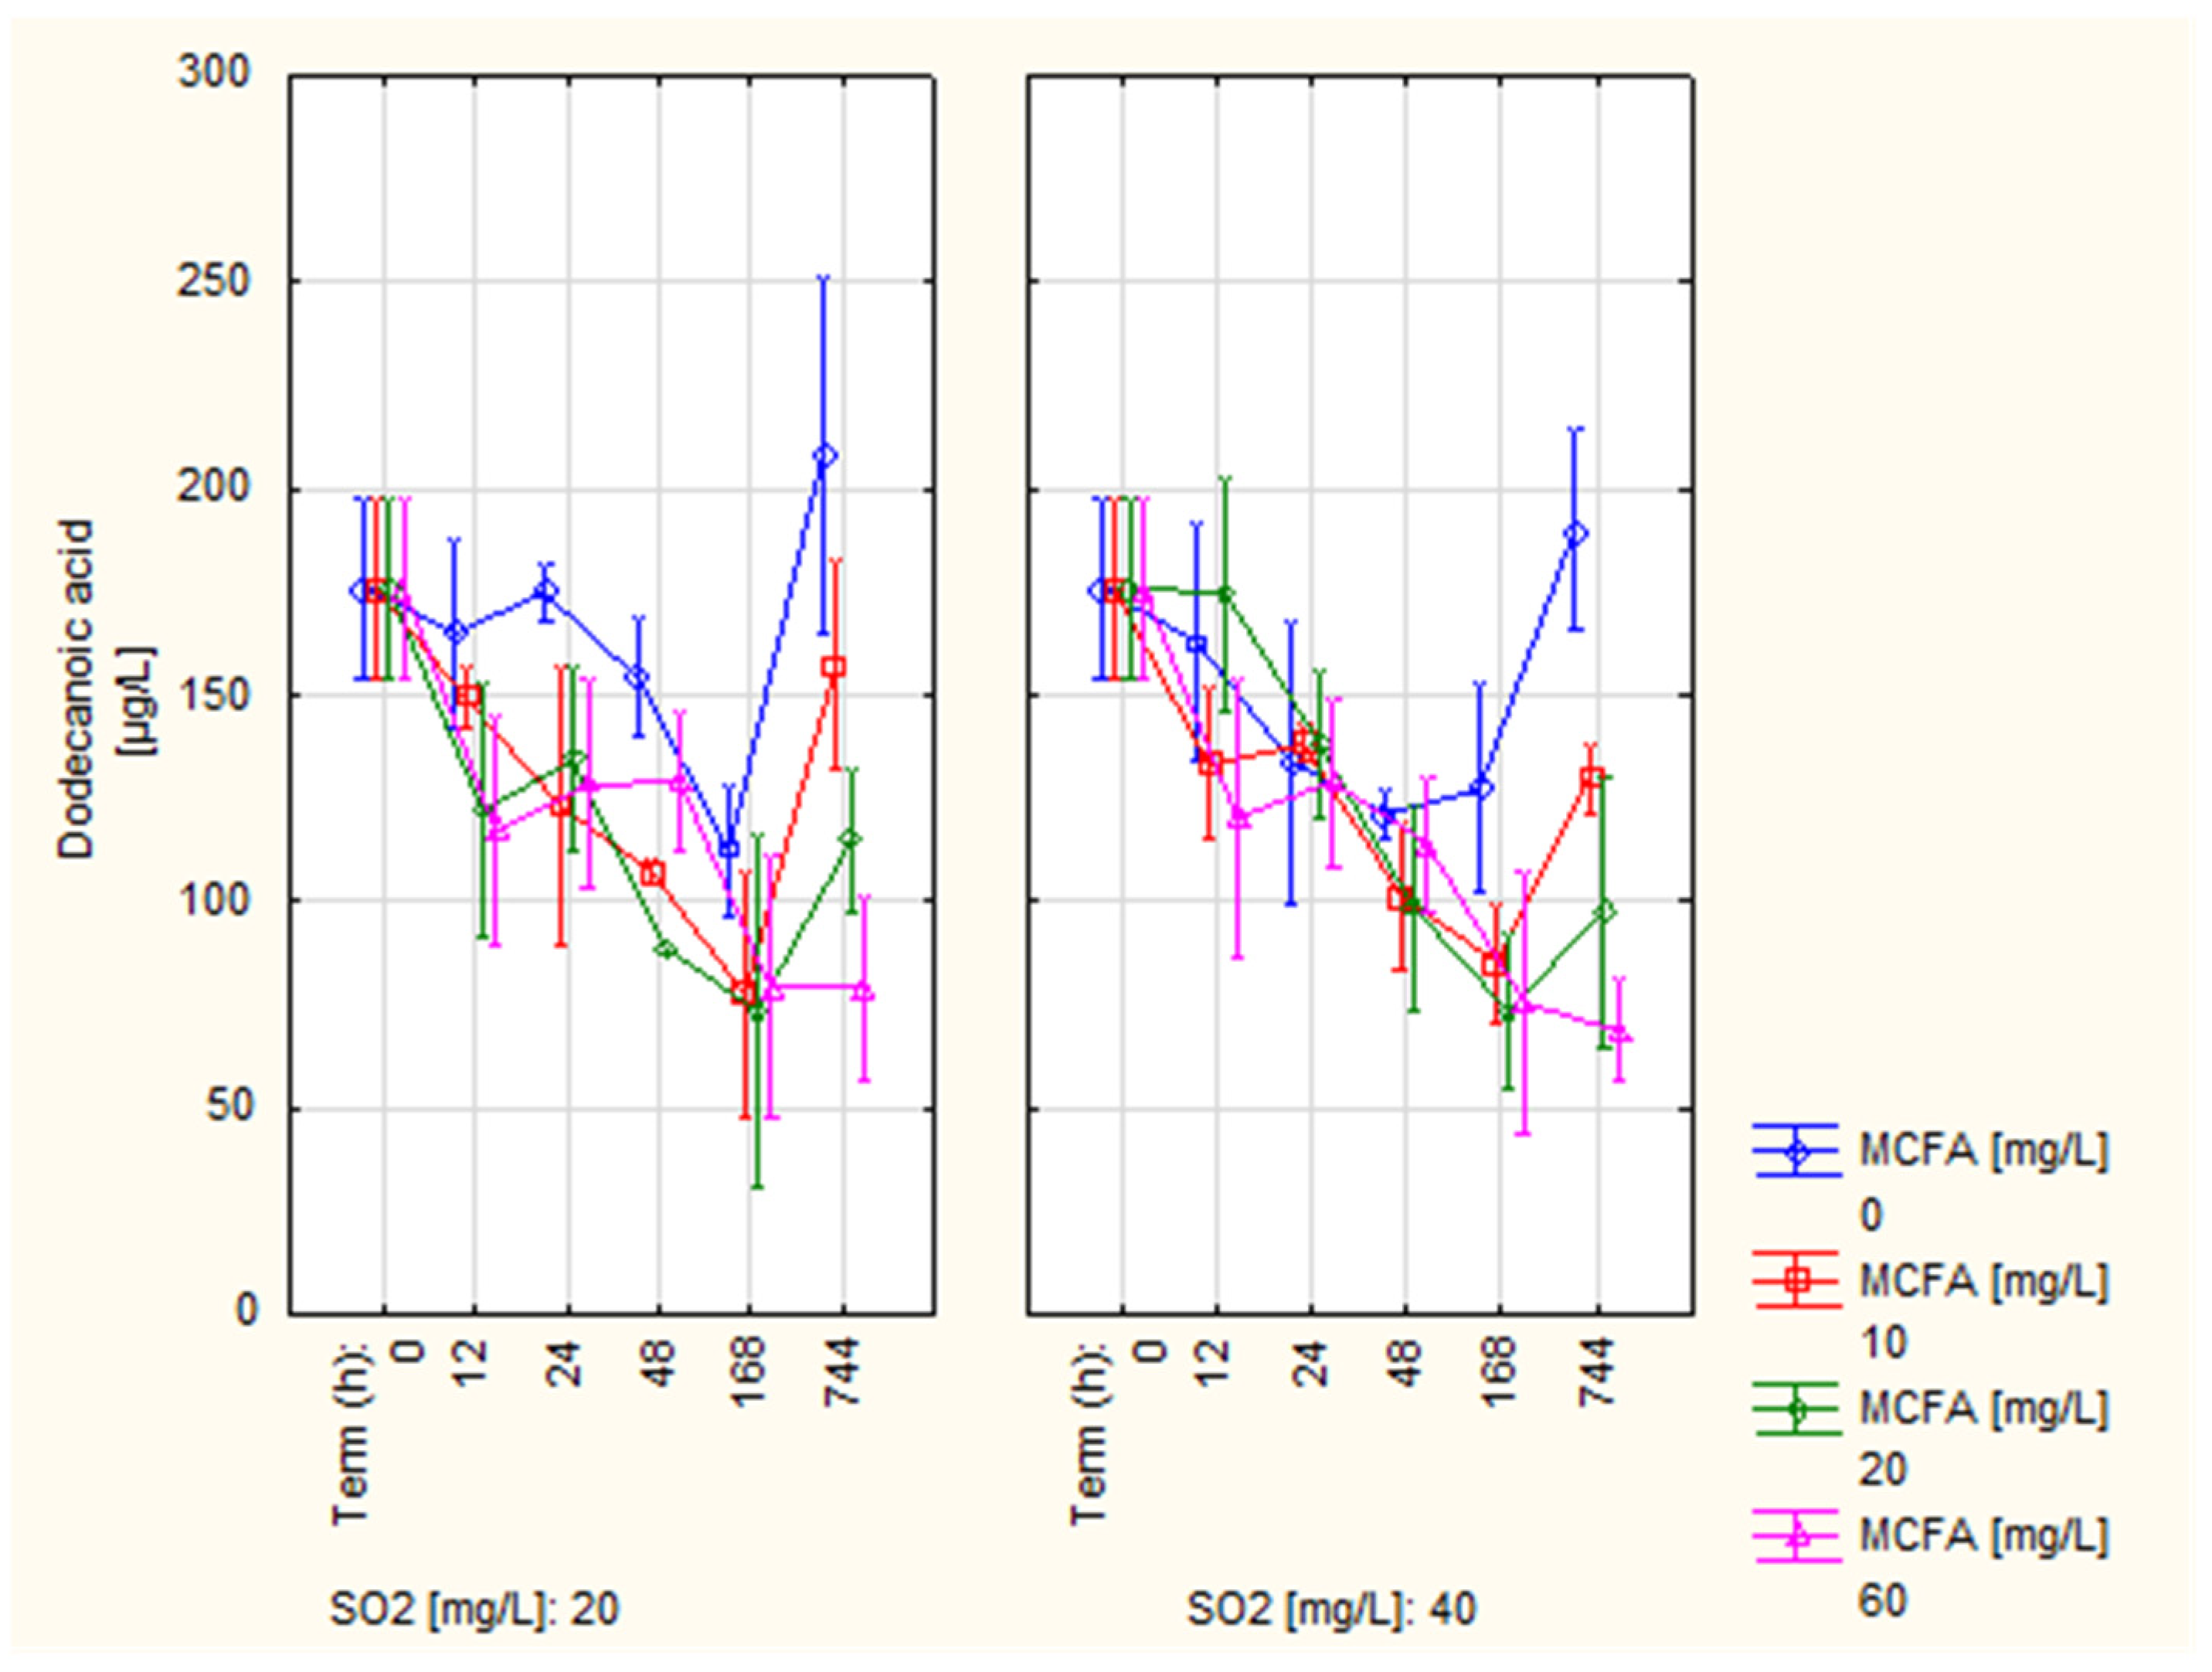
3.3. Dodecanoic Acid
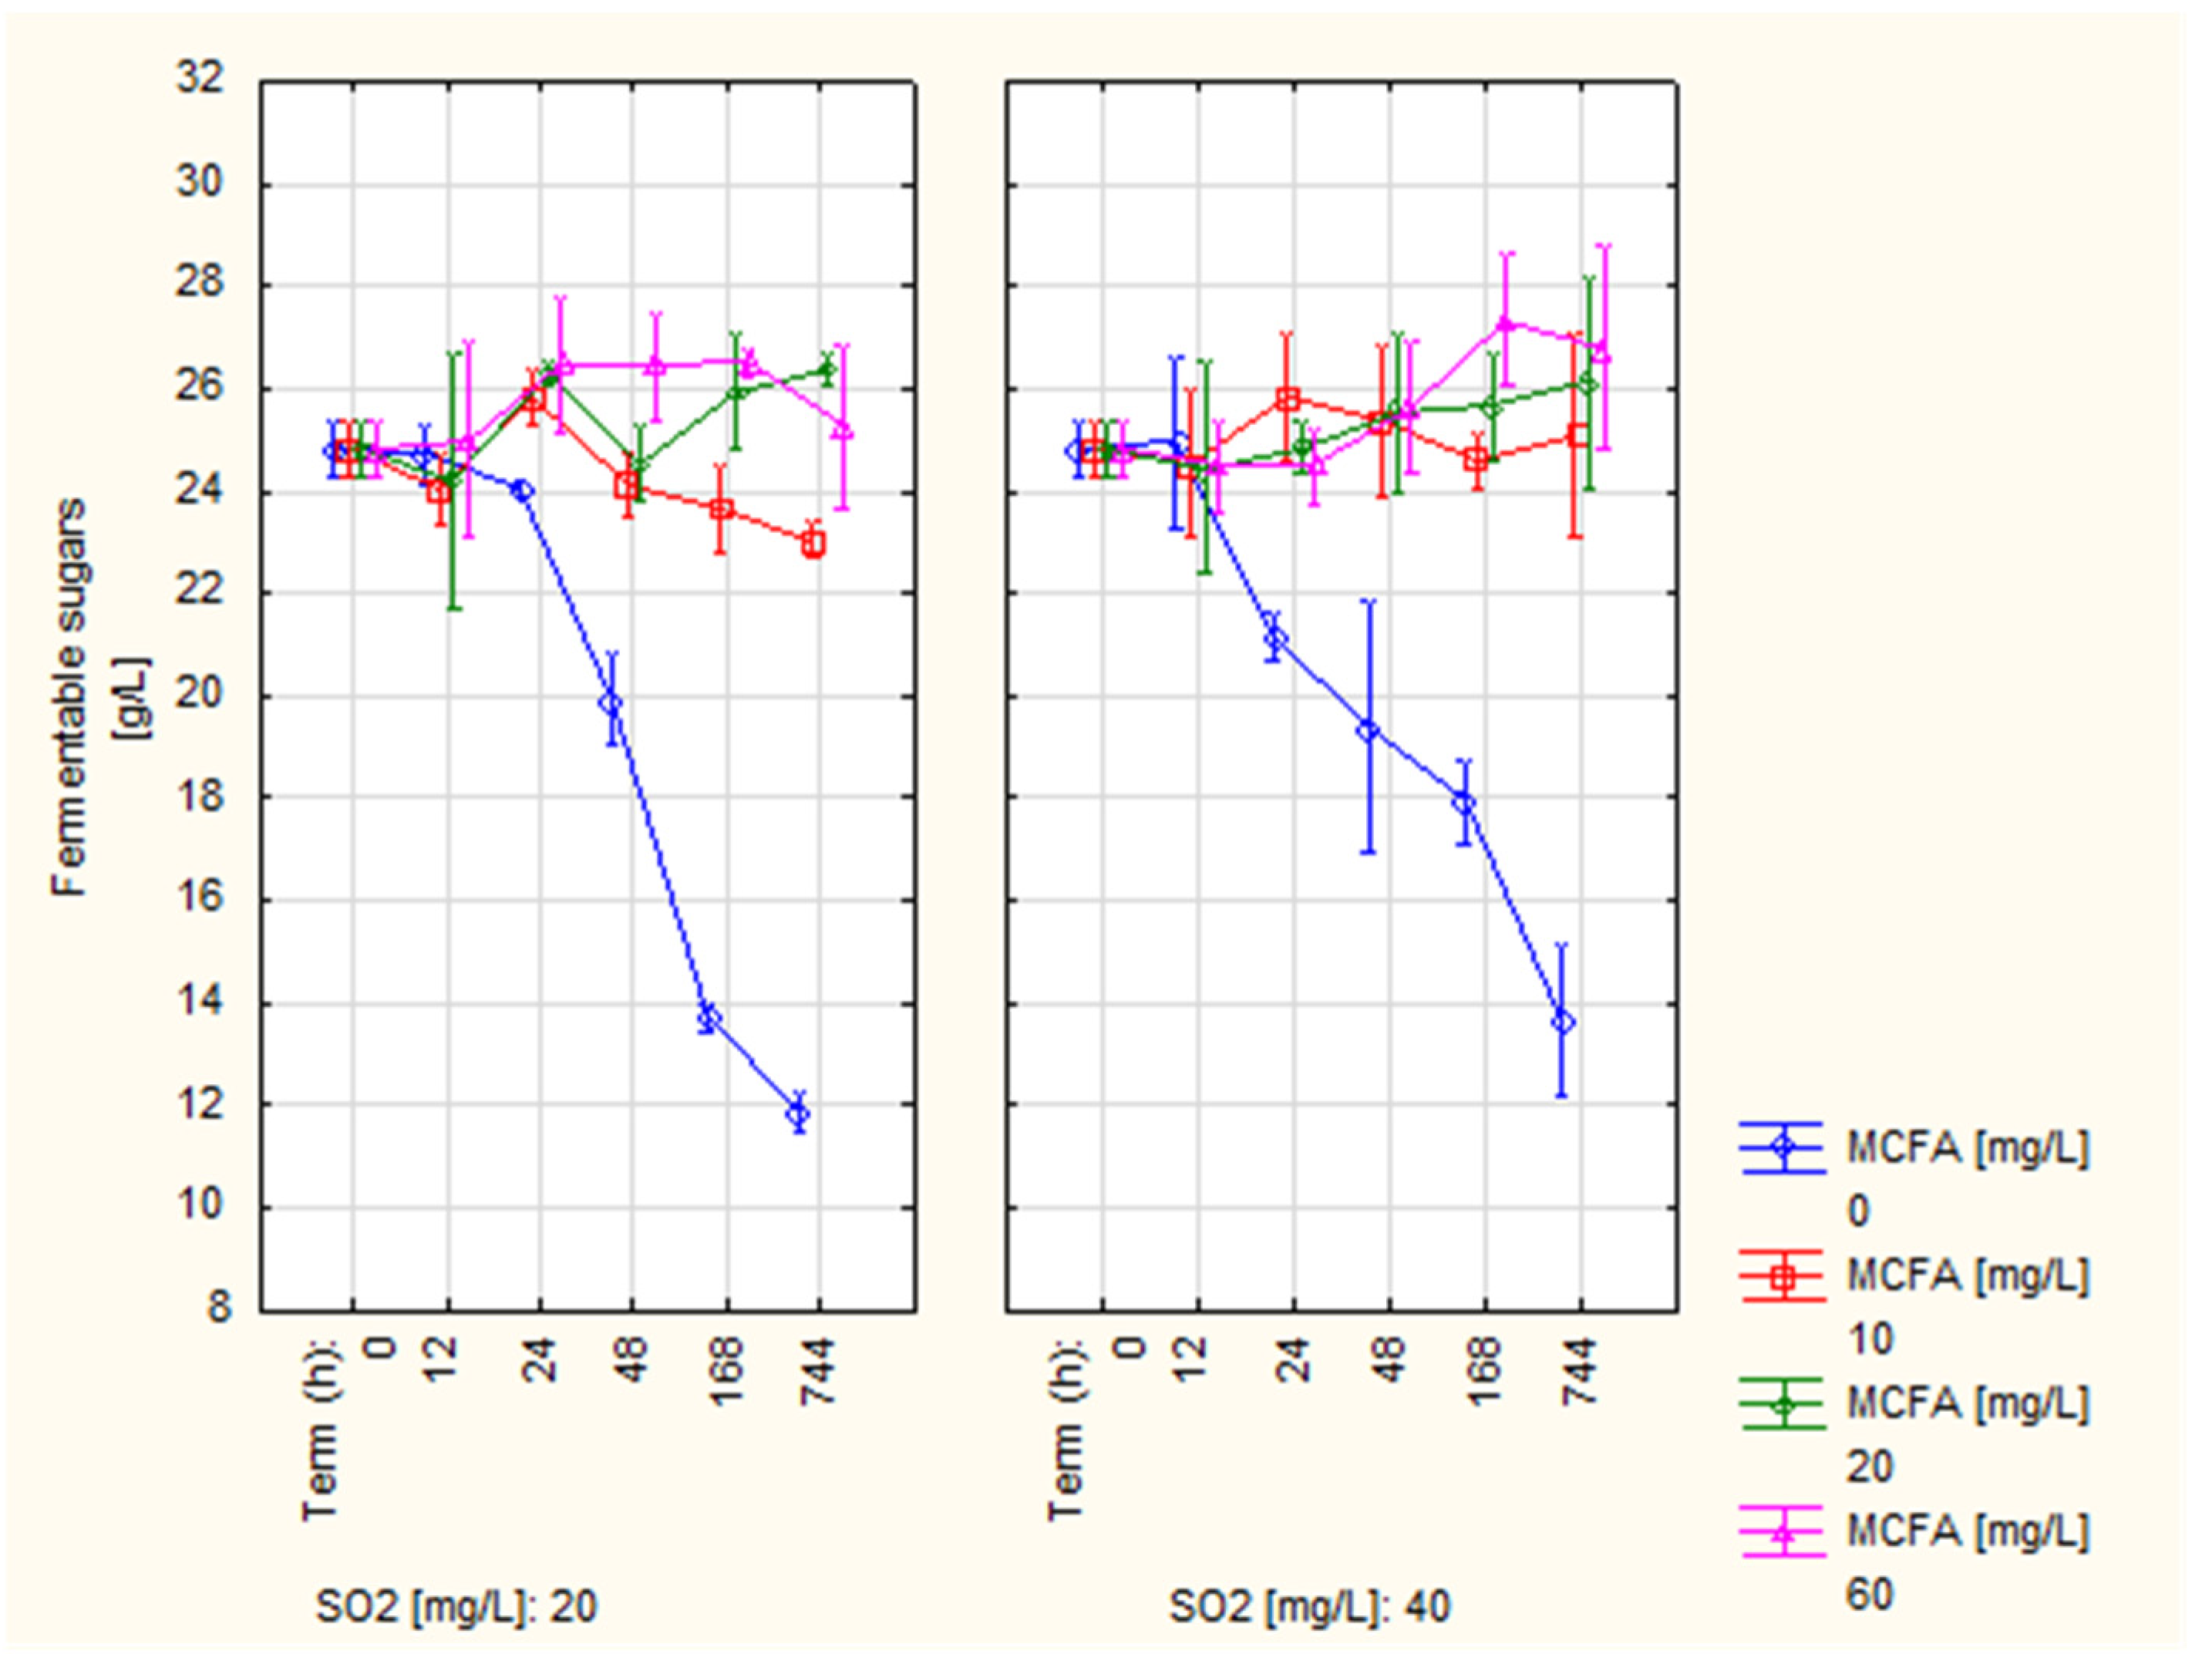
3.4. Glucose + Fructose
3.5. Sensory Analysis
4. Conclusions
Author Contributions
Funding
Institutional Review Board Statement
Informed Consent Statement
Data Availability Statement
Conflicts of Interest
Appendix A

| Octanoic Acid (mg/L) | ||||
| Dose | Term | |||
| SO2 (mg/L) | MCFA (mg/L) | 0 h | 24 h | 744 h |
| 20 | 0 | 6.53 ± 0.12 a | 6.99 ± 0.04 a | 7.71 ± 0.25 a |
| 10 | 6.53 ± 0.12 a | 7.89 ± 0.30 b | 8.18 ± 0.17 a | |
| 20 | 6.53 ± 0.12 a | 9.16 ± 0.16 c | 8.24 ± 0.08 a | |
| 60 | 6.53 ± 0.12 a | 14.27 ± 0.59 d | 11.29 ± 0.36 b | |
| p-value | 1.00 | p < 0.01 | p < 0.01 | |
| 40 | 0 | 6.53 ± 0.12 a | 6.53 ± 0.37 a | 7.62 ± 0.14 a |
| 10 | 6.53 ± 0.12 a | 7.67 ± 0.11 b | 7.81 ± 0.08 a,b | |
| 20 | 6.53 ± 0.12 a | 8.26 ± 0.14 b | 8.21 ± 0.03 b | |
| 60 | 6.53 ± 0.12 a | 13.35 ± 0.39 c | 11.84 ± 0.08 c | |
| p-value | 1.00 | p < 0.01 | p < 0.01 | |
| Decanoic Acid (mg/L) | ||||
| Dose | Term | |||
| SO2 (mg/L) | MCFA (mg/L) | 0 h | 24 h | 744 h |
| 20 | 0 | 1.61 ± 0.06 a | 1.84 ± 0.02 a | 2.30 ± 0.09 a |
| 10 | 1.61 ± 0.06 a | 2.64 ± 0.17 b | 3.21 ± 0.10 b | |
| 20 | 1.61 ± 0.06 a | 3.41 ± 0.08 c | 3.28 ± 0.06 b | |
| 60 | 1.61 ± 0.06 a | 8.73 ± 0.01 d | 5.02 ± 0.32 c | |
| p-value | 1.00 | p < 0.01 | p < 0.01 | |
| 40 | 0 | 1.61 ± 0.06 a | 1.70 ± 0.11 a | 2.28 ± 0.09 a |
| 10 | 1.61 ± 0.06 a | 2.53 ± 0.02 b | 2.93 ± 0.03 b | |
| 20 | 1.61 ± 0.06 a | 3.40 ± 0.04 c | 3.17 ± 0.05 b | |
| 60 | 1.61 ± 0.06 a | 8.95 ± 0.05 d | 5.41 ± 0.10 c | |
| p-value | 1.00 | p < 0.01 | p < 0.01 | |
| Dodecanoic Acid (µg/L) | ||||
| Dose | Term | |||
| SO2 (mg/L) | MCFA (mg/L) | 0 h | 24 h | 744 h |
| 20 | 0 | 176.08 ± 5.12 a | 175.15 ± 1.58 b | 208.30 ± 9.96 d |
| 10 | 176.08 ± 5.12 a | 123.14 ± 7.82 a | 157.32 ± 5.94 c | |
| 20 | 176.08 ± 5.12 a | 134.47 ± 5.24 a | 114.82 ± 4.09 b | |
| 60 | 176.08 ± 5.12 a | 128.73 ± 5.81 a | 79.20 ± 5.17 a | |
| p-value | 1.00 | p < 0.01 | p < 0.01 | |
| 40 | 0 | 176.08 ± 5.12 a | 133.75 ± 7.86 a | 189.99 ± 5.63 d |
| 10 | 176.08 ± 5.12 a | 138.27 ± 1.05 a | 129.89 ± 1.91 c | |
| 20 | 176.08 ± 5.12 a | 138.04 ± 4.23 a | 97.77 ± 7.59 b | |
| 60 | 176.08 ± 5.12 a | 128.92 ± 4.76 a | 68.79 ± 2.93 a | |
| p-value | 1.00 | 0.55 | p < 0.01 | |
| Fermentable Sugars (g/L) | ||||
| Dose | Term | |||
| SO2 (mg/L) | MCFA (mg/L) | 0 h | 24 h | 744 h |
| 20 | 0 | 24.82 ± 0.13 a | 24.02 ± 0.04 a | 11.86 ± 0.09 a |
| 10 | 24.82 ± 0.13 a | 25.82 ± 0.13 b | 23.05 ± 0.09 b | |
| 20 | 24.82 ± 0.13 a | 26.29 ± 0.05 b | 26.35 ± 0.07 d | |
| 60 | 24.82 ± 0.13 a | 26.46 ± 0.31 c | 25.26 ± 0.37 c | |
| p-value | 1.00 | p < 0.01 | p < 0.01 | |
| 40 | 0 | 24.82 ± 0.13 a | 21.17 ± 0.37 a | 13.65 ± 0.35 a |
| 10 | 24.82 ± 0.13 a | 25.83 ± 0.29 c | 25.09 ± 0.46 b | |
| 20 | 24.82 ± 0.13 a | 24.85 ± 0.12 b | 26.12 ± 0.48 c | |
| 60 | 24.82 ± 0.13 a | 24.49 ± 0.17 b | 26.79 ± 0.47 c | |
| p-value | 1.00 | p < 0.01 | p < 0.01 | |
References
- Santos, M.C.; Nunes, C.; Saraiva, J.A.; Coimbra, M.A. Chemical and physical methodologies for the replacement/reduction of sulfur dioxide use during winemaking: Review of their potentialities and limitations. Eur. Food Res. Technol. 2012, 234, 1–12. [Google Scholar] [CrossRef]
- Guerrero, R.; Cantos-Villar, E. Demonstrating the efficiency, of sulphur dioxide replacements in wine: A parameter review. Trends Food Sci. Technol. 2015, 42, 27–43. [Google Scholar] [CrossRef]
- Viegas, C.A.; Rosa, M.F.; Sacorreia, I.; Novais, J.M. Inhibition of yeast growth by octanoic and decanoic acids produced during ethanolic fermentation. Appl. Environ. Microbiol. 1989, 55, 21–28. [Google Scholar] [CrossRef] [Green Version]
- Taylor, G.T.; Kirsop, B.H. Origin of medium chain-length fatty-acids present in beer. J. Inst. Brew. 1977, 83, 241–243. [Google Scholar] [CrossRef]
- Restrepo, S.; Espinoza, L.; Ceballos, A.; Urtubia, A. Production of Fatty Acids during Alcoholic Wine Fermentation under Selected Temperature and Aeration Conditions. Am. J. Enol. Vitic. 2019, 70, 169–176. [Google Scholar] [CrossRef]
- Sacorreia, I. Synergistic effects of ethanol, octanoic, and decanoic acids on the kinetics and the activation parameters of thermal death in Saccharomyces bayanus. Biotechnol. Bioeng. 1986, 28, 761–763. [Google Scholar] [CrossRef]
- Pina, C.; Santos, C.; Couto, J.; Hogg, T. Ethanol tolerance of five non-Saccharomyces wine yeasts in comparison with a strain of Saccharomyces cerevisiae-influence of different culture conditions. Food Microbiol. 2004, 21, 439–447. [Google Scholar] [CrossRef]
- Sajbidor, J.; Malik, F.; Kissantalova, H. The relationship between the viability of selected dried wine yeasts and their lipid-composition and fatty-acid profile. Food Biotechnol. 1992, 6, 187–196. [Google Scholar] [CrossRef]
- Lafonlafourcade, S.; Geneix, C.; Ribereaugayon, P. Inhibition of alcoholic fermentation of grape must by fatty-acids produced by yeasts and their elimination by yeast ghosts. Appl. Environ. Microbiol. 1984, 47, 1246–1249. [Google Scholar] [CrossRef] [Green Version]
- Stevens, S.; Hofmeyr, J. Effects of ethanol, octanoic and decanoic acids on fermentation and the passive influx of protons through the plasma-membrane of Saccharomyces cerevisiae. Appl. Microbiol. Biotechnol. 1993, 38, 656–663. [Google Scholar] [CrossRef]
- Viegas, C.; Sacorreia, I. Activation of plasma-membrane atpase of Saccharomyces cerevisiae by octanoic-acid. J. Gen. Microbiol. 1991, 137, 645–651. [Google Scholar] [CrossRef] [Green Version]
- Viegas, C.A.; Almeida, P.F.; Cavaco, M.; Sa-Correia, I. The H+-ATPase in the plasma membrane of Saccharomyces cerevisiae is activated during growth latency in octanoic acid-supplemented medium accompanying the decrease in intracellular pH and cell viability. Appl. Environ. Microbiol. 1998, 64, 779–783. [Google Scholar] [CrossRef] [Green Version]
- Jenkins, T.W.; Howe, P.A.; Sacks, G.L.; Waterhouse, A.L. Determination of Molecular and “Truly” Free Sulfur Dioxide in Wine: A Comparison of Headspace and Conventional Methods. Am. J. Enol. Vitic. 2020, 71, 222–230. [Google Scholar] [CrossRef]
- Bábíková, P.; Baroň, M.; Kumšta, M.; Sotolář, R. Increasing the efficiency of sulfur dioxide in wine by using of saturated higher fatty acids. Acta Univ. Agric. Silvic. Mendel. Brun. 2012, 60, 2. [Google Scholar] [CrossRef] [Green Version]
- Horvath, B.O.; Fazekas, E.; Kellner, N.; Magyar, I. Influence of medium chain fatty acids on some botrytised wine-related yeast species and on spontaneous refermentation of Tokaj essence. Acta Aliment. 2020, 49, 339–347. [Google Scholar] [CrossRef]
- Guilloux-Benatier, M.; Le Fur, Y.; Feuillat, M. Influence of fatty acids on the growth of wine microorganisms Saccharomyces cerevisiae and Oenococcus oeni. J. Ind. Microbiol. Biotechnol. 1998, 20, 144–149. [Google Scholar] [CrossRef]
- Mendel University in Brno; Baron, M.; Kumsta, M.; Babikova, P. Composition of Saturated Fatty Acids and Its Use for Inhibition of Alcoholic or Malolactic Fermentation and Dose Reduction of Sulphur Dioxide in Wine Making Technology. European Patent EP2681301A2, 8 January 2014. Available online: https://worldwide.espacenet.com/publicationDetails/biblio?II=0&ND=3&adjacent=true&locale=en_EP&FT=D&date=20140108&CC=EP&NR=2681301A2&KC=A2# (accessed on 29 January 2022).
- Ancin, C.; Ayestaran, B.; Garcia, A.; Garrido, J. Evolution of fatty acid contents in Garnacha and Viura musts during fermentation and the aging of wine. Z. Fur Lebensm.-Unters. und-Forsch. A-Food Res. Technol. 1998, 206, 143–147. [Google Scholar] [CrossRef]
- Banita, C.D.; Antoce, A.O. Preliminary study on the inhibition of alcoholic fermentation using octanoic and decanoic acids to obtain aromatic wines with residual sugar. Sci. Pap.-Ser. B-Hortic. 2021, 65, 299–306. [Google Scholar]
- Baron, M.; Babikova, P. Saturated higher fatty acids as a means of inhibiting alcoholic fermentation and sulphur dioxide reduction in wine. Mitt. Klosterneubg. 2011, 61, 158–165. [Google Scholar]
- Lisanti, M.; Blaiotta, G.; Nioi, C.; Moio, L. Alternative Methods to SO2 for Microbiological Stabilization of Wine. Compr. Rev. Food Sci. Food Saf. 2019, 18, 455–479. [Google Scholar] [CrossRef] [Green Version]
- Licek, J.; Baron, M.; Sochor, J. Comparison of MCFA and Other Methods of Terminating Alcohol Fermentation and Their Influence on the Content of Carbonyl Compounds in Wine. Molecules 2020, 25, 5737. [Google Scholar] [CrossRef]
- Jackowetz, J.N.; de Orduna, R.M. Survey of SO2 binding carbonyls in 237 red and white table wines. Food Control 2013, 32, 687–692. [Google Scholar] [CrossRef]
- Li, H.; Tao, Y.; Wang, H.; Zhang, L. Impact odorants of Chardonnay dry white wine from Changli County (China). Eur. Food Res. Technol. 2008, 227, 287–292. [Google Scholar] [CrossRef]
- Cullere, L.; Escudero, A.; Cacho, J.; Ferreira, V. Gas chromatography-olfactometry and chemical quantitative study of the aroma of six premium quality Spanish aged red wines. J. Agric. Food Chem. 2004, 52, 1653–1660. [Google Scholar] [CrossRef]
- Bardi, L.; Cocito, C.; Marzona, M. Saccharomyces cerevisiae cell fatty acid composition and release during fermentation without aeration and in absence of exogenous lipids. Int. J. Food Microbiol. 1999, 47, 133–140. [Google Scholar] [CrossRef]
- Diaz-Maroto, M.; Schneider, R.; Baumes, R. Formation pathways of ethyl esters of branched short-chain fatty acids during wine aging. J. Agric. Food Chem. 2005, 53, 3503–3509. [Google Scholar] [CrossRef]
- Hu, K.; Jin, G.J.; Mei, W.C.; Li, T.; Tao, Y.S. Increase of medium-chain fatty acid ethyl ester content in mixed H. uvarum/S. cerevisiae fermentation leads to wine fruity aroma enhancement. Food Chem. 2018, 239, 495–501. [Google Scholar] [CrossRef]
- Larue, F.; Geneix, C.; Lafon-Lafourcade, S.; Bertrand, A.; Ribéreau-Gayon, P. Premières observations sur le mode d’action des écorces de levure. OENO One 1984, 18, 155–163. [Google Scholar] [CrossRef]
- Baron, M.; Kumsta, M.; Prokes, K.; Tomaskova, L.; Tomkova, M. The inhibition of Saccharomyces cerevisiae population during alcoholic fermentation of grape must by octanoic, decanoic and dodecanoic acid mixture. In Proceedings of the 40th World Congress of Vine and Wine, Sofia, Bulgaria, 29 May–2 June 2017. [Google Scholar]
- San Juan, F.; Cacho, J.; Ferreira, V.; Escudero, A. Aroma Chemical Composition of Red Wines from Different Price Categories and Its Relationship to Quality. J. Agric. Food Chem. 2012, 60, 5045–5056. [Google Scholar] [CrossRef]
- Lee, S.; Noble, A. Characterization of odor-active compounds in Californian Chardonnay wines using GC-olfactometry and GC-mass spectrometry. J. Agric. Food Chem. 2003, 51, 8036–8044. [Google Scholar] [CrossRef]
- Lukic, I.; Plavsa, T.; Sladonja, B.; Radeka, S.; Persuric, D. Aroma compounds as markers of wine quality in the case of Malvazija Istarska young wine. J. Food Qual. 2008, 31, 717–735. [Google Scholar] [CrossRef]
- Shinohara, T. Gas-chromatographic analysis of volatile fatty-acids in wines. Agric. Biol. Chem. 1985, 49, 2211–2212. [Google Scholar] [CrossRef]
- Baron, M.; Fiala, J. Chasing after Minerality, Relationship to Yeast Nutritional Stress and Succinic Acid Production. Czech J. Food Sci. 2012, 30, 188–193. [Google Scholar] [CrossRef] [Green Version]
- Guth, H. Quantitation and sensory studies of character impact odorants of different white wine varieties. J. Agric. Food Chem. 1997, 45, 3027–3032. [Google Scholar] [CrossRef]
- Legras, J.; Erny, C.; Le Jeune, C.; Lollier, M.; Adolphe, Y.; Demuyter, C.; Delobel, P.; Blondin, B.; Karst, F. Activation of Two Different Resistance Mechanisms in Saccharomyces cerevisiae upon Exposure to Octanoic and Decanoic Acids. Appl. Environ. Microbiol. 2010, 76, 7526–7535. [Google Scholar] [CrossRef] [PubMed] [Green Version]
- Ribéreau-Gayon, P.; Dubourdieu, D.; Donéche, B.; Lonvaud, A. Handbook of Enology, Volume 1. The Microbiology of Wine and Vinifications, 2nd ed.; Wiley: Chichester, UK, 2006. [Google Scholar] [CrossRef]
| Dose | Term | ||
|---|---|---|---|
| SO2 (mg/L) | MCFA (mg/L) | 24 h | 744 h |
| 20 | 0 | 3.50 ± 0.76 a | 2.50 ± 0.56 a |
| 10 | 4.33 ± 1.38 a,b | 2.50 ± 0.34 a | |
| 20 | 2.67 ± 0.76 a | 2.83 ± 0.48 a | |
| 60 | 6.83 ± 1.08 b | 4.83 ± 0.54 b | |
| p-value | 0.01 | p < 0.01 | |
| 40 | 0 | 3.00 ± 0.86 a | 3.67 ± 0.67 a,b |
| 10 | 2.67 ± 0.49 a | 2.67 ± 0.67 a | |
| 20 | 5.00 ± 0.82 a | 2.17 ± 0.48 a | |
| 60 | 4.50 ± 1.06 a | 5.33 ± 1.12 b | |
| p-value | 0.02 | 0.20 | |
Publisher’s Note: MDPI stays neutral with regard to jurisdictional claims in published maps and institutional affiliations. |
© 2022 by the authors. Licensee MDPI, Basel, Switzerland. This article is an open access article distributed under the terms and conditions of the Creative Commons Attribution (CC BY) license (https://creativecommons.org/licenses/by/4.0/).
Share and Cite
Licek, J.; Baron, M.; Sochor, J.; Kumsta, M.; Mlcek, J. Observation of Residues Content after Application of a Medium-Chain Fatty Acids Mixture at the End of Alcoholic Fermentation. Fermentation 2022, 8, 105. https://doi.org/10.3390/fermentation8030105
Licek J, Baron M, Sochor J, Kumsta M, Mlcek J. Observation of Residues Content after Application of a Medium-Chain Fatty Acids Mixture at the End of Alcoholic Fermentation. Fermentation. 2022; 8(3):105. https://doi.org/10.3390/fermentation8030105
Chicago/Turabian StyleLicek, Josef, Mojmir Baron, Jiri Sochor, Michal Kumsta, and Jiri Mlcek. 2022. "Observation of Residues Content after Application of a Medium-Chain Fatty Acids Mixture at the End of Alcoholic Fermentation" Fermentation 8, no. 3: 105. https://doi.org/10.3390/fermentation8030105
APA StyleLicek, J., Baron, M., Sochor, J., Kumsta, M., & Mlcek, J. (2022). Observation of Residues Content after Application of a Medium-Chain Fatty Acids Mixture at the End of Alcoholic Fermentation. Fermentation, 8(3), 105. https://doi.org/10.3390/fermentation8030105