Article

Effect of Metschnikowia pulcherrima on Saccharomyces cerevisiae PDH By-Pass in MixedFermentation with Varied Sugar Concentrations of Synthetic Grape Juice and Inoculation Ratios

1
Shandong Engineering Technology Research Centre of Viticulture and Grape Intensive Processing, Winegrape and Wine Technological Innovation Center of Shandong Province, Shandong Academy of Grape, Jinan 250100, China
2
School of Bioengineering, Qilu University of Technology (Shandong Academy of Sciences), Jinan 250353, China
*
Authors to whom correspondence should be addressed.
Fermentation 2022, 8(10), 480; https://doi.org/10.3390/fermentation8100480
Submission received: 11 August 2022 / Revised: 19 September 2022 / Accepted: 20 September 2022 / Published: 23 September 2022
(This article belongs to the Section Fermentation for Food and Beverages)

Abstract

:
The effects of Metschnikowia pulcherrima and high glucose osmolality on S. cerevisiae pyruvate dehydrogenase pathway (PDH) by-pass were examined by varying the starting sugar concentration of synthetic grape juice and the inoculation ratio of S. cerevisiae to M. pulcherrima. The findings revealed that M. pulcherrima and osmolarity impacted S. cerevisiae’s PDH by-pass. The inoculation concentration of M. pulcherrima significantly affected pyruvate decarboxylase (PDC) activity and acs2 expression when the initial sugar concentration was 200 g L−1 and 290 g L−1. The osmolarity caused by the initial sugar (380 g L−1) significantly influenced the enzymatic activity of S. cerevisiae, which decreased PDC and acetaldehyde dehydrogenase (ALD) activities while increasing Acetyl-CoA synthetase (ACS) activity. The reduction in acetic acid in the wine was caused by M. pulcherrima altering the initial sugar concentration faced by S. cerevisiae, which in turn affected enzymatic activity. The alteration of enzyme activity and accumulation of primary metabolites revealed why mixed fermentation could reduce the acetic acid content in wine by altering the enzymatic activity and affecting the expression of several key genes. The M. pulcherrima inoculation levels had no significant effect on the acetic acid and glycerol concentration in the same fermentation medium.

1. Introduction

Acetic acid, as a by-product of wine fermentation, is the primary component of volatile acid, mainly formed at the beginning of alcohol fermentation [1,2]. The acetic acid concentration can affect the quality and flavor of the wine. Generally, it is 0.2 g L−1–0.6 g L−1 in wine, and due to the higher initial sugar, ice wine possessesa higher acetic acid concentration to reach 1.2 g L−1 [3]. High levels of volatile acid (acetic acid concentration >0.9 g L−1) will cause the wine to have a very irritating and unpleasant taste to be defined as good quality [4]. Moreover, high levels of acetic acid hinder the normal fermentation of wine and are toxic to yeast cells [1]. Acetic acid molecules diffuse into the yeast cells through simple diffusion, and dissociation of the acetic acid molecules occurs inside the yeast cell due to pH variation. This situation leads to acidification in the cell, which then reduces the physiological activity of yeast cells and affects the normal fermentation operation [5].
Factors that determine the acetic acid concentration in wine include the initial sugar concentration of grape juice, the content of nitrogen sources in grape juice [6,7,8], the composition of grape juice [9], the temperature of the fermentation environment [10,11], and the selected yeast strain [3,12,13,14,15].
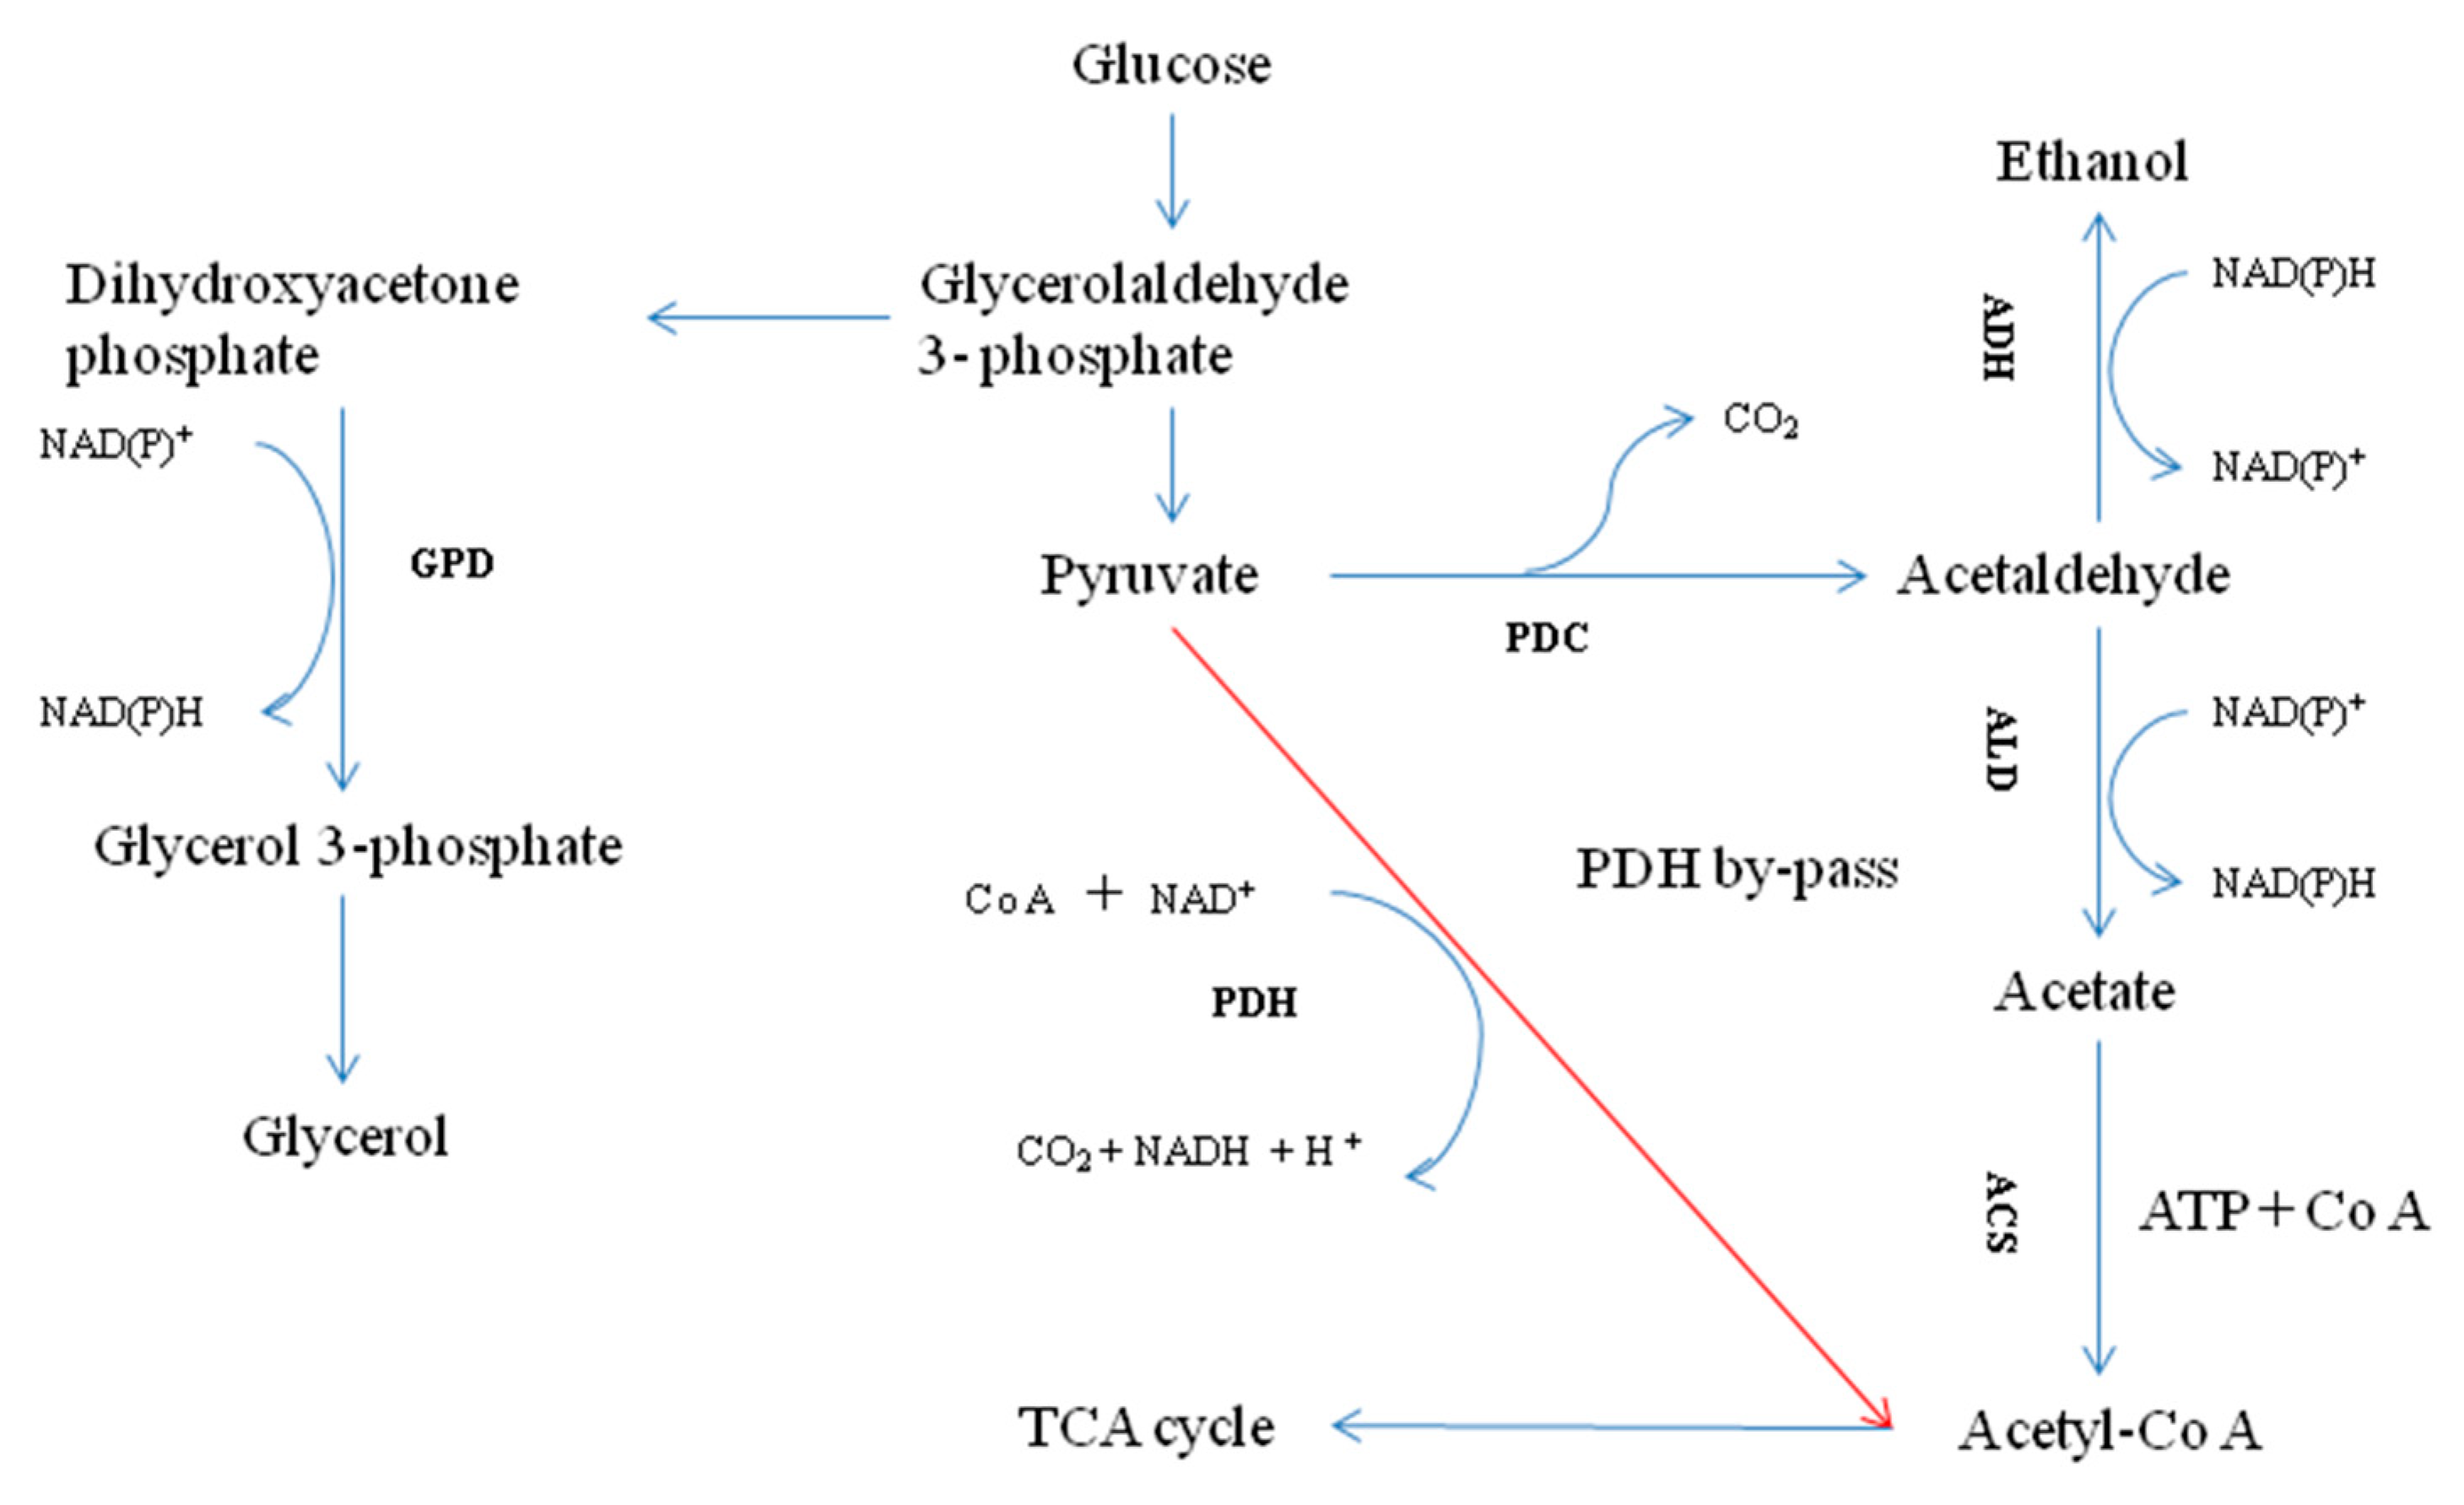
In wine fermentation, the main way for yeast cells to produce acetic acid is through the pyruvate dehydrogenase pathway (PDH) by-pass [16,17]. S. cerevisiae is a facultative anaerobic microorganism. Yeast cells produce acetyl-CoA at sufficient oxygen levels in the fermentation environment through the PDH pathway to ensure normal physiological activities. However, the PDH pathway in yeast cells is inhibited when the oxygen content is low or in an anaerobic environment [4], mainly because the activity of pyruvate dehydrogenase is significantly affected by the content of dissolved oxygen [18,19]. After reaching microaerobic or anaerobic conditions, yeast cells deviate from the PDH pathway, maintain normal physiological activities, and convert pyruvate from glycolysis into acetaldehyde via pyruvate decarboxylase, which is further converted to acetate by acetaldehyde dehydrogenase (ALD), and finally, acetyl-CoA produced by acetyl-CoA synthetase(ACS). Hence, the above process is referred to as PDH by-pass.
Pyruvate decarboxylates to acetaldehydeand carbon dioxide using pyruvate decarboxylase (PDC). In S. cerevisiae, PDC is encoded by three structural genes, pdc1, pdc5, and pdc6, which encode PDC1, PDC5, and PDC6 isoforms, respectively [20,21]. PDC1 and PDC5 possess 88% similarity [20]. PDC1 is the predominant isoenzyme form of PDC and performs 80%–90% of cell activity. The acetaldehyde produced by pyruvate decarboxylation is converted into acetic acid by acetaldehyde dehydrogenase (ALD). ALD6 is the prominent ALD present in the cytoplasm. ALD6 utilizes NADP+ coenzyme, activated by Mg2+, and is not glucose-repressed [22,23,24]. Numerous studies have stated that cytosolic ALD is responsible for forming acetate from glucose and that mitochondrial enzymes are involved during the growth of ethanol or glycerol as carbon sources [25,26]. Acetyl-CoA synthetase (ACS) catalyzes the formation of acetyl-CoA from acetate. S. cerevisiae contains two structural genes, acs1 and acs2, each encoding an active ACS [27]. ACS is an essential enzyme in S. cerevisiae. Disruption of both acs1 and acs2 genes is lethal [28].
Initially, it was thought that non-S. cerevisiae was a type of microorganism harmful to wine production. However, people have acquired a new understanding of non-S. cerevisiae in recent decades due to in-depth research on non-S. cerevisiae. They can produce various enzymes and have a better ester-producing ability than S. cerevisiae during fermentation [29,30]. Therefore, the application of non-S. cerevisiae in wine production has been widely acknowledged. The co-fermentation of non-S. cerevisiae and S. cerevisiae has greatly helped in improving traditional wine fermentation technology. There are two methods of inoculation for co-fermentation: simultaneous inoculation and sequential inoculation. Numerous studies have shown that the sequential inoculation method can reduce the acetic acid and alcohol content in wine and increase the content of esters in wine, which significantly affect wine quality and improvement [31,32,33,34,35].
Since sequential inoculation fermentation can reduce the acetic acid content in wine, it implies that the participation of non-S. cerevisiae impacts the PDH by-pass. Therefore, this study aimed to explore the effect of different inoculation conditions and concentrations of non-S. cerevisiae on the PDH by-pass to provide a theoretical reference for the interaction between yeasts in a mixed fermentation system.

2. Materials and Method

2.1. Yeast Strain

The two strains used in this study are commercial S. cerevisiae CY3079 (Jietu Co., Ltd., Shanghai, China) and M. pulcherrima MP3007 (accession number: CGMCC no. 16078), which were previously isolated from the vineyard of the Xinjiang wine grape region.

2.2. Media

Synthetic grape juice medium (100 g L−1 glucose, 100 g L−1 fructose, 3.0 g L−1 tartaric acid, 0.3 g L−1 citric acid, and 0.3 g L−1 malic acid) M4241D (Tuopu Bio-engineering Co., Ltd.) was used as a must in the fermentation process. It was filtered through a 0.22 μL filter membrane to prevent bacteria, added with one S4109 (fatty acid solution) per liter of solution, and adjusted pH to 5.8. Sucrose was used to increase the sugar concentration of must to three different initial sugar concentrations of 200 g L−1, 290 g L−1, and 380 g L−1.
M. pulcherrima MP3007 stored in yeast peptone dextrose medium (10 g L−1 yeast extract, 20 g L−1 glucose, 20 g L−1 peptone, and 20 g L−1 agar) solid medium at 4 °C was activated every six months by yeast extract peptone dextrose medium(YEPD) before inoculation. The hemocytometer counting method was used to determine the strain concentration of MP3007 in YPED (10 g L−1 yeast extract, 20 g L−1 glucose, and 20 g L−1 peptone) liquid medium, and then the required inoculation volume was calculated following the formula below:
c (strain concentration) = N (number of strain counted)/80 × 400 × Dilution times × 104
N (total amount of strain) = c (purpose inoculation concentration) × V (volume of must)
V (volume for inoculation) = N (total amount of strain to be inoculation)/c (strain concentration)
During cp-culture, WL solid medium was used to count the dynamic changes of S. cerevisiae CY3079 and M. pulcherrima MP3007.

2.3. Fermentation Conditions and Sampling

Fermentations were performed for S. cerevisiae CY3079 in pure culture and M. pulcherrima MP3007/S. cerevisiae CY3079 in mixed cultures.

2.4. Pure Cultures

Pure cultures were conducted in 250 mL Erlenmeyer flasks containing 200 mL must and sealed with bottle sealing film. Yeast strain was first inoculated into YEPD liquid medium, shake-cultured at 30 °C, 160 r·min−1 for 24 h, and then inoculated into three different initial sugar concentration musts at a concentration of 106 cells mL−1. Each experimental fermentation was performed in triplicate at 20 °C without shaking. Product accumulation and yeast growth were monitored throughout the fermentation process using high-performance liquid chromatography (HPLC) and viable cell count via WL solid medium, respectively.

2.5. Co-Cultures

Co-cultures were conducted in 250 mL Erlenmeyer flasks containing 200 mL must as pure cultures. M. pulcherrima MP3007 and S. cerevisiae CY3079 were inoculated into a YPED liquid medium, shake-cultured at 30 °C, 160 r min−1 for 24 h, then sequentially inoculated at the ratio of 1:1 and 10:1, respectively. M. pulcherrima MP3007 was first inoculated into the fermentation vessel with different initial sugar concentrations according to the inoculation amount of 106 cells mL−1 and 107 cells mL−1, respectively. After M. pulcherrima MP3007 was inoculated into three different initial sugar concentration musts for 48 h, CY3079 was introduced at 106 cells mL−1. Each experimental fermentation was performed in triplicate at 20 °C without shaking. Product accumulation and yeast growth were monitored throughout the fermentation process using HPLC and viable cell count via WL solid medium, respectively.

2.6. Sampling

The time when CY3079 was inoculated into musts was regarded as the start of sampling for determining residual sugar, acetic acid, glycerol, ethanol, and RNA extraction. The time when CY3079 was inoculated into the fermentation must be taken as the zero point, and samples were taken on day one, day three, day five, day nine, and day 13 after CY3079 inoculation. Then, samples were centrifuged at 3000× g for five minutes at 4 °C. The supernatant was filtered via a 0.22 μmol filter membrane. Then, a syringe was used to inject the collected filtrate into the sample bottle to detect residual sugar, acetic acid, glycerol, and ethanol. The remaining yeast pellet was used to detect RNA extraction.

2.7. Enological Parameter Analysis

The samples’ glucose, fructose, glycerol, acetic acid, and ethanol were quantified using HPLC 1200 series (Agilent Technologies, Santa Clara, CA, USA) with a Hi-Plex H column (300 mm × 7.7 mm, Agilent Technologies, Santa Clara, CA, USA). Sulfuric acids of 9 mmol were used as the mobile phase. Glycerol, ethanol, and acetic acid were detected using a refractive index detector (Agilent Technologies, Santa Clara, CA, USA), and the column was maintained at 65 °C.

2.8. Enzyme Activity Analysis

PDC activity determination principle: PDC catalyzes pyruvate decarboxylase to generate acetaldehyde, and alcohol dehydrogenase (ADH) is added to further catalyze nicotinamide adenine denucleotide reduced form (NADH) to reduce acetaldehyde, generating ethanol and NAD+; NADH has an absorption peak at 340 nm, while NAD+ does not. This way, PDC activity can be calculated by measuring the rate of decrease in light absorption at 340 nm. Thaw the sample completely in an environment of 4 °C, then centrifuge at 3000 r min−1 for two minutes to enrich the cells, discard the supernatant, and use five million cells for the experiment according to the recommended dosage of the PDC activity assay kit (Comin, Suzhou, China). The cells were disrupted in an ultrasonic environment, centrifuged again after disruption at 16,000× g at 4 °C for 20 min, and the supernatant after centrifugation was placed on ice for testing. After the spectrophotometer is turned on and preheated for 30 min, adjust the wavelength to 340 nm, use distilled water as a blank to zero; mix the reagents in the kit and compare the color at 340 nm, and record the absorbance at the 15 s and 75 s. The PDC activity is defined as catalyzing the oxidation of 1 nmol NADH to 1 unit of enzyme activity every 106 cell minutes at 25 °C. PDC (nmol/min/106 cell) = (△A/з/d × Vtotal × 109)/(cell number × Vsample/Vtotal)/T = 1608 × △A/cell number. The ALD extraction method was the same as PDC, except that an ice bath was required to break the cells (Comin, Suzhou, China). The enzyme activity of acetaldehyde dehydrogenase is defined as the amount of enzyme that catalyzes the reduction of 1 nmol NAD+ per minute per 106 cells as 1 unit of enzyme activity. ALDH enzyme activity (nmol/min/106 cell) = △A/(з × d) × Vtotal/(Vsample/Vtotal × cell number)/T = 322 × △A/cell number. The ALD extraction method was the same as PDC, except that an ice bath was required to break the cells (Comin, Suzhou, China).

2.9. Quantitative Real-Time PCR

After the sample was thawed at 4 °C, the yeast cells were collected via centrifugation at 1000× g for five minutes. Before RNA extraction, following the instructions of the R6870 Yeast RNA Kit (Solarbio, Beijing, China), we made some changes in cell disruption. First, we added 500 microliters of the enriched cells, centrifuged again after liters of distilled water, discarded the supernatant, and repeated it twice. Add the extraction buffer in the kit to the yeast cells enriched after washing twice, incubate in a constant temperature biochemical incubator at 30 °C for 40 min, and mix upside down every five minutes; after 40 min, place it in a bead mill for cell disruption for three minutes, and then perform RNA extraction according to the remaining operations of the RNA extraction kit. Reverse transcription: The reverse transcription reaction system used in this experiment was 20 μL. According to the concentration of the extracted RNA, the sample volume is 7 μL, and the remaining volume is added according to the sample volume in the kit instructions. After adding the sample, pipette it severally for mixing, and then perform reverse transcription in the program set by the thermal gene cycler. The procedure is as follows: heat the lid at 105 °C, incubate at 65 °C for five minutes, maintain it at 42 °C for 15 min, and then increase the temperature to 85 °C for five seconds. RT-qPCR: The primers used for RT-qPCR were synthesized by Shanghai Shenggong Co. Ltd. For the gene sequences of the target and reference genes used, please refer to Table 1. The pgk1 gene is used as a housekeeping gene, and some researchers have proved that it has an excellent effect as a housekeeping gene during fermentation [36,37]. Noteworthy, the sequences of the primers in Table 1 have been searched by NCBI, and it was found that they have only been reported in S. cerevisiae and have not been recorded in M. pulcherrima. Therefore, the results of subsequent tests can be deemed only for S. cerevisiae. Add the relevant reagents in the fluorescence quantification kit (TransGen Biotech, Beijing, China) to the sample after reverse transcription, and perform operations, such as sample addition, according to the instructions for use.

2.10. Statistical Analysis

Metabolite concentrations were subjected to a one-way analysis of variance (ANOVA) followed by a Tukey’s (HSD) post hoc test (confidence interval 95%) to test for significant differences between the wines.

3. Results

3.1. Fermentation Behavior of Pure and Sequential Cultures

Yeast growth dynamics during fermentation with different initial sugar concentrations were monitored for pure and sequential cultures (Figure 1). After CY3079 inoculation into the fermentation environment, the maximum yeast concentration in the pure fermentation (CK) group was greater than that in the mixed fermentation group at the same time point. Additionally, the MP3007 concentration showed a gradual decrease as CY3079 was inoculated, and the CY3079 concentration decreased on the third day after inoculation and then showed an increasing trend; however, this phenomenon only appeared in Figure 1B,C. As the fermentation progresses, the MP3007 concentration will gradually decrease, and the survival time of MP3007 will increase simultaneously with the increase in the initial sugar concentration as well as inoculation concentration.
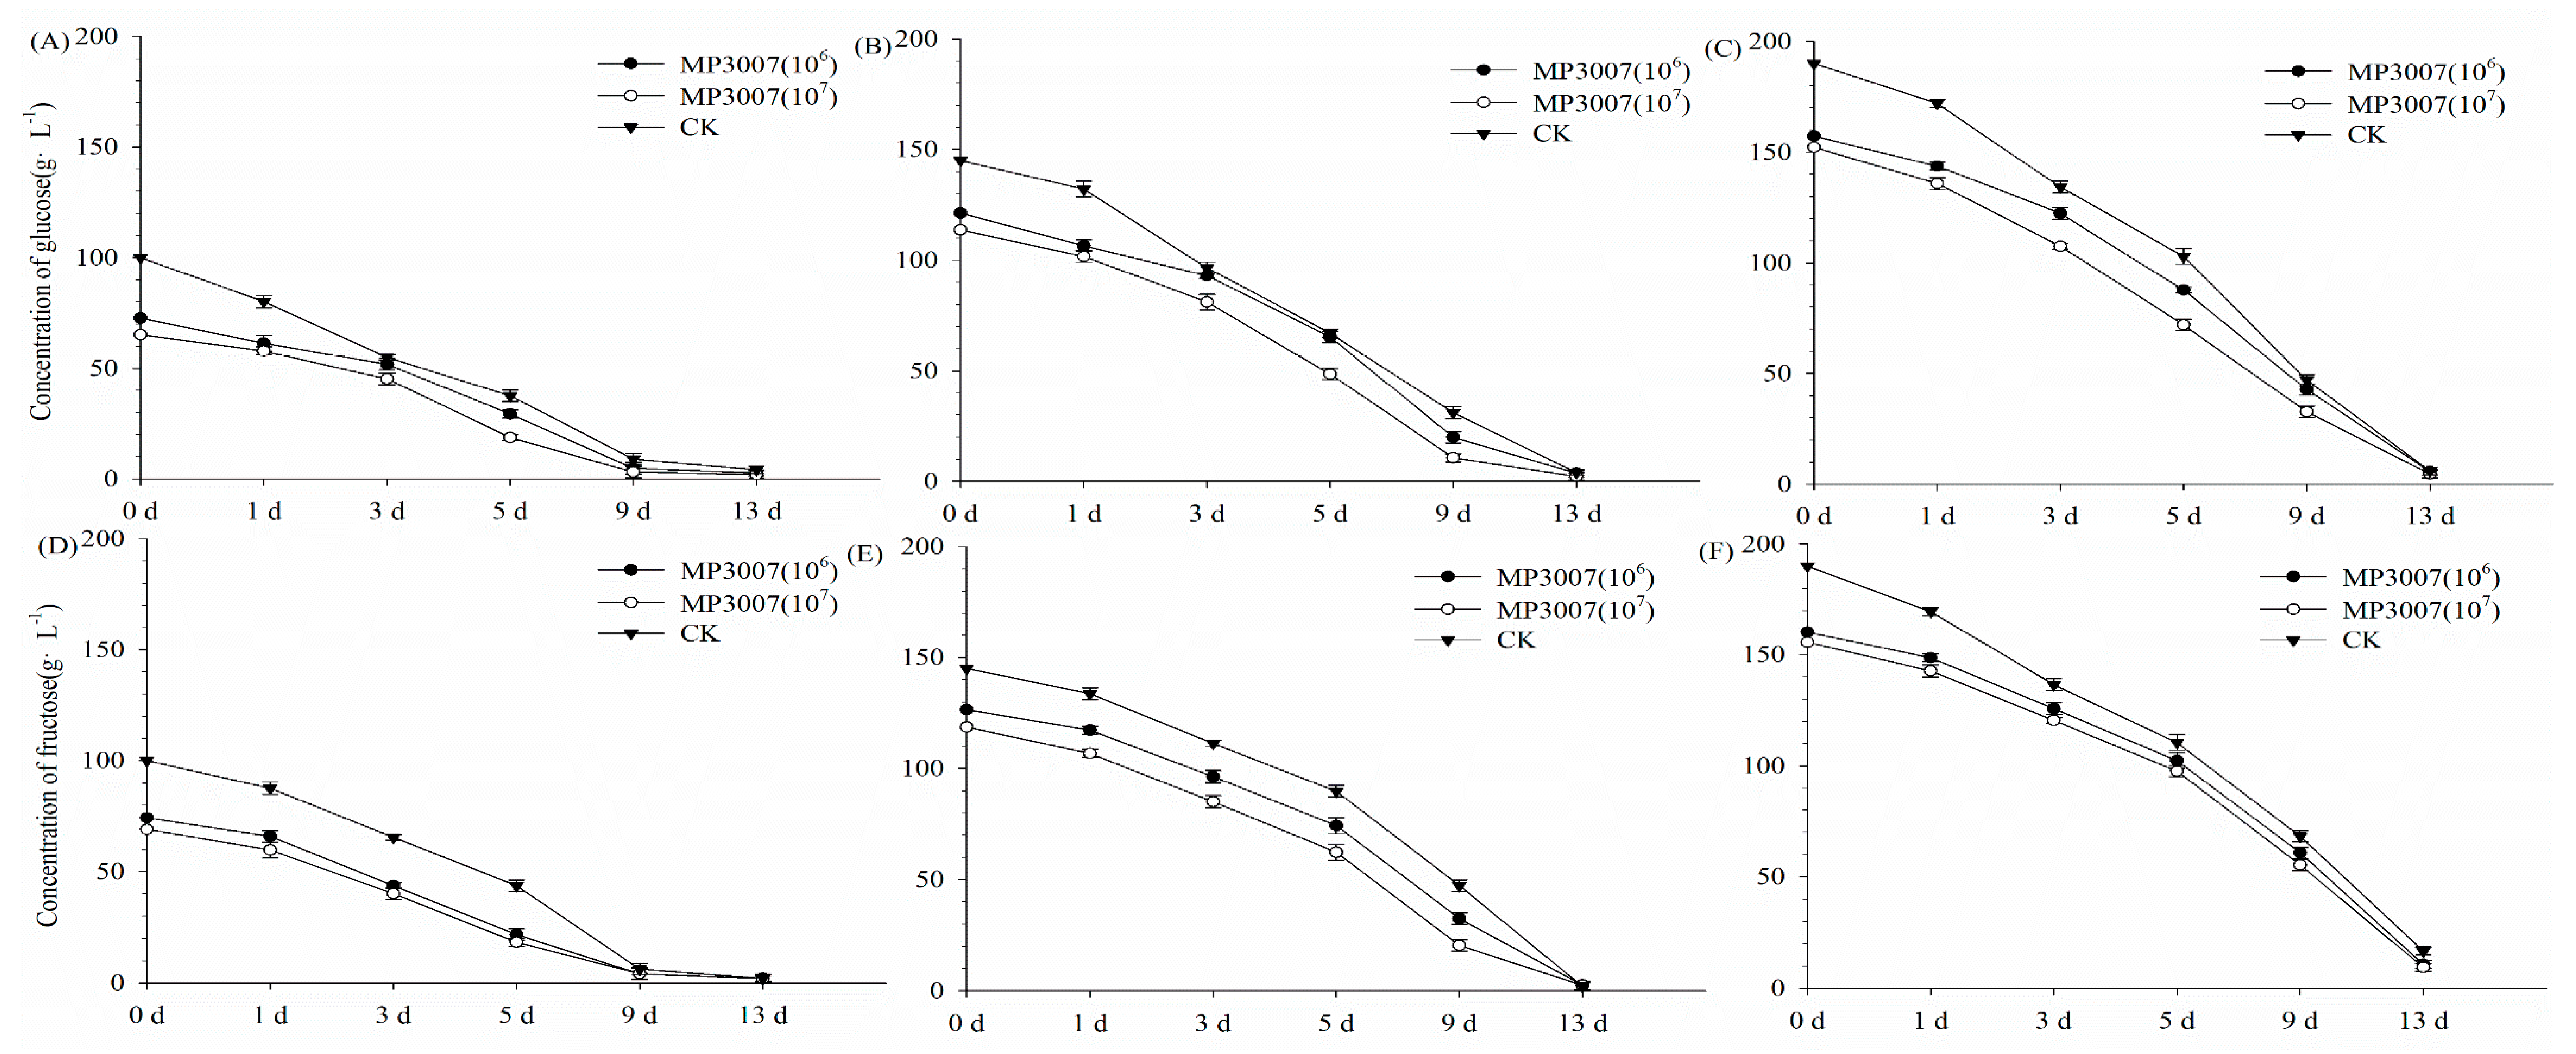
The sugar consumption capacity of the variable group significantly differed from that of the CK group (Figure 2). Based on the sugar content of 0 d, it can be inferred that MP3007 indiscriminate in the absorption of glucose and fructose. However, it can be observed that the glucose consumption rate is faster than that of fructose at the later time points. Additionally, according to the slope of the line segment, it can be inferred that the glucose consumption rate in the CK group is faster than that in the experimental group, especially on 1 d and 3 d.

3.2. Metabolite Concentration in the Pure and Mixed Fermentation Processes

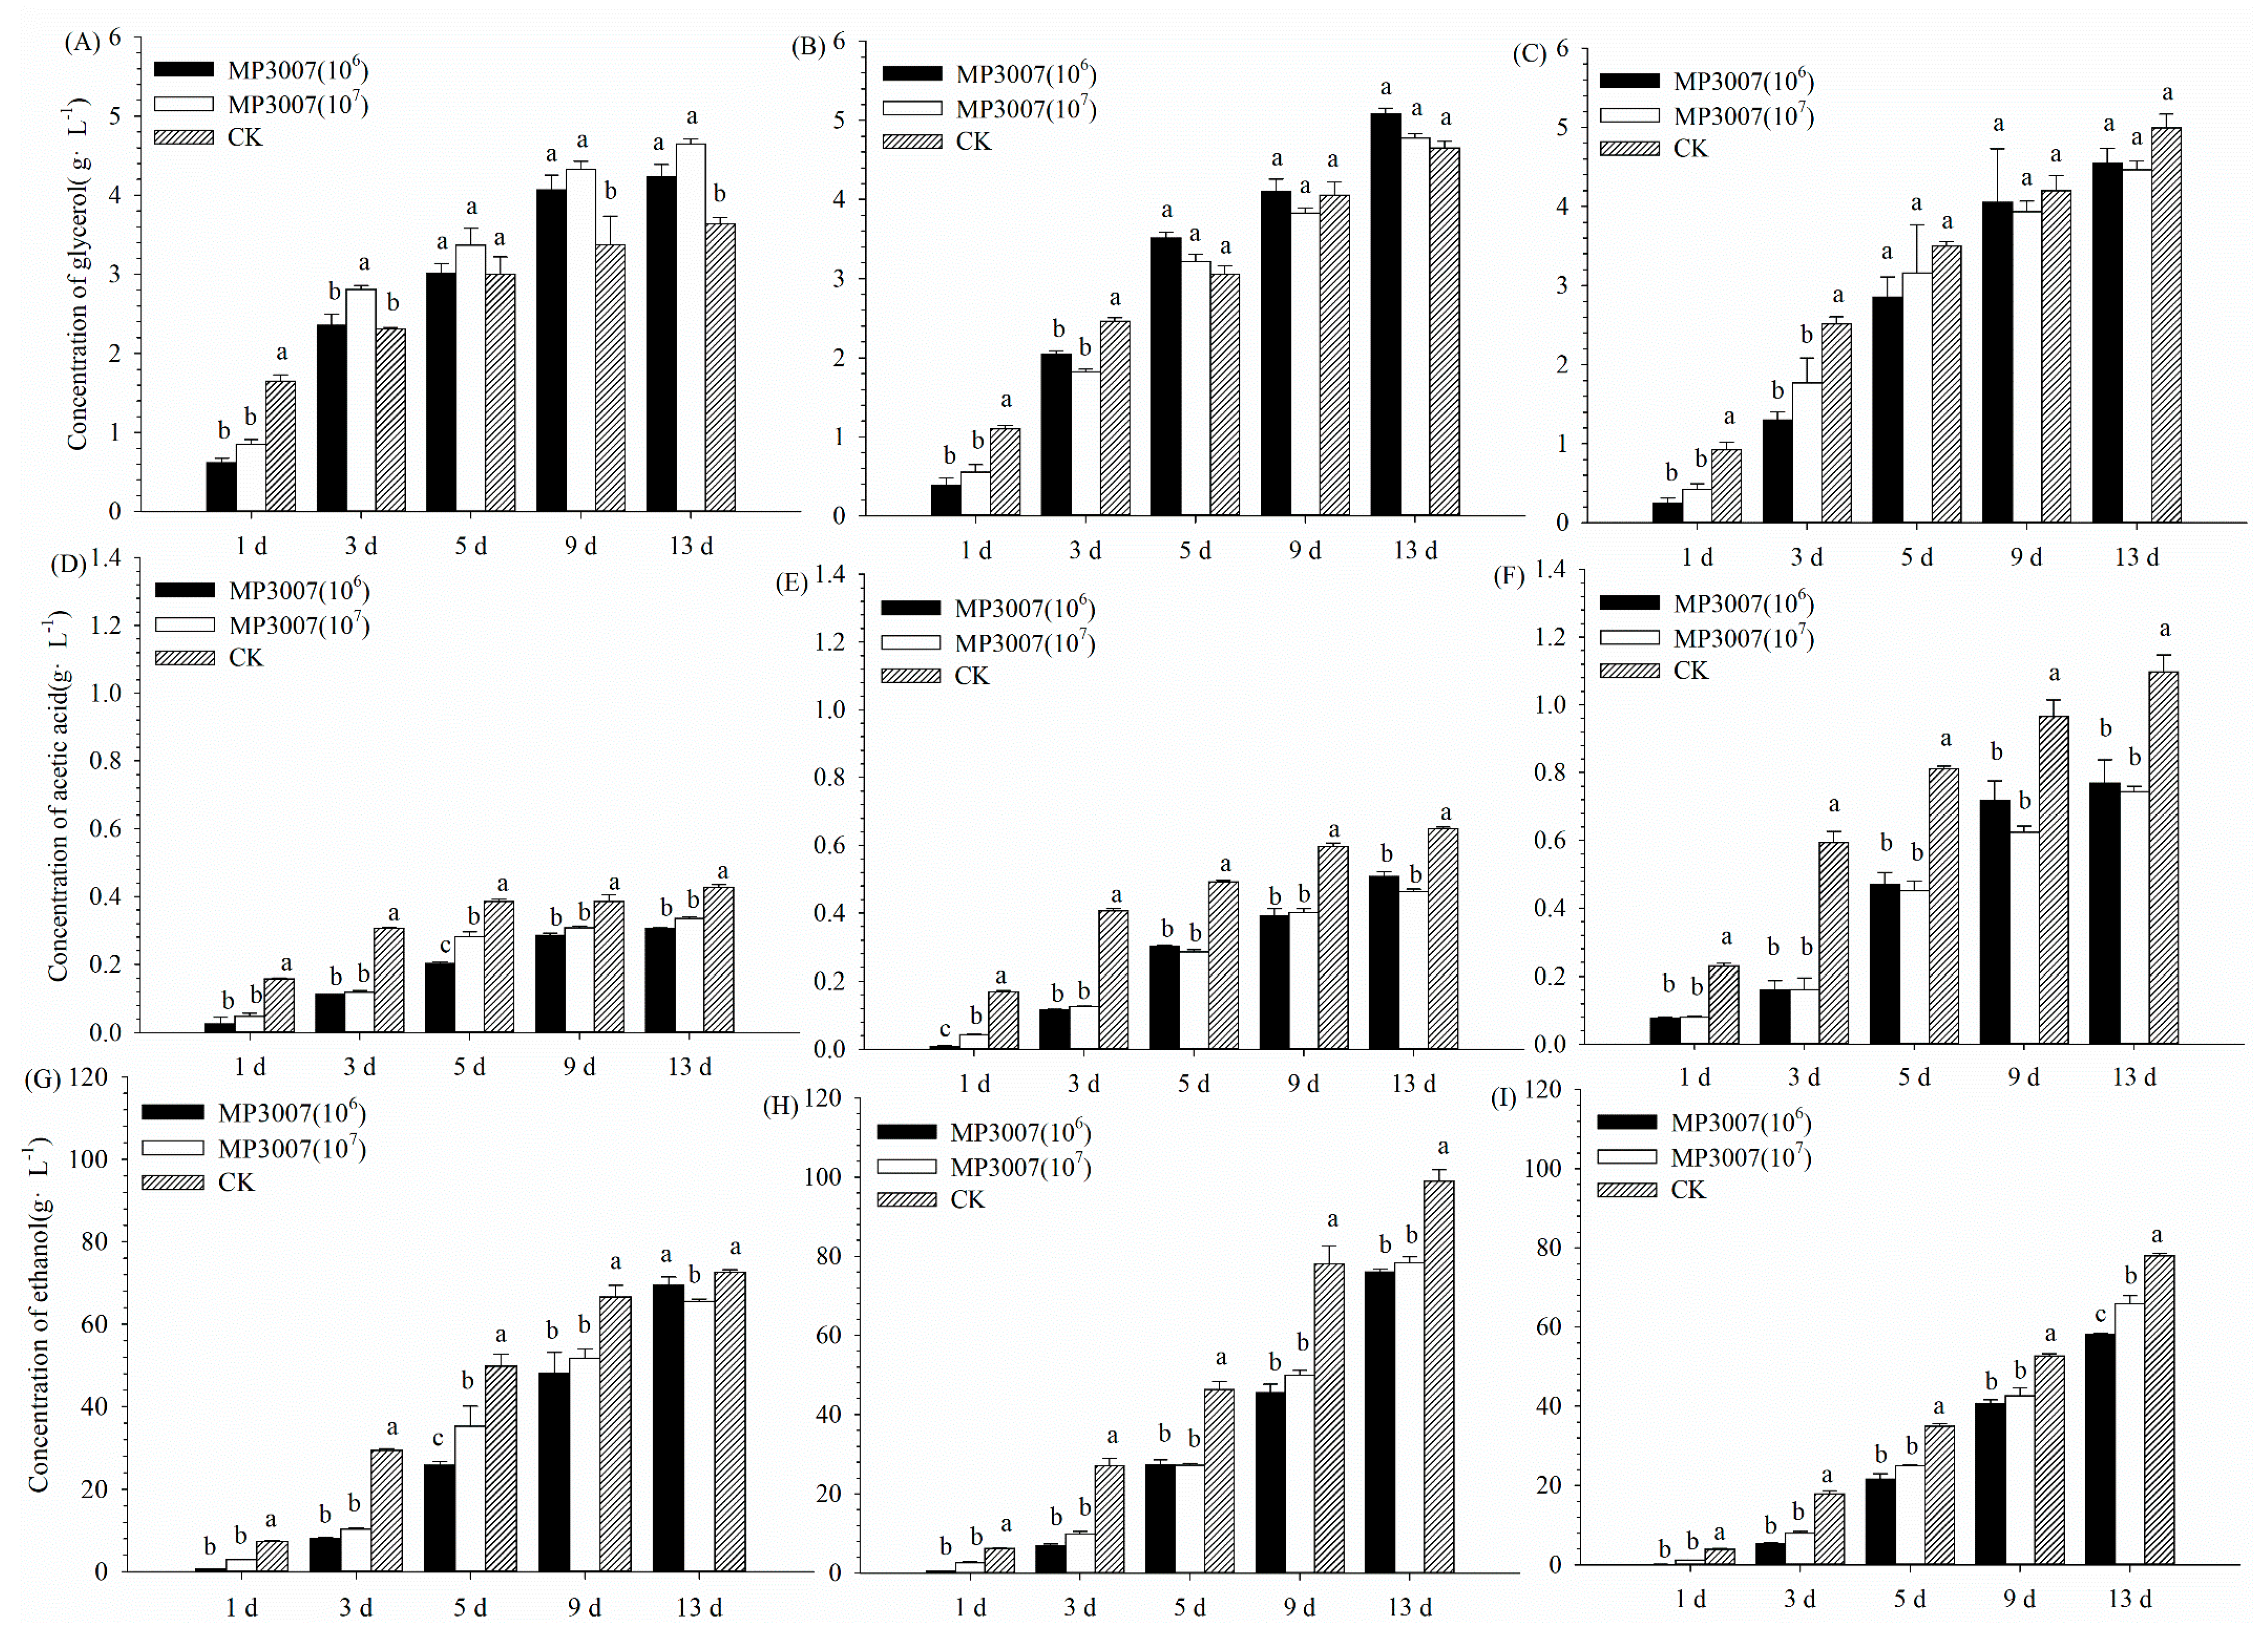
The evolution of primary fermentation products, such as glycerol, acetic acid, and ethanol, reflects the different kinetics of pure and mixed fermentation. The accumulation rate of glycerol concentration in the system was the largest three days after CY3079 inoculation, then the accumulation rate decreased, and the glycerol concentration stabilized (Figure 3). In the early stage of fermentation, the different inoculation concentrations of MP3007 had different effects on the glycerol concentration compared with the pure fermentation group. The glycerol concentration of the mixed fermentation group was significantly higher than that of the pure fermentation group in the middle and late fermentation periods (Figure 3A). When the initial sugar concentration of the must increase (290 g L−1), the above situation underwent a complete change (Figure 3B). In the early stage ofCY3079 pure fermentation produces a higher concentration of acetic acid during the entire fermentation process. Compared with pure fermentation, mixed fermentation significantly reduces the acetic acid concentration in the wine (Figure 3). With the increase in the initial sugar concentration of must, the acetic acid content in the wine positively increased. The acetic acid accumulation content in the pure fermentation group was 0.43 g L−1 (Figure 3D), 0.65 g L−1 (Figure 3E), and 1.10 g L−1 (Figure 3F). The reduction range of mixed fermentation for acetic acid is 14~28% (Figure 3D), 22~29% (Figure 3E), and 30~33% (Figure 3F). The above phenomenon shows that as the initial sugar concentration of must increases, acetic acid accumulation decreases more in the mixed fermentation process.
The ethanol concentration in the wine is a key indicator to test whether the fermentation is going smoothly. CY3079 pure fermentation showed a higher ethanol concentration, while mixed fermentation showed a significantly lower ethanol concentration (Figure 3H,I). When the initial sugar concentration of must is low, MP3007 with a higher inoculation concentration will significantly reduce the ethanol content (Figure 3G) in wine. However, when the initial sugar concentration of must is higher, the ability of higher inoculation concentration to significantly reduce the ethanol content in wine is lower than that of low inoculation concentration (Figure 3I).

3.3. Enzyme Activities in PDH By-Pass

Since this paper aims to explore the effect of MP3007 on CY3079, we choose the time points, days one and three, when their interaction is most obvious. It was observed that MP3007 biomass began to decrease on day one (Figure 1), indicating that the two yeasts began to compete with each other. In addition, the CY3079 biomass in B and C decreased once, reaching a maximum value in A on day three. Therefore, days one and three are worth paying attention to.
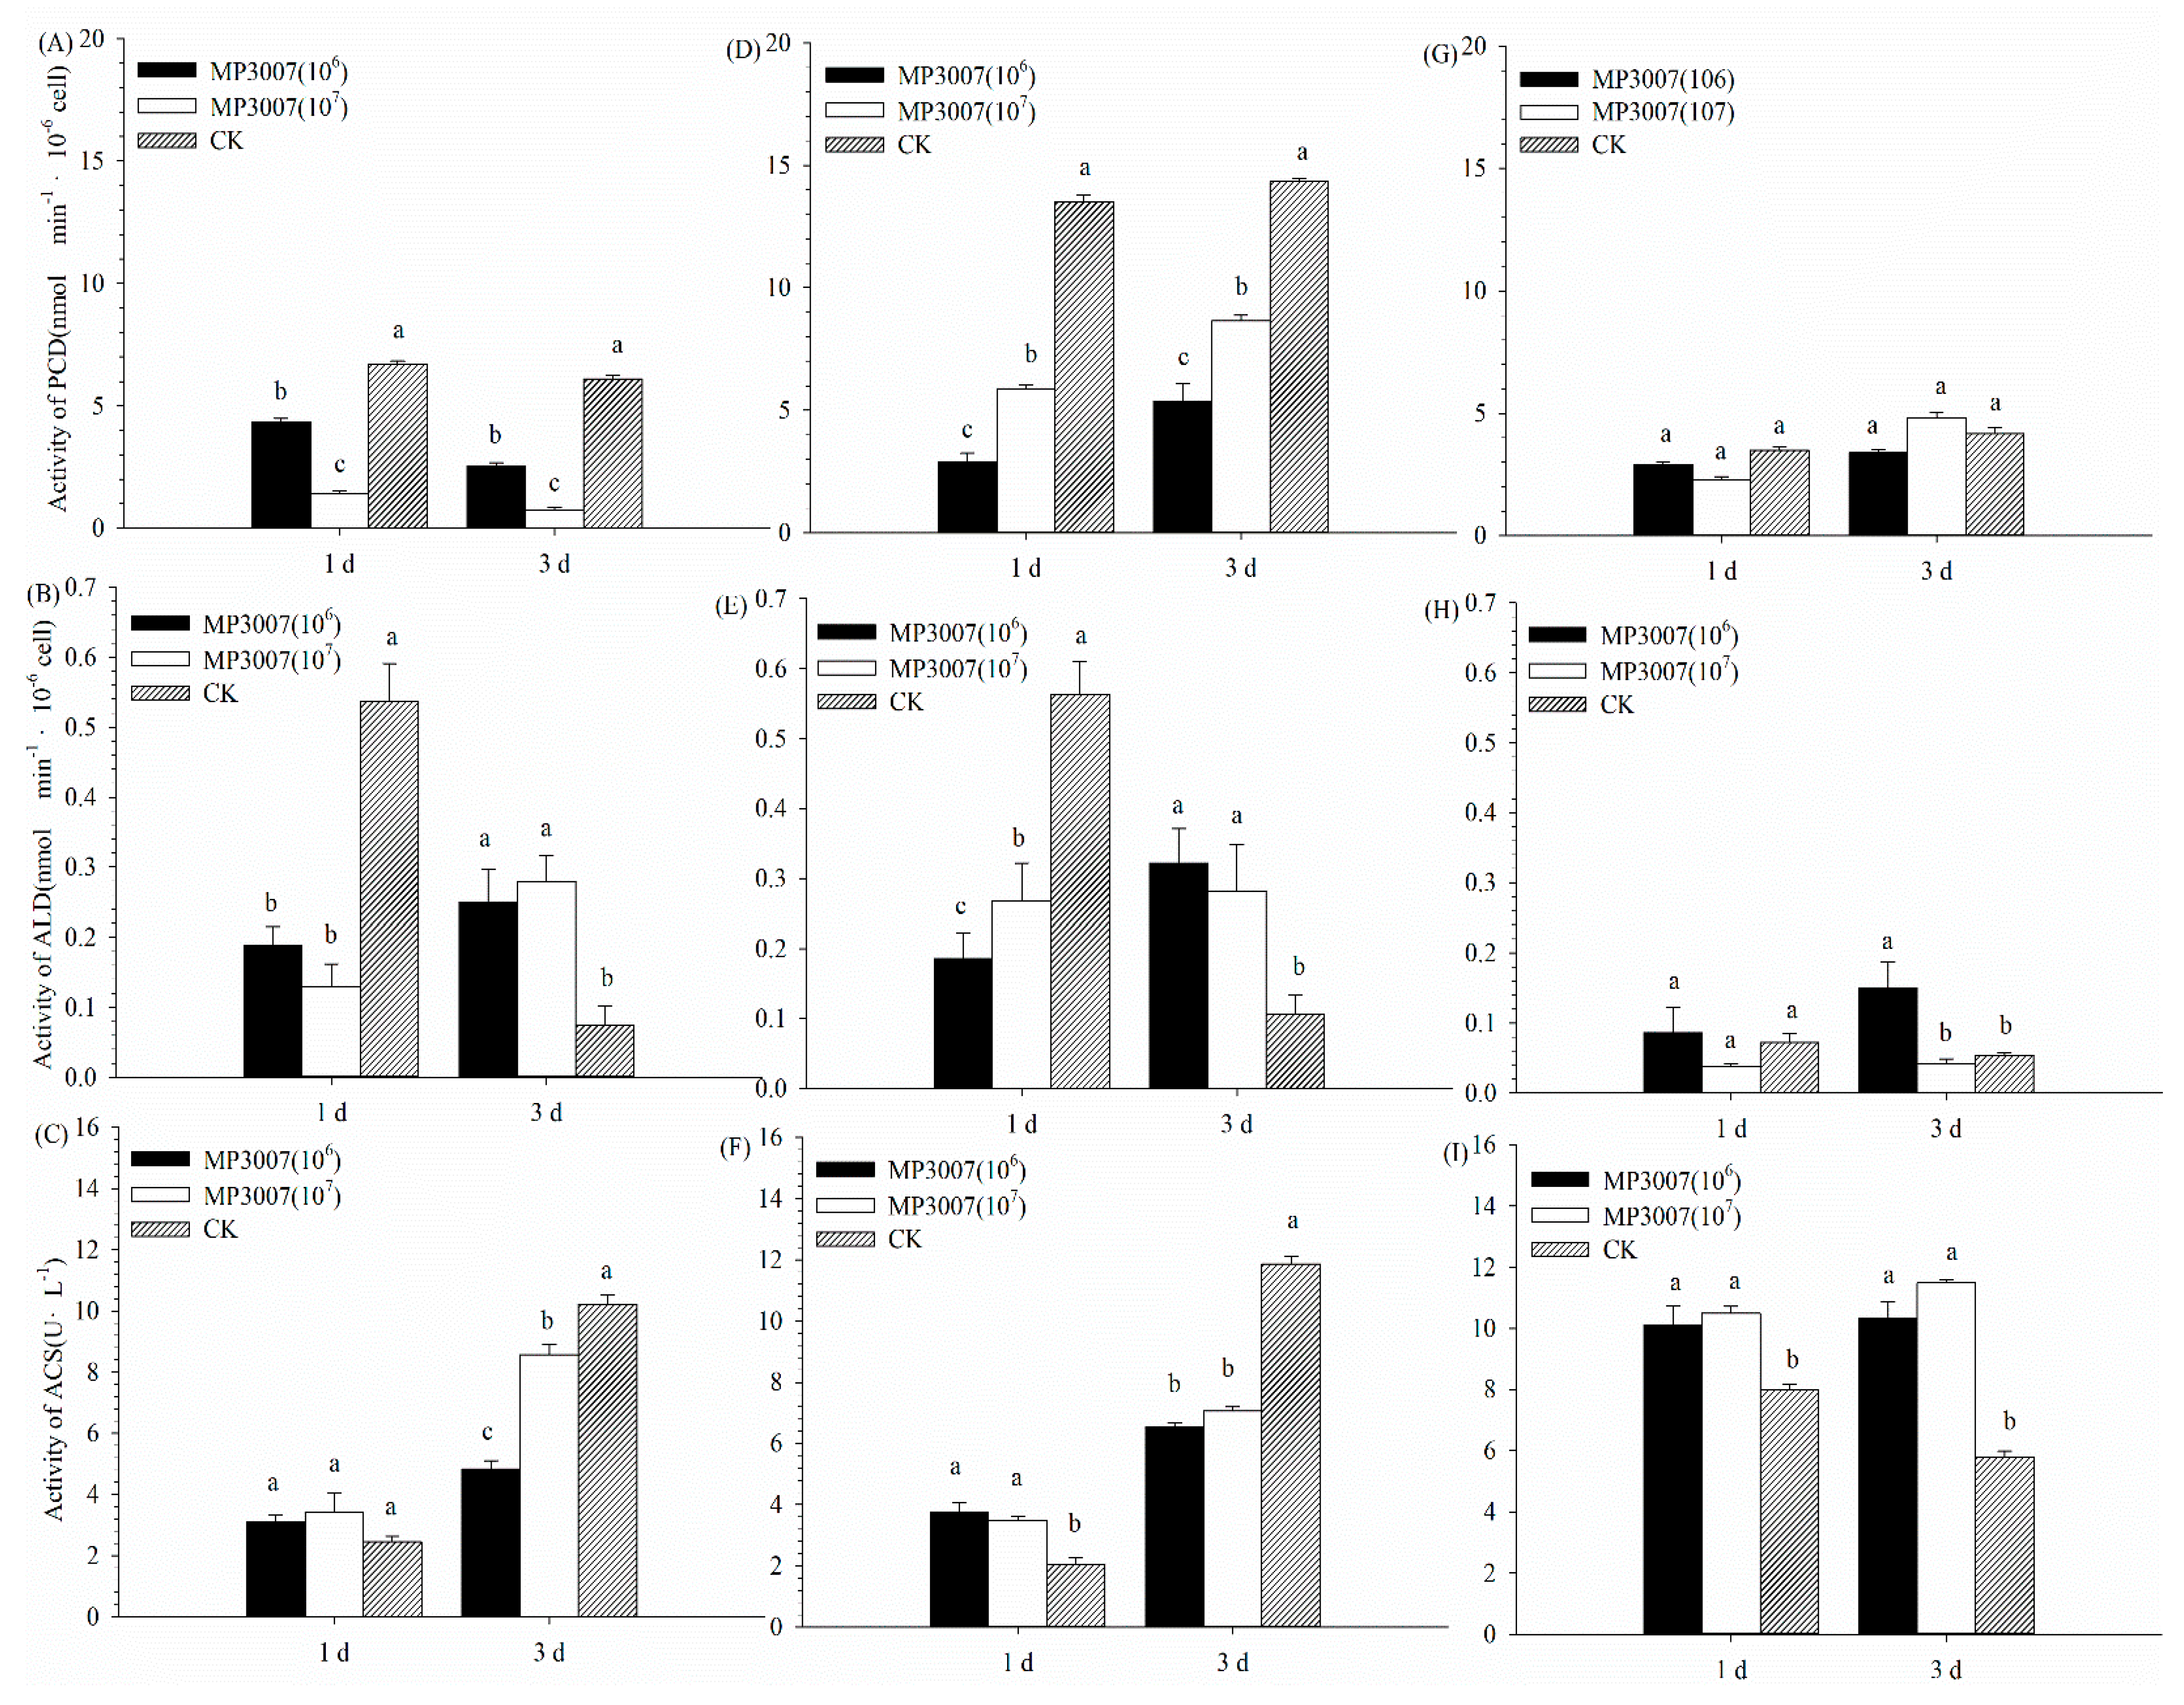
Pyruvate decarboxylase (PDC) primarily catalyzes the conversion of pyruvate to acetaldehyde in the PDH by-pass pathway. Then, acetaldehyde is converted into acetate by ALD and then converted into acetyl-CoA by ACS. The experimental results show that the activities of the above three enzymes are greatly affected by the inoculation concentration of MP3007 and the initial sugar concentration of must (Figure 4). When the initial sugar concentration of grape juice was 200 g L−1 (Figure 4A), it could be observed that the PDC activity of the mixed fermentation group was significantly lower than that of the pure fermentation group, and the PDC activity decreased with the increase in the MP3007 inoculation concentration. When the initial sugar concentration of must reached 290 g L−1 (Figure 4D), it was still observed that the PDC activity of the CK group was significantly higher than that of the mixed fermentation group, but different from the phenomenon in A, the inhibitory effect of PDC was weakened with the increase in the MP3007 inoculation concentration. When the sugar concentration continued to rise to 380 g L−1 (Figure 4G), there was no significant difference in the PDC activity between the CK and the mixed fermentation groups. Additionally, the PDC activity showed no significant upward trend when the fermentation proceeded to 3 d.
Compared with the other two enzymatic activities, the activity of ALD is the lowest in order of magnitude. It can then be observed that the ALD activity of the CK group is always higher than that of the mixed fermentation group on day one and reversed on day three (Figure 4B,E). However, the activities on days one and three are found to be very low at approximately 0.1 nmol·min−1·10−6 cells. Therefore, this phenomenon does not apply to H. Additionally, no significant difference was observed between the different inocula of MP3007 in Figure 4B,E,H, except that the lower inoculation group in Figure 4H was higher than the other groups on day three.
Acetyl-Co A is an important substance for maintaining physiological activity, and ACS catalyzes the conversion of acetate into acetyl-Co A. The experimental results showed that MP3007 and initial sugar concentration significantly affected the ACS activity (Figure 4C,F,I). There was no significant difference between the CK group and the mixed fermentation group on 1 d, and the ACS activity of the CK group was higher than that of the mixed fermentation group when the fermentation proceeded to 3 d. Moreover, there were also obvious differences between the mixed fermentation groups. Higher inoculation amounts corresponded to higher enzyme activity (Figure 4C). When the initial sugar concentration reached 290 g L−1 (Figure 4F), the 1 d time point showed that the enzyme activity of the CK group was lower than that of the mixed fermentation group, but the 3 d time point was the opposite, and there was no significant difference between the mixed fermentation groups. A common rule that the ACS activity showed an upward trend as the fermentation progressed was observed from C and F. However, when the initial sugar concentration was 380 g L−1, ACS showed higher activity on 1 d, and the mixed fermentation group had higher activity than the CK group, whereas the CK group showed a trend of decreasing activity (Figure 4I).

3.4. Gene Expression Analysis

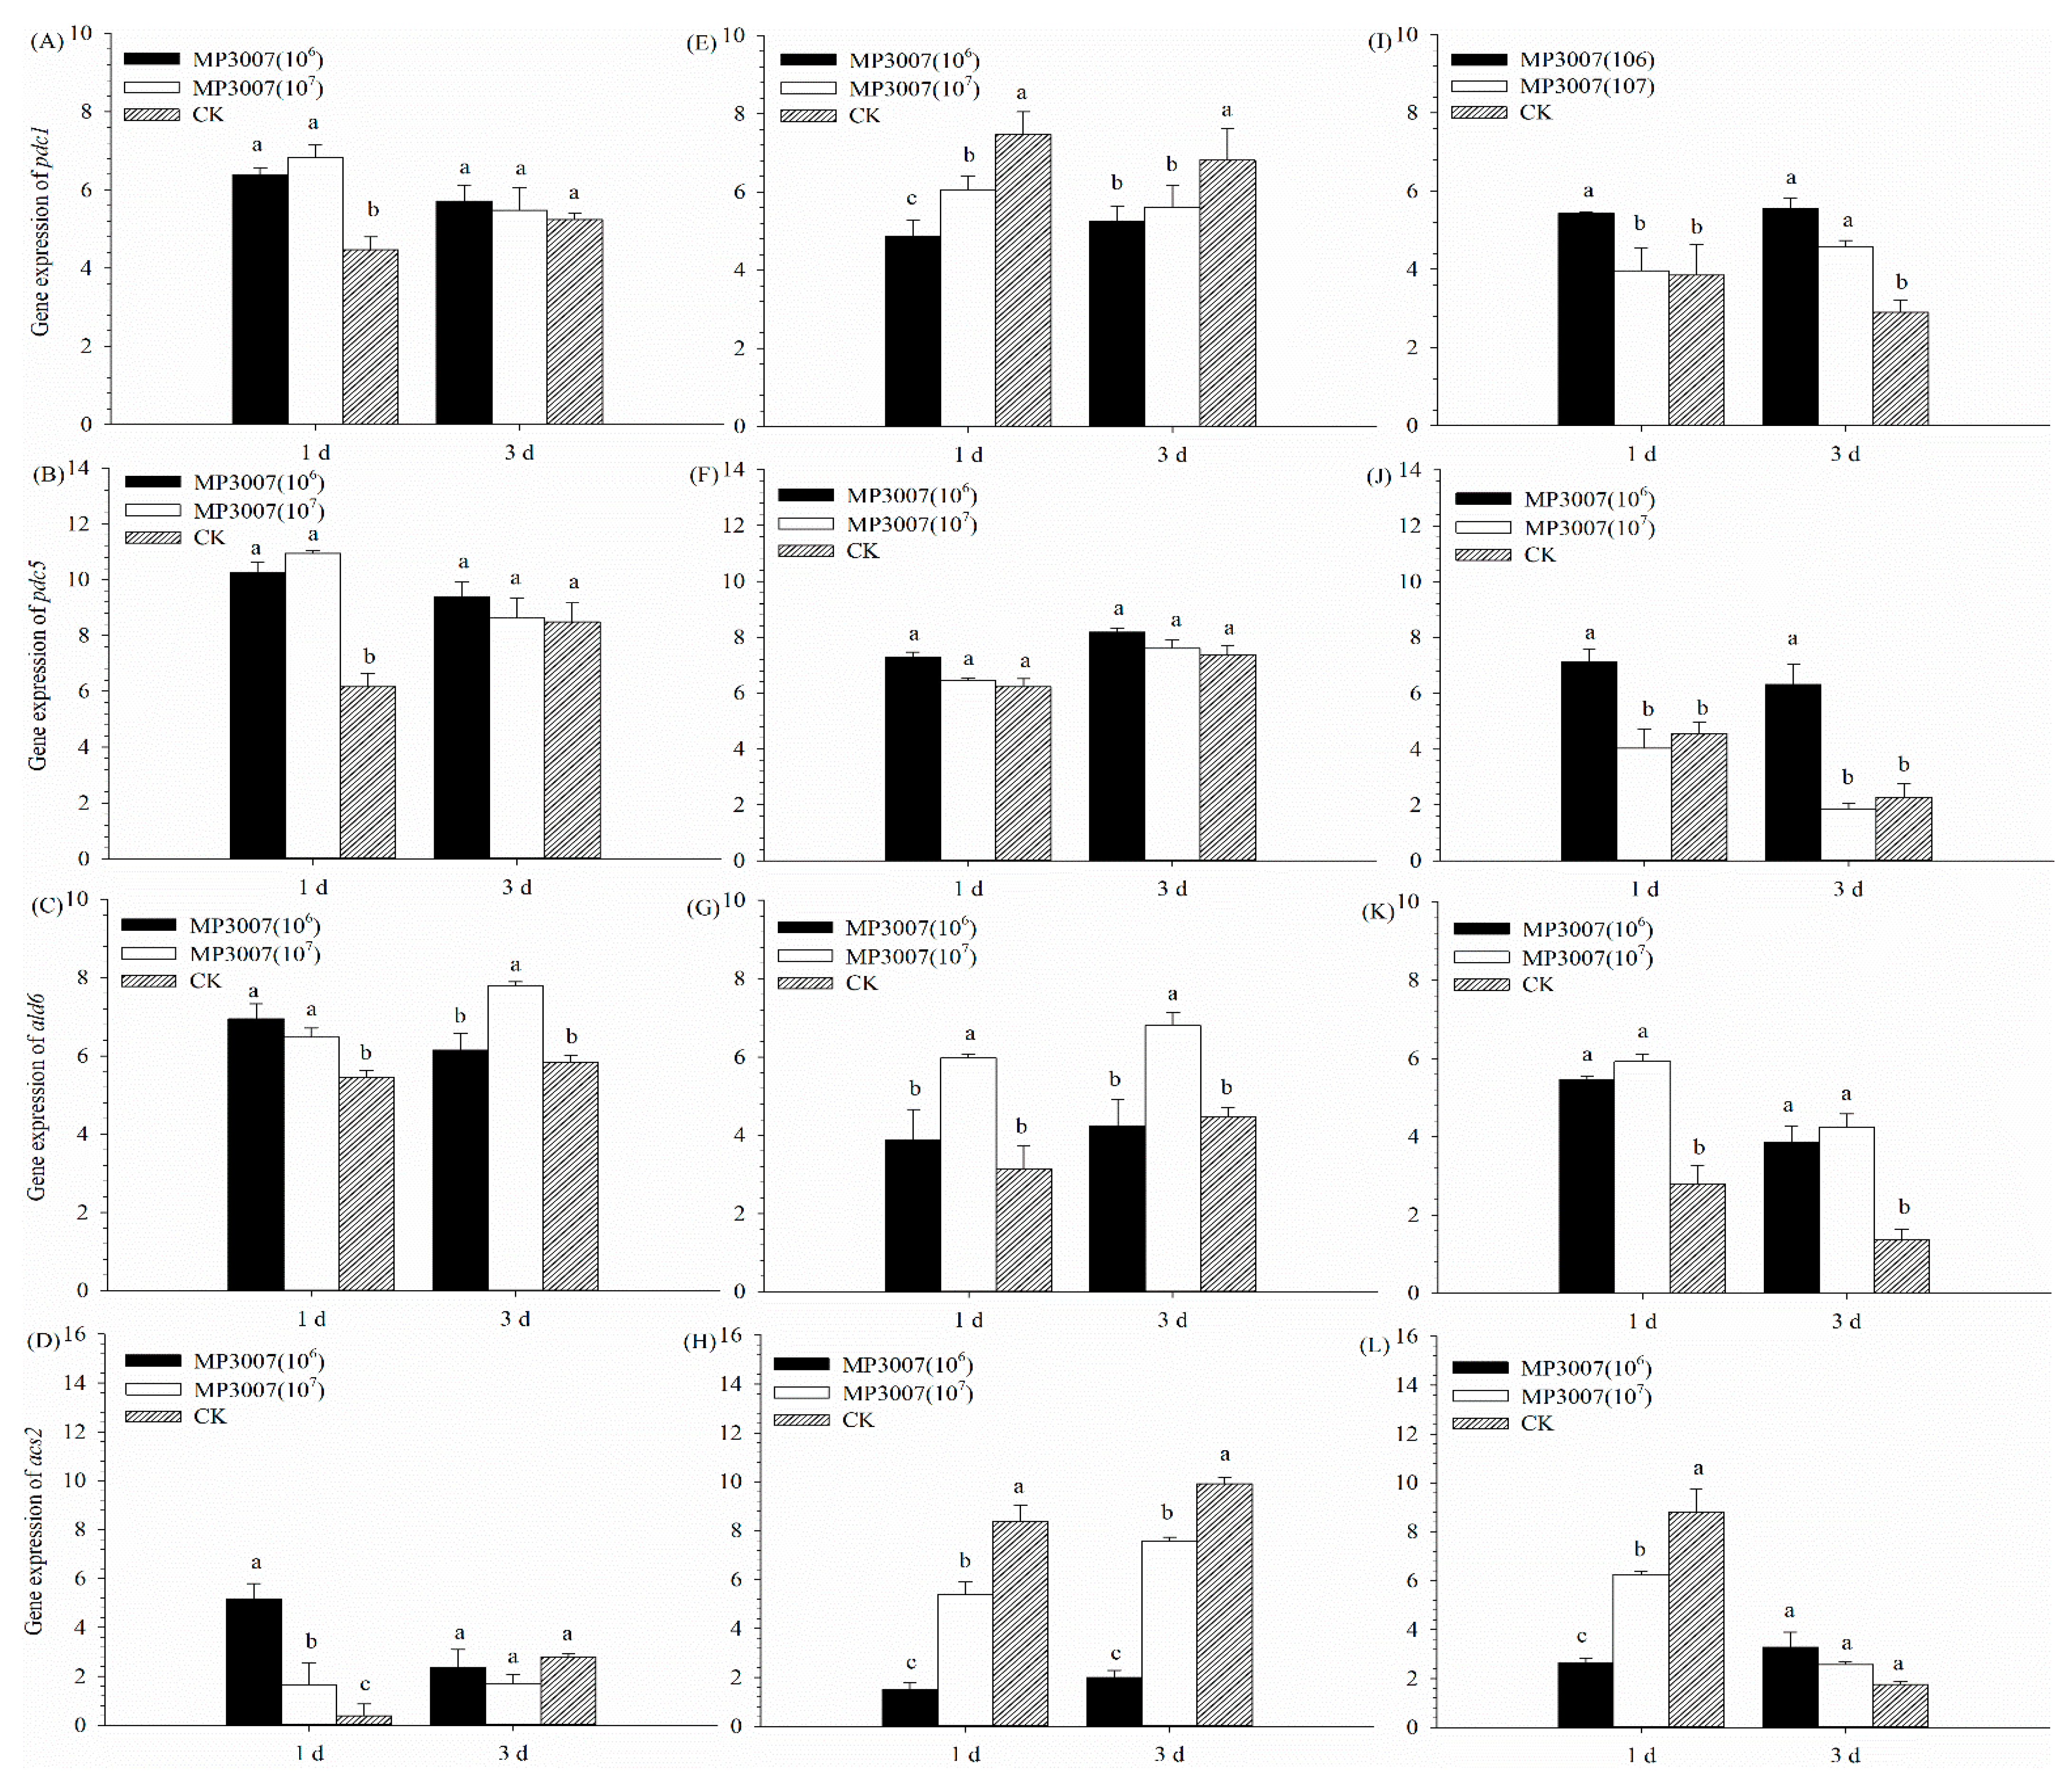
It was observed that both the initial sugar concentration and MP3007 affected the four CY3079 genes in Figure 5. When the initial sugar concentration was 200 g L−1, the trends of pdc1 and pdc5 were very similar. The expression level of the mixed fermentation group was significantly higher than that of the CK group on 1 d, and there was no significant difference between the groups on 3 d (Figure 5A,B). When the initial sugar concentration reached 290 g L−1, the pdc1 expression was inhibited in the mixed fermentation group compared with the CK group, and it was observed that the high inoculation of MP3007 at the one-day time point would weaken the inhibitory effect. pdc5 expression exhibited a stable state in F. When the initial sugar concentration increased to 380 g L−1, I and J showed that the lower inoculum of MP3007 could induce the expression of pdc1 and pdc5 genes, while there was no significant difference between the group with higher inoculation of MP3007 and the CK group. Ald6 was induced at the 1 d time point of C and K, but the performance of C and K differed at the 3 d time point. The group with higher inoculation amount in C continued to induce ald6 expression, while the lower inoculation group differed insignificantly from the CK group; the three days in K were similar to 1 d but showed a downward trend. The effect of higher initial sugar concentration on acs2 on 1 d was similar (Figure 5H,L), the acs2 expression was suppressed in the mixed fermentation group compared with the CK group, and the increase in MP3007 inoculation attenuated the level of inhibition. The difference between H and L is in the 3 d period. The above rules were maintained, and the acs2 expression had a slight upward trend in H, but there was no difference between the groups in L. The performance of the 1 d period when the initial sugar concentration is 200 g L−1 (Figure 5D) is the opposite of other high sugar concentrations. It showed that with the induction of the acs2 expression in the mixed fermentation group, the higher the MP3007 inoculation concentration, and the lower the induction level.

4. Conclusions

This work investigated two factors affecting the acetic acid concentration in wine: the initial sugar concentration of the grape juice and the inoculation ratio of M. pulcherrima and S. cerevisiae in mixed fermentation. The dynamic changes in glycerol, acetic acid, and ethanol concentrations during fermentation, the key enzyme activities of the main acetate production pathway (PDH by-pass) were determined, and the expression information of key genes was analyzed. The results showed that the sequential inoculation process could reduce acetate production, mainly due to MP3007 altering the extracellular osmotic pressure of S. cerevisiae and affecting the enzymatic activity and gene expression of the PDH by-pass of S. cerevisiae. The inoculation concentration of M. pulcherrima significantly affected PDC activity and acs2 expression when the initial sugar concentration was 200 g L−1 and 290 g L−1. The hyperosmolarity (380 g L−1) induced by the initial sugar had a more direct effect on the enzymatic activity of S. cerevisiae, the activities of PDC and ALD were suppressed, and the ACS activity was enhanced. However, the M. pulcherrima inoculation levels had no significant effect on acetic acid and glycerol concentrations in the same fermentation medium.

5. Discussion

In environments with different initial sugar concentrations, high osmotic pressure induced by high sugar delayed the time for yeast cells to reach their maximum concentration, which is consistent with the results of this study [38]. S. cerevisiae cell concentrations in co-culture with MP3007 decreased the day after inoculation (Figure 2B,C). This result may be related to a property of M. pulcherrima, which is reported to produce a certain toxin to inhibit or kill other competing species and maintain survival and development [39,40]. The results of this experiment on ethanol content validate the conclusion that sequential inoculation fermentation can reduce the ethanol concentration in wine [41]. There are two possible reasons for this result; first, it could be due to the difference in the ethanol production capacity of the two yeasts. Many reports have revealed that during mixed fermentation, the role of non-S. cerevisiae is to improve the quality of fermented wine, and the important role of alcohol production remains in S. cerevisiae [33,34,42,43]. As the alcohol increases, the non-S. cerevisiae is unable to withstand high concentrations of alcohol and will gradually die out. The MP3007 preferentially inoculated in this experiment has a lower ability to convert glucose and fructose into ethanol than CY3079. Therefore, the content of glucose and fructose that can be converted into ethanol is lower than that of the pure fermentation group after inoculation with CY3079; it will decrease the final alcohol content. Secondly, non-S. cerevisiae has higher esterase activity than S. cerevisiae [30,44,45]. When the alcohol content increased during fermentation, the non-S. cerevisiae died, and the abundant esterase and β-glucosidase in non-S. cerevisiae would be released into the fermentation environment along with the fragmentation of non-S. cerevisiae cells. S. cerevisiae will cooperate with abundant enzymes to produce more ethyl esters and acetates than pure fermentation [46,47], which will consume a part of ethanol in the process and lead to lower alcohol concentration.
Cells synthesize substances, such as glycerol, to resist and weaken the high-intensity osmotic pressure outside the cell. The production of these substances is primarily concentrated in the early fermentation stages [2,48]. When the cell’s osmotic pressure is reduced, the production of these substances stabilizes. Researchers Noti O et al. [49] found that when yeast cells suddenly face high glucose osmotic pressure, they will balance the intracellular pressure with the extracellular pressure by synthesizing glycerol. When the intracellular glycerol reaches a certain standard, the cells will start to replicate and release extracellular glycerol. Alternatively, the accumulation of extracellular glycerol can laterally reflect the maximum amount of yeast cells in the fermentation environment. The key factor limiting the maximum amount of yeast cells is the content of assimilable nitrogen sources in the fermentation environment. In this experiment, although different concentrations of carbon sources were added, exogenous nitrogen sources were excluded to control for variables, so there were insignificant differences in glycerol content when the initial sugar concentration of the fermentation mash was increased to 290 g L−1 and 380 g L−1. Simultaneously, the inoculum of non-brewer’s yeast insignificantly affected the glycerol and acetic acid content, which may also be related to the fact that the nitrogen source content in the fermentation matrix was unaltered.
According to the results, the concentration of acetic acid in mixed fermentation was much lower than that in pure fermentation. Although a portion of the acetic acid will be used to synthesize acetate molecules during mixed fermentation, it is obvious that MP3007, combined with the key enzyme activities in the PDH by-pass, affects S. cerevisiae enzyme activity during mixed fermentation. The PDC and ALD activities of pure CY3079 fermentation were much higher than those of mixed fermentation, but the ACS activity of pure CY3079 fermentation was significantly lower. When ACS activity was very low, as shown in Figure 6, high PDC activity would accumulate acetaldehyde content in the pathway, whereas high ALD activity could increase or accumulate acetate content in the pathway. Noteworthy, the PDH by-pass pathway is activated in microaerobic or anaerobic environments. When S. cerevisiae and non-S. cerevisiae coexist in the fermentation system, species competition arises. Because oxygen is a suitable competitor at this stage, S. cerevisiae cells will strongly absorb oxygen during mixed fermentation compared to pure fermentation [50], slowing down the effect of the PDH by-pass pathway. There was no direct relationship between gene expression and enzyme activity. The effect of non-S. cerevisiae in the early stage of fermentation on the expression of the four S. cerevisiae’s genes was more prominent, with the initial sugar concentration of 200 g L−1 showing an inductive effect on pdc1, pdc5, ald6, and acs2 compared with pure fermentation at a 1:1 inoculation ratio, with the acs2 gene showing strict inhibition at sugar concentrations >200 g L−1. The inhibitory effect was attenuated by increasing the inoculation level of non-S. cerevisiae.

Author Contributions

Conceptualization, Y.S.; methodology, X.T.; formal analysis, Y.S., Y.D. and X.T.; investigation, X.L. and X.H. (Xiaomei Han); resources, Y.D. and X.T.; data curation, Y.S.; writing—original draft preparation, N.H. and X.H. (Xi He); writing—review and editing, X.L., X.T., Y.D. and Y.S.; project administration, Y.S., Y.D. and X.T. All authors have read and agreed to the published version of the manuscript.

Funding

Major Project of Science and Technology of Shandong Province (2022CXGC010605); Modern Agricultural Technology System of Shandong Province (SDAIT-06-14); Key R & D project of Longkou modern agricultural industry technology research institute (2021LKZDYF02); Natural Science Foundation of Shandong Province (ZR2020QC234); Agricultural Science and Technology Innovation Project of Shandong Academy of Agricultural Sciences (CXGC2022D03).

Institutional Review Board Statement

Not applicable.

Informed Consent Statement

Not applicable.

Data Availability Statement

The data presented in this study are available on request from the corresponding author.

Conflicts of Interest

The authors declare no conflict of interest.

References

  1. Fernández-González, M.; Úbeda, J.F.; Briones, A.I. Study of Saccharomyces cerevisiae Wine Strains for Breeding through Fermentation Efficiency and Tetrad Analysis. Curr. Microbiol. 2015, 70, 441–449. [Google Scholar] [CrossRef] [PubMed]
  2. Cordente, A.G.; Simon, S.; Gemma, B.; Beltran, G.; Jesus, M.T.; Christopher, D.C. Harnessing yeast metabolism of aromatic amino acids for fermented beverage bioflavouring and bioproduction. Appl. Microbiol. Biotechnol. 2019, 103, 4325–4336. [Google Scholar] [CrossRef] [PubMed]
  3. Daniel, J.E.; Margaret, C.; Hennie, J.J.; Vuuren, V. Impact of Yeast Strain on the Production of Acetic Acid, Glycerol, and the Sensory Attributes of Ice wine. Am. J. Enol. Vitic. 2004, 55, 883. [Google Scholar]
  4. Ribéreau, G.P.; Glories, Y.; Maujean, A. Alcohols and Other Volatile Compounds. In Handbook of Enology; John Wiley and Sons, Ltd.: Hoboken, NJ, USA, 2001; pp. 71–85. [Google Scholar]
  5. Casal, M.; Cardoso, H.; Leao, C. Mechanisms regulating the transport of acetic acid in Saccharomyces cerevisiae. Microbiology 1996, 142, 1385–1390. [Google Scholar] [CrossRef]
  6. Delfini, C.; Costa, A. Effects of the grape must lees and insoluble materials on the alcoholic fermentation rate and the production of acetic acid, pyruvic acid, and acetaldehyde. Am. J. Enol. Vitic. 1993, 44, 86–92. [Google Scholar]
  7. Barbosa, C.; Falco, V.; Mendes-Faia, A.; Mendes-Ferreira, A. Nitrogen addition influences formation of aroma compounds, volatile acidity and ethanol in nitrogen deficient media fermented by Saccharomyces cerevisiae wine strains. J. Biosci. Bioeng. 2009, 108, 99–104. [Google Scholar] [CrossRef]
  8. Vilanova, M.; Ugliano, M.; Varela, C.; Siebert, T.; Pretorius, I.S.; Henschke, P.A. Assimilable nitrogen utilisation and production of volatile and non-volatile compounds in chemically defined medium by Saccharomyces cerevisiae wine yeasts. Appl. Microbiol. Biotechnol. 2007, 77, 145–157. [Google Scholar] [CrossRef]
  9. Graham, H.F. Wine Microbiology and Biotechnology; CRC Press: Boca Raton, FL, USA, 1993; p. 228. [Google Scholar]
  10. Sahoo, S.; Panda, P.K.; Mishra, S.R. Optimization of some physical and nutritional parameters for the production of hyaluronidase by Streptococcus equi SED 9. Acta Pol. Pharm. 2007, 64, 517. [Google Scholar]
  11. Llauradó, J.M.; Rozès, N.; Constantí, M.; Mas, A. Study of Some Saccharomyces cerevisiae Strains for Winemaking after Preadaptation at Low Temperatures. J. Agric. Food Chem. 2005, 53, 1003–1011. [Google Scholar] [CrossRef]
  12. Orli, S.F.N.; Arroyo, L.; Hui, B.K. A comparative study of the wine fermentation performance of Saccharomyces paradoxus under different nitrogen concentrations and glucose/fructose ratios. J. Appl. Microbiol. 2010, 108, 73–80. [Google Scholar] [CrossRef]
  13. Patel, S.; Shibamoto, T. Effect of Different Strains of Saccharomyces cerevisiae on Production of Volatiles in Napa Gamay Wine and Petite Sirah Wine. J. Agric. Food Chem. 2002, 50, 5649–5653. [Google Scholar] [CrossRef] [PubMed]
  14. Shimazu, Y.; Watanabe, M. Effects of yeast strains and environmental conditions on formation of organic acids in must during fermentation. J. Ferment. Technol. 1981, 59, 27–32. [Google Scholar]
  15. Torrens, J.; Pilar, U.; Riu, A.M. Different commercial yeast strains affecting the volatile and sensory profile of cava base wine. Int. J. Food Microbiol. 2008, 124, 48–57. [Google Scholar] [CrossRef]
  16. Sadoudi, S.; Rousseaux, V.; David, H.; Alexandre, R.; Tourdot, M. Metschnikowia pulcherrima Influences the Expression of Genes Involved in PDH By-pass and Glyceropyruvic Fermentation in Saccharomyces cerevisiae. Front. Microbiol. 2017, 8, 1137. [Google Scholar] [CrossRef] [PubMed]
  17. Verduyn, C.; Postma, E.; Scheffers, W.A.; Van Dijken, J.P. Physiology of Saccharomyces cerevisiae in Anaerobic Glucose-Limited Chemostat Culturesx. J. Gen. Microbiol. 1990, 136, 395–403. [Google Scholar] [CrossRef]
  18. Remize, F.; Sablayrolles, J.M.; Dequin, S. Re-assessment of the influence of yeast strain and environmental factors on glycerol production in wine. J. Appl. Microbiol. 2000, 88, 371–378. [Google Scholar] [CrossRef]
  19. Pronk, J.T.; Steensma, H.Y.; Van, D.J.P. Pyruvate metabolism in Saccharomyces cerevisiae. Yeast 2010, 12, 1607–1633. [Google Scholar] [CrossRef]
  20. Hohmann, S.; Håkan, C. Autoregulation may control the expression of yeast pyruvate decarboxylase structural genes PDC1 and PDC5. FEBS J. 2010, 188, 615–621. [Google Scholar] [CrossRef]
  21. Morita, K.; Matsuda, F.; Okamoto, K.; Ishii, J.; Kondo, A.; Shimizu, H. Repression of mitochondrial metabolism for cytosolic pyruvate-derived chemical production in Saccharomyces cerevisiae. Microb. Cell Fact. 2019, 18, 177. [Google Scholar] [CrossRef]
  22. Datta, S.; Annapure, U.; Timson, D. Different specificities of two aldehyde dehydrogenases from Saccharomyces cerevisiae var. boulardii. Biosci. Rep. 2017, 37, BSR20160529. [Google Scholar] [CrossRef]
  23. Tessier, W.D.; Meaden, P.G.; Dickinson, F.M.; Melvin, M. Identification and disruption of the gene encoding the k+-activated acetaldehyde dehydrogenase of Saccharomyces cerevisiae. FEMS Microbiol. Lett. 2010, 1, 29–34. [Google Scholar]
  24. Kozak, B.U.; van Rossum, H.M.; Niemeijer, M.S.; Marlous, V.D.; Kirsten, B.; Liang, W. Replacement of the initial steps of ethanol metabolism in Saccharomyces cerevisiae by ATP-independent acetylating acetaldehyde dehydrogenase. FEMS Yeast Res. 2016, 16, fow006. [Google Scholar] [CrossRef] [PubMed]
  25. Saigal, D.; Cunningham, S.J.; Farrés, J.; Weiner, H. Molecular cloning of the mitochondrial aldehyde dehydrogenase gene of Saccharomyces cerevisiae by genetic complementation. J. Bacteriol. 1991, 173, 3199–3208. [Google Scholar] [CrossRef]
  26. Wang, X.; Mann, C.J.; Bai, Y.; Ni, L.; Weiner, H. Molecular cloning, characterization, and potential roles of cytosolic and mitochondrial aldehyde dehydrogenases in ethanol metabolism in Saccharomyces cerevisiae. J. Bacteriol. 1998, 180, 822–830. [Google Scholar] [CrossRef]
  27. Vanden, B.M.; Jong, G.P.; Kortland, C.; Dijken, J.; Pronk, J.; Steensma, H. The two acetyl-coenzyme A synthetases of Saccharomyces cerevisiae differ with respect to kinetic properties and transcriptional regulation. J. Biol. Chem. 1996, 271, 28953–28959. [Google Scholar] [CrossRef] [PubMed] [Green Version]
  28. Vanden, B.M.; Steensma, H. ACS2, a Saccharomyces cerevisiae gene encoding acetyl-coenzyme A synthetase, essential for growth on glucose. Eur. J. Biochem. 1995, 231, 704–713. [Google Scholar]
  29. Viana, F.; Gil, J.V.; Genovés, S.; Vallés, S.; Manzanares, P. Rational selection of non-Saccharomyces wine yeasts for mixed starters based on ester formation and enological traits. Food Microbiol. 2008, 25, 778–785. [Google Scholar] [CrossRef]
  30. Shekhawat, K.; Bauer, F.F.; Setati, M.E. Impact of oxygenation on the performance of three non-Saccharomyces yeasts in co-fermentation with Saccharomyces cerevisiae. Appl. Microbiol. Biotechnol. 2017, 101, 2479–2491. [Google Scholar] [CrossRef]
  31. Hu, K.; Jin, G.-J.; Xu, Y.-H.; Tao, Y.-S. Wine aroma response to different participation of selected Hanseniaspora uvarum in mixed fermentation with Saccharomyces cerevisiae. Food Res. Int. 2018, 108, 119–127. [Google Scholar] [CrossRef]
  32. Varela, C.; Sengler, F.; Solomon, M.; Curtin, C. Volatile flavour profile of reduced alcohol wines fermented with the non-conventional yeast species Metschnikowia pulcherrima and Saccharomyces uvarum. Food Chem. 2016, 209, 57–64. [Google Scholar] [CrossRef]
  33. García, M.; Esteve-Zarzoso, B.; Cabellos, J.M.; Arroyo, T. Sequential Non-Saccharomyces and Saccharomyces cerevisiae Fermentations to Reduce the Alcohol Content in Wine. Fermentation 2020, 6, 60. [Google Scholar] [CrossRef]
  34. Ivit, N.N.; Longo, R.; Kemp, B. The Effect of Non-Saccharomyces and Saccharomyces Non-Cerevisiae Yeasts on Ethanol and Glycerol Levels in Wine. Fermentation 2020, 6, 77. [Google Scholar] [CrossRef]
  35. Escribano, V.R.; González, A.L.; Portu, J.; Garijo, P.; López, A.I.; López, R.; Santamaría, P.; Gutiérrez, A.R. Wine aroma evolution throughout alcoholic fermentation sequentially inoculated withnon-Saccharomyces/Saccharomyces yeasts. Food Res. Int. 2018, 112, 17–24. [Google Scholar] [CrossRef] [PubMed]
  36. Vaudano, E.; Noti, O.; Costantini, A.; Garcia-Moruno, E. Identifification of reference genes suitable for normalization of RT-qPCR expression data in Saccharomyces cerevisiae during alcoholic ermentation. Biotechnol. Lett. 2011, 33, 1593–1599. [Google Scholar] [CrossRef] [PubMed]
  37. Cankorur-Cetinkaya, A.; Dereli, E.; Eraslan, S.; Karabekmez, E.; Dikicioglu, D.; Kirdar, B. A Novel Strategy for Selection and Validation of Reference Genes in Dynamic Multidimensional Experimental Design in Yeast. PLoS ONE 2012, 7, e38351. [Google Scholar]
  38. Pan, X.; Wu, J.; Zhang, W.; Liu, J.; Yang, X.; Liao, X.; Hu, X.; Lao, F. Effects of sugar matrices on the release of key aroma compounds in fresh and high hydrostatic pressure processed Tainong mango juices. Food Chem. 2020, 338, 128117. [Google Scholar] [CrossRef]
  39. Kántor, A.; Hutková, J.; Petrová, J. Antimicrobial activity of pulcherrimin pigment produced by Metschnikowia pulcherrima against various yeast species. J. Microbiol. Biotechnol. Food Sci. 2017, 5, 282–285. [Google Scholar] [CrossRef] [Green Version]
  40. Oro, L.; Ciani, M.; Comitini, F. Antimicrobial activity of Metschnikowia pulcherrima on wine yeasts. J. Appl. Microbiol. 2014, 116, 1209–1217. [Google Scholar] [CrossRef]
  41. Mestre, M.V.; Maturano, Y.P.; Mercado, L. Evaluation of different co-inoculation time of non-Saccharomyces/Saccharomyces yeasts in order to obtain reduced ethanol wines. BIO Web Conf. 2016, 7, 02025. [Google Scholar] [CrossRef]
  42. Zhang, B.; Ivanova, P.V.; Duan, C. Distinctive chemical and aromatic composition of red wines produced by Saccharomyces cerevisiae co-fermentation with indigenous and commercial non-Saccharomyces strains. Food Biosci. 2021, 41, 100925. [Google Scholar] [CrossRef]
  43. Hu, L.; Liu, R.; Wang, X.; Zhang, X. The Sensory Quality Improvement of Citrus Wine through Co-Fermentations with Selected Non-Saccharomyces Yeast Strains and Saccharomyces cerevisiae. Microorganisms 2020, 8, 323. [Google Scholar] [CrossRef] [PubMed]
  44. Li, N.; Wang, Q.-Q.; Xu, Y.-H.; Li, A.-H.; Tao, Y.-S. Increased glycosidase activities improved the production of wine varietal odorants in mixed fermentation of P. fermentans and high antagonistic S. cerevisiae. Food Chem. 2020, 332, 127426. [Google Scholar] [CrossRef] [PubMed]
  45. Gonzalez, P.P.; Farina, L.; Carrau, F. A novel extracellular β-glucosidase from Issatchenkia terricola: Isolation, immobilization and application for aroma enhancement of white Muscat wine. Process Biochem. 2011, 46, 385–389. [Google Scholar] [CrossRef]
  46. Canonico, L.; Ciani, E.; Galli, E.; Comitini, F.; Ciani, M. Evolution of Aromatic Profile of Torulaspora delbrueckii Mixed Fermentation at Microbrewery Plant. Fermentation 2020, 6, 7. [Google Scholar] [CrossRef]
  47. Barone, E.; Ponticello, G.; Giaramida, P.; Squadrito, M.; Fasciana, T.; Gandolfo, V.; Ardizzone, F.; Monteleone, M.; Corona, O.; Francesca, N.; et al. Use of Kluyveromyces marxianus to Increase Free Monoterpenes and Aliphatic Esters in White Wines. Fermentation 2021, 7, 79. [Google Scholar] [CrossRef]
  48. Alexandre, H.; Nguyen, V.L.T.; Feuillat, M.; Charpentier, C. Contribution à l’étude des bourbes: Influence sur la fermentescibilitédes moûts. Blood Cells 1994, 146, 11–20. [Google Scholar]
  49. Noti, O.; Vaudano, E.; Pessione, E. Short-term response of different Saccharomyces cerevisiae strains to hyperosmotic stress caused by inoculation in grape must: RT-qPCR study and metabolite analysis. Food Microbiol. 2015, 52, 49–58. [Google Scholar] [CrossRef]
  50. Englezos, V.; Cravero, F.; Torchio, F.; Rantsiou, K.; Ortiz-Julien, A.; Lambri, M.; Gerbi, V.; Rolle, L.; Cocolin, L. Oxygen availability and strain combination modulate yeast growth dynamics in mixed culture fermentations of grape must with Starmerella bacillaris and Saccharomyces cerevisiae. Food Microbiol. 2018, 69, 179–188. [Google Scholar] [CrossRef]
Figure 1. Growth behavior of CY3079 and MP3007 during pure and sequential culture. (A) Yeast concentration at 200 g L−1 initial sugar concentration; (B) yeast concentration at 290 g L−1 initial sugar concentration; (C) yeast concentration at 380 g L−1 initial sugar concentration. The solid circles represent the dynamic change of MP3007 when the M. pulcherrima inoculation amount is 106, and the inverted solid triangles represent the dynamic change of MP3007 when the M. pulcherrima inoculation amount is 107; the hollow circles represent the dynamic change of CY3079 when the M. pulcherrima inoculation amount is 106, the hollow triangles represents the dynamic change of CY3079 when the M. pulcherrima inoculation amount is 107, and the solid square represents the dynamic change of CY3079 in the control group.
Fermentation 08 00480 g001
Figure 2. Dynamic changes of glucose or fructose during fermentation. (A,D), respectively, mean the dynamic changes of glucose and fructose in 200 g L−1 sugar content fermentation must; (B,E), respectively, mean the dynamic changes of glucose and fructose in 290 g L−1 sugar content fermentation must; (C,F) respectively mean the dynamic changes of glucose and fructose in 380 g L−1 sugar content fermentation must.
Fermentation 08 00480 g002
Figure 3. Dynamic changes of glycerol, acetic acid, and ethanol during fermentation. (A,D,G) respectively mean the dynamic changes of glycerol, acetic acid, and ethanol in 200 g L−1 sugar content fermentation must; (B,E,H), respectively, mean the dynamic changes of glycerol, acetic acid, and ethanol in 290 g L−1 sugar content fermentation must; (C,F,I), respectively, mean the dynamic changes of glycerol, acetic acid, and ethanol in 380 g L−1 sugar content fermentation must. Letter marks indicate significant differences (p < 0.05).
Fermentation 08 00480 g003
Figure 4. (A,D,G), respectively, mean PDC, ALD, and ACS enzyme activities at different fermentation stages in 200 g L−1 sugar content must; (B,E,H), respectively, mean PDC, ALD and ACS enzyme activities at different fermentation stages in 290 g L−1 sugar content must; (C,F,I), respectively, mean PDC, ALD and ACS enzyme activities at different fermentation stages in 380 g L−1 sugar content must; letter marks indicate significant differences (p < 0.05).
Fermentation 08 00480 g004
Figure 5. (AD), respectively, mean the gene expression levels of pdc1, pdc5, ald6, and acs2 in different fermentation stages in 200 g L−1 sugar concentration must; (EH), respectively, mean the gene expression levels of pdc1, pdc5, ald6, and acs2 in different fermentation stages in 290 g L−1 sugar concentration must; (IL), respectively, mean the gene expression levels of pdc1, pdc5, ald6, and acs2 in different fermentation stages in 380 g L−1 sugar concentration must; letter marks indicate significant differences (p < 0.05).
Fermentation 08 00480 g005
Figure 6. Schematic representation of the main reactions and enzymes involved in PDH by-pass metabolism pathway in yeast.
Fermentation 08 00480 g006
Table 1. Genes and primers used in RT-qPCR.
GenesNCBI Gene ID5′-3′Primer Size
pdc1850733CTTACGCCGCTGATGGTTA19
(YLR044C)GGCAATACCGTTCAAAGCAG20
pdc5850825GGCTGATGCTTGTGCTTCTA20
(YLR134W)GGGTGTTGTTCGTCAATAGC20
ald6856044TCTCTTCTGCCACCACTGAA20
(YPL061W)CCTCTTTCTCTTGGGTCTTGG21
acs2850846ATTGGTCCTTTCGCCTCAC19
(YLR153C)GCTGTTCGGCTTCGTTAGA19
pgk1850370GGTAACACCGTCATCATTGG20
(YCR012W)AAGCACCACCACCAGTAGAGA21
Publisher’s Note: MDPI stays neutral with regard to jurisdictional claims in published maps and institutional affiliations.