Article

Biochemical Methane Potential of a Biorefinery’s Process-Wastewater and its Components at Different Concentrations and Temperatures

1
State Institute of Agricultural Engineering and Bioenergy, University of Hohenheim, 70599 Stuttgart, Germany
2
Department of Conversion Technologies of Biobased Resources, University of Hohenheim, 70599 Stuttgart, Germany
*
Author to whom correspondence should be addressed.
Fermentation 2022, 8(10), 476; https://doi.org/10.3390/fermentation8100476
Submission received: 19 August 2022 / Revised: 14 September 2022 / Accepted: 15 September 2022 / Published: 22 September 2022

Abstract

:
A sustainable circular bioeconomy requires the side streams and byproducts of biorefineries to be assimilated into bioprocesses to produce value-added products. The present study endeavored to utilize such a byproduct generated during the synthesis of 5-hydroxymethylfurfural as a potential feedstock for biogas production. For this purpose, biochemical methane potential tests for the full process-wastewater, its components (5-hydroxymethylfurfural, furfural, levulinic acid, and glycolic acid), together with furfural’s metabolites (furfuryl alcohol and furoic acid), and phenols (syringaldehyde, vanillin, and phenol), were conducted at mesophilic and thermophilic temperatures to assess their biodegradability and gas production kinetics. 0.1, 0.2, 0.3, and 0.4 g COD of the test components were added separately into assays containing 35 mL of inoculum. At their lowest concentrations, the test components, other than the process-wastewater, exhibited a stimulatory effect on methane production at 37 °C, whereas their increased concentrations returned a lower mean specific methane yield at either temperature. For similar component loads, the mesophilic assays outperformed the thermophilic assays for the mean measured specific methane yields. Components that impaired the anaerobic process with their elevated concentrations were phenol, vanillin, and 5-hydroxymethylfurfural. Poor degradation of the process-wastewater was deduced to be linked to the considerable share of 5-hydroxymethylfurfural in the process-wastewater governing its overall characteristics. With excessive recalcitrant components, it is recommended to use such waste streams and byproducts as a substrate for biogas plants operating at moderate temperatures, but at low rates.

1. Introduction

The use of non-renewable fossil resources in current production practices has led to serious environmental issues. A probable solution to offset such concerns lies in a gradual transition from petroleum-based economies to biobased economies, with regenerative resources being the primary production input [1]. By encompassing different conversion processes and techniques, biorefineries convert the biobased feedstocks into biofuels, biobased materials, and equally important platform chemicals [2].
Platform chemicals are intermediates that function as building blocks to manufacture a variety of value-added products including biochemicals. A prime example of such an intermediate is 5-hydroxymethylfurfural (5-HMF), which is perceived as a versatile platform compound due to its broad industrial application spectrum; for instance, in pharmaceuticals, agrochemicals, textiles, plastics, resins, paints, and adhesives to name a few [1,3,4]. In addition, the US Department of Energy rates 5-HMF and its derivatives, levulinic acid, 2,5-Furandicarboxylic acid (FDCA), and 2,5-diformylfuran (DFF) as the topmost promising biomass-derived chemicals [5,6].
The synthesis of 5-HMF from biobased feedstock is usually carried out via a thermochemical conversion (TCC) process (200 °C, 18 min, 24 bar [7]), which, in general, initiates with the acid hydrolysis of cellulose and hemicellulose [8], followed by the isomerization of glucose [9], and concludes with the acid-catalyzed dehydration of fructose [10]. Coupled with the end bioproduct (5-HMF), a hazardous byproduct (process-wastewater) concurrently rich in organics [11] and moderately in inorganics is also produced [12]. For a circular bioeconomy with a zero-waste approach, residues and waste streams generated in biorefineries have to be transformed into value-added products as well [13]. Hence, biochemical conversion, in particular anaerobic digestion (AD), is the paradigm that can contribute toward the valorization of such biorefineries’ byproducts [14,15]. AD is defined as the biodegradation of organic wastes in the absence of oxygen to produce a renewable energy source (biogas) that can be converted by a combined heat and power unit (CHP) into heat and electricity [16].
Process-wastewater or aqueous materials produced during different TCC techniques (e.g., hydrothermal carbonization (HTC), hydrothermal liquefaction (HTL), and pyrolysis) form various biobased feedstock such as agricultural [12] and agroindustrial wastes [17], forestry residues [18,19], food [20] and animal waste [21], lignocellulosic biomass [22], and municipal waste [23] were investigated for their biogas potential. The process parameters and the feedstock nature were determined to be the decisive factor for the ultimate composition of the wastewaters produced [24], thereby resulting in distinctive methane yields [25,26]. By elevating the process severity (temperature, retention time, catalyst concentration), significant amounts of soluble organic substances are released in comparison to the biomass treated with low severity parameters [18,26]. Following the extraction of the target components, the undesired constituents and side streams, comprising mainly of refractory and recalcitrant substances (e.g., acidic [24], aromatics [27], and nitrogenated compounds [28]) are washed down as process-wastewater, consequently upsurging the complexity of the generated byproduct [26]. Moreover, regardless of the pretreatment (e.g., steam explosion, hot water extraction, wet oxidation), or the treatment procedures (as in TCC) applied to the lignocellulosic feedstock, the aqueous phase or the process-wastewater produced as a result, will constitute components of furan and phenol origin together with weak acids [27,29].
As improper management or disposal of such hazardous materials may lead to environmental nuisances on account of their noxious characteristics, perhaps with anaerobic technologies, such byproducts can be detoxified while simultaneously producing biogas. Provision of such materials in fermenters does prompt gas production, but only to a certain extent (in terms of their loading rates and the subsequent microbial tolerance to it), whereafter they may exert a converse effect on the anaerobic consortia, thus leading to partial inhibition or deterioration of the process [25,30]. Complete inhibition of the fermentation process is linked to the furans and the phenols forming reactive oxygen species (ROS), disrupting or inactivating essential enzymes, distorting genetic materials and cell organelles, and weakening cell membranes, among others, resulting in the onset of cell apoptosis [31,32]. Similarly, inhibition due to weak acids, according to Palmqvist et al. [33], is the outcome of intracellular accumulation of anions, along with the increased level of protons (H+) in the cytosol.
Thus, the present study aims to assess the feasibility of a biorefinery’s processwastewater as a potential biogas plant feedstock by investigating the biochemical methane potential (BMP) of its typical constituents such as furans, weak acids, and phenols, plus the full 5-HMF process-wastewater, separately at different concentrations and temperatures through batch fermentation (i.e., the Hohenheim biogas yield test (HBT)). With the application of the modified Gompertz model (MGM), an insight into their biodegradation kinetics at different digestion conditions will be provided. The potency or the half maximal inhibitory concentration (IC50) of the components at 37 °C and 53 °C can be evaluated through the estimated parameter maximum methane production rate of the MGM. Such tests will predict the suitability of utilizing the biorefineries’ side streams on a practical scale for biogas production, as well as their fate (concerning either their degradation or hampering of the process) in the biogas plants.
5-HMF process-wastewater was selected as a representative biorefinery byproduct in the current study. The individual test component representing the class furans included 5-HMF, furfural, and furfuryl alcohol, class weak acids comprised furoic acid, levulinic acid, and glycolic acid, whereas class phenols contained syringaldehyde, vanillin, and phenol. Similarly, the technique executed (HBT) is considered to be a high-efficiency batch anaerobic process employed for evaluating the BMP of different substrates and organic waste streams [34,35].

2. Materials and Methods

2.1. Batch Assays

The BMP of the test components was conducted via the HBT as per VDI-4630 standards [36]. In such a fermentation test, a 100 mL calibrated glass syringe, with a plunger and a capillary extension at either end, acts as a bioreactor, as shown in Figure 1.
The test substrate, along with the inoculum, is brought into the syringe sampler and is promptly sealed with the application of an inert lubricating material (Korasilon by Kurt Obermeier, Bad-Berleburg, Germany) to the plunger and by fastening a clamp to the silicone pipe, fitted onto the capillary extension. A thermostat-controlled climatic chamber (INE 700 by Memmert, Schwabach, Germany) equipped with a rotating drum is utilized for incubation, where the filled syringe samplers are fitted horizontally for proper mixing of the substrate with the inoculum. The produced biogas displaces the plunger, and the volume is read on the graduated scale daily. The said biogas is manually directed from the syringe sampler into a calibrated gas transducer (AGM 10 by Pronova, Berlin, Germany) for measuring the methane content. After the complete release of the biogas, the clamp is fastened and the sampler is brought back into the climatic chamber for further incubation.

2.2. Inoculum

Two distinctive seeding materials, thermophilic and mesophilic inocula, were utilized for the current study, where the former was obtained from a farm-scale thermophilic biogas plant in Isny, Germany, and the latter from a 400 L lab-scale mesophilic anaerobic reactor (37 °C) at the State Institute of Agricultural Engineering and Bioenergy in Hohenheim, Germany.
Prior to the trial initiation, the two inocula were mixed at a 1:1 ratio and were placed in water baths heated to 37 °C and 53 °C for two weeks to develop the respective microbial consortia and to degas the inoculum simultaneously. Moreover, to ensure a sufficiently active microbial population, a specific daily ration consisting of wheat meal, soybean extract, dry grounded maize silage, and rapeseed oil, was added into the inocula at an organic loading rate of 0.5 gVS/L d (Volatile Solid, in grams). A brief overview of the chemical and physical characteristics of the inocula, after their acclimatization at thermophilic and mesophilic temperatures, is provided in Table 1. The inoculum was filtered through a 1 mm sieve before its incorporation into the HBTs with the test components.

2.3. Stock Solution Preparation

Based on the composition of the full process-wastewater reported by Khan et al. [25], 5-HMF, furfural, levulinic acid, glycolic acid, and the process-wastewater were selected as test components for the current study along with intermediates of furfural decomposition, namely, furoic acid and furfuryl alcohol [37,38]. Phenolic compounds such as syringaldehyde, vanillin, and phenol were additionally selected. When using lignocellulosic biomass for 5-HMF synthesis, phenolics may be present in wastewater, originating from the thermochemical breakdown of lignin [39,40].
Stock solutions for the individual test components, including 5-HMF (99% purity, AVA Biochem, Muttenz, Switzerland), furfural (98% purity, Alfa Aesar, Kandel, Germany), furfuryl alcohol (98% purity, Sigma-Aldrich, Steinheim am Albuch, Germany), furoic acid (98% purity, Sigma-Aldrich, Steinheim am Albuch, Germany), levulinic acid (98% purity, Alfa Aeser, Kandel, Germany), glycolic acid (99% purity, Alfa Aeser, Kandel, Germany), phenol (≥95% purity, Merck, Darmstadt, Germany), and the full process-wastewater, were prepared based on techniques described by Khan et al. [25], wherein 6.67 gCOD (Chemical Oxygen Demand, in grams) of the individual test component was added into a 100 mL volumetric flask and diluted with distilled water to the 100 mL mark. The stock solutions were stored at 5 °C overnight.
Owing to the reduced solubility of 6.67 gCOD in 100 mL distilled water, syringaldehyde (98% purity, Sigma-Aldrich, Steinheim am Albuch, Germany) and vanillin (99% purity, Sigma-Aldrich, Steinheim am Albuch, Germany) were brought into the assays in their original form (solid). The properties of these components examined for their BMP are given in Table 2.

2.4. Experimental Design and Procedure

Four different concentrations (i.e., 2, 4, 6, and 8 gCOD/L) of the test components were investigated for their biodegradability at 37 °C and 53 °C for a period of sixty days. Each combination of temperature and component concentration was tested in triplicate.
In addition, to assess the accuracy of the current trial, hay and feed-concentrate (standard substrates), with known methane yields, were also subjected to their biodegradation under the aforementioned digestion conditions. To compute the methane produced from the test components and the standard substrates, the thermophilic and mesophilic inoculum, as a stand-alone variant (zero sample), was put through a similar process according to VDI 4630.
From the prepared stock solutions, 1.5, 3, 4.5, and 6 mL dilutions, containing 0.1, 0.2, 0.3, and 0.4 gCOD of the individual test components, were separately added to syringes containing 35 mL of either a mesophilic or thermophilic inoculum. For a uniform working volume of 50 mL per batch-test, the assays were balanced by adding distilled water, as specified in Table 3.
The test concentrations of syringaldehyde and vanillin were brought directly (as solids) to the mesophilic and thermophilic inoculum-holding assays, along with 15 mL of distilled water. The reference assays were prepared in a similar manner by incorporating 0.32 gVS of hay and feed-concentrate with 30 mL each of mesophilic and thermophilic inoculum.
The biogas measurements were performed when its amount exceeded 20 mL in the syringe sampler. For the quality measurement of the produced gas, the sampler was connected to the methane analyzer (AGM 10 by Pronova, Berlin, Germany) via a filter with Sicapent (Merck, Darmstadt ≥ 50% H2O absorption capacity). The analyzer, having the capacity to measure methane content in biogas within the range of 0% to 100 %, was calibrated before the measurements with test gas (60% CH4 + 40% CO2, Westfalen AG, Weissenhorn, Germany), and later flushed with ambient air.

2.5. Analyses of Recorded Data

The measured biogas volumes V (mL) were recalculated to standard temperature and pressure (STP) conditions (T0 = 273 K, p0 = 1013.25 hPa) using Equation (1) [36,41].
V 0 = V · ( p p w ) p 0 · T 0 T
where p (hPa) and pw (hPa) are the measured biogas pressure and the estimated vapor pressure at digestion temperature T (K), respectively. The standard biogas volume is represented by V0 (mL).
When performing the measurements, the biogas in the samplers was assumed to have cooled down by ~2 °C. Hence, the estimated vapor pressure for the assays at 37 °C and 53 °C were considered to be 58 hPa and 130 hPa, respectively.
To estimate the methane production kinetics, the modified Gompertz model (MGM), which describes the biodegradation of the organics as a function of microbial growth in the assays [42,43], as represented in Equation (2), was fitted to the measured cumulative methane yield of the test components.
Y = a · exp   { exp [   b · e a ( c t ) + 1   ]   }
where Y is cumulative methane produced (mL/gCOD) and t is time (d). a, b, and c are the kinetic parameters donating the maximum methane produced (mL/gCOD), the maximum daily methane production rate (mL/gCOD d), and the lag phase (d), respectively, with the Euler’s constant represented by e (=2.7183).
For the test components that exhibited a diauxic behavior, a two-phase Gompertz model (TGM), as described by Gomes et al. [44], and given as Equation (3) below, was fitted to their measured cumulative methane yields.
Y = i = 1 n ( a i   · exp   { exp [   b i · e a i   ( c i t ) + 1   ]   }   )
The preceding equation specifies the summation of the Gompertz functions fitted to the degradation pattern of the test component, starting from the initial phase (i = 1) to the final phase (n).
Statistical analysis (two-way ANOVA) of the measured specific methane yields (SMYs) of the individual test components was carried out with the Post-Hoc Tukey test at a significance level of α = 0.05. A tabulated summary of such analysis is provided as (Supplementary Material Tables S1–S4). Data processing, analysis, and visualization were conducted by implementing Microsoft Excel 2016, OriginPro 9.7, and Rstudio 4.1.2.

3. Results and Discussion

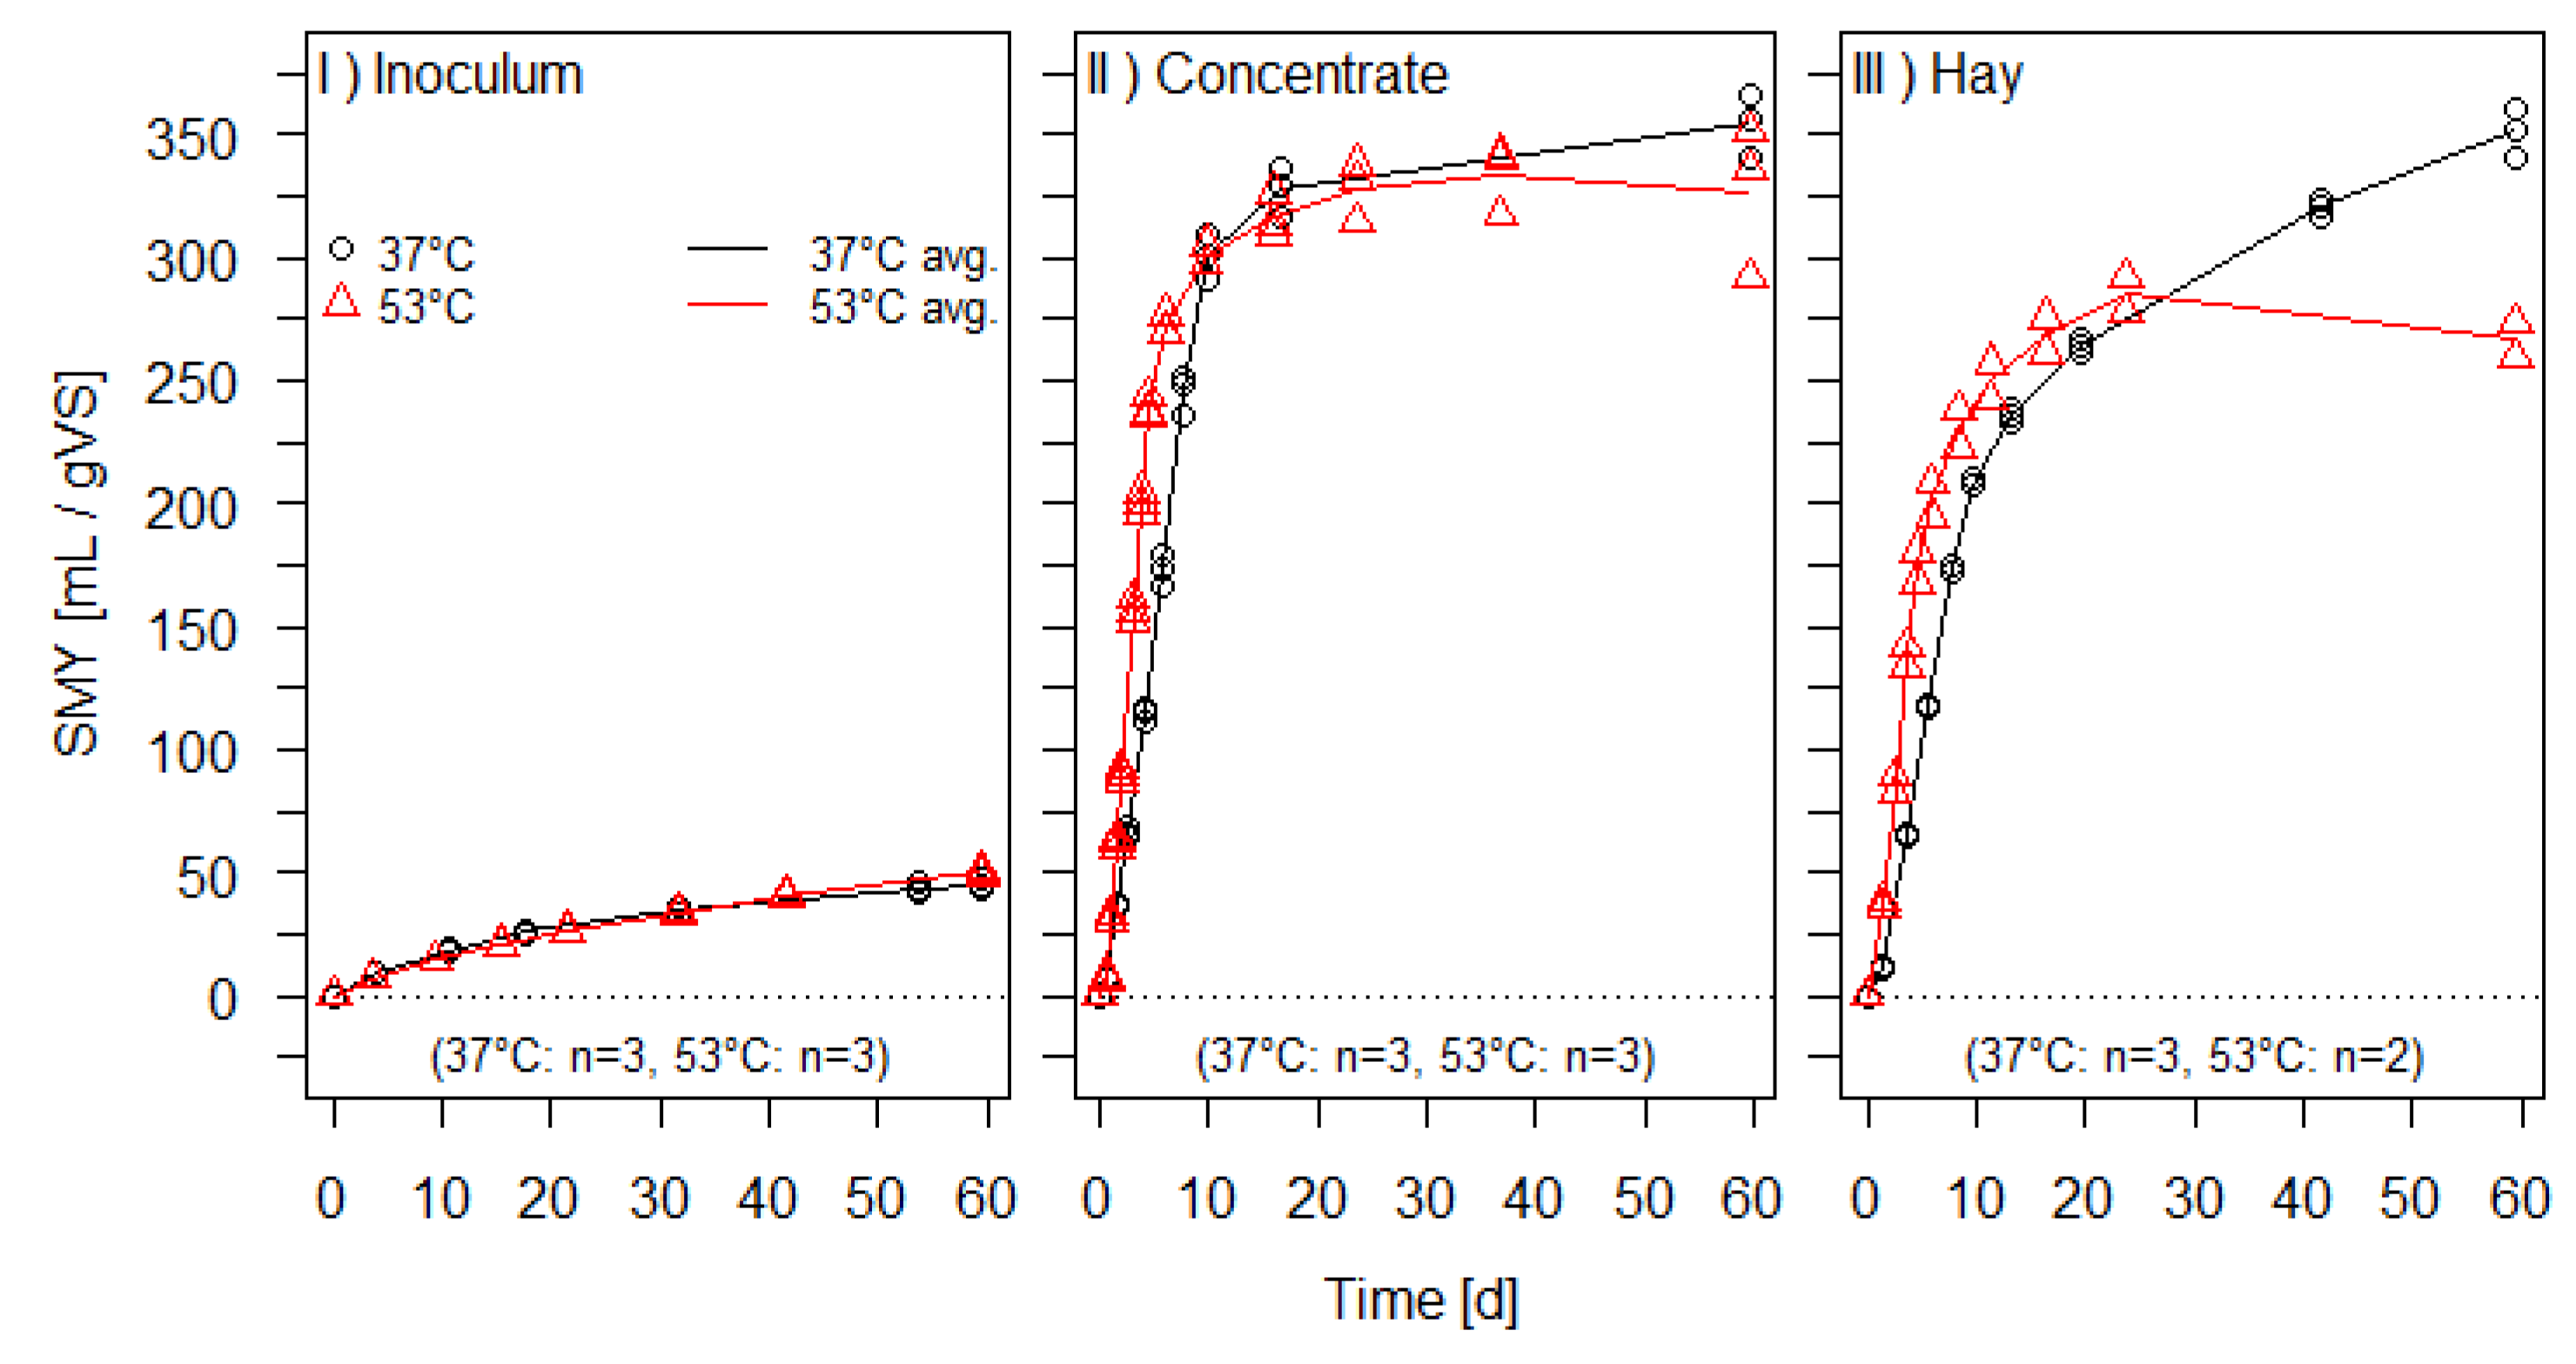
3.1. Control Substrates

Figure 2 represents the SMY for the inocula, feed-concentrate, and hay utilized as zero samples and standard substrates in the current study at 37 °C and 53 °C, respectively. The expected amount of the gas yields establishes hay and feed-concentrate as ideal candidates for standard substrates to assess the quality and soundness of the inoculum and digestion process, respectively [42]. The methane yields from the test components and the standard substrates were acquired by subtracting the methane yields of the zero samples from the inoculum-substrate mix assays’ gas yields.
Under the given digestion conditions, 0.4 g hay and 0.4 g feed-concentrate, each equivalent to 0.32 gVS added, yielded 115.1 ± 3.3 mL and 115.9 ± 4.1 mL methane at mesophilic temperatures. In contrast, the measured cumulative methane yields for the said substrates at the end of the trial, in thermophilic conditions, were 87.3 ± 3.4 mL and 107.9 ± 10.2 mL for the hay and feed-concentrate, respectively. Similarly, the corresponding mean cumulative methane yields for the zero samples at 37 °C and 53 °C were observed to be 87.6 ± 4.9 mL and 98.3 ± 2.5 mL, respectively. The SMYs for the standard substrates and the zero samples are given in Table 4.
Using a similar digestion technique (HBT), Huelsemann et al. [41] observed the SMYs at mesophilic temperature for feed-concentrate and hay to be in the range of 347–361 mL/gVS and 306–321 mL/gVS, respectively, by employing five different inocula sources individually. Hence, in the current study, the obtained SMYs for the aforementioned control substrates ratified the quality and reliability of the inocula used for the BMP of the test components via HBT.

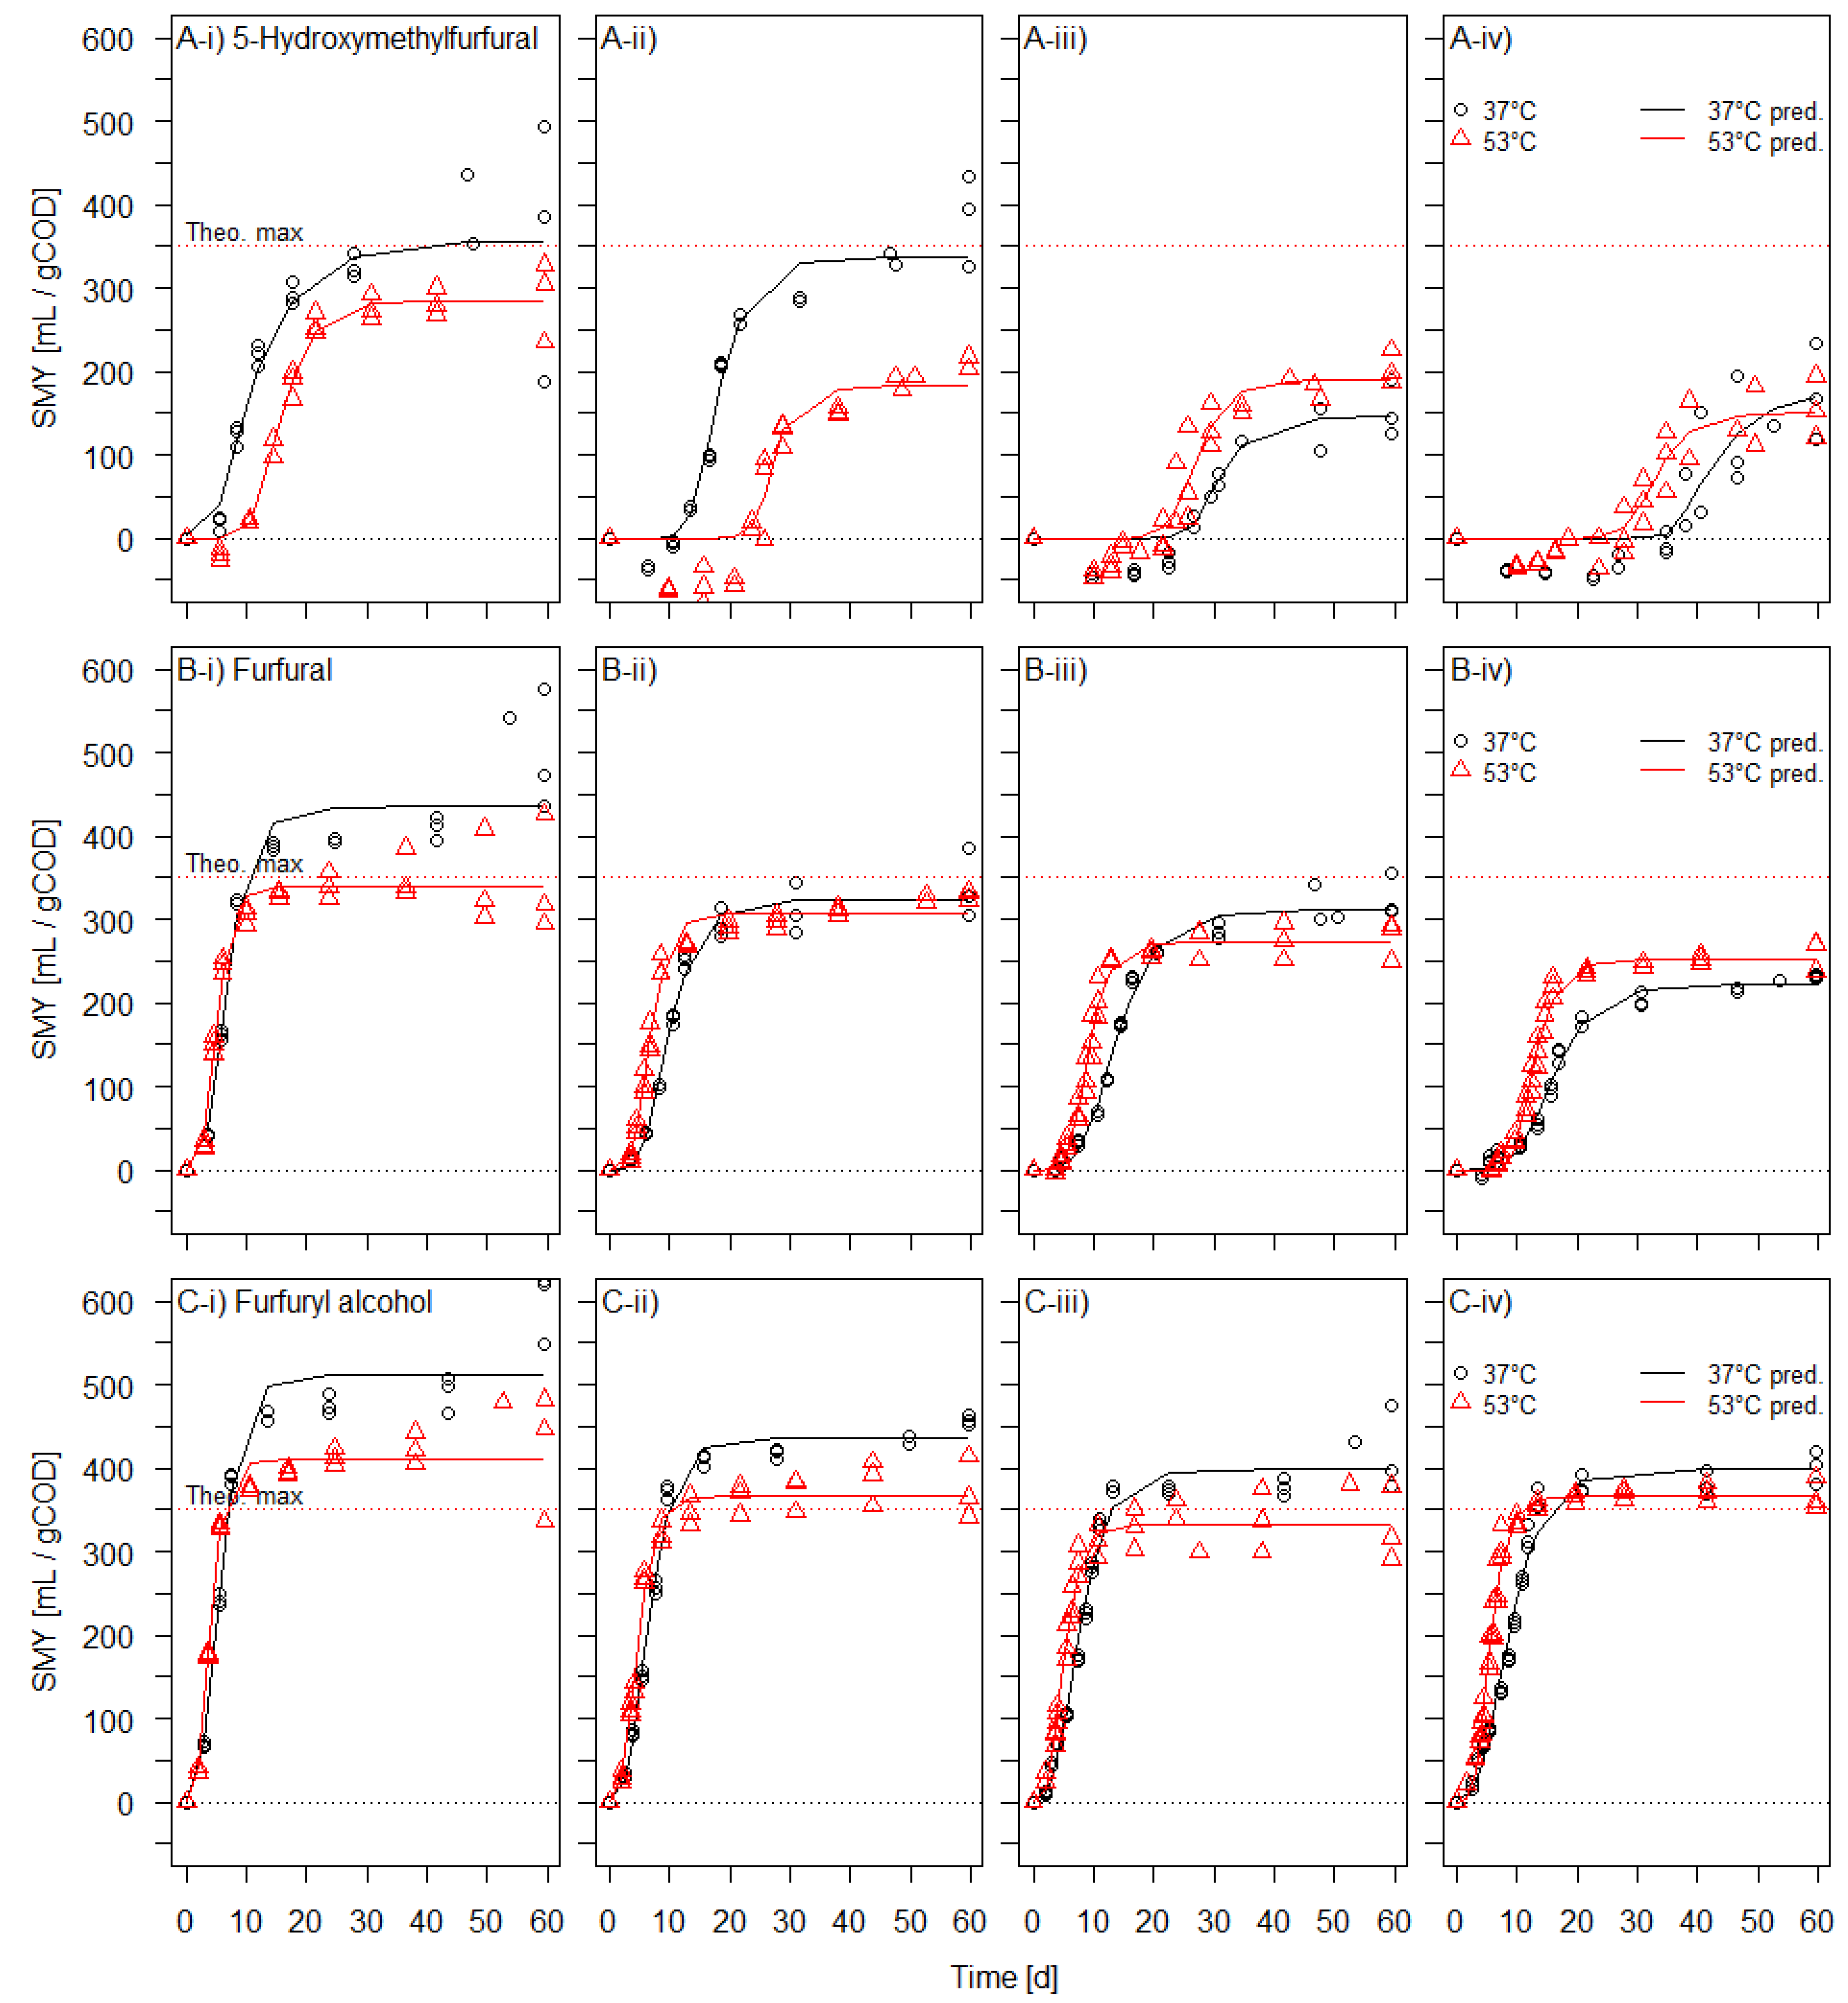
3.2. Furanic Compounds

Figure 3 depicts the biodegradation kinetics of the test components 5-HMF, furfural, and furfuryl alcohol, classified as furanic compounds in the current study, at their aforementioned test concentrations at 37 °C and 53 °C for a hydraulic retention time (HRT) of 60 days.
Under mesophilic conditions, 5-HMF and furfural at 2 gCOD/L concentration and 5-HMF at 4 gCOD/L concentration, exhibited an `overshoot’ where the mean SMYs surpassed their stoichiometric theoretical limits (i.e., 350 mL/gCOD). Such a trend continued to repeat for all the test concentrations of furfuryl alcohol at 37 °C and 53 °C (except for 6 gCOD/L at 53 °C). Nielfa et al. [45] attributed such tendencies to the synergistic effect that the test substrate and the inoculum jointly have upon each other when co-digested and can be determined when the ratio of the experimental yield to the theoretical yield of the test substrate exceeds the unity (>1). It can be assumed that the metabolites formed as a result of the test components (at low concentrations) and the inoculum interaction prompted such overshoots [46].
Moreover, the conversion of the furanic compounds to methane (in terms of SMY), at both operating temperatures, declined significantly when their per batch-test added amounts were increased (i.e., from 0.1 gCOD to 0.4 gCOD). Similar outcomes for the biodegradation of such toxicants were reported by a handful of researchers where reduced concentrations of the target components were effectively degraded by the microbial consortia while their increased concentrations either hampered or completely inhibited the anaerobic process [40,47]. Comprehensive mechanisms for the toxicity of the furans are still unknown; however, the presence of the aldehyde groups is presumed to cause or initiate their inhibitory traits [4,48].
As for the measured cumulative methane yield, BMP assays of furanic compounds put through mesophilic conditions outdid the thermophilic assays, apart from 5-HMF at 0.3 gCOD added (Figure 3A-iii), and furfural at 0.4 gCOD added (Figure 3B-iv). Ghimire et al. [18] and Ghasimi et al. [40] have described this phenomenon as being the result of volatile fatty acid (VFAs) accumulations, particularly propionate at the terminal phase of thermophilic AD, giving rise to process instability.
Even though furfural is described to be more inhibitory as compared to 5-HMF [49], under the present circumstances, it was found to be superior to 5-HMF in terms of its biodegradability and methane production potential. Such an outcome was in accordance with the observations made by Khan et al. [25], where the percent methane conversion for similar dosages of 5-HMF and furfural in a continuous process was reported to be around 59% and 73%, respectively.
Table 5 summarizes the mean methane yields for the given concentrations of 5-HMF, furfural, and furfuryl alcohol at 37°C and 53°C along with the estimated kinetic parameters and the model’s goodness of fit. Contrary to furfural and furfuryl alcohol, 5-HMF with its increased concentrations initially inhibited the AD which is characterized by longer lag phases estimated through the parameter `c´ of the MGM. Complete inhibition of the process by the furanic compounds at different test concentrations and temperature regimes did not occur. However, as observed, 5-HMF stood out to be a more recalcitrant compound in the current class of toxicants where the mean percent degradation for its highest loads tested (5.2 gVS/L or 8 gCOD/L) at 37°C and 53°C were 49.5% and 44.5% whereas for furfural (4.8 gVS/L) and furfuryl alcohol (4.4 gVS/L), they were 66% and 74%, and 114.8% and 104.8% at mesophilic and thermophilic temperatures respectively.
While investigating the inhibitory threshold of the furanic compounds on the methanogenesis via specific methanogenic activity (SMA) assays, Ghasimi et al. [40] found furfural and 5-HMF to be completely hampering the methanogenic archaea at individual concentrations of 2 gVS/L (furfural: 3.33 gCOD/L, 5-HMF: 3.05 gCOD/L), at thermophilic and mesophilic temperatures. Likewise, for Malik Badshah [50], 4 gVS/L furfural at 37 °C partially inhibited methanogenic activity (58% methanized), whereas 5-HMF at 6 gVS/L completely inhibited the AD process [49]. Similarly, Park et al. [51] observed retarded degradations of 5-HMF at 35°C at concentrations of 5 gCOD/L, with complete inhibition occurring at 10 gCOD/L. The retarded conversion was improved by increasing the cell biomass or the inoculum concentration in the bioreactors, but a complete hampering by the component at 10 gCOD/L persisted.
AD of furfural initiates with its reduction to furfuryl alcohol, which is documented to be less toxic in comparison to its parent material [11,52]. In the current trial, its rapid and robust degradation under the conditions provided, in conjunction with the overshoots, signified furfuryl alcohol as a docile component. Nonetheless, the percent deviation of SMYs from the theoretical limit decreased as their concentration per assay increased, which was calculated to be 70.6%, 30.7%, 19.0%, and 14.8% at 37 °C, and 20.4%, 6.6%, −6.1%, and 4.8% at 53 °C for 0.1, 0.2, 0.3, and 0.4 gCOD of added amounts of furfuryl alcohol per batch-test respectively.
During the anaerobic fermentation of furfural and furfuryl alcohol in a mesophilic CSTRs (Continuous Stirred Tank Reactors) system with furfural-acclimated inoculum, Rivard et al. [37] observed the bioconversion efficiency of furfural and furfuryl alcohol to be 78.5% and 93.5%, respectively, from their individually administered amounts of 0.735 g/d with 10 mL/d pretreated biomass liquor as base-feed. Such outcomes signify the anaerobic consortia’s tolerance to the furanic compound metabolites.

3.3. Acidic Compounds

Figure 4 represents the biodegradation kinetics of the acidic compounds, which include furoic acid, levulinic acid, and glycolic acid, at test concentrations of 2, 4, 6, and 8 gCOD/L under mesophilic and thermophilic temperatures for 60 days.
The mean measured SMYs at 37 °C and 53 °C for all the acidic compounds corresponding to their per batch-test added amount of 0.1 gCOD, besides glycolic acid at 53 °C, surpassed the theoretical methane production limit, as was the case for 5-HMF and furfural at 37 °C, and furfuryl alcohol at 37 °C and 53 °C. Such a degradation course affirms the effective detoxification of the hazardous components at their reduced concentrations than the increased concentrations [47].
Similar to furfuryl alcohol digested at 37 °C and 53 °C, furoic acid treated under mesophilic conditions displayed an exorbitant mean percent degradation for all the test concentrations i.e. 151.5%, 119%, 114.3%, and 105.7% for 2, 4, 6, and 8 gCOD/L concentrations, respectively, whereas under thermophilic conditions, it was calculated to be 109.4%, 82.2%, 74.1%, and 77.5% for the abovementioned concentrations, respectively. As stated earlier, metabolites of furfural are known to be less refractory than its precursor, and for furoic acid, it was observed to be as such, except on a couple of occasions where the furfural’s mean percent conversion to methane at 53 °C, for the concentrations at 2 gCOD/L and 4 gCOD/L were recorded to be 94.2% and 79.1%, respectively, compared with 82.2% and 74.1% for furoic acid. A likely cause for the low conversion of the furoic acid in the said batch assays could be the poor development and performance of the microbial aggregates responsible for converting the acid to its respective end intermediate acetate, or the final product methane.
According to Ran et al. [53], microbes display a greater affinity for furfuryl alcohol and HMF alcohol (2,5-Furandimethanol) than furoic acid and HMF acid (5-Hydroxymethyl-2-furoic acid). This was evident from the lower SMYs and longer lag phases of furoic acid (Table 6) in comparison to furfuryl alcohol at similar concentrations and temperatures (Table 5). Nonetheless, several bacterial species (e.g., Bacillus, Clostridium, and Desulfovibro genera) are identified to metabolize furoic acid and its precursors adequately [37,54].
Table 6 provides the mean methane yields of the acidic compounds for their test concentrations 2, 4, 6, and 8 gCOD/L at 37 °C and 53 °C, together with the MGM’s estimated kinetic parameters, the coefficient of determination (R2), and the mean absolute error (MAE). As estimated by the parameter `b´, the maximum daily methane yields in the thermophilic assays parallel to the mesophilic assays of levulinic acid were two to threefold higher, as specified in Table 6. Consequently, the degradation kinetics at 37 °C and 53 °C, for all the investigated concentrations of levulinic acid, appeared dissimilar from one another, as shown in Figure 4E-i–E-iv. Certain bacterial strains are known to utilize levulinic acid as a sole carbon source producing sugars, acetic acid, and propionic acid along their metabolic pathways [55,56]. Park et al. [57] employed these VFAs at 3 gCOD/L as feedstock separately with varying inoculum concentrations to investigate the inhibitory effect of levulinic acid at 35 °C and concluded the conversion of the target acid to be more sensitive in the presence of propionic acid than acetic acid. In the current scenario, the delayed conversion of levulinic acid can be attributed to immoderate propionate generation at 37 °C rather than 53 °C, which is known to have a slower degradation rate among short-chained VFAs [58].
Similar degradation patterns (inconsistent and delayed) for levulinic acid, in a continuous process at 43 °C, were also reported by Khan et al. [25], where the mean SMY for 0.5 gCOD of the component was recorded to be 274.67 mL/gCOD, accounting for 78.47% of methane conversion. Irrespective of the degradation routes, high removal percentages of levulinic acid (e.g., 89.2% and 96.3% for their highest loads at 37 °C and 53 °C, respectively) were also observed in the current trial.
Glycolic acid, chemically categorized as alpha-hydroxy acid, displayed a diauxic criterion at 53 °C, revealing a two-phase decomposition of the component for each test concentration [36]; therefore, a TGM was fitted to such digestion curves. In contrast, reproducible degradation patterns at 37 °C for the test concentrations above 2 gCOD/L, similar to levulinic acid, could not be achieved, as seen in Figure 4F-ii–F-iv. Nevertheless, MGM was fitted to their degradation kinetics. Such disparities observed within the replicates of the kinetics for similar test concentrations under the present conditions can be attributed to the slow and stunted microbial development in the assays. Krümpel et al. [59] have described alpha-hydroxy acid to be a slow methane-yielding substrate due to its association with a low microbial growth rate. As for the gas production potential under the present conditions, the SMY for glycolic acid dropped by 40.32% and 18.27% at 37 °C and 53 °C for the per batch-test added amounts of 0.1 gCOD and 0.4 gCOD respectively.
To the best of the authors’ knowledge, little to no information on the BMP of furoic acid and glycolic acid is available; therefore, further statements concerning its anaerobic digestion at this stage cannot be made. Although, stoichiometrically furoic acid can be transformed into 45% methane and 55% carbon dioxide, whereas glycolic acid into 37.5% methane and 62.5% carbon dioxide [60].

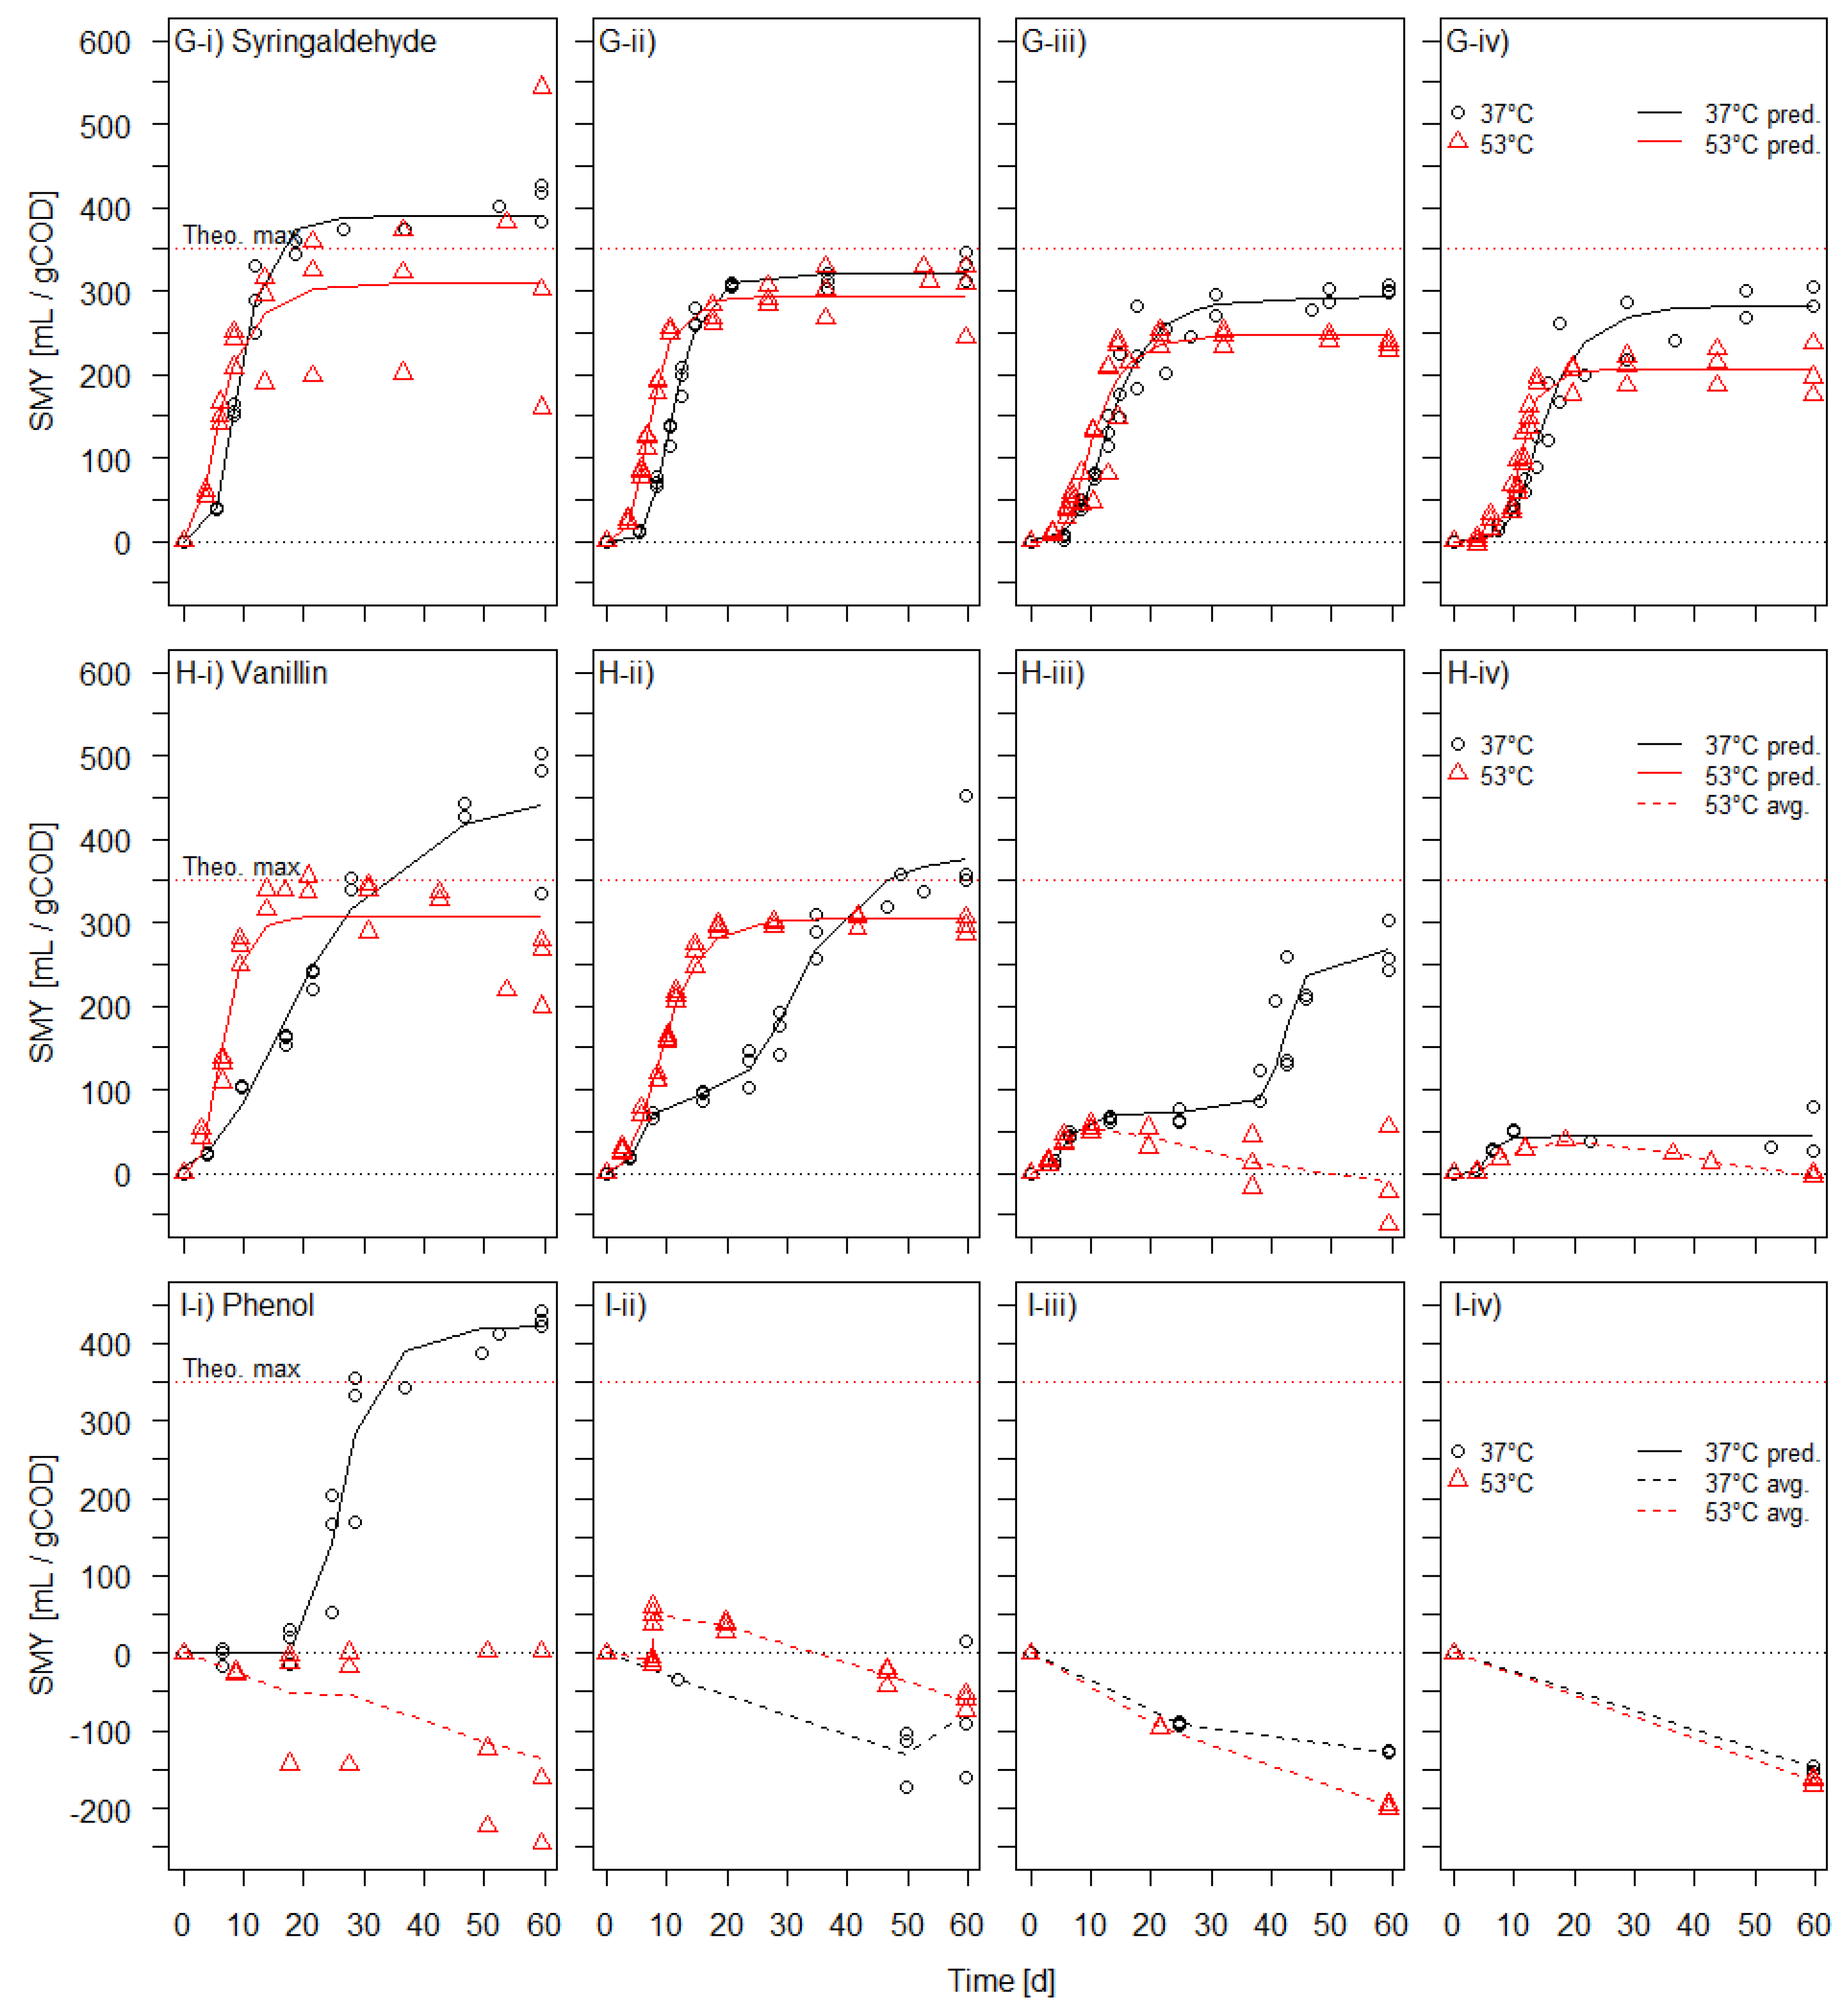
3.4. Phenolic Compounds

The temporal progression of methane production from syringaldehyde, vanillin, and phenol at 37 °C and 53 °C for the given test concentrations are shown in Figure 5, whereas their respective methane yields, kinetic parameters, and the model’s goodness of fit are summarized in Table 7.
On this occasion, overshoots for the lowest amount of phenolic compounds examined were observed for the batch assays treated at 37 °C only where the mean supplementary methane produced for syringaldehyde, vanillin, and phenol were 17%, 25.5%, and 23% of their theoretical thresholds, respectively. On the contrary, the mean percent conversion at 53 °C for 2 gCOD/L syringaldehyde and vanillin were evaluated to be 95.7% and 71%, respectively, whereas phenol completely inhibited the inoculum.
As expected, the mean measured SMY of the aromatic aldehydes dropped remarkably with the rise in test concentrations at both operating temperatures and was observed to be prominent under thermophilic conditions. No inhibition for syringaldehyde for all of its test concentrations at 37 °C and 53 °C, was detected. The mean measured SMYs for its highest loads were evaluated to be 293.1 ± 15.2 mL/gCOD and 202.9 ± 31.4 mL/gCOD, representing a decrease of 28.3% and 39.4%, compared with its initial concentrations examined at mesophilic and thermophilic states, respectively. Moreover, at loading rates of 6 gCOD/L and 8 gCOD/L, vanillin at the onset produced minute amounts of methane under thermophilic conditions but entered an inhibitory mode at the end of the trial phase. Furthermore, 0.2 gCOD and 0.3 gCOD per batch-test added amounts of vanillin under mesophilic conditions displayed a two-phase degradation pattern. The initial digestion phase can be presumed to be the acidogenesis phase, where VFAs were accumulated, and the latter methanogenesis phase, where the accumulated acids were transformed into methane [44]. Therefore, it can plausibly be assumed that the 53.1 ± 36.2 mL/gCOD methane produced from 8 gCOD/L of vanillin originated from the initial digestion phase of the said component under mesophilic conditions, which accounts for 15.2% of its conversion to methane. To our knowledge, such biodegradation kinetics for vanillin have not been previously reported.
Inhibitory traits of phenolic compounds are more pronounced with lower molar mass and vice versa [49]. This was apparent in the findings of Barakat et al. [61] when syringaldehyde and vanillin, at 2 gVS/L each, produced 78% and 17% methane, respectively, in regard to their theoretical limits. Furthermore, the said author co-digested the aromatic aldehydes separately with xylose on a 1:1 mass-based ratio and observed the methane production of syringaldehyde + xylose to be approximately 1.4 times higher than the xylose-contained reference assay (290 mL/gVS). Conversely, for vanillin + xylose, the conversion was 225 mL/gVS, implying the hampering of xylose degradation by vanillin. In another study, Zaldivar et al. [62] examined the impacts of selected aldehydes on the growth and fermentation of E.coli by evaluating their potencies at different concentration levels (g/L). With an incubation period of 48 h, the IC25, IC50, and IC100 (concentrations inhibiting 25%, 50%, and 100% of the population) for syringaldehyde were estimated to be 0.6, 1.2, and 2.5 against 0.5, 0.9, and 1.5 for vanillin, respectively. Toxicities of such components, according to Palmqvist et al. [33], are not only associated with their molar masses but with their hydrophobicity too. By measuring the hydrophobicity (LogPoctanol/water) of syringaldehyde (0.99) and vanillin (1.21), the outcomes by Zaldivar et al. [62] were in agreement with the aforesaid statement.
As for phenol, it was found to be the most potent component in the current trial as it inhibited the whole process under the given digestion conditions, other than the one described above. Fang et al. [63] highlighted two degradation routes that phenol adapts (i.e., via benzoate to VFAs and caproate to acetate), where the initial pathway occurs at mesophilic and thermophilic temperatures, and the latter at thermophilic temperatures. Necessary enzymes, including benzoyl-CoA, involved in ring reduction and the cleavage of phenol [64] are inactivated by higher temperatures [65], which, in the current experiment may have caused the full inhibition of the process at 53 °C for all of the phenol concentrations tested, assuming the initial degradation course in the assays. The bioconversion of phenol is recommended to be performed at a moderate temperature, as most of the substances degrading consortia are mesophilic [66]. Under the current circumstances though, this was apparent only for phenol examined at a 2 gCOD/L loading rate. Perhaps a prolonged acclimatization phase was required for the microbial aggregates to convert the increased concentration of phenols at 37 °C, judging by their slight recovery at day 50, as seen in Figure 5I-ii. Nevertheless, phenol is considered to be one of the most notorious inhibitors [67], and this study has demonstrated this accordingly.
Degradation dynamics of the increased phenol concentrations in the anaerobic process are presented by Chapleur et al. [68]. With an HRT of 140 days and 2.7 g/L cellulose as a test substrate, phenol, with its most reduced concentrations (0.01 g/L–0.1 g/L) was completely degraded within the first 20 days of incubation in batch assays, whereas the mid-range concentrations (0.5 g/L and 1 g/L) required almost 60 days. High concentrations, such as 2 g/L and 4 g/L, hampered the process, whereas for 1.5 g/L phenol, a lag phase of 40 days and a removal percentage of 82% were observed. Adopting a similar methodology on a different substrate (mashed biowaste), Simon et al. [69] observed the general bioconversion pattern and the arrest of the anaerobic process in the presence of 0.10 g/L–5 g/L phenol for 200 days to be somewhat alike to Chapleur et al. [68] and evaluated the IC50 of the toxin at the mesophilic condition to be 1.25 g/L.

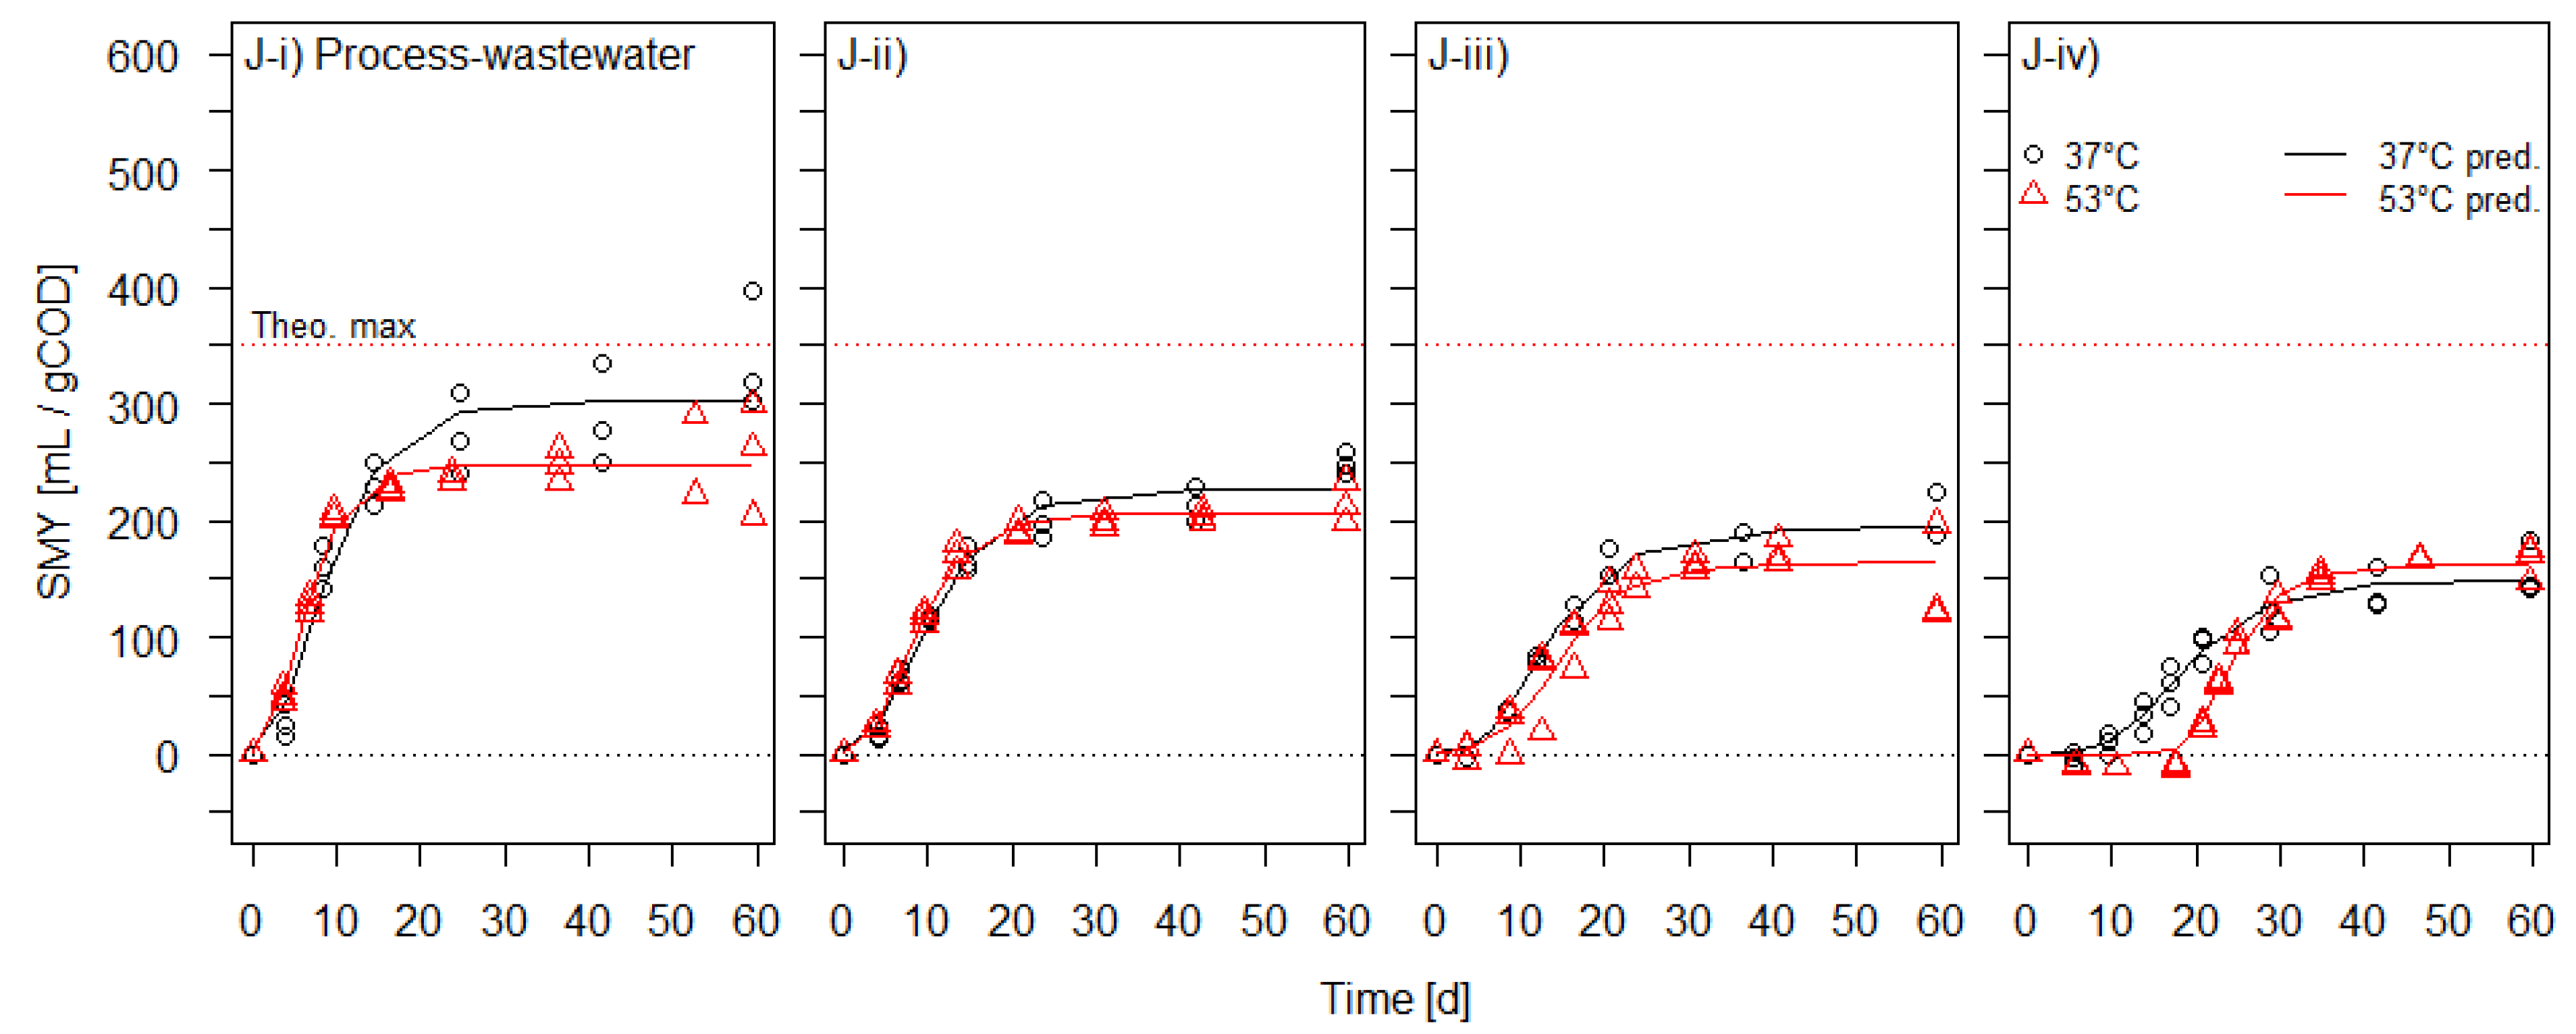
3.5. Process-wastewater

Degradation kinetics, methane yields, and the kinetic parameters for the 5-HMF process-wastewater digested at 37 °C and 53 °C are provided in Figure 6, and Table 8 and Table 9, respectively.
The process-wastewater was observed to be the only test component that did not display a mean overshoot for its lowest load (2 gCOD/L or 28.5 gVS/L) under mesophilic conditions. Nevertheless, its average percent degradation to methane was evaluated to be 96.93%, next to 72.8% at 53 °C. Moreover, as anticipated, the conversion of the process-wastewater to methane decreased with the increase in loading rate per HBT assay and was computed to be 71.1%, 58.9%, and 44.5% for 57.06, 85.6, and 114.12 gVS/L at 37 °C, respectively. As with furanic compounds, the thermophilic assays containing the process-wastewater underperformed relative to their counterparts for the SMYs at similar concentrations, apart from the HBT with the highest load. Ultimately, the measured SMYs for the thermophilic assays were shy of 27.2%, 38.7%, 58.1%, and 53.1% from their theoretical potential for the examined concentrations of 2, 4, 6, and 8 gCOD/L, respectively.
The present investigation into process-wastewater for its BMP concerned an amalgam of furans (5-HMF and furfural) and weak acids (formic acid, acetic acid, glycolic acid, lactic acid, and levulinic acid) and its limited biodegradation with increased concentrations may have originated from their synergistic effect (concerning inhibition) on the anaerobic process [11]. The potency of such aqueous materials on the anaerobic consortia elevates further when 5-HMF and furfural coexist in the fed substrate. This was evident in the findings of Taherzadeh et al. [70], wherein the sum of 5-HMF and the furfural concentration exceeding 2 g/L strongly reduced the fermentation rates. Furthermore, carboxylic acids (undissociated form) are known to function interactively with other inhibitors in suppressing the fermentation process [31,70]. Similarly, alpha-hydroxy acids are being described as slow methane-yielding components [59], which, in such a case, might be coupled to their lag phase, as prolonged lag phases, according to Park et al. [51], can eventually lead to the significant deterioration of the digestion process.
With 14.8 g/L, 5-HMF was identified to be the main component of the process-wastewater, constituting 30.1% of its DOC (28.17 g/L), whereas the other components occupied 31% combined. As outlined by Ghasimi et al. [40], the conversion of 5-HMF proceeds after the complete degradation of furfural only when the latter is present at a lower concentration. Therefore, it can be postulated for the decomposition of the process-wastewater in the current setup to be initiated with the conversion of its minor-concentration constituents, followed by the major-concentration constituents. Thus, the reduced biodegradability of the process-wastewater, with extended lag phases at high loads under mesophilic and thermophilic conditions, could be at the behest of the increased concentration of 5-HMF in the assays.
5-HMF-containing aqueous material generated during the HTC of chicory roots and maize silage digestate were investigated for their BMP via HBT by Stökle et al. [12] and Cao et al. [43], respectively. With approximately 3 gVS per assay of the respective substrates, a SMY of 244 mL/gCOD, for either feedstock, at 37 °C was observed. For a similar concentration, a mean methane yield of 249 mL/gCOD for 5-HMF process-wastewater at 37 °C was recorded. 5-HMF though comprised a minor fraction (0.6 g/L–0.7 g/L) of the aqueous material of the abovementioned authors.
Based on the substantial proportion of 5-HMF in the process-wastewater and the degradation kinetics observed (Figure 3A-i–A-iv), it is plausible to assume that the overall inhibitory characteristics of the said process-wastewater to be governed by the 5-HMF.
It is worth mentioning that the 5-HMF process-wastewater acquired from the biorefinery specializes in the synthesis of 5-HMF and its subsequent refinement. The excessive concentration of 5-HMF in the wastewater are retentates, residuals, or rejects generated during the filtration processes of the crude 5-HMF.

4. Conclusions

Batch anaerobic digestion of the typical constituents (furans, weak acids, and phenols) of a biorefinery’s process-wastewater at their lowest concentrations displayed a stimulatory effect on methane production under mesophilic conditions. Increasing the test components’ concentrations in the assays resulted in diminishing methane conversion at both operating temperatures of 37 °C and 53 °C. Moreover, the mesophilic assays containing the test components were not on par with their counterparts (thermophilic assays) for the mean measured SMYs at similar concentrations. Within the furanic compounds, 5-HMF appeared to be the most refractory component. Similarly, the degradation patterns of weak acids such as levulinic acid and glycolic acid were characterized by disparities and inconsistencies existing within the replicates for similar concentrations, which was profoundly true at 37 °C. Furthermore, two of the test components, glycolic acid and vanillin, exhibited a diauxic criterion elucidating the complexities in their anaerobic decomposition. Ultimately, test components that impaired the anaerobic process under mesophilic and thermophilic conditions with their increased concentrations were identified to be the two phenolic compounds, phenol and vanillin, and one furan, 5-HMF.
In the current study, the poor performance of the 5-HMF process-wastewater as a substrate is considered to be associated with the presence of the exceptional concentration of 5-HMF in the said process-wastewater, which is assumed to be dictating its overall characteristics. This feature might exclusively grade the 5-HMF process-wastewater as being a risky feedstock unless proper remedial measures are applied, such as increasing the microbial cell biomass concentration, bioaugmentation, or photodissociation, among others.

Supplementary Materials

The following supporting information can be downloaded at: https://www.mdpi.com/article/10.3390/fermentation8100476/s1, Table S1: Two-way ANOVA analysis for the furanic compounds at α = 0.05; Table S2: Two-way ANOVA analysis for the acidic compounds at α = 0.05; Table S3: Two-way ANOVA analysis for the phenolic compounds at α = 0.05; Table S4: Two-way ANOVA analysis for the process-wastewater at α = 0.05.

Author Contributions

Conceptualization, M.T.K., J.K. and A.L.; Methodology, M.T.K., J.K., H.O. and A.L.; Validation, M.T.K., J.K., B.H., H.O. and A.L.; Formal analysis, M.T.K., B.H., J.K. and D.W.; Investigation, M.T.K. and J.K.; Resources, D.W., B.H. and H.O.; Data curation, M.T.K. and B.H.; Writing—Original Draft Preparation, M.T.K.; Writing—Review and Editing, M.T.K., B.H. and J.K.; Visualization, M.T.K., J.K., B.H. and A.L.; Supervision, J.K. and A.L.; Project administration, J.K.; Funding acquisition, A.L. All authors have read and agreed to the published version of the manuscript.

Funding

The GRACE project has received funding from the Bio-based Industries Joint Undertaking (JU) under the European Union’s Horizon 2020 research and innovation program under grant agreement No 745012. The JU receives support from the European Union’s Horizon 2020 research and innovation program and the Bio-based Industries Consortium.

Institutional Review Board Statement

Not applicable.

Informed Consent Statement

Not applicable.

Data Availability Statement

Not applicable.

Acknowledgments

The authors would like to thank our project partners Stefan Krawielitzki and Gilbert Anderer from AVA Biochem BSL AG, for providing the necessary resources for our current and subsequent research.

Conflicts of Interest

The authors declare no conflict of interest.

Abbreviations:

ADanaerobic digestion
BMPbiochemical methane potential
CODchemical oxygen demand
DOCdissolved organic carbon
5-HMF5-hydroxymethylfurfural
FMfresh mass
HBTHohenheim biogas yield test
HTChydrothermal carbonization
HRThydraulic retention time
HTLhydrothermal liquefaction
IC50half maximal inhibitory concentration
MAEmean absolute error
MGMmodified Gompertz model
SMYspecific methane yield
TCCthermochemical conversion
TGMtwo-phase Gompertz model
TStotal solids
VDIassociation of German engineers
VFAvolatile fatty acid
VSvolatile solids

References

  1. Kucherov, F.A.; Romashov, L.V.; Galkin, K.I.; Ananikov, V.P. Chemical Transformations of Biomass-Derived C6-Furanic Platform Chemicals for Sustainable Energy Research, Materials Science, and Synthetic Building Blocks. ACS Sustain. Chem. Eng. 2018, 6, 8064–8092. [Google Scholar] [CrossRef]
  2. Kohli, K.; Prajapati, R.; Sharma, B.K. Bio-Based Chemicals from Renewable Biomass for Integrated Biorefineries. Energies 2019, 12, 233. [Google Scholar] [CrossRef]
  3. Krawielitzki, S.; Kläusli, T.M. Modified Hydrothermal Carbonization Process for Producing Biobased 5-HMF Platform Chemical. Ind. Biotechnol. 2015, 11, 6–8. [Google Scholar] [CrossRef]
  4. Wang, Y.; Brown, C.A.; Chen, R. Industrial production, application, microbial biosynthesis and degradation of furanic compound, hydroxymethylfurfural (HMF). AIMS Microbiol. 2018, 4, 261–273. [Google Scholar] [CrossRef] [PubMed]
  5. Bozell, J.J.; Petersen, G.R. Technology development for the production of biobased products from biorefinery carbohydrates—The US Department of Energy’s “Top 10” revisited. Green Chem. 2010, 12, 539–554. [Google Scholar] [CrossRef]
  6. Van Putten, R.-J.; Van Der Waal, J.C.; De Jong, E.; Rasrendra, C.B.; Heeres, H.J.; De Vries, J.G. Hydroxymethylfurfural, A Versatile Platform Chemical Made from Renewable Resources. Chem. Rev. 2013, 113, 1499–1597. [Google Scholar] [CrossRef] [PubMed]
  7. Świątek, K.; Olszewski, M.P.; Kruse, A. Continuous synthesis of 5-hydroxymethylfurfural from biomass in on-farm biorefinery. GCB Bioenergy 2022, 14, 681–693. [Google Scholar] [CrossRef]
  8. Yu, I.K.M.; Tsang, D.C.W. Conversion of biomass to hydroxymethylfurfural: A review of catalytic systems and underlying mechanisms. Bioresour. Technol. 2017, 238, 716–732. [Google Scholar] [CrossRef]
  9. Steinbach, D.; Klier, A.; Kruse, A.; Sauer, J.; Wild, S.; Zanker, M. Isomerization of Glucose to Fructose in Hydrolysates from Lignocellulosic Biomass Using Hydrotalcite. Processes 2020, 8, 644. [Google Scholar] [CrossRef]
  10. Moreau, C.; Belgacem, M.N.; Gandini, A. Recent Catalytic Advances in the Chemistry of Substituted Furans from Carbohydrates and in the Ensuing Polymers. Top. Catal. 2004, 27, 11–30. [Google Scholar] [CrossRef]
  11. Si, B.; Li, J.; Zhu, Z.; Shen, M.; Lu, J.; Duan, N.; Zhang, Y.; Liao, Q.; Huang, Y.; Liu, Z. Inhibitors degradation and microbial response during continuous anaerobic conversion of hydrothermal liquefaction wastewater. Sci. Total Environ. 2018, 630, 1124–1132. [Google Scholar] [CrossRef]
  12. Stökle, K.; Hülsemann, B.; Steinbach, D.; Cao, Z.; Oechsner, H.; Kruse, A. A biorefinery concept using forced chicory roots for the production of biogas, hydrochar, and platform chemicals. Biomass Convers. Biorefinery 2021, 11, 1453–1463. [Google Scholar] [CrossRef]
  13. Ubando, A.T.; Felix, C.B.; Chen, W.-H. Biorefineries in circular bioeconomy: A comprehensive review. Bioresour. Technol. 2020, 299, 122585. [Google Scholar] [CrossRef]
  14. Leong, H.Y.; Chang, C.-K.; Khoo, K.S.; Chew, K.W.; Chia, S.R.; Lim, J.W.; Chang, J.-S.; Show, P.L. Waste biorefinery towards a sustainable circular bioeconomy: A solution to global issues. Biotechnol. Biofuels 2021, 14, 87. [Google Scholar] [CrossRef]
  15. de Jong, E.; Higson, A.; Walsh, P.; Wellisch, M. Bio-based Chemicals Value Added Products from Biorefineries. IEA Bioenergy Task42 Biorefinery 2012, 34, 1–36. [Google Scholar]
  16. Dittmer, C.; Krümpel, J.; Lemmer, A. Power demand forecasting for demand-driven energy production with biogas plants. Renew. Energy 2021, 163, 1871–1877. [Google Scholar] [CrossRef]
  17. Dias, M.E.; Oliveira, G.H.D.; Couto, P.T.; Dussán, K.J.; Zaiat, M.; Ribeiro, R.; Stablein, M.J.; Watson, J.T.; Zhang, Y.; Tommaso, G. Anaerobic digestion of hydrothermal liquefaction wastewater from spent coffee grounds. Biomass Bioenergy 2021, 148, 106030. [Google Scholar] [CrossRef]
  18. Ghimire, N.; Bakke, R.; Bergland, W.H. Thermophilic Methane Production from Hydrothermally Pretreated Norway Spruce (Picea abies). Appl. Sci. 2020, 10, 4989. [Google Scholar] [CrossRef]
  19. van der Wijst, C.; Ghimire, N.; Bergland, W.H.; Toven, K.; Bakke, R.; Eriksen, Ø. Improving carbon product yields in biocarbon production by combining pyrolysis and anaerobic digestion. BioResources 2021, 16, 3964–3977. [Google Scholar] [CrossRef]
  20. Erdogan, E.; Atila, B.; Mumme, J.; Reza, M.T.; Toptas, A.; Elibol, M.; Yanik, J. Characterization of products from hydrothermal carbonization of orange pomace including anaerobic digestibility of process liquor. Bioresour. Technol. 2015, 196, 35–42. [Google Scholar] [CrossRef]
  21. Marin-Batista, J.D.; Villamil, J.A.; Qaramaleki, S.V.; Coronella, C.J.; Mohedano, A.F.; de la Rubia, M.A. Energy valorization of cow manure by hydrothermal carbonization and anaerobic digestion. Renew. Energy 2020, 160, 623–632. [Google Scholar] [CrossRef]
  22. Ipiales, R.P.; Mohedano, A.F.; Diaz, E.; de la Rubia, M.A. Energy recovery from garden and park waste by hydrothermal carbonisation and anaerobic digestion. Waste Manag. 2022, 140, 100–109. [Google Scholar] [CrossRef]
  23. Lucian, M.; Volpe, M.; Merzari, F.; Wüst, D.; Kruse, A.; Andreottola, G.; Fiori, L. Hydrothermal carbonization coupled with anaerobic digestion for the valorization of the organic fraction of municipal solid waste. Bioresour. Technol. 2020, 314, 123734. [Google Scholar] [CrossRef]
  24. Kambo, H.S.; Minaret, J.; Dutta, A. Process Water from the Hydrothermal Carbonization of Biomass: A Waste or a Valuable Product? Waste Biomass Valorization 2018, 9, 1181–1189. [Google Scholar] [CrossRef]
  25. Khan, M.T.; Krümpel, J.; Wüst, D.; Lemmer, A. Anaerobic Degradation of Individual Components from 5-Hydroxymethylfurfural Process-Wastewater in Continuously Operated Fixed Bed Reactors. Processes 2021, 9, 677. [Google Scholar] [CrossRef]
  26. Ipiales, R.P.; de la Rubia, M.A.; Diaz, E.; Mohedano, A.F.; Rodriguez, J.J. Integration of Hydrothermal Carbonization and Anaerobic Digestion for Energy Recovery of Biomass Waste: An Overview. Energy Fuels 2021, 35, 17032–17050. [Google Scholar] [CrossRef]
  27. Ghimire, N.; Bakke, R.; Bergland, W.H. Liquefaction of lignocellulosic biomass for methane production: A review. Bioresour. Technol. 2021, 332, 125068. [Google Scholar] [CrossRef]
  28. De la Rubia, M.A.; Villamil, J.A.; Rodriguez, J.J.; Mohedano, A.F. Effect of inoculum source and initial concentration on the anaerobic digestion of the liquid fraction from hydrothermal carbonisation of sewage sludge. Renew. Energy 2018, 127, 697–704. [Google Scholar] [CrossRef]
  29. Almeida, J.R.M.; Modig, T.; Petersson, A.; Hähn-Hägerdal, B.; Lidén, G.; Gorwa-Grauslund, M.F. Increased tolerance and conversion of inhibitors in lignocellulosic hydrolysates by Saccharomyces cerevisiae. J. Chem. Technol. Biotechnol. 2007, 82, 340–349. [Google Scholar] [CrossRef]
  30. McCarty, P.L. Anaerobic Waste Treatment Fundamentals, Part 3: Toxic materials and their control. Public Work. 1964, 95, 91–94. [Google Scholar]
  31. Ibraheem, O.; Ndimba, B.K. Molecular Adaptation Mechanisms Employed by Ethanologenic Bacteria in Response to Lignocellulose-derived Inhibitory Compounds. Int. J. Biol. Sci. 2013, 9, 598–612. [Google Scholar] [CrossRef] [PubMed]
  32. Almeida, J.R.M.; Bertilsson, M.; Gorwa-Grauslund, M.F.; Gorsich, S.; Lidén, G. Metabolic effects of furaldehydes and impacts on biotechnological processes. Appl. Microbiol. Biotechnol. 2009, 82, 625–638. [Google Scholar] [CrossRef] [PubMed]
  33. Palmqvist, E.; Hahn-Hägerdal, B. Fermentation of lignocellulosic hydrolysates. II: Inhibitors and mechanisms of inhibition. Bioresour. Technol. 2000, 74, 25–33. [Google Scholar] [CrossRef]
  34. Helffrich, D.; Oechsner, H. The Hohenheim biogas yield test: Comparison of different laboratory techniques for the digestion of biomass. Agrartech. Forsch. 2003, 9, 27–30. [Google Scholar]
  35. Mittweg, G.; Oechsner, H.; Hahn, V.; Lemmer, A.; Reinhardt-Hanisch, A. Repeatability of a laboratory batch method to determine the specific biogas and methane yields. Eng. Life Sci. 2012, 12, 270–278. [Google Scholar] [CrossRef]
  36. VDI. VDI 4630–Fermentation of organic materials: Characterization of the substrate, sampling, collection of material data, fermentation tests. In VDI-Handbuch Energietechnik; Beuth Verlag GmbH: Berlin, Germany, 2006; pp. 44–59. [Google Scholar]
  37. Rivard, C.J.; Grohmann, K. Degradation of furfural (2-furaldehyde) to methane and carbon dioxide by an anaerobic consortium. Appl. Biochem. Biotechnol. 1991, 28–29, 285–295. [Google Scholar] [CrossRef]
  38. Boopathy, R.; Daniels, L. Isolation and characterization of a furfural degrading sulfate-reducing bacterium from an anaerobic digester. Curr. Microbiol. 1991, 23, 327–332. [Google Scholar] [CrossRef]
  39. Götz, M.; Rudi, A.; Heck, R.; Schultmann, F.; Kruse, A. Processing Miscanthus to high-value chemicals: A techno-economic analysis based on process simulation. GCB Bioenergy 2022, 14, 447–462. [Google Scholar] [CrossRef]
  40. Ghasimi, D.S.M.; Aboudi, K.; de Kreuk, M.; Zandvoort, M.H.; van Lier, J.B. Impact of lignocellulosic-waste intermediates on hydrolysis and methanogenesis under thermophilic and mesophilic conditions. Chem. Eng. J. 2016, 295, 181–191. [Google Scholar] [CrossRef]
  41. Hülsemann, B.; Zhou, L.; Merkle, W.; Hassa, J.; Müller, J.; Oechsner, H. Biomethane Potential Test: Influence of Inoculum and the Digestion System. Appl. Sci. 2020, 10, 2589. [Google Scholar] [CrossRef]
  42. Chala, B.; Oechsner, H.; Müller, J. Introducing Temperature as Variable Parameter into Kinetic Models for Anaerobic Fermentation of Coffee Husk, Pulp and Mucilage. Appl. Sci. 2019, 9, 412. [Google Scholar] [CrossRef]
  43. Cao, Z.; Hülsemann, B.; Wüst, D.; Illi, L.; Oechsner, H.; Kruse, A. Valorization of maize silage digestate from two-stage anaerobic digestion by hydrothermal carbonization. Energy Convers. Manag. 2020, 222, 113218. [Google Scholar] [CrossRef]
  44. Gomes, C.S.; Strangfeld, M.; Meyer, M. Diauxie Studies in Biogas Production from Gelatin and Adaptation of the Modified Gompertz Model: Two-Phase Gompertz Model. Appl. Sci. 2021, 11, 1067. [Google Scholar] [CrossRef]
  45. Nielfa, A.; Cano, R.; Vinot, M.; Fernández, E.; Fdz-Polanco, M. Anaerobic digestion modeling of the main components of organic fraction of municipal solid waste. Process Saf. Environ. Prot. 2015, 94, 180–187. [Google Scholar] [CrossRef]
  46. Nielfa, A.; Cano, R.; Fdz-Polanco, M. Theoretical methane production generated by the co-digestion of organic fraction municipal solid waste and biological sludge. Biotechnol. Rep. 2015, 5, 14–21. [Google Scholar] [CrossRef]
  47. Benjamin, M.; Woods, S.; Ferguson, J. Anaerobic toxicity and biodegradability of pulp mill waste constituents. Water Res. 1984, 18, 601–607. [Google Scholar] [CrossRef]
  48. Gutiérrez, T.; Buszko, M.L.; Ingram, L.O.; Preston, J.F. Reduction of Furfural to Furfuryl Alcohol by Ethanologenic Strains of Bacteria and Its Effect on Ethanol Production from Xylose. Appl. Biochem. Biotechnol. 2002, 98–100, 327–340. [Google Scholar] [CrossRef]
  49. Monlau, F.; Sambusiti, C.; Barakat, A.; Quéméneur, M.; Trably, E.; Steyer, J.-P.; Carrère, H. Do furanic and phenolic compounds of lignocellulosic and algae biomass hydrolyzate inhibit anaerobic mixed cultures? A comprehensive review. Biotechnol. Adv. 2014, 32, 934–951. [Google Scholar] [CrossRef]
  50. Badshah, M. Evaluation of Process Parameters and Treatments of Different Raw Materials for Biogas Production; Lund University: Lund, Sweden, 2012. [Google Scholar]
  51. Park, J.-H.; Yoon, J.-J.; Park, H.-D.; Lim, D.J.; Kim, S.-H. Anaerobic digestibility of algal bioethanol residue. Bioresour. Technol. 2012, 113, 78–82. [Google Scholar] [CrossRef]
  52. Boopathy, R.; Bokang, H.; Daniels, L. Biotransformation of furfural and 5-hydroxymethyl furfural by enteric bacteria. J. Ind. Microbiol. Biotechnol. 1993, 11, 147–150. [Google Scholar] [CrossRef]
  53. Ran, H.; Zhang, J.; Gao, Q.; Lin, Z.; Bao, J. Analysis of biodegradation performance of furfural and 5-hydroxymethylfurfural by Amorphotheca resinae ZN1. Biotechnol. Biofuels 2014, 7, 1–12. [Google Scholar] [CrossRef]
  54. Wierckx, N.; Koopman, F.; Ruijssenaars, H.J.; De Winde, J.H. Microbial degradation of furanic compounds: Biochemistry, genetics, and impact. Appl. Microbiol. Biotechnol. 2011, 92, 1095–1105. [Google Scholar] [CrossRef]
  55. Habe, H.; Sato, S.; Morita, T.; Fukuoka, T.; Kirimura, K.; Kitamoto, D. Bacterial production of short-chain organic acids and trehalose from levulinic acid: A potential cellulose-derived building block as a feedstock for microbial production. Bioresour. Technol. 2015, 177, 381–386. [Google Scholar] [CrossRef]
  56. Rand, J.M.; Pisithkul, T.; Clark, R.L.; Thiede, J.M.; Mehrer, C.R.; Agnew, D.E.; Campbell, C.E.; Markley, A.L.; Price, M.N.; Ray, J.; et al. A metabolic pathway for catabolizing levulinic acid in bacteria. Nat. Microbiol. 2017, 2, 1624–1634. [Google Scholar] [CrossRef]
  57. Park, J.-H.; Kim, S.-H.; Park, H.-D.; Lim, D.J.; Yoon, J.-J. Feasibility of anaerobic digestion from bioethanol fermentation residue. Bioresour. Technol. 2013, 141, 177–183. [Google Scholar] [CrossRef]
  58. Krümpel, J.; Schäufele, F.; Schneider, J.; Jungbluth, T.; Zielonka, S.; Lemmer, A. Kinetics of biogas production in Anaerobic Filters. Bioresour. Technol. 2016, 200, 230–234. [Google Scholar] [CrossRef]
  59. Krümpel, J.H.; Illi, L.; Lemmer, A. Intrinsic gas production kinetics of selected intermediates in anaerobic filters for demand-orientated energy supply. Environ. Technol. 2017, 39, 558–565. [Google Scholar] [CrossRef]
  60. Hafner, S.D.; Koch, K.; Carrere, H.; Astals, S.; Weinrich, S.; Rennuit, C. Software for biogas research: Tools for measurement and prediction of methane production. SoftwareX 2018, 7, 205–210. [Google Scholar] [CrossRef]
  61. Barakat, A.; Monlau, F.; Steyer, J.-P.; Carrere, H. Effect of lignin-derived and furan compounds found in lignocellulosic hydrolysates on biomethane production. Bioresour. Technol. 2012, 104, 90–99. [Google Scholar] [CrossRef]
  62. Zaldivar, J.; Martinez, A.; Ingram, L.O. Effect of selected aldehydes on the growth and fermentation of ethanologenic Escherichia coli. Biotechnol. Bioeng. 1999, 65, 24–33. [Google Scholar] [CrossRef]
  63. Fang, H.; Liang, D.; Zhang, T.; Liu, Y. Anaerobic treatment of phenol in wastewater under thermophilic condition. Water Res. 2006, 40, 427–434. [Google Scholar] [CrossRef] [PubMed]
  64. Elshahed, M.S.; Bhupathiraju, V.K.; Wofford, N.Q.; Nanny, M.A.; McInerney, M.J. Metabolism of Benzoate, Cyclohex-1-ene Carboxylate, and Cyclohexane Carboxylate by “Syntrophus aciditrophicus” Strain SB in Syntrophic Association with H2-Using Microorganisms. Appl. Environ. Microbiol. 2001, 67, 1728–1738. [Google Scholar] [CrossRef] [PubMed]
  65. Levén, L.; Nyberg, K.; Schnürer, A. Conversion of phenols during anaerobic digestion of organic solid waste–A review of important microorganisms and impact of temperature. J. Environ. Manag. 2012, 95, S99–S103. [Google Scholar] [CrossRef] [PubMed]
  66. Levén, L.; Schnürer, A. Effects of temperature on biological degradation of phenols, benzoates and phthalates under methanogenic conditions. Int. Biodeterior. Biodegrad. 2005, 55, 153–160. [Google Scholar] [CrossRef]
  67. Al-Khalid, T.; El-Naas, M.H. Aerobic Biodegradation of Phenols: A Comprehensive Review. Crit. Rev. Environ. Sci. Technol. 2012, 42, 1631–1690. [Google Scholar] [CrossRef]
  68. Chapleur, O.; Madigou, C.; Civade, R.; Rodolphe, Y.; Mazéas, L.; Bouchez, T. Increasing concentrations of phenol progressively affect anaerobic digestion of cellulose and associated microbial communities. Biodegradation 2016, 27, 15–27. [Google Scholar] [CrossRef]
  69. Poirier, S.; Bize, A.; Bureau, C.; Bouchez, T.; Chapleur, O. Community shifts within anaerobic digestion microbiota facing phenol inhibition: Towards early warning microbial indicators? Water Res. 2016, 100, 296–305. [Google Scholar] [CrossRef]
  70. Taherzadeh, M.J.; Eklund, R.; Gustafsson, L.; Niklasson, A.C.; Lidén, G. Characterization and Fermentation of Dilute-Acid Hydrolyzates from Wood. Ind. Eng. Chem. Res. 1997, 36, 4659–4665. [Google Scholar] [CrossRef]
Figure 1. A Hohenheim biogas yield test bioreactor (HBT assay/syringe sampler).
Fermentation 08 00476 g001
Figure 2. Measured specific methane yields for (I) inoculum, (II) concentrate, and (III) hay under mesophilic and thermophilic conditions.
Fermentation 08 00476 g002
Figure 3. Measured specific methane yields for (A) 5-Hydroxymethylfurfural, (B) furfural, and (C) furfuryl alcohol from their per batch-test added amounts of (i) 0.1 gCOD, (ii) 0.2 gCOD, (iii) 0.3 gCOD, and (iv) 0.4 gCOD under mesophilic and thermophilic conditions, along with the fitted modified Gompertz function (n = 3 for all the test concentrations of the furanic compounds at 37 °C and 53 °C).
Fermentation 08 00476 g003
Figure 4. Measured specific methane yields for (D) furoic acid, (E) levulinic acid, and (F) glycolic acid from their per batch-test added amounts of (i) 0.1 gCOD, (ii) 0.2 gCOD, (iii) 0.3 gCOD, and (iv) 0.4 gCOD under mesophilic and thermophilic conditions, along with the fitted modified Gompertz functions (n = 3 for all test concentrations of the acidic compounds at 37 °C and 53 °C, except n = 2 for 0.3 gCOD levulinic acid and 0.4 gCOD glycolic acid at 53 °C and 37 °C, respectively. n = 1 for 0.3 gCOD furoic acid at 37 °C).
Fermentation 08 00476 g004
Figure 5. Measured specific methane yields for (G) syringaldehyde, (H) vanillin, and (I) phenol from their per batch-test added amounts of (i) 0.1 gCOD, (ii) 0.2 gCOD, (iii) 0.3 gCOD, and (iv) 0.4 gCOD under mesophilic and thermophilic conditions, along with the fitted modified Gompertz functions (n = 3 for all the test concentrations of the phenolic compounds at 37 °C and 53 °C, except n = 2 for 0.4 gCOD Syringaldehyde at 37 °C and 0.4 gCOD Vanillin at 37 °C and 53 °C. The Gompertz functions are not fitted to the data with negative mean measured methane yields).
Fermentation 08 00476 g005
Figure 6. Measured specific methane yields for the process-wastewater from its per batch-test added amounts of (i) 0.1 gCOD, (ii) 0.2 gCOD, (iii) 0.3 gCOD, and (iv) 0.4 gCOD under mesophilic and thermophilic conditions, along with the fitted modified Gompertz functions (n = 3 for all the test concentrations at 37 °C and 53 °C except n = 2 for 0.3 gCOD wastewater at 37 °C).
Fermentation 08 00476 g006
Table 1. Characteristics of the inocula (after mixing and degassing).
ParameterThermophilicMesophilic
g/Lg/L
Total organic carbon (TOC)19.9220.81
Inorganic carbon (IC)3.583.76
Dissolved organic carbon (DOC)7.949.52
Total nitrogen (TN)5.485.59
Dissolved nitrogen (DN)5.015.46
Total solids, (% FM)6.146.07
Volatile solids, (% FM)3.953.91
Volatile solids, (% TS)64.2864.46
pH8.578.50
Table 2. Characteristics of the selected components of 5-hydroxymethylfurfural process-wastewater, furfural metabolites, and the phenols utilized in this study.
Test ComponentIUPAC NameMolecular FormulaMolecular Mass
g/mol
5-Hydroxymethylfurfural5-(hydroxymethyl)furan-2-carbaldehydeC6H6O3126.11
FurfuralFuran-2-carbaldehydeC5H4O296.08
Furfuryl alcoholFuran-2-ylmethanolC5H6O298.1
Furoic acidFuran-2-carboxylic acidC5H4O3112.08
Levulinic acid4-Oxopentanoic acidC5H8O3116.11
Glycolic acid2-hydroxyacetic acidC2H4O376.05
Syringaldehyde4-hydroxy-3,5-dimethoxybenzaldehydeC9H10O4182.17
Vanillin4-hydroxy-3-methoxybenzaldehydeC8H8O3152.15
PhenolPhenolC6H6O94.11
Table 3. Constituent of an HBT for the respective test component concentration.
Component Conc.Stock SolutionInoculumDistilled WaterWorking Vol.
gCOD/LmLmLmLmL
21.53513.550
43351250
64.53510.550
8635950
Table 4. Mean methane yields obtained from the given per batch-test amount of the control substrates (inoculum, concentrate, hay) under mesophilic and thermophilic conditions.
Control SubstrateTemperatureMassMethane Yield
MeasuredSpecific
[°C][g][mL][mL/gVS]
Inoculum375087.6 ± 4.944.8 ± 2.5
535098.3 ± 2.549.8 ± 1.3
Concentrate370.4115.9 ± 4.1354.1 ± 12.5
530.4107.9 ± 10.2326.1 ± 30.8
Hay370.4115.1 ± 3.3351.3 ± 10.0
530.487.3 ± 3.4266.2 ± 10.4
Table 5. Mean methane yields for the given concentrations of the furanic compounds under mesophilic and thermophilic conditions with kinetic parameters (a: max. methane produced, b: max. methane production rate, and c: lag phase) from the modified Gompertz model.
Test
Component
TemperatureConcentrationMethane YieldKinetic ParameterR2MAE
MeasuredSpecificEstimatedabc
[°C][gCOD/L][mL][mL/gCOD][mL/gCOD][mL/gCOD][mL/gCOD d][d]
5-Hydroxy- methyl-furfural37235.5 ± 15.5355.2 ± 155.1 ab355.9 ± 92.4356.3 ± 93.030.2 ± 11.24.2 ± 1.60.94422.79
476.9 ± 10.8384.4 ± 54.2 a337.4 ± 28.0337.4 ± 28.034.4 ± 3.713.0 ± 0.40.96720.35
646.0 ± 9.8153.4 ± 32.7 c145.2 ± 29.8145.3 ± 30.015.2 ± 1.326.0 ± 1.00.88516.41
869.3 ± 23.0173.4 ± 57.4 bc169.3 ± 52.6175.9 ± 49.515.1 ± 9.636.9 ± 1.70.86018.67
53228.9 ± 4.9289.0 ± 48.8 abc284.9 ± 23.2284.9 ± 23.228.5 ± 0.310.6 ± 0.40.9899.51
441.5 ± 1.74207.3 ± 8.7 abc181.9 ± 1.9181.9 ± 1.937.8 ± 16.624.2 ± 2.20.88525.49
661.0 ± 5.8203.4 ± 19.4 abc189.2 ± 14.8189.2 ± 14.821.4 ± 2.422.6 ± 2.10.95214.05
862.3 ± 14.9155.9 ± 37.3 c149.8 ± 37.8150.0 ± 38.015.0 ± 3.128.0 ± 2.20.93211.30
Furfural37249.5 ± 7.3495.0 ± 73.2 a434.7 ± 38.3434.7 ± 38.361.6 ± 11.53.0 ± 0.40.96523.45
467.7 ± 8.3338.5 ± 41.7 b322.7 ± 34.2322.7 ± 34.235.4 ± 1.25.2 ± 0.10.9929.50
697.7± 7.8325.8 ± 25.9 b312.3 ± 21.4312.3 ± 21.424.5 ± 1.87.4 ± 0.40.9918.74
892.5 ± 0.9231.2 ± 2.2 b215.4 ± 4.7221.5 ± 4.717.7 ± 1.69.6 ± 0.70.9878.58
53234.6 ± 7.0346.1 ± 69.7 b339.2 ± 32.9339.2 ± 32.976.0 ± 9.52.6 ± 0.20.98213.61
466.0 ± 1.2329.9 ± 6.1 b307.2 ± 2.1307.2 ± 2.153.0 ± 4.13.7 ± 0.20.98710.06
683.1 ± 7.2277.0 ± 23.9 b273.6 ± 16.3273.6 ± 16.342.7 ± 2.35.8 ± 0.50.9927.55
8103.6 ± 7.2259.1 ± 18.1 b252.0 ± 7.3252.0 ± 7.334.4 ± 1.69.1 ± 0.40.9917.74
Furfuryl alcohol37259.7 ± 4.2597.0 ± 42.5 a512.1 ± 21.9512.1 ± 21.977.3 ± 4.02.3 ± 0.00.96625.55
491.5 ± 1.1457.4 ± 5.3 b435.2 ± 5.7435.2 ± 5.757.3 ± 1.32.6 ± 0.10.99312.19
6125.0 ± 15.6416.6 ± 51.2 bc397.9 ± 22.5397.9 ± 22.544.0 ± 1.53.0 ± 0.10.98514.39
8160.7 ± 7.6401.6 ± 18.9 bc398.4 ± 13.0398.4 ± 13.037.6 ± 1.33.4 ± 0.10.98315.01
53242.1 ± 7.6421.5 ± 75.9 bc410.5 ± 24.5410.5 ± 24.595.3 ± 7.71.7 ± 0.10.98016.24
474.6 ± 7.4373.2 ± 36.9 bc367.6 ± 24.1367.6 ± 24.172.5 ± 7.92.0 ± 0.20.99210.20
698.6 ± 13.6328.7 ± 45.2 c332.9 ± 34.0332.9 ± 34.061.6 ± 3.02.3 ± 0.20.9947.16
8146.7 ± 7.7366.7 ± 19.4 bc367.8 ± 7.7367.8 ± 7.768.4 ± 10.22.7 ± 0.10.9948.45
R2: coefficient of determination; MAE: mean absolute error.
Table 6. Mean methane yields for the given concentrations of the acidic compounds under mesophilic and thermophilic conditions with kinetic parameters (a: max. methane produced, b: max. methane production rate and c: lag phase) from the modified Gompertz model.
Test
Component
TemperatureConcentrationMethane yieldKinetic parameterR2MAE
MeasuredSpecificEstimatedabc
[°C][gCOD L−1][mL][mL/gCOD][mL/gCOD][mL/gCOD][mL/gCOD d][d]
Furoic acid37253.0 ± 4.1530.4 ± 40.6 a481.5 ± 39.5481.5 ± 39.571.9 ± 7.03.1 ± 0.30.98715.24
483.3 ± 0.9416.4 ± 4.7 b400.2 ± 6.1400.2 ± 6.160.8 ± 0.84.1 ± 0.00.99310.83
6120.0399.9 b395.0395.047.85.40.99210.02
8148.0 ± 4.9370.1 ± 12.3 b363.7 ± 3.4363.7 ± 3.439.9 ± 2.06.5 ± 0.00.99110.64
53238.3 ± 1.3382.9 ± 13.0 b337.2 ± 12.0337.2 ± 12.070.8 ± 5.22.2 ± 0.10.97216.10
457.5 ± 7.9287.7 ± 39.3 c290.2 ± 22.1290.2 ± 22.171.5 ± 0.92.5 ± 0.30.9936.93
677.8 ± 5.7259.2 ± 19.1 c264.8 ± 12.3264.8 ± 12.356.5 ± 2.13.0 ± 0.00.9974.35
8108.5 ± 9.5271.1 ± 23.7 c267.1 ± 5.5267.1 ± 5.547.8 ± 1.03.8 ± 0.20.9936.91
Levulinic acid37249.6 ± 6.7496.1 ± 66.9 a507.3 ± 69.9651.4 ± 109.512.1 ± 1.812.0 ± 4.50.98219.71
469.1 ± 18.6345.5 ± 93.1 ab359.4 ± 98.4432.2 ± 142.510.5 ± 2.217.4 ± 5.20.97116.50
694.9 ± 13.6316.3 ± 45.4 b331.0 ± 48.3508.7 ± 172.28.1 ± 1.415.7 ± 1.60.96915.02
8124.8 ± 3.8312.1 ± 9.5 b322.8 ± 13.4369.6 ± 67.117.3 ± 12.413.3 ± 1.80.98311.67
53235.4 ± 6.2354.4 ± 61.6 ab347.1 ± 64.1347.9 ± 63.742.4 ± 13.714.8 ± 3.30.97815.46
466.1 ± 9.8330.7 ± 49.0 b327.8 ± 39.2327.8 ± 39.230.6 ± 3.116.5 ± 0.30.97815.31
6103.9 ± 3.0.346.4 ± 10.0 ab347.2 ± 7.4347.2 ± 7.430.4 ± 4.416.7 ± 0.20.97217.15
8134.8 ± 6.5336.9 ± 16.2 b336.5 ± 10.6336.6 ± 10.635.1 ± 7.017.3 ± 1.30.97914.56
Glycolic acid37248.7 ± 0.9486.9 ± 8.9 a439.4 ± 16.3439.9 ± 17.029.1 ± 7.98.6 ± 1.00.95433.10
454.1 ± 11.6270.3 ± 58.1 b271.1 ± 33.9274.9 ± 31.229.7 ± 18.014.1 ± 2.20.97115.14
689.6 ± 5.3298.5 ± 17.6 b276.8 ± 20.3279.9 ± 21.718.2 ± 6.814.6 ± 0.60.96716.41
8116.3 ± 18.2290.6 ± 45.4 b291.4 ± 52.2292.6 ± 53.823.7 ± 10.920.7 ± 8.70.96417.06
53234.9 ± 7.5348.7 ± 75.5 b345.2 ± 72.3237.7 ± 32.1 *48.1 ± 24.7 *33.1 ± 1.8 *0.96114.65
448.1 ± 6.2240.7 ± 31.1 b239.6 ± 33.077.3 ± 41.0 *15.4 ± 10.5 *40.0 ± 2.3 *0.96413.18
692.3 ± 4.7307.7 ± 15.7 b307.1 ± 14.769.5 ± 15.9 *5.8 ± 0.8 *36.2 ± 4.5 *0.9869.04
8114.0 ± 4.6285.0 ± 11.5 b285.0 ± 11.554.8 ± 16.3 *5.2 ± 1.4 *37.5 ± 1.4 *0.9964.58
* Kinetic parameter for the second phase. Parameters for the initial phase at 2 gCOD/L: a = 107.8 ± 83.6.9, b = 43.8 ± 40.3, c = 16.9 ± 13.3, at 4 gCOD/L: a = 171.6 ± 5.5, b = 32.8 ± 11.7, c = 8.6 ± 1.3, at 6 gCOD/L: a = 238.6 ± 12.5, b = 23.6 ± 2.9, c = 6.2 ± 0.7, and at 8 gCOD/L: a = 232.7 ± 21.1, b = 24.5 ± 1.0, c = 6.3 ± 0.4.
Table 7. Mean methane yields for given concentrations of phenolic compounds under mesophilic and thermophilic conditions with kinetic parameters (a: max. methane produced, b: max. methane production rate and c: lag phase) from the modified Gompertz model.
Test
Component
TemperatureConcentrationMethane YieldKinetic ParameterR2MAE
MeasuredSpecificEstimatedabc
[°C][gCOD/L][mL][mL/gCOD][mL/gCOD][mL/gCOD][mL/gCOD d][d]
Syring-aldehyde37240.9 ± 2.3409.1 ± 22.5 a390.3 ± 11.0390.3 ± 11.045.2 ± 10.74.8 ± 0.40.9949.11
465.9 ± 3.6329.6 ± 18.1 a321.6 ± 12.1321.6 ± 12.136.5 ± 3.06.7 ± 0.30.9957.48
690.6 ± 1.5301.9 ± 4.9 a292.3 ± 10.8292.5 ± 10.723.9 ± 10.66.7 ± 1.40.9946.54
8117.2 ± 6.1293.1 ± 15.2 a281.7 ± 26.5281.8 ± 26.324.7 ± 12.98.7 ± 1.20.9889.02
53233.5 ± 19.4335.0 ± 193.9 a309.5 ± 115.8309.5 ± 115.849.2 ± 21.22.3 ± 0.80.95617.67
458.7 ± 8.9293.4 ± 44.5 a294.2 ± 25.5294.2 ± 25.541.6 ± 3.53.7 ± 0.20.9898.66
670.3 ± 1.9234.3 ± 6.3 a247.1 ± 1.4247.1 ± 1.426.4 ± 5.55.8 ± 1.00.97511.82
881.2 ± 12.5202.9 ± 31.4 a206.6 ± 21.3206.6 ± 21.336.5 ± 11.87.9 ± 1.80.9837.76
Vanillin37243.9 ± 9.2439.0 ± 91.9 a439.7 ± 75.5452.6 ± 86.615.0 ± 1.14.7 ± 0.10.98216.54
477.3 ± 11.2386.7 ± 56.2 ab375.8 ± 51.5299.5 ± 87.6 *15.5 ± 3.5 *22.0 ±4.7 *0.9938.06
680.0 ± 9.5266.7 ± 31.5 b267.1 ± 32.1195.5 ± 30.4 *31.8 ± 2.5 *39.3 ± 2.3 *0.9963.27
821.2 ± 14.553.1 ± 36.2 c44.2 ± 7.944.2 ± 7.912.6 ± 1.13.9 ± 0.20.7746.80
53224.8 ± 4.3248.4 ± 43.1 b307.1 ± 35.8307.1 ± 35.845.0 ± 1.93.0 ± 0.60.92424.72
459.2 ± 1.9296.1 ± 9.4 ab304.7 ± 7.1304.7 ± 7.126.5 ± 1.73.4 ± 0.40.9909.50
6−2.9 ± 17.8−9.8 ± 59.2 c------
8−0.9 ± 1.2−2.3 ± 2.9 c------
Phenol37243.0 ± 1.0430.5 ± 9.7 a421.2 ± 17.0421.7 ± 17.948.4 ± 16.622.1 ± 0.90.9967.74
4−15.7 ± 17.7−78.5 ± 88.6 b------
6−38.1 ± 0.7−127.0 ± 2.3 b------
8−58.9 ± 1.6−147.3 ± 3.9 b------
532−13.5 ± 12.2−134.9 ± 126.2 b------
4−12.3 ± 2.1−61.5 ± 10.6 b------
6−59.2 ± 1.0−197.3 ± 3.5 b------
8−66.2 ± 2.2−165.5 ± 5.5 b------
* Kinetic parameter for the second phase. Parameters for the initial phase at 4 gCOD/L: a = 89.2 ± 16.9, b = 21.4 ± 10.6, c = 2.8 ± 0.3, at 6 gCOD/L: a = 71.7 ± 1.7, b = 14.1 ± 0.9, c = 3.3 ± 0.2.
Table 8. Mean methane yields for given concentrations of the process-wastewater under mesophilic and thermophilic conditions.
Test
Component
TemperatureConcentrationMethane Yield
MeasuredSpecificEstimated
[°C][gCOD/L][mL][mL/gCOD][mL/gCOD]
Wastewater37233.9 ± 5.0339.3 ± 49.7 a302.6 ± 47.9
449.8 ± 1.9249.0 ± 9.5 abc226.1 ± 13.2
661.8 ± 7.9206.1 ± 26.3 bcd193.4 ± 22.8
862.3 ± 9.6155.6 ± 24.1 cd149.1 ± 22.6
53225.5 ± 4.8254.8 ± 48.2 ab247.3 ± 20.6
442.9 ± 3.5214.6 ± 17.5 bcd205.8 ± 6.0
644.0 ± 13.1146.8 ± 43.6 d163.9 ± 24.0
865.7 ± 6.1164.3 ± 15.2 bcd162.8 ± 6.0
Table 9. Kinetic parameters for the process-wastewater (a: max. methane produced, b: max. methane production rate and c: lag phase) from the modified Gompertz model for the given temperatures and concentrations.
Test
Component
TemperatureConcentrationKinetic ParameterR2MAE
abc
[°C][gCOD/L][mL/gCOD][mL/gCOD d][d]
Wastewater372302.6 ± 48.023.1 ± 2.22.2 ± 1.00.97317.56
4226.2 ± 13.215.3 ± 1.82.7 ± 0.70.9829.24
6193.4 ± 22.812.3 ± 1.35.5 ± 0.40.9886.84
8149.2 ± 22.78.6 ± 1.310.1 ± 1.90.9943.42
532247.3 ± 20.628.9 ± 4.02.0 ± 0.40.97810.85
4205.8 ± 6.017.8 ± 2.42.7 ± 0.20.9944.21
6164.0 ± 24.212.4 ± 3.17.4 ± 3.70.9757.02
8162.9 ± 6.015.4 ± 4.018.8 ± 0.70.9847.50
Publisher’s Note: MDPI stays neutral with regard to jurisdictional claims in published maps and institutional affiliations.

