Article

Bacterial and Fungal Microbiota of Guinea Grass Silage Shows Various Levels of Acetic Acid Fermentation

Graduate School of Environmental and Life Science, Okayama University, Okayama 700-8530, Japan
*
Author to whom correspondence should be addressed.
Fermentation 2022, 8(1), 10; https://doi.org/10.3390/fermentation8010010
Submission received: 2 December 2021 / Revised: 25 December 2021 / Accepted: 27 December 2021 / Published: 29 December 2021
(This article belongs to the Special Issue Silage Fermentation)

Abstract

:
This study aimed to gain insights into the bacterial and fungal microbiota associated with the acetic acid fermentation of tropical grass silage. Direct-cut (DC, 170 g dry matter [DM]/kg) and wilted (WT, 323 g DM/kg) guinea grass were stored in a laboratory silo at moderate (25 °C) and high (40 °C) temperatures. Bacterial and fungal microbiota were assessed at 3 days, 1 month, and 2 months after ensiling. Lactic acid was the primary fermentation product during the initial ensiling period, and a high Lactococcus abundance (19.7–39.7%) was found in DC silage. After two months, the lactic acid content was reduced to a negligible level, and large amounts of acetic acid, butyric acid, and ethanol were found in the DC silage stored at 25 °C. The lactic acid reduction and acetic acid increase were suppressed in the DC silage stored at 40 °C. Increased abundances of Lactobacillus, Clostridium, and Wallemia, as well as decreased abundances of Saitozyma, Papiliotrema, and Sporobolomyces were observed in DC silages from day three to the end of the 2 month period. Wilting suppressed acid production, and lactic and acetic acids were found at similar levels in WT silages, regardless of the temperature and storage period. The abundance of Lactobacillus (1.72–8.64%) was lower in WT than in DC silages. The unclassified Enterobacteriaceae were the most prevalent bacteria in DC (38.1–64.9%) and WT (50.9–76.3%) silages, and their abundance was negatively related to the acetic acid content. Network analysis indicated that Lactobacillus was involved in enhanced acetic acid fermentation in guinea grass silage.

1. Introduction

Microbiota analysis using DNA information has become more sophisticated and easily accessible in the past 20 years [1]. Many studies have been conducted to elucidate the microbiota involved in fermentation and the aerobic deterioration of silage, and attempts to develop a novel microbial inoculant are still in progress. With the improvement of harvesting and packaging machinery, techniques for controlling silage quality have been steadily updated. Although methods for microbiota analysis have progressed, most studies have confirmed the well-established knowledge that the rapid growth of lactic acid bacteria (LAB) after sealing determines the success or failure of silage fermentation. Even now, the silo-to-silo and year-to-year quality variations remain unsolved, and mold growth during the long-term storage of bale silage is still unavoidable. Likewise, Lactobacillus buchneri and its related hetero-fermentative LAB species have been the only choice to prevent aerobic deterioration for more than two decades [2].
The acetic acid fermentation found in tropical grass silages is also a topic for which the mechanisms and control procedures have not been clarified. Due to the fact that acetic acid fermentation is inevitable even with molasses addition, the lack of soluble sugars is unlikely to be the main factor [3]. In addition, acetic acid is not necessarily dominant during the initial stages of fermentation. Lactic acid may be prevalent during the first week of ensiling, but lactic acid can decrease and be entirely or partly replaced with acetic acid [3,4,5]. The fermentation pathway that accounts for this phenomenon remains unclear. The metabolism of lactic acid by L. buchneri to produce acetic acid and 1,2-propanediol is one possibility [6], but 1,2-propanediol and its metabolite, 1-propanol have not been found in large amounts in tropical grass silages. Acetobacter spp., which produce acetic acid through oxidizing ethanol, are rarely detected, and their metabolism under aerobic conditions does not explain the decrease in lactic acid levels [7].
The fact that most microbiota analyses have focused on bacteria may be why we still lack an understanding of acetic acid fermentation in tropical grass silage. Even if anaerobic conditions are ensured, a low fungal population can survive ensiling and may activate their metabolism if necessary. Various yeasts, such as Candida, Hansenula, Saccharomyces, and Torulopsis spp., can produce lactic acid, acetic acid, and ethanol under anaerobic conditions, although their presence in silage is considered undesirable [8]. The fungal microbiota involved in tropical grass ensiling, and whether bacterial and fungal microbiota interact during acetic acid fermentation, has not been well examined.
Therefore, this study aimed to clarify the bacterial and fungal microbiota associated with guinea grass ensiling during early and long storage periods. Direct-cut (DC) and wilted (WT) silages were prepared to facilitate and restrict acetic acid fermentation. Furthermore, two storage temperatures (25 and 40 °C) were studied to determine how fermentation could be affected by high temperatures that mimic tropical and sub-tropical conditions. Phylogenetic gene markers for bacteria and fungi were used to identify the microbial communities.

2. Materials and Methods

2.1. Silage Preparation

The first growth (44 days after seeding) of guinea grass (Panicum maximum cv. Soirukurin; Snow Brand Seed Co., Ltd., Sapporo, Japan) was harvested at the late vegetative stage on 8 August, 2019. The grass was chopped using a forage cutter at a theoretical length of 13 mm immediately after harvest and after field wilting for 4 h. A total of 300 g of pre-ensiled material was packed in a plastic pouch without any additives, and the air was removed using a vacuum sealer. Silos were prepared in triplicate and stored at 25 and 40 °C for 3 days, and for 1 and 2 months.

2.2. Chemical Component and Fermentation Characteristic Analyses

The dry matter (DM) contents of pre-ensiled and silage samples were determined at 60 °C for 48 h in a forced-air oven. The pH value, as well as the lactic acid, short-chain fatty acid, alcohol, and ammonia nitrogen contents were determined from the water extracts [9]. The pH was measured using a glass electrode pH meter. The acids and alcohols were determined using an ion-exclusion polymeric high-performance liquid chromatography method with refractive index detection. A portion of the water extract was passed through a 0.20 μm filter, and 10 μL of the filtrate was injected into an IC-Sep COREGEL-87H column (Tokyo Chemical Industry Co., Ltd., Tokyo, Japan). The mobile phase used was 0.004 M sulfuric acid, and the flow rate was 0.6 mL/min at 60 °C. The ammonia nitrogen content was determined using the phenol–hypochlorite reaction.

2.3. MiSeq Preparation

Two silages were chosen at random from triplicate silages and subjected to DNA extraction and subsequent MiSeq analyses [10]. Frozen samples (5 g) were thawed, and 95 mL of sterilized phosphate-buffered saline (pH 7.4) was added. The samples were shaken vigorously for 10 min and microbial pellets were obtained by centrifugation at 8000× g for 15 min. DNA extraction was performed using the repeated bead-beating and column method [11], followed by DNA purification using a QIAamp DNA Stool Mini Kit (Qiagen, Tokyo, Japan). Bacterial 16S rRNA genes spanning a hypervariable (V4) region were amplified using the F515 (forward: 5-GTGCCAGCMGCCGCGGTAA-3) and R806 (reverse: 5-GGACTACHVGGGTWTCTAAT-3) primers [12]. Fungal rRNA genes spanning the internal transcribed spacer 2 (ITS2) region were amplified using the gITS7 (forward: 5-GTGAATCATCGARTCTTTG-3′) and ITS4 (reverse: 5-TCCTCCGCTTATTGATATGC-3) primers [13]. A two-round polymerase chain reaction (PCR) was performed to reduce any potential bias of the MiSeq adaptor overhang [14]. For the V4 region of bacterial 16S rRNA genes, the PCR conditions were as follows: initial denaturation at 94 °C for 2 min, followed by 30 cycles at 94 °C for 30 s, 50 °C for 30 s, and 72 °C for 30 s, and a final extension step at 72 °C for 5 min. For the ITS2 region of the fungal rRNA genes, the following conditions were employed: 95 °C for 5 min, followed by 40 cycles at 95 °C for 30 s, 55 °C for 30 s, and 72 °C for 60 s, and a final extension step at 72 °C for 10 min. The PCR products were purified using the Fast Gene Gel/PCR Extraction Kit (NIPPON Genetics Co., Ltd., Tokyo, Japan) and moved to a second round of PCR with adapter-attached primers. Amplification was performed using the following temperature profiles: one cycle at 94 °C for 2 min, 10 cycles of denaturation at 94 °C for 30 s, annealing at 59 °C for 30 s, extension at 72 °C for 30 s, and one cycle at 72 °C for 5 min for the final extension. The PCR products were purified as described above for the first-round products. The purified amplicons were pair-end sequenced (2 × 250) on an Illumina MiSeq platform at FASMAC Co., Ltd. (Kanagawa, Japan). All sequencing data were received as FASTQ files and deposited in the NCBI Sequence Read Archive under BioProject accession PRJNA783142.

2.4. Bioinformatics Analysis

Bioinformatics analysis was performed using the QIIME2 program [15]. The raw paired-end FASTQ reads of bacteria and fungi were demultiplexed using the q2-demux plugin. Primer sequences were removed from the bacterial demultiplexed sequence data for quality control. For fungi, demultiplexed sequence data were trimmed with q2-ITSxpress [16] and an unmerged ITS2 sequence from a fungal amplicon sequencing dataset was extracted for quality control. DADA2 [17] was used to filter, trim, denoise, and merge the data. Chimeric sequences were removed using the consensus method. For phylogenetic diversity analysis, all observed amplicon sequence variants [18], that is, 100% operational taxonomic units (OTUs), were aligned using the MAFFT program plugin via q2-alignment [19] to construct a phylogenetic tree with FastTree2 via q2-phylogeny [20]. Taxonomic classification was assigned using the SILVA database (version 132), specific for the V3-4 region of 16S rRNA genes, and the UNITE fungal ITS database (version 8.2), specific to the ITS2 region of fungal rRNA genes [21]. All taxonomic classifications were implemented using QIIME2 and assigned using the naïve Bayesian algorithm. The alpha diversity (observed OTUs and Faith’s phylogenetic diversity) was estimated using q2-diversity at the OTU level.

2.5. Statistical Analysis

Data for fermentation products, the alpha diversity of bacterial and fungal microbiota, and relative abundances of major bacterial and fungal genera were subjected to a two-way analysis of variance with the storage period and temperature as the main factors. The Duncan’s multiple range test was used to determine significant differences between the means at a probability of <0.05. These analyses were performed using IBM SPSS Statistics (version 26.0., Armonk, NY, USA).
The beta-diversity of bacterial and fungal microbiota was calculated based on the Bray-Curtis distance, using the filtered genus-level taxa and was visualized using principal coordinate analysis (PCoA) with Primer-E software (version 7, Quest Research Ltd., Auckland, New Zealand). Discriminant vectors with a Pearson correlation > 0.7 were considered significant. Correlations between fermentation products and the relative abundance of bacterial and fungal genera were calculated using Spearman’s rank correlation coefficient. Significant correlations at a probability of <0.05 between the fermentation products and dominant genera were visualized by network analysis using the Cytoscape software [22].

3. Results

3.1. Fermentation Products

The DM contents of DC and WT guinea grass were 170 and 323 g/kg, respectively. Lactic and acetic acids were not detected in the pre-ensiled materials.
A large amount of acetic acid was produced in the DC silage stored at 25 °C for 1 and 2 months (Table 1). Lactic acid exceeded acetic acid on day three, but lactic acid decreased substantially with prolonged ensiling. After 1 month, acetic acid increased to 25.1 g/kg DM, which was about 2.5 times higher than that of lactic acid. Butyric acid (9.28 g/kg DM) was also found to be comparable to lactic acid (9.44 g/kg DM). After 2 months, acetic acid (49.5 g/kg DM) and butyric acid (21.6 g/kg DM) were twice as high as after 1 month. A considerable amount of ethanol (15.0 g/kg DM) was also produced, but lactic acid (0.34 g/kg DM) was further lowered to a negligible level.
Intensive lactic acid fermentation was observed during the initial ensiling of DC silage stored at 40 °C; the ratio of lactic acid to acetic acid was >3.0 on day three. Unlike the DC silage stored at 25 °C, lactic acid did not decrease with prolonged storage, and acetic acid became comparable to lactic acid after 1 and 2 months. Ethanol and ammonia nitrogen also increased with prolonged ensiling, but the increasing pattern was different from that of acetic acid. Butyric acid was not found in the DC silage stored at 40 °C, regardless of the ensiling period.
In WT silages stored at 25 and 40 °C, the amounts of lactic acid and acetic acid were similar, that is, the ratio of lactic acid to acetic acid was approximately 1.0 throughout the ensiling period (Table 2). Acid and alcohol production was suppressed in WT silages; lactic acid, acetic acid, and ethanol were <30 g/kg DM, and no butyric acid was found even after 2 months. Ammonia nitrogen levels were considerably lower than the corresponding levels in the DC silages.

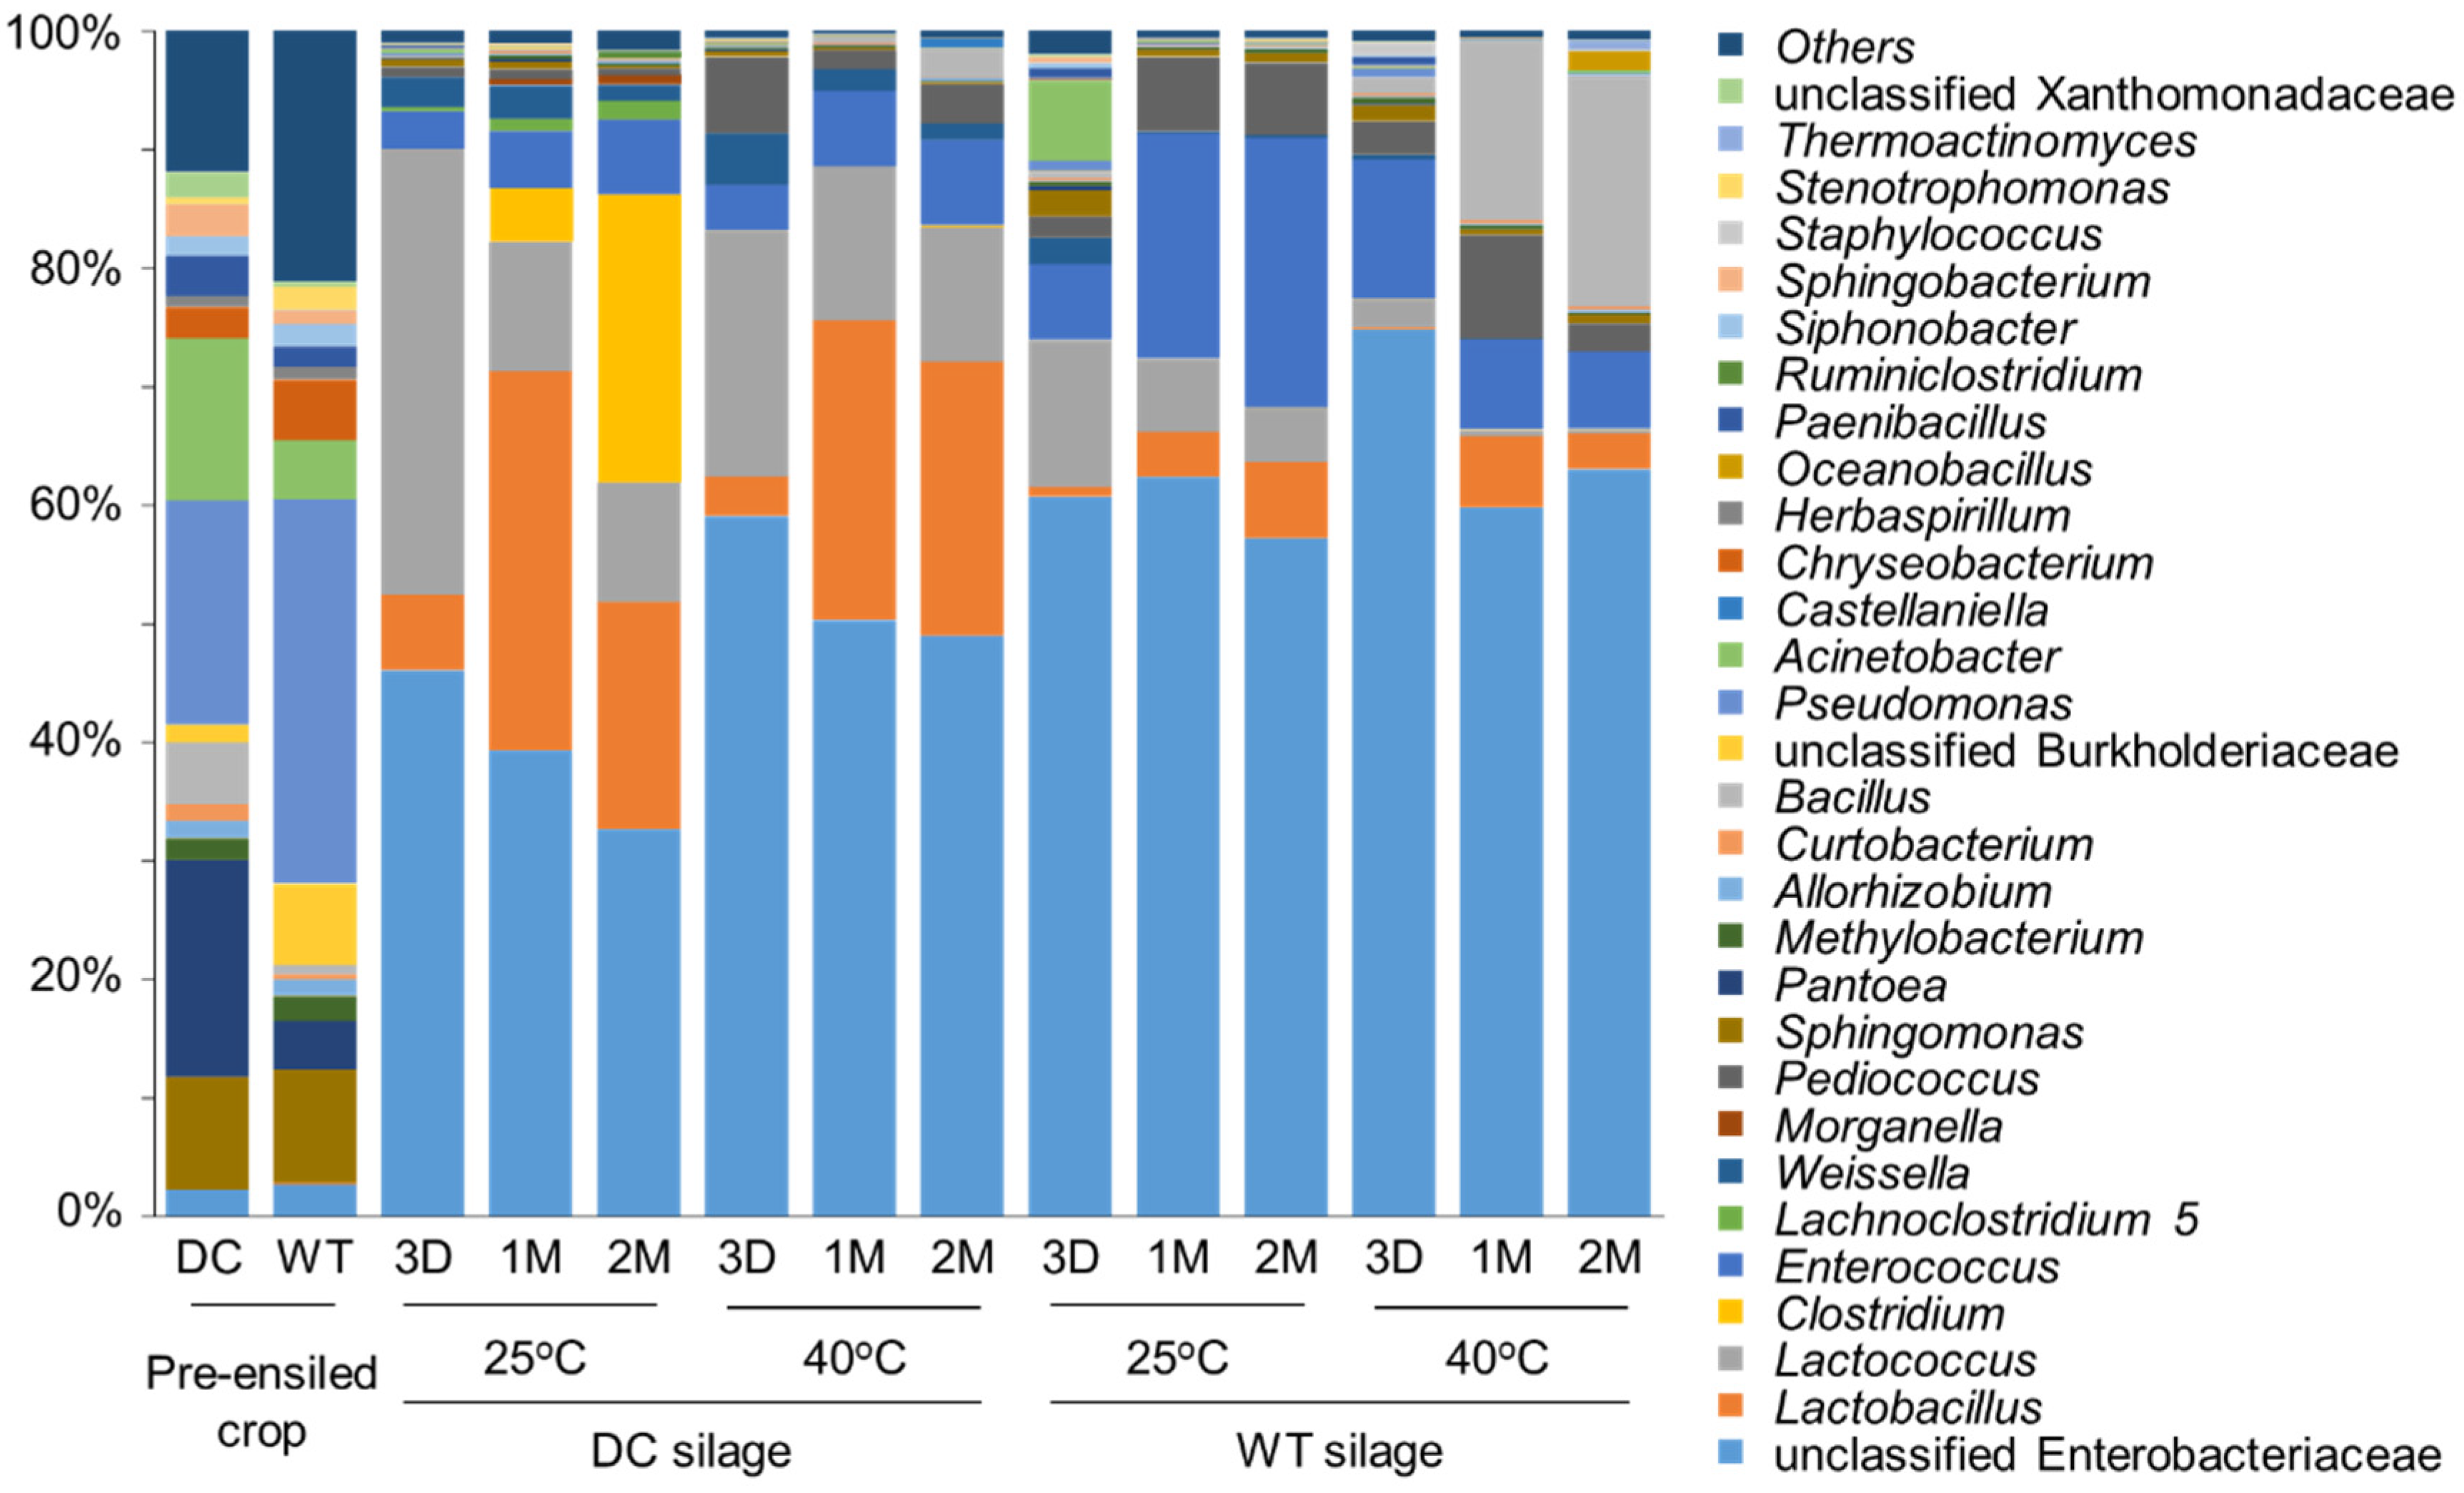
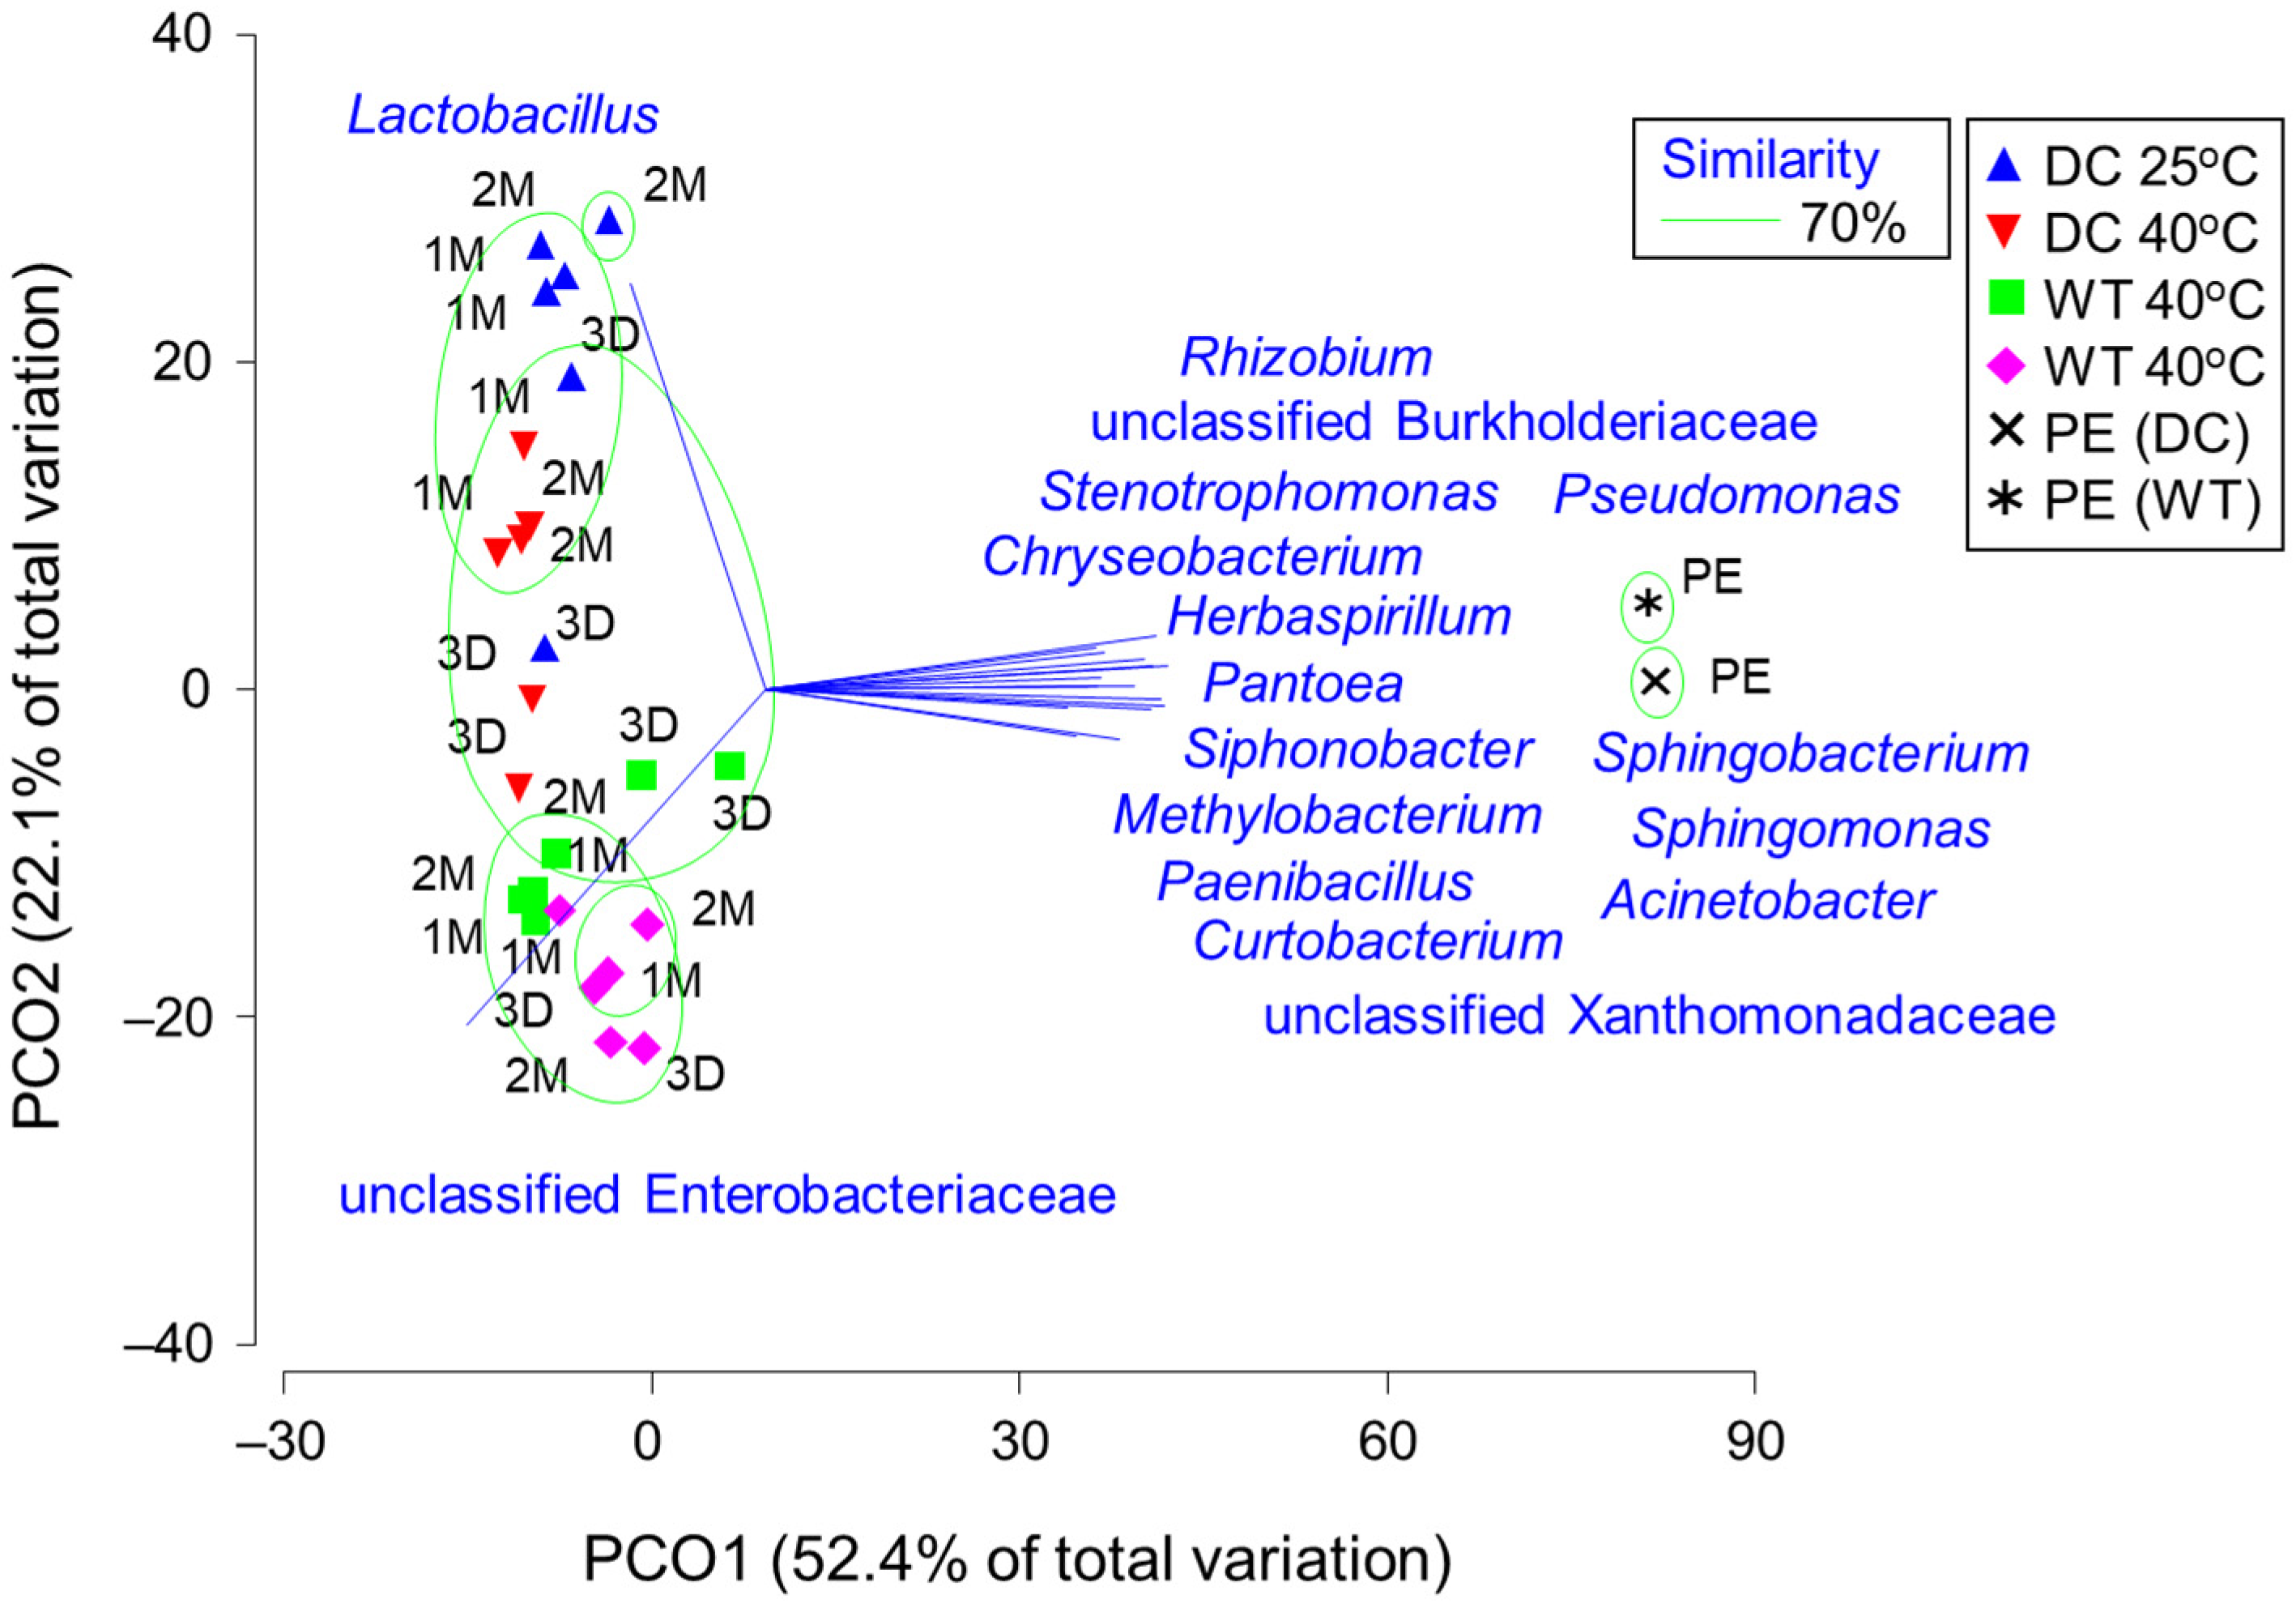
3.2. Bacterial Microbiota

A total of 810,737 filtered 16S rRNA high-quality sequences were obtained to classify 1101 OTUs from 26 samples. The observed OTUs and the Faith PD of pre-ensiled DC and WT materials were 212 and 22.1, and 205 and 24.5, respectively (Table S1). These two indices were distinctly decreased after ensiling in both DC and WT silages. The observed OTUs and Faith PD were approximately one-third of those observed in the pre-ensiled materials on day three, and did not change significantly after ensiling.
The five most abundant bacterial genera in the pre-ensiled DC crop were Pseudomonas (19.0%), Pantoea (18.3%), Acinetobacter (13.7%), Sphingomonas (9.57%), and Bacillus (5.30%), and those in WT crop were Pseudomonas (32.5%), Sphingomonas (9.55%), unclassified Burkholderiaceae (6.86%), Chryseobacterium (5.13%), and Acinetobacter (4.92%).
Immediately after ensiling, unclassified Enterobacteriaceae became the most abundant taxon in the guinea grass silage (Table 3; Figure 1). The abundance was only 2.22% in pre-ensiled DC crop, but unclassified Enterobacteriaceae increased to 46.1%, which exceeded Lactococcus (37.6%) on day three in DC silage stored at 25 °C. After 1 month, unclassified Enterobacteriaceae accounted for 39.3%, whereas the abundance of Lactococcus decreased to 10.9% and that of Lactobacillus increased to 32.0%. After 2 months, the abundance of unclassified Enterobacteriaceae was 32.7%, followed by Clostridium (24.3%) and Lactobacillus (19.2%). In DC silage stored at 40 °C, the abundance of unclassified Enterobacteriaceae was as high as 60%. Lactococcus was the second most abundant on day three, and Lactococcus decreased and Lactobacillus became the second most abundant after 1 month, similar to DC silage. Meanwhile, the abundance of Clostridium was only 0.18%, and Lactobacillus was the second most abundant bacterial taxon in DC silage stored at 40 °C.
In WT silage, unclassified Enterobacteriaceae appeared more than that in DC silage stored at 25 °C; the abundance on day 3 was >60%, followed by that of Lactococcus (12.4%) in WT silage stored at 25 °C (Table 4). The abundance of unclassified Enterobacteriaceae was >70%, and Enterococcus (11.8%) was the second-most abundant on day three in WT silage stored at 40 °C. Unclassified Enterobacteriaceae maintained their abundance at approximately 60% after 1 and 2 months, regardless of storage temperature. Unlike DC silage, Enterococcus (19.0–22.8%) and Bacillus (15.1–19.5%) were the second most abundant bacteria after 1 and 2 months of storage at 25 and 40 °C, respectively.
Based on the PCoA plots, pre-ensiled materials were shown to be quite different in the bacterial microbiota from their silages; their microbiota were characterized by Pseudomonas, Pantoea, Sphingobacterium, and others (Figure 2). The DC silages opened on day three formed a separate group from those opened after 1 and 2 months. Lactobacillus characterized these long-stored DC silages with a high amount of acetic acid. The WT silages formed another group, which was characterized by unclassified Enterobacteriaceae.

3.3. Fungal Microbiota

A total of 206,864 filtered ITS2 high-quality sequences were obtained to classify 671 OTUs. The observed OTUs and Faith PD of pre-ensiled DC and WT materials were 40 and 12.3, and 60 and 18.8, respectively (Table S2). On day three, these two indices numerically increased in DC silages and decreased in WT silages. In DC silages, regardless of the storage temperature, the observed OTUs decreased after 1 and 2 months when compared with day three. In WT silage stored at 25 °C, the observed OTUs and Faith PD appeared to decrease after 1 and 2 months. These two indices increased after 1 and 2 months in WT silage stored at 40 °C.
The five most abundant fungal genera in the pre-ensiled DC crop were Wallemia (30.6%), Saitozyma (23.4%), Gibellulopsis (10.3%), Sporobolomyces (7.92%), and Moesziomyces (7.34%). In DC silage stored at 25 °C, the abundance of Wallemia decreased on day three but increased again as ensiling was extended (Table 5; Figure 3). In DC silage stored at 40 °C, Wallemia was the most abundant throughout the ensiling period, with an abundance of >30% after 2 months, regardless of the storage temperature. The abundances of Saitozyma, Sporobolomyces, and Papiliotrema were higher than those in the pre-ensiled crop on day three, and then decreased to levels lower than those in the pre-ensiled crop.
The five most abundant fungal genera in the pre-ensiled WT crop were Saitozyma (15.2%), Moesziomyces (14.0%), Cladosporium (13.2%), Alternaria (6.39%), and unclassified Dissoconium (5.35%) (Table 6). Similar to DC silage, a temporal increase in Saitozyma on day three was observed in the WT silage. Unlike DC silage, Wallemia was not the most abundant, and Saitozyma, Papiliotrema, and Sporobolomyces were the major fungi in WT silages regardless of the storage temperature and ensiling period. A high abundance of Mucor (42.7%) was observed in WT silage stored at 25 °C after 1 month, because the fungus inhabited one silage at an extremely high abundance. Likewise, Wallemia was the most abundant in WT silage stored at 40 °C after 2 months, because one silage showed a substantial abundance of Wallemia.
The PCoA plots did not clarify the differences in fungal microbiota between the pre-ensiled crop, DC silage, and WT silage (Figure 4). At the 70% similarity level, DC and WT silages opened on day three formed a group, while others emphasized individual silo-to-silo variations. The genera characterized by the silages on day three were Saitozyma, Sporobolomyces, and Papiliotrema. One WT silage, stored at 25 °C for 1 month, was separately characterized by Mucor.

3.4. Relationships between the Fermentation Products and Core Genera of Bacteria and Fungi

A correlation network indicated that acetic acid was positively related to ammonia, butyric acid, propionic acid, and ethanol (Figure 5). A positive relationship between acetic acid and the abundance of Lactobacillus, Clostridium, Wallemia, and Candida, and a negative relationship between acetic acid and the abundance of unclassified Enterobacteriaceae, Pediococcus, Saitozyma, Sporobolomyces, Papilioterma, Moesziomyces, and Hannaella was also demonstrated. Lactic acid was negatively related to the fungal genus Gibellulopsis, but unrelated to the bacterial genus Lactobacillus. Clostridium was positively related to acetic acid, propionic acid, butyric acid, and ammonia nitrogen content.

4. Discussion

Enhanced acetic acid production was observed in both the DC and WT silages. However, according to the lactic-to-acetic acid ratio, a typical intensified acetic acid fermentation was observed in DC silage, especially after day three at both 25 °C and 40 °C storage. In DC silage stored at 25 °C, high amounts of butyric acid (21.6 g/kg DM) and ammonia nitrogen (3.95 g/kg DM) were found with a large abundance of Clostridium (24.3%) after 2 months. Thus, the increase in acetic acid during prolonged ensiling could be due to the mixed activity of undefined acetic acid-producing bacteria and Clostridium. In WT silage, regardless of the storage temperature, the lactic-to-acetic acid ratio was approximately 1.0 throughout the ensiling period; hence, fermentation should be considered to be driven by hetero-fermentative LAB species.
The PCoA and network analyses showed that Lactobacillus, unclassified Enterobacteriaceae, Wallemia, Saitozyma, Sporobolomyces, and Papiliotrema could be involved in acetic acid fermentation. Lactobacillus and Wallemia were identified as promoting factors and unclassified Enterobacteriaceae, Saitozyma, Sporobolomyces, and Papiliotrema as suppressing factors. Regardless, the abundance of Lactobacillus was most distinctively related to changes in the acetic acid content during fermentation.
The finding that Lactobacillus may be involved in the increase of acetic acid in tropical grass silage is similar to that in our previous study [3,5]. L. plantarum became detectable with the increase of acetic acid by semi-quantitative denaturing gradient gel electrophoresis analysis; hence, the metabolism of lactic acid by L. plantarum to acetic acid under sugar-deficient conditions was considered to be explained [5]. Since the MiSeq platform was used, classification at the species level was difficult in this study. Likewise, it is not clear if the metabolism of lactic acid to acetic acid is well shared within the genus Lactobacillus. Regardless, the findings of this study confirm that Lactobacillus can be involved in intensified acetic acid production in tropical grass silage. The metabolism of lactic acid by L. buchneri to acetic acid and 1,2-propanediol could account for the excessive levels of acetic acid [6], but 1,2-propanediol and its potential metabolite, 1-propanol, were not detected in significant amounts. Lactic acid rarely accumulates in the gut and, even if produced, it can be metabolized to acetic, propionic, and butyric acid [23]. Veillonella, Selenomonas, and Megasphaera are well-known lactate-utilizing and acetate-producing bacteria [23], but these species have not been found in silage and were not detected in this study.
Interestingly, unclassified Enterobacteriaceae were maintained at 40–50% in DC silage and >60% in WT silage. Li et al. [24] also reported that Enterobacter was detectable at >60% after 2 months in the bacterial microbiota of king grass, paspalum, and stylo silage. Accordingly, Enterobacter is considered to be a major bacterial factor that accounts for acetic acid fermentation [24]. However, they did not examine fermentation products and microbiota during the initial ensiling, such as within 3 days, which was conducted in the present study. Furthermore, although Enterobacteriaceae are known to produce large amounts of ethanol and 2,3-butanediol via mixed-acid fermentation and butanediol fermentation [8], the fermentation products were found at low levels in this study. Our data showed that unclassified Enterobacteriaceae were more abundant in the initial ensiling when acetic acid was low. The PCoA and network analyses indicated that unclassified Enterobacteriaceae were negatively related to acetic acid content. Therefore, tropical grass silage may be characterized by a high abundance of Enterobacteriaceae, even without substantial production of ethanol and 2,3-butanediol. In DC silage stored at 40 °C that was examined in this study, lactic acid levels did not increase, while acetic acid levels increased when Lactobacillus became more abundant during prolonged ensiling. This result is difficult to explain using the current knowledge and understanding.
In addition to Enterobacter, many Enterobacteriaceae, such as Citrobacter, Escherichia, Klebsiella, Morganella, and Yersinia, can be detected in pre-ensiled crops and their silages by DNA-based identification [25]. Although microbiota analysis sometimes produces unclassified families for gut samples, such a large number of unclassified families is unusual for fermented foods. In addition, if Enterobacteriaceae were abundant, ethanol and 2,3-butanediol would be detected in large amounts, which was not observed in either DC or WT silage. The MiSeq analysis in this study classified Escherichia, Kosakonia, and Morganella; hence, unclassified Enterobacteriaceae may include taxa other than these three species. Further research is necessary to clarify the role of Enterobacteriaceae in tropical grass ensiling.
Although Wallemia has been suggested as a promoting factor for acetic acid fermentation, there is no report that Wallemia has a high capacity to produce acetic acid. Wallemia is a xerophilic mold that is detectable in air, soil, dried food, and salt [26], and a high abundance of Wallemia was observed in the high-moisture DC silage in this study. Saitozyma and Papiliotrema, which have been shown to suppress acetic acid fermentation by network analysis, are integral components of soil and epiphytic plants [27,28]. Likewise, Sporobolomyces are commonly found in low-nutrition environments [29]. Information on the fungal microbiota of silage obtained by amplicon sequencing is lacking; hence, the roles of these fungi in forage ensiling are not known.
Distinct differences in the fermentation products due to storage temperature (25 and 40 °C) were observed in DC silage. At 25 °C, butyric acid increased along with acetic acid production, whereas at 40 °C, butyric acid was almost completely suppressed, and acetic acid was reduced to about half of that at 25 °C. Usually, silage is more susceptible to clostridial fermentation during warm storage when compared to cold storage [30]. In addition, ensiling at a high temperature lowers lactic acid content due to a shift from homolactic to heterolactic fermentation [31]. Meanwhile, ensiling at a substantially high temperature, such as at about 40 °C, as examined in this study, could increase lactic acid content in tropical grass silage, which would not be seen in other crop silages such as corn and wheat [32]. Li et al. [24] found higher lactic acid production at 40 °C than at 28 °C in king grass, paspalum, and stylo silages, whereas no differences were found in acetic acid content between the two storage temperatures. Likewise, Gulfam et al. [33] found that, although acetic acid was predominant in Napier grass silage at 30 °C, lactic acid became prevalent when stored at 40 °C. In this study, storage at 40 °C increased lactic acid fermentation and suppressed acetic and butyric acid fermentation in DC silage, with a marked decrease in Clostridium abundance in the bacterial microbiota. In WT silage, lactic acid fermentation was enhanced without a marked change in acetic acid content at 40 °C compared to 25 °C. A significant decrease in Lactococcus and Enterococcus, and an increase in Bacillus at high-temperature storage was observed in WT silage. Bacillus is generally regarded as a strictly aerobic bacterium, but facultative anaerobic species are also present, and their ability to produce lactic acid has been shown [34,35]. In WT silage stored at 40 °C, lactic acid increased in the presence of Bacillus and decreased in the presence of Lactococcus and Enterococcus. Whether fermentation during high-temperature storage differs between tropical and other forages and whether Bacillus helps to promote lactic acid production requires further investigation.

5. Conclusions

Typical acetic acid fermentation was found in DC silage, and Lactobacillus and unclassified Enterobacteriaceae were shown to be involved. The relationship between fermentation and fungal microbiota was unclear, although Wallemia was shown to be a promoting factor for acetic acid fermentation. Storage at 40 °C suppressed acetic acid fermentation in DC and WT silage, indicating that high storage temperatures may not adversely affect silage fermentation. Regardless of the degree of acetic acid production, guinea grass fermentation appeared to be bacteria-driven and may not be depicted by the fungal microbiota. Mixed fermentation and 2,3-butanediol fermentation were not found, even with a high abundance (>60%) of unclassified Enterobacteriaceae.

Supplementary Materials

The following supporting information can be downloaded at: https://www.mdpi.com/article/10.3390/fermentation8010010/s1.

Author Contributions

Conceptualization, N.N.; methodology, J.H. and N.N.; software, J.H. and N.N.; validation, J.H. and N.N.; formal analysis, J.H. investigation, J.H.; resources, N.N.; data curation, J.H.; writing—original draft preparation, J.H.; writing—review and editing, N.N.; visualization, J.H. and N.N.; supervision, N.N.; project administration, N.N.; funding acquisition, N.N. All authors have read and agreed to the published version of the manuscript.

Funding

This research was financially supported in part by JSPS KAKENHI Grant Number JP19H0310611.

Institutional Review Board Statement

Not applicable.

Informed Consent Statement

Not applicable.

Conflicts of Interest

The authors declare no conflict of interest.

References

  1. McAllister, T.A.; Dunière, L.; Drouin, P.; Xu, S.; Wang, Y.; Munns, K.; Zaheer, R. Silage review: Using molecular approaches to define the microbial ecology of silage. J. Dairy Sci. 2018, 101, 4060–4074. [Google Scholar] [CrossRef] [Green Version]
  2. Muck, R.E.; Nadeau, E.M.G.; McAllister, T.A.; Contreras-Govea, F.E.; Santos, M.C.; Kung, L. Silage review: Recent advances and future uses of silage additives. J. Dairy Sci. 2018, 101, 3980–4000. [Google Scholar] [CrossRef] [PubMed]
  3. Nishino, N.; Li, Y.; Wang, C.; Parvin, S. Effects of wilting and molasses addition on fermentation and bacterial community in guinea grass silage. Lett. Appl. Microbiol. 2012, 54, 175–181. [Google Scholar] [CrossRef] [PubMed]
  4. Rodriguez, J.A.; Poppe, S.; Meier, H. The influence of wilting on the quality of tropical grass silage in Cuba. Arch. Anim. Nutr. 1989, 39, 785–792. [Google Scholar] [CrossRef]
  5. Parvin, S.; Nishino, N. Bacterial community associated with ensilage process of wilted guinea grass. J. Appl. Microbiol. 2009, 107, 2029–2036. [Google Scholar] [CrossRef] [PubMed]
  6. Oude Elferink, S.J.W.H.; Krooneman, E.J.; Gottschal, J.C.; Spoelstra, S.F.; Faber, F.; Driehuis, F. Anaerobic conversion of lactic acid to acetic acid and 1,2-propanediol by Lactobacillus buchneri. Appl. Environ. Microbiol. 2001, 67, 125–132. [Google Scholar] [CrossRef] [PubMed] [Green Version]
  7. Bartowsky, E.J.; Henschke, P.A. Acetic acid bacteria spoilage of bottled red wine–a review. Int. J. Food Microbiol. 2008, 125, 60–70. [Google Scholar] [CrossRef] [PubMed]
  8. McDonald, P.; Henderson, A.; Heron, S. The Biochemistry of Silage, 2nd ed.; Chalcombe: Marlow, UK, 1991. [Google Scholar]
  9. Tran, T.M.T.; Nguyen, H.V.; Nishino, N. A pilot examination of the fermentation products, aerobic stability and bacterial community of total mixed ration silage produced in Vietnam. Grassl. Sci. 2014, 60, 63–68. [Google Scholar] [CrossRef]
  10. Wali, A.; Nishino, N. Bacterial and fungal microbiota associated with the ensiling of wet soybean curd residue under prompt and delayed sealing conditions. Microorganisms 2020, 8, 1334. [Google Scholar] [CrossRef] [PubMed]
  11. Yu, Z.; Morrison, M. Improved extraction of PCR-quality community DNA from digesta and fecal samples. Biotechniques 2004, 36, 808–812. [Google Scholar] [CrossRef]
  12. Caporaso, J.G.; Lauber, C.L.; Walters, W.A.; Berg-Lyons, D.; Lozupone, C.A.; Turnbaugh, P.J.; Fierer, N.; Knight, R. Global patterns of 16S rRNA diversity at a depth of millions of sequences per sample. Proc. Natl. Acad. Sci. USA 2011, 108, 4516–4522. [Google Scholar] [CrossRef] [PubMed] [Green Version]
  13. Ihrmark, K.; Bödeker, I.T.M.; Cruz-Martinez, K.; Friberg, H.; Kubartova, A.; Schenck, J.; Strid, Y.; Stenlid, J.; Brandström-Durling, M.; Clemmensen, K.E.; et al. New primers to amplify the fungal ITS2 region-evaluation by 454-sequencing of artificial and natural communities. FEMS Microbiol. Ecol. 2012, 82, 666–677. [Google Scholar] [CrossRef] [PubMed]
  14. Berry, D.; Ben Mahfoudh, K.; Wagner, M.; Loy, A. Barcoded primers used in multiplex amplicon pyrosequencing bias amplification. Appl. Environ. Microbiol. 2011, 77, 7846–7849. [Google Scholar] [CrossRef] [PubMed] [Green Version]
  15. Bolyen, E.; Rideout, J.R.; Dillon, M.R.; Bokulich, N.A.; Abnet, C.C.; Al-Ghalith, G.A.; Alexander, H.; Alm, E.J.; Arumugam, M.; Asnicar, F.; et al. Reproducible, interactive, scalable and extensible microbiome data science using QIIME 2. Nat. Biotechnol. 2019, 37, 852–857. [Google Scholar] [CrossRef] [PubMed]
  16. Rivers, A.R.; Weber, K.C.; Gardner, T.G.; Liu, S.; Armstrong, S.D. ITSxpress: Software to rapidly trim internally transcribed spacer sequences with quality scores for marker gene analysis. F1000Research 2018, 7, 1418. [Google Scholar] [CrossRef]
  17. Callahan, B.J.; McMurdie, P.J.; Rosen, M.J.; Han, A.W.; Johnson, A.J.A.; Holmes, S.P. DADA2: High-resolution sample inference from Illumina amplicon data. Nat. Methods 2016, 13, 581–583. [Google Scholar] [CrossRef] [Green Version]
  18. Callahan, B.J.; McMurdie, P.J.; Holmes, S.P. Exact sequence variants should replace operational taxonomic units in marker-gene data analysis. ISME J. 2017, 11, 2639–2643. [Google Scholar] [CrossRef] [Green Version]
  19. Katoh, K.; Misawa, K.; Kuma, K.I.; Miyata, T. MAFFT: A novel method for rapid multiple sequence alignment based on fast Fourier transform. Nucleic Acids Res. 2002, 30, 3059–3066. [Google Scholar] [CrossRef] [Green Version]
  20. Price, M.N.; Dehal, P.S.; Arkin, A.P. FastTree 2-approximately maximum-likelihood trees for large alignments. PLoS ONE 2010, 5, e9490. [Google Scholar] [CrossRef]
  21. Nilsson, R.H.; Larsson, K.H.; Taylor, A.F.S.; Bengtsson-Palme, J.; Jeppesen, T.S.; Schigel, D.; Kennedy, P.; Picard, K.; Glöckner, F.O.; Tedersoo, L.; et al. The UNITE database for molecular identification of fungi: Handling dark taxa and parallel taxonomic classifications. Nucleic Acids Res. 2019, 47, D259–D264. [Google Scholar] [CrossRef]
  22. Shannon, P.; Markiel, A.; Ozier, O.; Baliga, N.S.; Wang, J.T.; Ramage, D.; Amin, N.; Schwikowski, B.; Ideker, T. Cytoscape: A software environment for integrated models of biomolecular interaction networks. Genome Res. 2003, 13, 2498–2504. [Google Scholar] [CrossRef] [PubMed]
  23. Duncan, S.H.; Louis, P.; Flint, H.J. Lactate-utilizing bacteria, isolated from human feces, that produce butyrate as a major fermentation product. Appl. Environ. Microbiol. 2004, 70, 5810–5817. [Google Scholar] [CrossRef] [PubMed] [Green Version]
  24. Li, D.; Ni, K.; Zhang, Y.; Lin, Y.; Yang, F. Fermentation characteristics, chemical composition and microbial community of tropical forage silage under different temperatures. Asian-Australas. J. Anim. Sci. 2019, 32, 665–674. [Google Scholar] [CrossRef] [PubMed]
  25. Ni, K.; Minh, T.T.; Tu, T.T.M.; Tsuruta, T.; Pang, H.; Nishino, N. Comparative microbiota assessment of wilted Italian ryegrass, whole crop corn, and wilted alfalfa silage using denaturing gradient gel electrophoresis and next-generation sequencing. Appl. Microbiol. Biotechnol. 2017, 101, 1385–1394. [Google Scholar] [CrossRef] [PubMed]
  26. Zalar, P.; Sybren de Hoog, G.; Schroers, H.-J.; Frank, J.M.; Gunde-Cimerman, N. Taxonomy and phylogeny of the xerophilic genus Wallemia (Wallemiomycetes and Wallemiales, cl. et ord. nov.). Antonie Van Leeuwenhoek 2005, 87, 311–328. [Google Scholar] [CrossRef]
  27. Surussawadee, J.; Khunnamwong, P.; Srisuk, N.; Limtong, S. Papiliotrema siamense f.a., sp. nov., a yeast species isolated from plant leaves. Int. J. Syst. Evol. Microbiol. 2014, 64, 3058–3062. [Google Scholar] [CrossRef] [Green Version]
  28. Vujanovic, V. Tremellomycetes yeasts in kernel ecological niche: Early indicators of enhanced competitiveness of endophytic and mycoparasitic symbionts against wheat pathobiota. Plants 2021, 10, 905. [Google Scholar] [CrossRef]
  29. Kot, A.M.; Kieliszek, M.; Piwowarek, K.; Błażejak, S.; Mussagy, C.U. Sporobolomyces and Sporidiobolus–non-conventional yeasts for use in industries. Fungal Biol. Rev. 2021, 37, 41–58. [Google Scholar] [CrossRef]
  30. Muck, R.E.; Moser, L.E.; Pitt, R.E. Postharvest factors affecting ensiling. In Silage Science and Technology; Buxton, D.R., Muck, R.E., Harrison, J.H., Eds.; American Society of Agronomy, Crop Science Society of America, Soil Science Society of America: Madison, WI, USA, 2003; pp. 251–304. [Google Scholar] [CrossRef]
  31. Bernardes, T.F.; Daniel, J.L.P.; Adesogan, A.T.; McAllister, T.A.; Drouin, P.; Nussio, L.G.; Huhtanen, P.; Tremblay, G.F.; Bélanger, G.; Cai, Y. Silage review: Unique challenges of silages made in hot and cold regions. J. Dairy Sci. 2018, 101, 4001–4019. [Google Scholar] [CrossRef]
  32. Weinberg, Z.G.; Szakacs, G.; Ashbell, G.; Hen, Y. The effect of temperature on the ensiling process of corn and wheat. J. Appl. Microbiol. 2001, 90, 561–566. [Google Scholar] [CrossRef] [Green Version]
  33. Gulfam, A.; Guo, G.; Tajebe, S.; Chen, L.; Liu, Q.; Yuan, X.; Bai, Y.; Shao, T. Characteristics of lactic acid bacteria isolates and their effect on the fermentation quality of Napier grass silage at three high temperatures. J. Sci. Food Agric. 2017, 97, 1931–1938. [Google Scholar] [CrossRef] [PubMed]
  34. Ohara, H.; Yahata, M. L-lactic acid production by Bacillus sp. in anaerobic and aerobic culture. J. Ferment. Bioeng. 1996, 81, 272–274. [Google Scholar] [CrossRef]
  35. Payot, T.; Chemaly, Z.; Fick, M. Lactic acid production by Bacillus coagulans—Kinetic studies and optimization of culture medium for batch and continuous fermentations. Enzyme Microb. Technol. 1999, 24, 191–199. [Google Scholar] [CrossRef]
Figure 1. Relative abundances of the 30 major genera (>1% in abundance) of the bacterial microbiota of pre-ensiled crops and silages prepared from direct-cut and wilted guinea grass. DC and WT indicate direct-cut and wilted crops and silages. 3D, 1M, and 2M indicate storage for 3 days, 1 month, and 2 months at 25 and 40 °C, respectively.
Fermentation 08 00010 g001
Figure 2. Beta diversity of the bacterial microbiota of pre-ensiled crops and silages prepared from direct-cut and wilted guinea grass. The principal coordinate analysis plot of the Bray-Curtis distance matrix was generated from the filtered genus (relative abundance > 1%). Points that are closer together on the ordination have a more similar microbiota. The operational taxonomy unit with a Pearson’s correlation of >0.7 is overlaid on the plot as vectors. Green circles denote samples enclosed in the same group at a 70% similarity level. PE, DC, WT, 3D, 1M, and 2M indicate pre-ensiled crop, direct-cut silage, wilted silage, silage stored for 3 days, silage stored for 1 month, and silage stored for 2 months, respectively.
Fermentation 08 00010 g002
Figure 3. Relative abundances of the 30 major genera (>1% in abundance) of the fungal microbiota of pre-ensiled crops and silages prepared from direct-cut and wilted guinea grass. DC and WT indicate direct-cut and wilted crops and silages. 3D, 1M, and 2M indicate storage for 3 days, 1 month, and 2 months at 25 and 40 °C, respectively.
Fermentation 08 00010 g003
Figure 4. Beta diversity of the fungal microbiota of pre-ensiled crops and silages prepared from direct-cut and wilted guinea grass. The principal coordinate analysis plot of the Bray-Curtis distance matrix was generated from the filtered genus (relative abundance >1%). Points that are closer together on the ordination have a more similar microbiota. The operational taxonomy unit with a Pearson’s correlation of >0.7 is overlaid on the plot as vectors. Green circles denote samples enclosed in the same group at a 70% similarity level. PE, DC, WT, 3D, 1M, and 2M indicate pre-ensiled crop, direct-cut silage, wilted silage, silage stored for 3 days, silage stored for 1 month, and silage stored for 2 months, respectively.
Fermentation 08 00010 g004
Figure 5. Correlation network diagram for fermentation products and major bacterial and fungal genera of direct-cut and wilted guinea grass silage. Green, blue, and purple nodes represent the fermentation product, bacterial genus, and fungal genus, respectively. The node size represents the degree of centrality, which is calculated as the number of edges connecting a node to others. The Spearman’s Rho of two nodes is indicated by the edge width, with red and blue edges describing the positive and negative relationships between the two nodes.
Fermentation 08 00010 g005
Table 1. Dry matter, pH value, and fermentation products of direct-cut guinea grass silage stored at 25 and 40 °C for 3 days, 1 month, and 2 months.
DM
(g/kg)
pHLactic Acid
(g/kg DM)
Acetic Acid
(g/kg DM)
Ethanol
(g/kg DM)
L/ANH3-N
(g/kg DM)
Propionic Acid
(g/kg DM)
Butyric Acid
(g/kg DM)
25 °C3 days1645.5115.0 a9.05 b3.19 b1.71 a1.33 bNDND
1 month1625.519.44 ab25.1 b4.02 b0.34 b2.38 ab0.909.28
2 months1555.370.34 b49.5 a15.0 a0.01 b3.95 a3.4721.6
SE3.410.163.565.162.160.200.54--
40 °C3 days168 z5.2421.36.84 z1.63 y3.14 x1.30 yNDND
1 month176 y5.0424.922.3 y2.25 y1.13 y1.99 xNDND
2 months188 x4.9525.227.4 x3.98 x0.93 y2.02 xNDND
SE1.160.102.951.140.320.390.08--
Two-way ANOVA
T<0.01<0.01<0.01<0.05<0.01<0.01<0.05--
P0.1260.3190.253<0.01<0.01<0.01<0.01--
T × P<0.010.761<0.05<0.05<0.050.5680.068--
DM, dry matter; L/A, lactic to acetic acid ratio; ND, not detected; SE, Pooled standard error; T, storage temperature; P, storage period. Values in the same column with different following letters (a–b, x–z) are significantly different. Due to the fact that the interaction was observed for several items, a one-way analysis of variance was performed for the storage at 25 and 40 °C separately.
Table 2. Dry matter, pH value, and fermentation products of wilted guinea grass silage stored at 25 and 40 °C for 3 days, 1 month, and 2 months.
DM
(g/kg)
pHLactic Acid
(g/kg DM)
Acetic Acid
(g/kg DM)
Ethanol
(g/kg DM)
L/ANH3-N
(g/kg DM)
Propionic Acid
(g/kg DM)
Butyric Acid
(g/kg DM)
25 °C3 days3546.12 a0.96 b1.08 c0.77 c0.920.50 bNDND
1 month3796.05 ab7.06 a7.43 b3.07 b1.011.51 aNDND
2 months3445.84 b9.36 a11.6 a6.98 a0.841.27 aNDND
SE17.50.060.981.000.490.200.16--
40 °C3 days3766.16 x1.86 z2.33 y1.40 y0.810.68 yNDND
1 month4195.77 y6.89 y5.48 y1.58 y1.301.23 xNDND
2 months4305.45 z13.1 x10.3 x5.25 x1.271.44 xNDND
SE20.00.051.451.010.560.220.09--
Two-way ANOVA
T<0.01<0.010.1640.4320.0680.2510.823--
P0.217<0.01<0.01<0.01<0.010.404<0.01--
T × P0.254<0.010.2960.2800.0850.4240.159--
DM, dry matter; L/A, lactic to acetic acid ratio; ND, not detected; SE, Pooled standard error; T, storage temperature; P, storage period. Values in the same column with different following letters (a–c, x–z) are significantly different. Due to the fact that the interaction was observed for several items, a one-way analysis of variance was performed for the storage at 25 and 40 °C separately.
Table 3. Relative abundances (%) of the eight most abundant bacterial genera in direct-cut guinea grass silage stored at 25 and 40 °C for 3 days, 1 month, and 2 months.
Unclassified
Enterobacteriaceae
LactobacillusLactococcusPediococcusEnterococcusWeissellaClostridiumBacillus
25 °C3 days46.16.3237.6 a0.813.242.58ND0.01
1 month39.332.010.9 b0.834.792.794.540.15
2 months32.719.210.1 b0.576.341.3124.30.02
SE5.316.692.100.360.831.29-0.03
40 °C3 days59.13.36 y20.8 x6.36 x3.82 z4.32NDND
1 month50.325.3 x13.0 y1.59 y6.37 y1.82ND0.48
2 months49.023.1 x11.4 y3.29 xy7.23 x1.380.182.32
SE4.193.100.870.860.191.33--
Two-way ANOVA
T0.118<0.05<0.01<0.05<0.010.3420.132<0.01
P<0.050.672<0.05<0.010.0840.8010.074<0.01
T × P0.8580.612<0.01<0.050.7120.6050.139<0.01
SE, Pooled standard error; T, storage temperature; P, storage period. ND, not detected. Values in the same column with different following letters (a–b, x–z) are significantly different. Due to the fact that the interaction was observed for several items, a one-way analysis of variance was performed for the storage at 25 and 40 °C separately.
Table 4. Relative abundances (%) of the eight most abundant bacterial genera in wilted guinea grass silage stored at 25 and 40 °C for 3 days, 1 month, and 2 months.
Unclassified
Enterobacteriaceae
LactobacillusLactococcusPediococcusEnterococcusWeissellaClostridiumBacillus
25 °C3 days60.70.85 b12.4 a1.766.43 b2.25 aND0.52
1 month62.43.76 ab6.18 b6.2219.0 a0.19 bNDND
2 months57.26.47 a4.52 b6.1222.8 a0.22 b0.010.06
SE3.401.230.751.391.980.09--
40 °C3 days74.80.222.352.7711.80.440.011.25
1 month59.85.990.538.777.610.080.0215.1
2 months63.03.040.342.396.590.010.0019.5
SE7.651.590.683.062.530.250.0011.0
Two-way ANOVA
T0.427<0.05<0.010.1650.108<0.010.8190.528
P0.2770.618<0.010.977<0.01<0.010.2860.113
T × P0.4240.217<0.050.437<0.01<0.010.5280.493
SE, Pooled standard error; T, storage temperature; P, storage period. ND, not detected. Values in the same column with different following letters (a–b) are significantly different. Due to the fact that the interaction was observed for several items, a one-way analysis of variance was performed for the storage at 25 and 40 °C separately.
Table 5. Relative abundances (%) of the eight most abundant fungal genera in direct-cut guinea grass silage stored at 25 and 40 °C for 3 days, 1 month, and 2 months.
WallemiaMucorSaitozymaHannaellaSporobolomycesPapiliotremaMoesziomycesCladosporium
25 °C3 days6.58 c0.332.7 a6.9014.6 a17.7 a6.671.74
1 month47.3 aND4.24 b1.611.97 b5.42 abND2.28
2 months32.1 bND7.70 b1.071.03 b0.02 b1.912.45
SE3.12-4.832.542.222.85-0.63
40 °C3 days22.4ND20.85.428.9816.19.90 x2.07
1 month50.1ND12.7ND6.442.730.68 y9.67
2 months42.9ND13.01.132.860.401.45 y4.55
SE11.6-5.92-2.164.161.615.05
Two-way ANOVA
T<0.05-<0.050.087<0.01<0.01<0.010.556
P0.207-0.9000.5930.9100.6710.3230.308
T × P0.753-0.2080.9160.1340.9110.4120.618
SE, Pooled standard error; T, storage temperature; P, storage period. ND, not detected. Values in the same column with different following letters (a–c, x–y) are significantly different. Although the interaction was not observed for any items, a one-way analysis of variance was performed for the storage at 25 and 40 °C separately.
Table 6. Relative abundances (%) of the eight most abundant fungal genera in wilted guinea grass silage stored at 25 and 40 °C for 3 days, 1 month, and 2 months.
WallemiaMucorSaitozymaHannaellaSporobolomycesPapiliotremaMoesziomycesCladosporium
25 °C3 days1.820.2633.9 a6.1712.512.88.71 a3.87
1 month1.0842.713.9 b0.7112.57.421.09 b2.13
2 months4.933.9819.7 ab3.2910.612.46.67 a4.41
SE2.9222.63.412.505.793.250.862.64
40 °C3 days6.361.1618.62.149.9526.74.82 x5.63
1 month8.080.5814.97.9116.617.01.75 y3.99
2 months18.70.1113.13.5413.713.70.62 y3.00
SE6.780.753.271.855.018.100.521.61
Two-way ANOVA
T0.3210.401<0.050.9100.8260.458<0.010.747
P0.0950.294<0.050.5480.7370.154<0.010.694
T × P0.6730.3970.1270.1070.8060.609<0.010.709
SE, Pooled standard error; T, storage temperature; P, storage period. ND, not detected. Values in the same column with different following letters (a–b, x–y) are significantly different. Although the interaction was not observed for any items, a one-way analysis of variance was performed for the storage at 25 and 40 °C separately.
Publisher’s Note: MDPI stays neutral with regard to jurisdictional claims in published maps and institutional affiliations.

