1. Introduction
In the current scenario of a growing world population and decreasing resources, together with the environmental implications of fossil fuel combustion, alternatives sources for fuels and chemicals need to be found. The dependence of our society on fossil fuels is clear: a vast majority of everyday materials, as well as primary energy, are derived from fossil fuels [
1]. In contrast, the fermentation of synthesis gas (syngas) by acetogenic bacteria can provide an environmentally-friendly and renewable alternative for the production of low-carbon fuels and chemicals, and is receiving ever more attention [
2,
3,
4].
Syngas consists of a mixture of mainly CO, H
2 and CO
2, and it can be derived from the gasification of biomass. This is advantageous in comparison to the fermentation of biomass-derived sugar feedstocks since the lignin fraction becomes accessible [
5]. Carboxydotrophic and homoacetogenic bacteria such as
Clostridium ljungdahlii can grow by using the carbon and electrons derived from syngas, thanks to their unique carbon-fixating Wood–Ljungdahl pathway. Their primary end-products are acetic acid and ethanol, but other products such as butyrate or butanol have also been described [
6,
7]. Given the fact that these microorganisms are becoming more relevant, the understanding of the fermentation process and their product formation profile is of valuable interest.
Acetogenic bacteria growing on CO
2/H
2 and/or CO experience a metabolic shift similar to that seen in ABE Clostridia [
3], which display a biphasic fermentation profile: during exponential growth, carboxylic acids are produced together with H
2 and CO
2 (acidogenic phase), while during the stationary phase these acids are taken up and solvents are formed (solventogenic phase). This metabolic change is accompanied by a significant change in gene expression [
8]. Despite the strategy similarities of both ABE and syngas-fermenting Clostridia, no gene expression regulation could be found as the mechanism driving the shift in the syngas-fermenting microorganism [
4]. Physiologically, temperature, pH, acetic acid concentration and nutrient limitation are regarded as factors that can induce a transition to non-growth conditions and solventogenesis [
3,
9].
By increasing or decreasing certain medium components, biomass, gas consumption and product formation can be affected [
10,
11].
Moreover, based on a proteome analysis, Richter et al. [
4] found that the genes for the sulfate reduction in the sulfur-assimilation pathway in
C. ljungdahlii are absent. Therefore, they suggested replacing the sulfate that is usually present in the syngas fermentation medium by sulfide or cysteine. In this context, a medium containing no sulfate, but cysteine as the sulfur source has already been reported to support growth for
Clostridium autoethanogenum,
Clostridium ljungdahlii and
Clostridium ragsdalei [
12].
Yeast extract is a crucial part of the medium since its removal does not support the growth of syngas-fermenting microorganisms [
13]. Even so, the reduction of its concentration in the medium has been shown to produce a shift, in some cases, towards ethanol [
10,
13,
14,
15]. However, the necessity for complex and not well understood medium components in the syngas fermentation medium is remarkable [
11,
16].
Certainly, not only nutrients affect the outcome. pH also plays an essential role in the fermentation performance: it significantly impacts the behavior of the microorganism, affecting both growth rate and product formation. A drop in the external pH might result in some cases in the production of more reduced compounds, such as ethanol [
10,
13,
14].
A further important point of focus of this study was the evaluation of changes on the gas consumption profile of the culture. Not many studies can be found on the topic of syngas which show a system with the ability to track changes in the consumption of the gas substrates with on-line analytics, even if it is considered to be very relevant information [
17]. In many cases, studies focusing on the effect of medium components or gas composition are performed in batch, with serum bottles, with the limitations that this implies (difficult pH control, no continuous gas feed and no possibility of out-gas analysis).
Taking all this into account, this study focused on assessing the ability of the presented fermenter setup to follow the effect of two selected nutrients (yeast extract and sulfur, in the form of cysteine), as well as the impact of pH and the influence of the amount of substrate fed (gas flow rate) on syngas fermentation by C. ljungdahlii. For this, products, biomass formation and gas consumption were analyzed, and the obtaining of a closed carbon balance was also assessed.
2. Materials and Methods
2.1. Microorganism and Medium
C. ljungdahlii DSM 13528 was used to perform the fermentations. Unless otherwise stated, all chemicals were acquired from Carl Roth GmbH + Co. KG (Karlsruhe, Germany) or Sigma-Aldrich Chemie GmbH (Hamburg, Germany).
Both the pre-cultures and the fermentation media was based on the one described by Tanner [
18]. It contained: 20 g/L 2-(
N-morpholino) ethanesulfonic acid (MES), 0.5 g/L yeast extract (BD Biosciences, San Jose, CA, USA), 2 g/L NaCl, 2.5 g/L NH
4Cl, 0.25 g/L KCl, 0.25 g/L KH
2PO
4, 0.5 g/L MgSO
4·7H
2O, 0.1 g/L CaCl
2·2H
2O, 10 mL trace element solution, 10 mL vitamin solution and 0.001 g/L resazurin. The pH was adjusted to 5.9 using 4 M KOH before autoclaving at 121 °C. After that, 0.6 g/L cysteine-HCl∙H
2O were added to each fermenter, while the pH control was active to counteract the acidification caused. For the pre-cultures, 1 g/L was added to each serum flask, and the pH was measured and adjusted with 4 M KOH if necessary. The trace element solution contained: 2 g/L nitrilotriacetic acid, 1 g/L MnSO
4∙H
2O, 0.567 g/L FeSO
4·7H
2O, 0.2 g/L CoCl
2·6H
2O (Riedel-de Haën, Seelze, Germany), 0.2 g/L ZnSO
4·7H
2O, 0.02 g/L CuCl
2·2H
2O, 0.02 g/L NiCl
2·6H
2O, 0.02 g/L Na
2MoO
4·2H
2O, 0.02 g/L Na
2SeO
3·5H
2O and 0.022 g/L Na
2WO
4·2H
2O. The vitamin solution contained: 2 mg/L biotin, 2 mg/L folic acid, 10 mg/L pyridoxine (Alfa Aesar, Kandel, Germany), 5 mg/L thiamine-HCl, 5 mg/L riboflavin, 5 mg/L niacin, 5 mg/L calcium-pantothenate, 5 mg/L cobalamin, 5 mg/L 4-aminobenzoic acid and 5 mg/L lipoic acid (Cayman Chemical, Ann Arbor, MI, USA).
The pre-cultures for each experiment were freshly prepared, starting from a single glycerol stock. Glycerol stocks were produced from a 48 h grown culture. Five milliliters of the culture were aseptically and anaerobically removed and dispensed into a sterile, anaerobized Hungate-type culture tube. The culture was then centrifuged for 5 min at 4 °C and 3000× g. The supernatant was then discarded, and the pellet was resuspended in 1 mL of anaerobic and sterile freezing solution, made with equal volumes of culture media and a 50 vol-% glycerol solution.
For the pre-culture, a glycerol stock frozen at −80 °C was thawed and its entire volume was anaerobically and sterilely dispensed into a 100 mL anaerobic serum flask containing 50 mL of the Tanner medium. The carbon source used for the pre-cultures was 10 g/L of fructose. This culture was allowed to grow for 48 h at 37 °C without shaking. Two subsequent passages with the same cultivation conditions were performed, but, for the second passage, three 250 mL serum flasks, with a working volume of 150 mL, were used. In all cases, a 10% inoculum volume was added to the serum flasks containing fresh medium. The fermenters were all inoculated simultaneously with a 10% inoculum volume, using the full content (150 mL) of one of the 250 mL serum flask for each fermenter.
2.2. Fermentation Conditions
All fermentations were carried out in Minifors® bench-top stirred tank reactors (Infors AG, Bottmingen, Switzerland), which have a total volume of 2.5 L. The working liquid volume was 1.5 L. All experiments were performed in triplicates (that is, three reactors were inoculated simultaneously and operated in parallel).
The gas for the fermentation was supplied with a microsparger, while the gas flow rate was controlled via a mass flow controller (MFC) red-y smart series, from Vögtlin Instruments (Aesch, Switzerland).
The temperature of the fermenter was kept at 37 °C, pH was controlled at 5.9 with 4 M KOH and stirring was regulated at 800 rpm. This conditions were selected as the standard, following previous experiments conducted in this group [
19].
Anaerobic conditions were ensured after autoclaving by sparging the fermenters with N2 for 2 h. Following this, the gas supply was changed to syngas with a flow rate of 50 mL/min for at least 3 h until just before inoculation, when the gas flow rate was adjusted as required.
A detailed description of the fermenter setup can be found in the work of Oswald et al. [
20]. The gas flow rate being fed into the fermenters was controlled at 18 mL/min [
19]. For all the fermentations, a pure gas mixture was used, with the following composition: 32.50 vol-% CO, 16.00 vol-% CO
2, 32.50 vol-% H
2 and 19 vol-% N
2 (Air Liquide, Paris, France).
2.3. Experimental Set-Up
Six experiments were conducted, where the effects of different gas flows, pH, initial yeast extract concentration and initial cysteine concentration were observed. Each experiment was performed as a triplicate (unless otherwise stated), and all fermentations were carried out for approximately 93 h. A detailed description of each setup can be found in
Table 1.
The optimum growing pH for
Clostridium ljundahlii was reported to be 6.0 [
21], but the DSMZ recommends a pH of 5.9. This is used as optimum growing pH in this study. pH 4.8 was used as lower limit since it was the lowest pH at which cell growth was still detected. pH 5.4 was chosen as a mid-point between the optimum, 5.9, and the lowest pH where cell growth was still detected.
2.4. Analytical Methods
The fermenters’ off-gas were analyzed using a GC-2010 Plus AT gas chromatograph (GC) (Shimadzu, Kyoto, Japan), with a ShinCarbon ST 80/100 Column (2 m × 0.53 mm ID, Restek, Germany) and an Rtx-1 capillary column (1 μm, 30 m × 0.25 mm ID, Restek, Bad Homburg, Germany).The detector used was a thermal conductivity detector with helium as carrier gas. The column flow rate was 3 mL/min, with an oven temperature of 40 °C for 3 min followed by a ramp of 35 °C/min. The total analysis time was 7.5 min. Data obtained were subsequently evaluated as described in [
20].
The sampling regime was as follows: four samples of 2 mL were taken daily at 2–3 h intervals, with no sample collection taking place overnight. These were then used for OD (optical density) determination and left-over fructose and products (acetate and ethanol) concentration. OD (optical density) was determined at 600 nm. The sample collection, its treatment and off-line analysis were described in detail by Oswald et al. [
20]. pH was measured on-line.
The OD (optical density) and cell dry weight (CDW) correlation was determined as the average of 12 fermentations under comparable conditions (data not shown), with a resulting factor of 0.30 g/L/OD.
2.5. Calculation of Product Formation Parameters Using Different Metrics and at Specific Phases of the Fermentation
A list of terms used through this work is provided below.
Substrate: CO, CO2 and H2.
Substrate fed: amount of substrate, in mol, sparged into the bioreactor.
Substrate usage: difference between the amount of substrate fed into the reactor and the amount measured in the off-gas stream (in mol). A negative usage value indicates production.
Carbon fixation: amount of CO and/or CO2, in mol, that was incorporated into products or biomass.
CO fixed: amount of CO assimilated by the cells to products or biomass and not released as CO2.
CO used: both the CO fixed and the amount of CO that was converted to CO2 by the bacteria which was incorporated and was not released with the out-gas.
In the absence of any other carbon source, if the amount of CO2 in the off-gas is larger than the amount being fed (i.e., the CO2 usage value is positive), it is an indication of CO being converted to CO2. This amount of produced CO2 from CO (in mol) must be subtracted from the “used” amount of CO (in mol) to obtain the actual amount of CO fixed.
Taking this into account, two scenarios are possible: Firstly, if CO
2 is produced from CO, the value of the (perceived) CO usage will be higher than the actual amount of CO fixed into products and biomass. Secondly, if no CO
2 is produced, then the amount of CO fixed is equal to the amount of CO used. For clarity, a short overview of the calculation is given below:
Regarding yield calculations, they are all given here in gram of product (the sum of acetate and ethanol, in grams) per gram of substrate (the sum of CO2, CO and H2, in grams). Three approaches were used: yield per substrate fed (YP/S, fed), yield per substrate used (YP/S, used) and yield per substrate fixed (YP/S, fixed). In the latter case, this includes the amount of CO fixed, the amount of H2 and, if any, the amount of CO2 used.
To be able to analyze and compare the data between the different fermentations, the product formation parameters yield and productivity, as well as the acetate to ethanol ratio were calculated for the complete run, and up to the point when maximum CO consumption stopped.
Yield and productivity calculations described as “endpoint” were calculated using the values measured with the sample taken immediately before terminating the fermentation, at approximately 93 h.
The maximum CO fixation interval was determined by identifying the period where the CO fixation reached a value of 85% or higher. Calculations were done from the starting of the fermentation to the last point when CO fixation was above 85%. Due to limitations in the number of samples that could be withdrawn, the measurements from the sample closest to that point are used.
The interval of maximum overall usage is determined according to the gas consumption profile. The sum of CO fixation and CO2 and H2 usage for each measured point is calculated throughout the fermentation; note that only if no CO2 is produced then CO used equals CO fixed. The maximum value achieved is defined as the maximum overall usage. The interval of maximum overall usage is the period during which the sum of the usage value of the three gaseous substrates is ≥85% of the mentioned maximum.
2.6. Carbon Balance
To estimate the carbon content in the dry biomass, an approximation of the elemental composition of bacterial cells was used. The total amount of carbon, in mmol, in the dry biomass was calculated by using the carbon content of
Escherichia coli as reported by Taymaz-Nikerel et al. [
22], 44% carbon per dry weight (in gram).
3. Results
If not otherwise stated, all fermentations were done as triplicates (n = 3), and the results are presented here as the average.
3.1. Effect of Medium Components
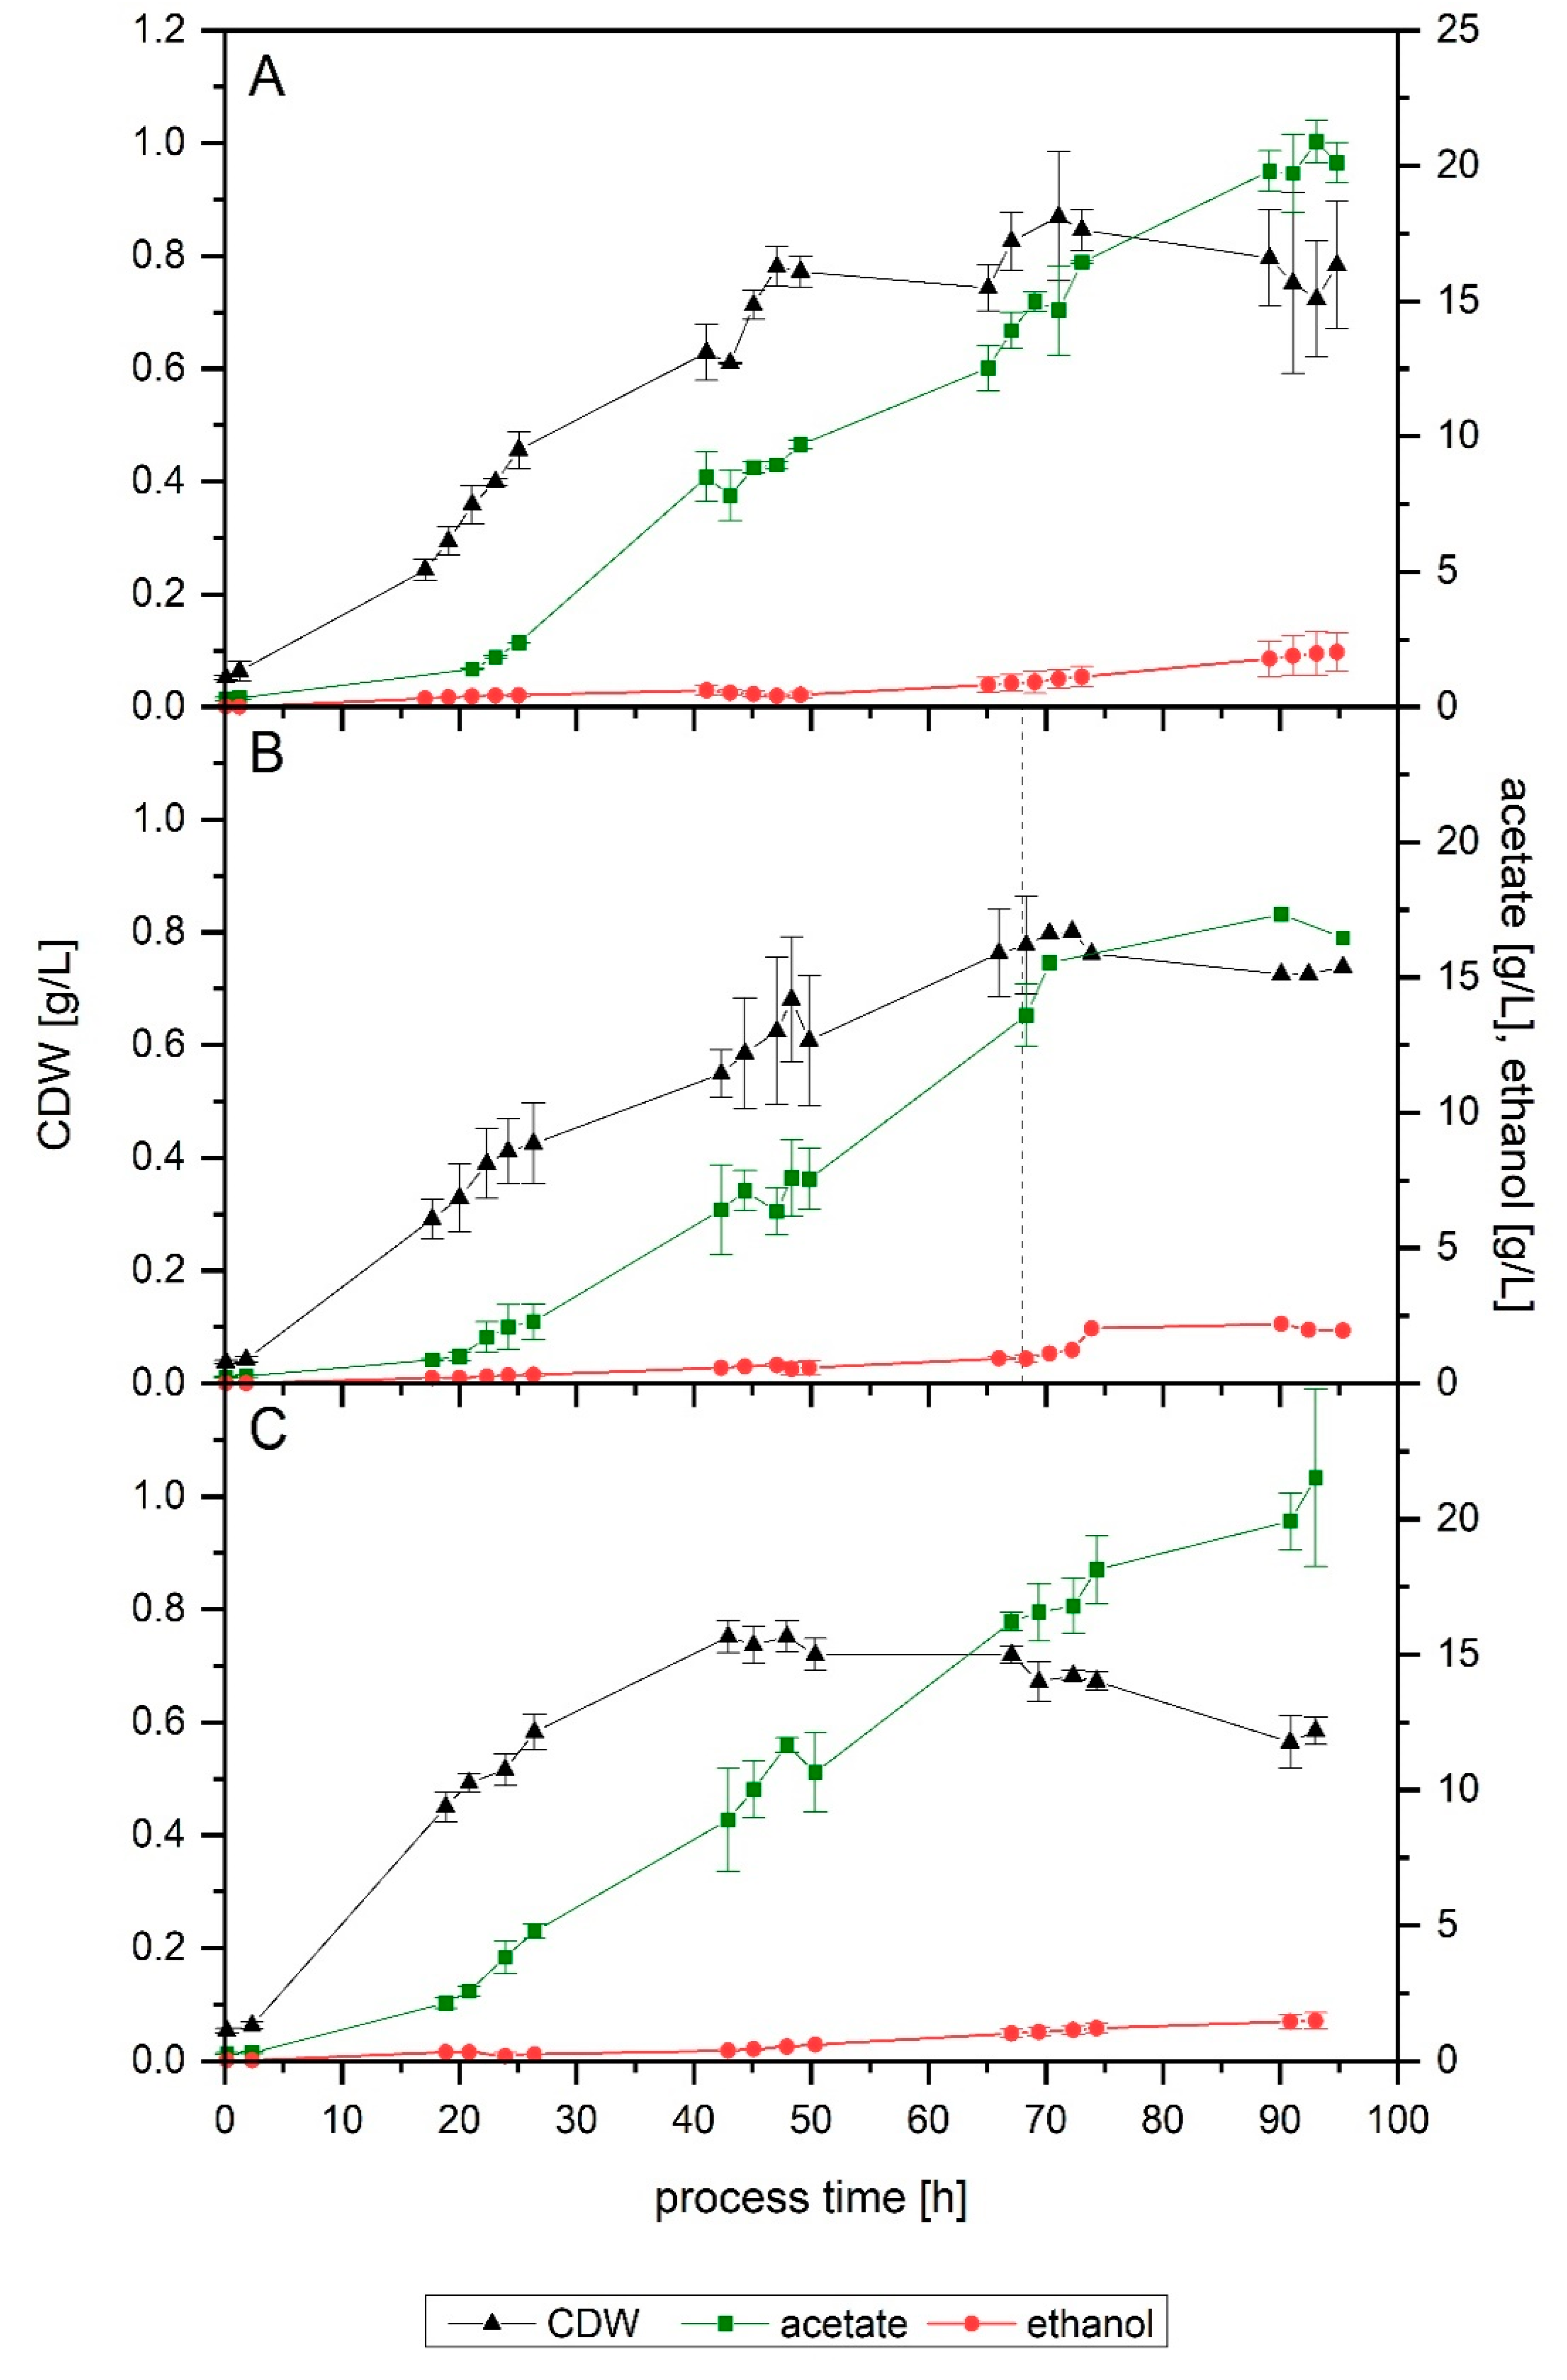
The first fermentation (Setup 1) achieved a final acetate and ethanol concentration of 20.1 and 2.0 g/L, respectively, after 95 h (
Figure 1A). At 69 h, 15.0 g/L of acetate and 0.9 g/L of ethanol had been formed. In the case of the increased cysteine, at 68 h, 13.6 g/L of acetate and 0.9 g/L of ethanol had been formed. After 95 h, the concentration of products in the reactor kept at pH 5.9 was 16.6 g/L of acetate and 2.0 g/L of ethanol. During the fermentation with 1 g/L of cysteine (Setup 3), for the first 68 h, it became clear that the behavior of the culture was equivalent to that of Setup 1. In two fermenters (Setup 3b), the pH was lowered after 68 h, but one fermenter (Setup 3a) was kept at 5.9 to corroborate that an increased cysteine concentration also did not affect the behavior of the microorganism later in the run (
Figure 1B).
Both Setups 1 and 3 followed a remarkably similar growth pattern up to 68 h. Setup 1 reached a final and a maximum cell dry weight (CDW) of 0.8 and 0.9 g/L, respectively. In this fermenter, at 67 h, the CDW concentration was 0.8 g/L. In the case of increased cysteine, the same value was achieved at 68 h. For the fermenter left unaltered, Setup 3a, the CDW at 95 h of process-time and the maximum value reached were 0.7 and 0.8 g/L, respectively.
Concerning the influence of an increased yeast extract concentration (Setup 4), a comparable final amount of acetate was formed (21.5 g/L), but only 1.4 g/L of ethanol was produced (
Figure 1C). In terms of biomass, the final reached value was lower (0.6 g/L), as well as its maximum (0.8 g/L at 48 h), resulting in a notably higher Y
P/X value: 41 g/g compared to 29 g/g in both Setups 1 and 3a.
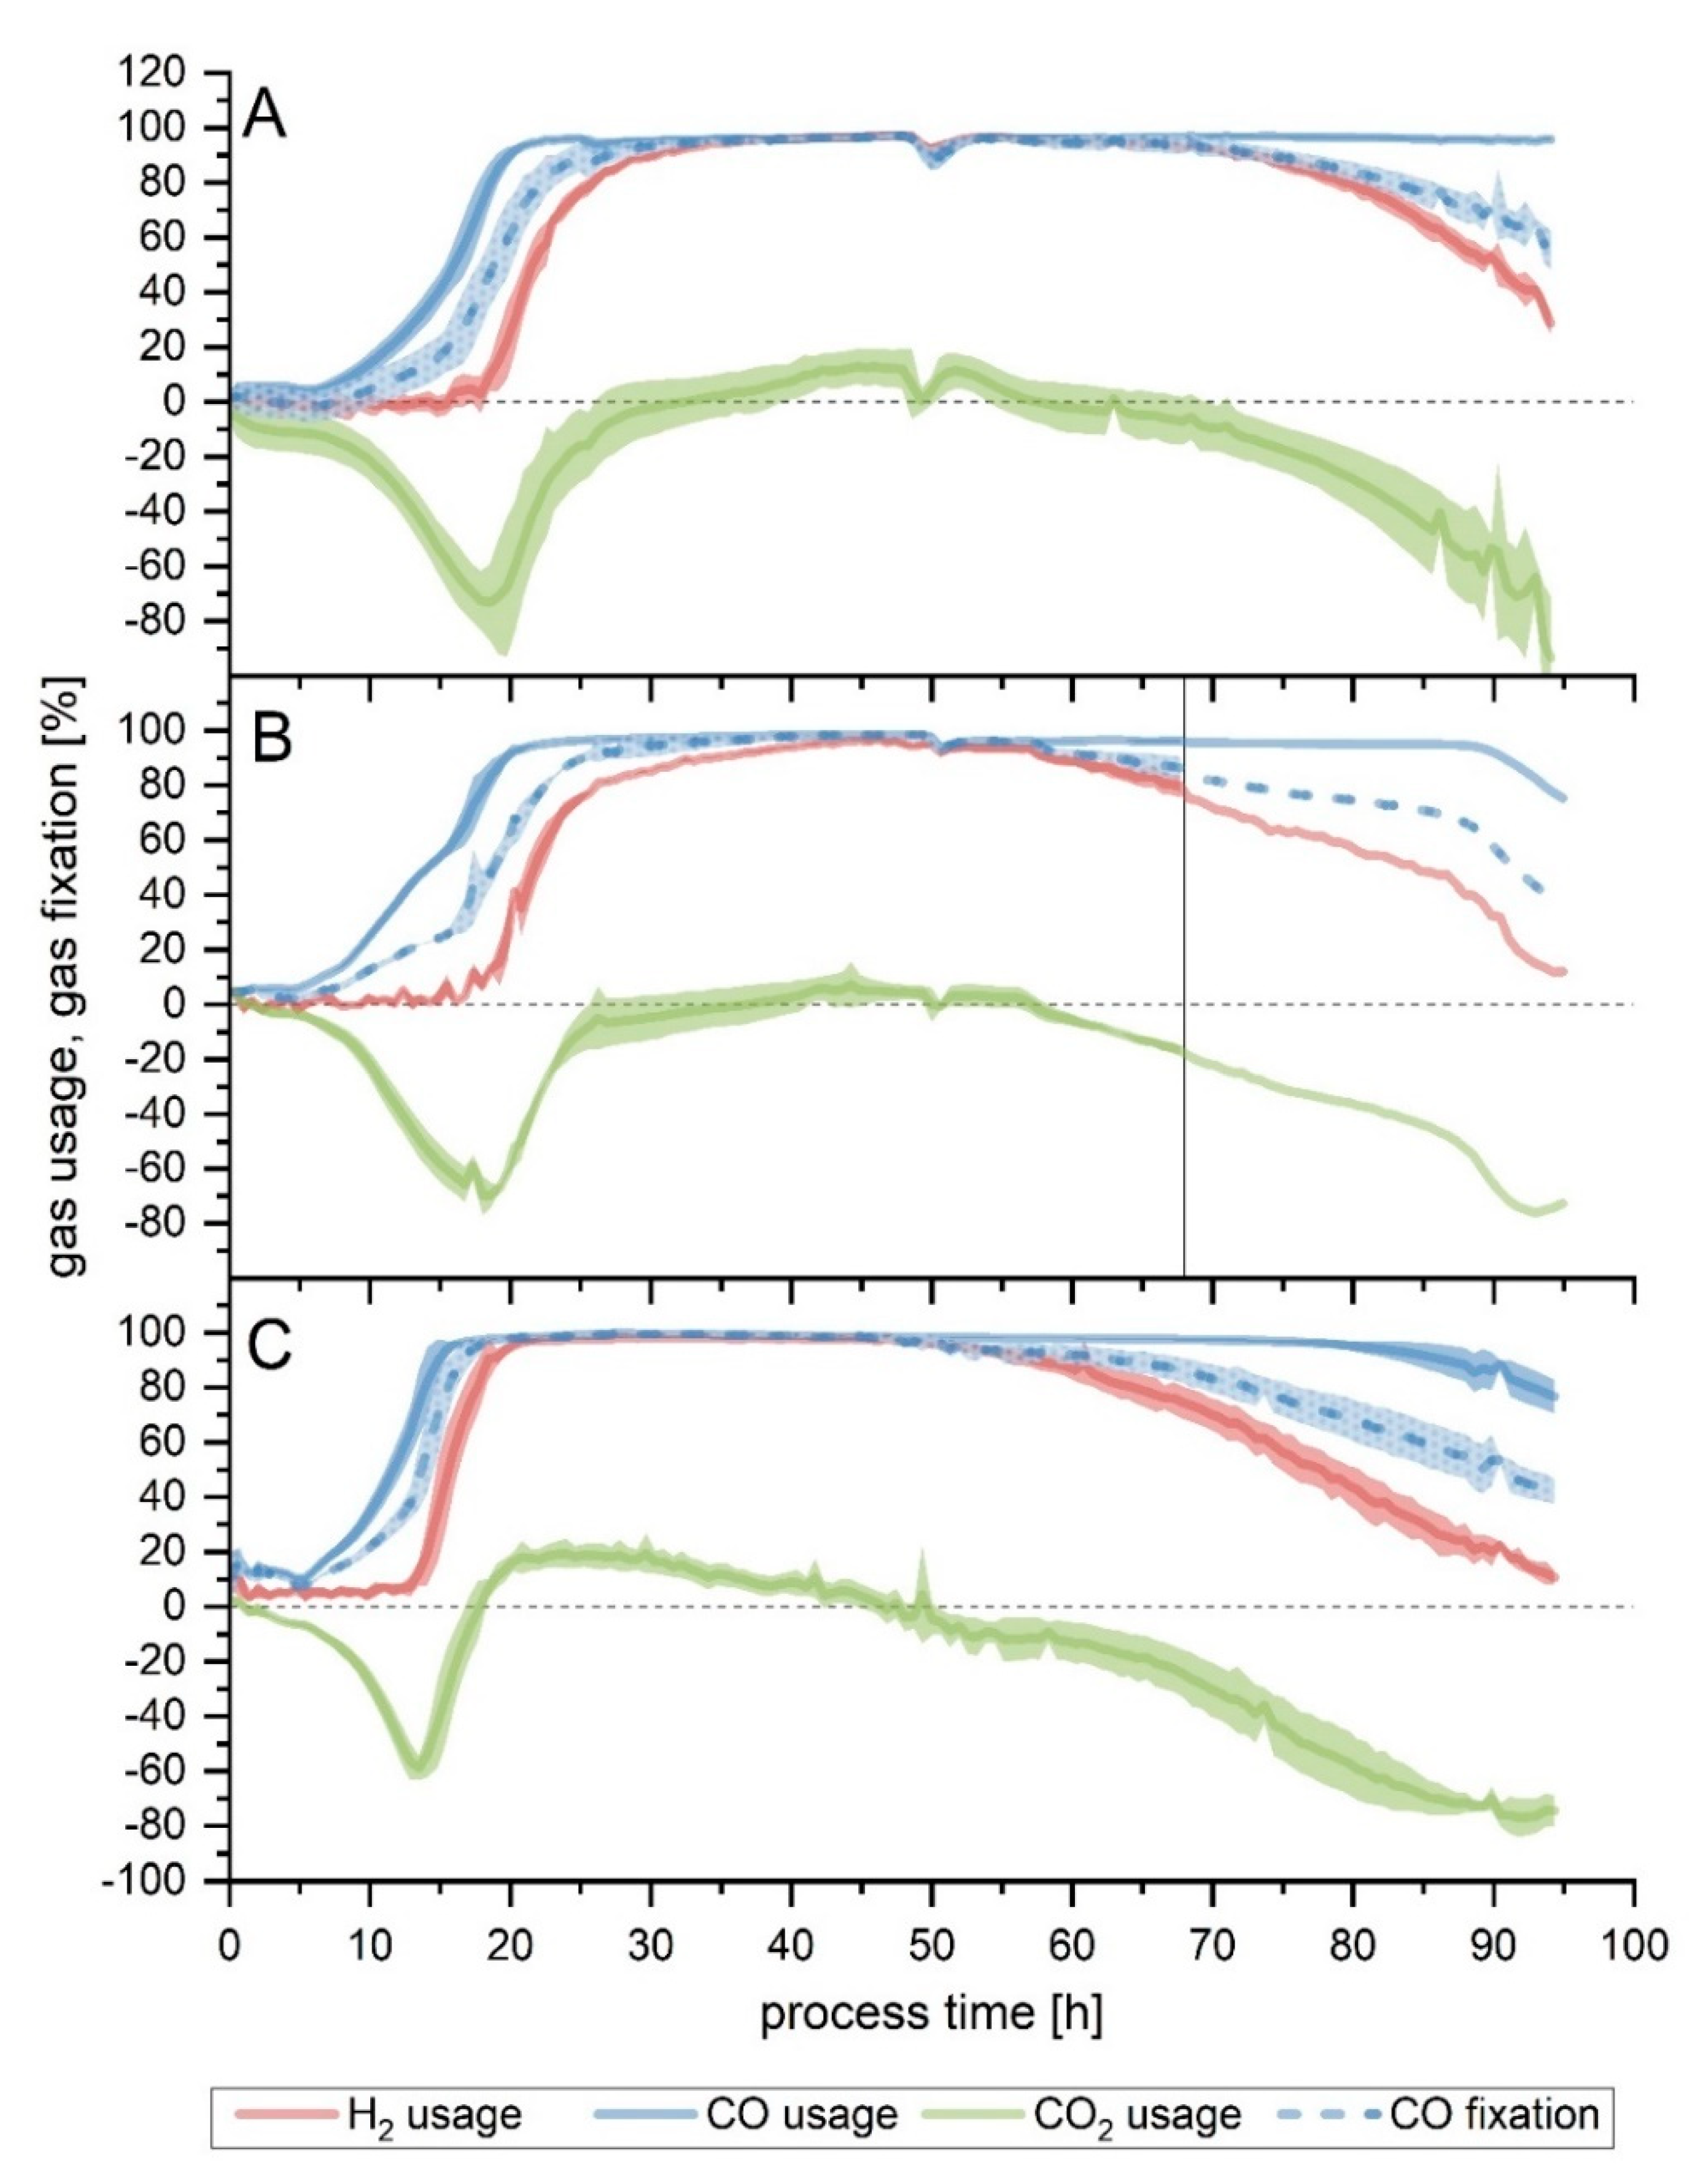
Substrate consumption graphs are depicted in detail in
Figure 2. Because of the difference of the gas consumption profiles of one fermenter, it was left out for the average calculations. This is discussed further in detail in the section below. Both medium modifications performed similarly to Setup 1 as to the duration of the maximum overall usage of the substrate, but the starting and ending time did differ, with Setup 4 (increased yeast extract) starting earlier. When looking solely at CO fixation, Setups 3a, 3b and 4 behaved alike, with the maximum CO fixation lasting around 10 h less compared to the conditions of Setup 1 (
Table 2). The off-gas profile for Setups 1, 3 and 4 are shown in
Figure S1.
Concerning the overall yields (calculated up to the end of the fermentation), the most significant difference is the Y
P/X in Setup 4, as mentioned above (
Table 3). Moreover, Setup 4 had the highest productivity among all fermentations, despite the reduction in the amount of ethanol produced.
For easier comparison, since all fermentations where run for approximately 93 h, but each stopped consuming the gaseous substrates at different times, yields and productivities were also calculated up to the point when maximum CO fixation came to an end. Setups 1, 3a, 3b and 4 performed similarly when compared up to the point when maximum CO fixation stopped. The most noticeable difference is the lower YP/S, fed achieved by Setup 3b. The highest converted amount of carbon fed into products (YP/S, fed) was reached by Setup 1 (0.51), while Setup 3b was the lowest (0.38). Nonetheless, the latter achieved a comparable yield of products per carbon fixed (YP/S, fixed). In terms of gram of product formed per gram of biomass (YP/X), the difference seen on the end-of-process yields is already found here, with Setup 4 achieving the highest value. The acetate to ethanol ratio also differs slightly during this phase, with the most acetate per mol of ethanol being produced by the Setup 1 fermentation, contrasting with the results seen when looking at the end-of-process values.
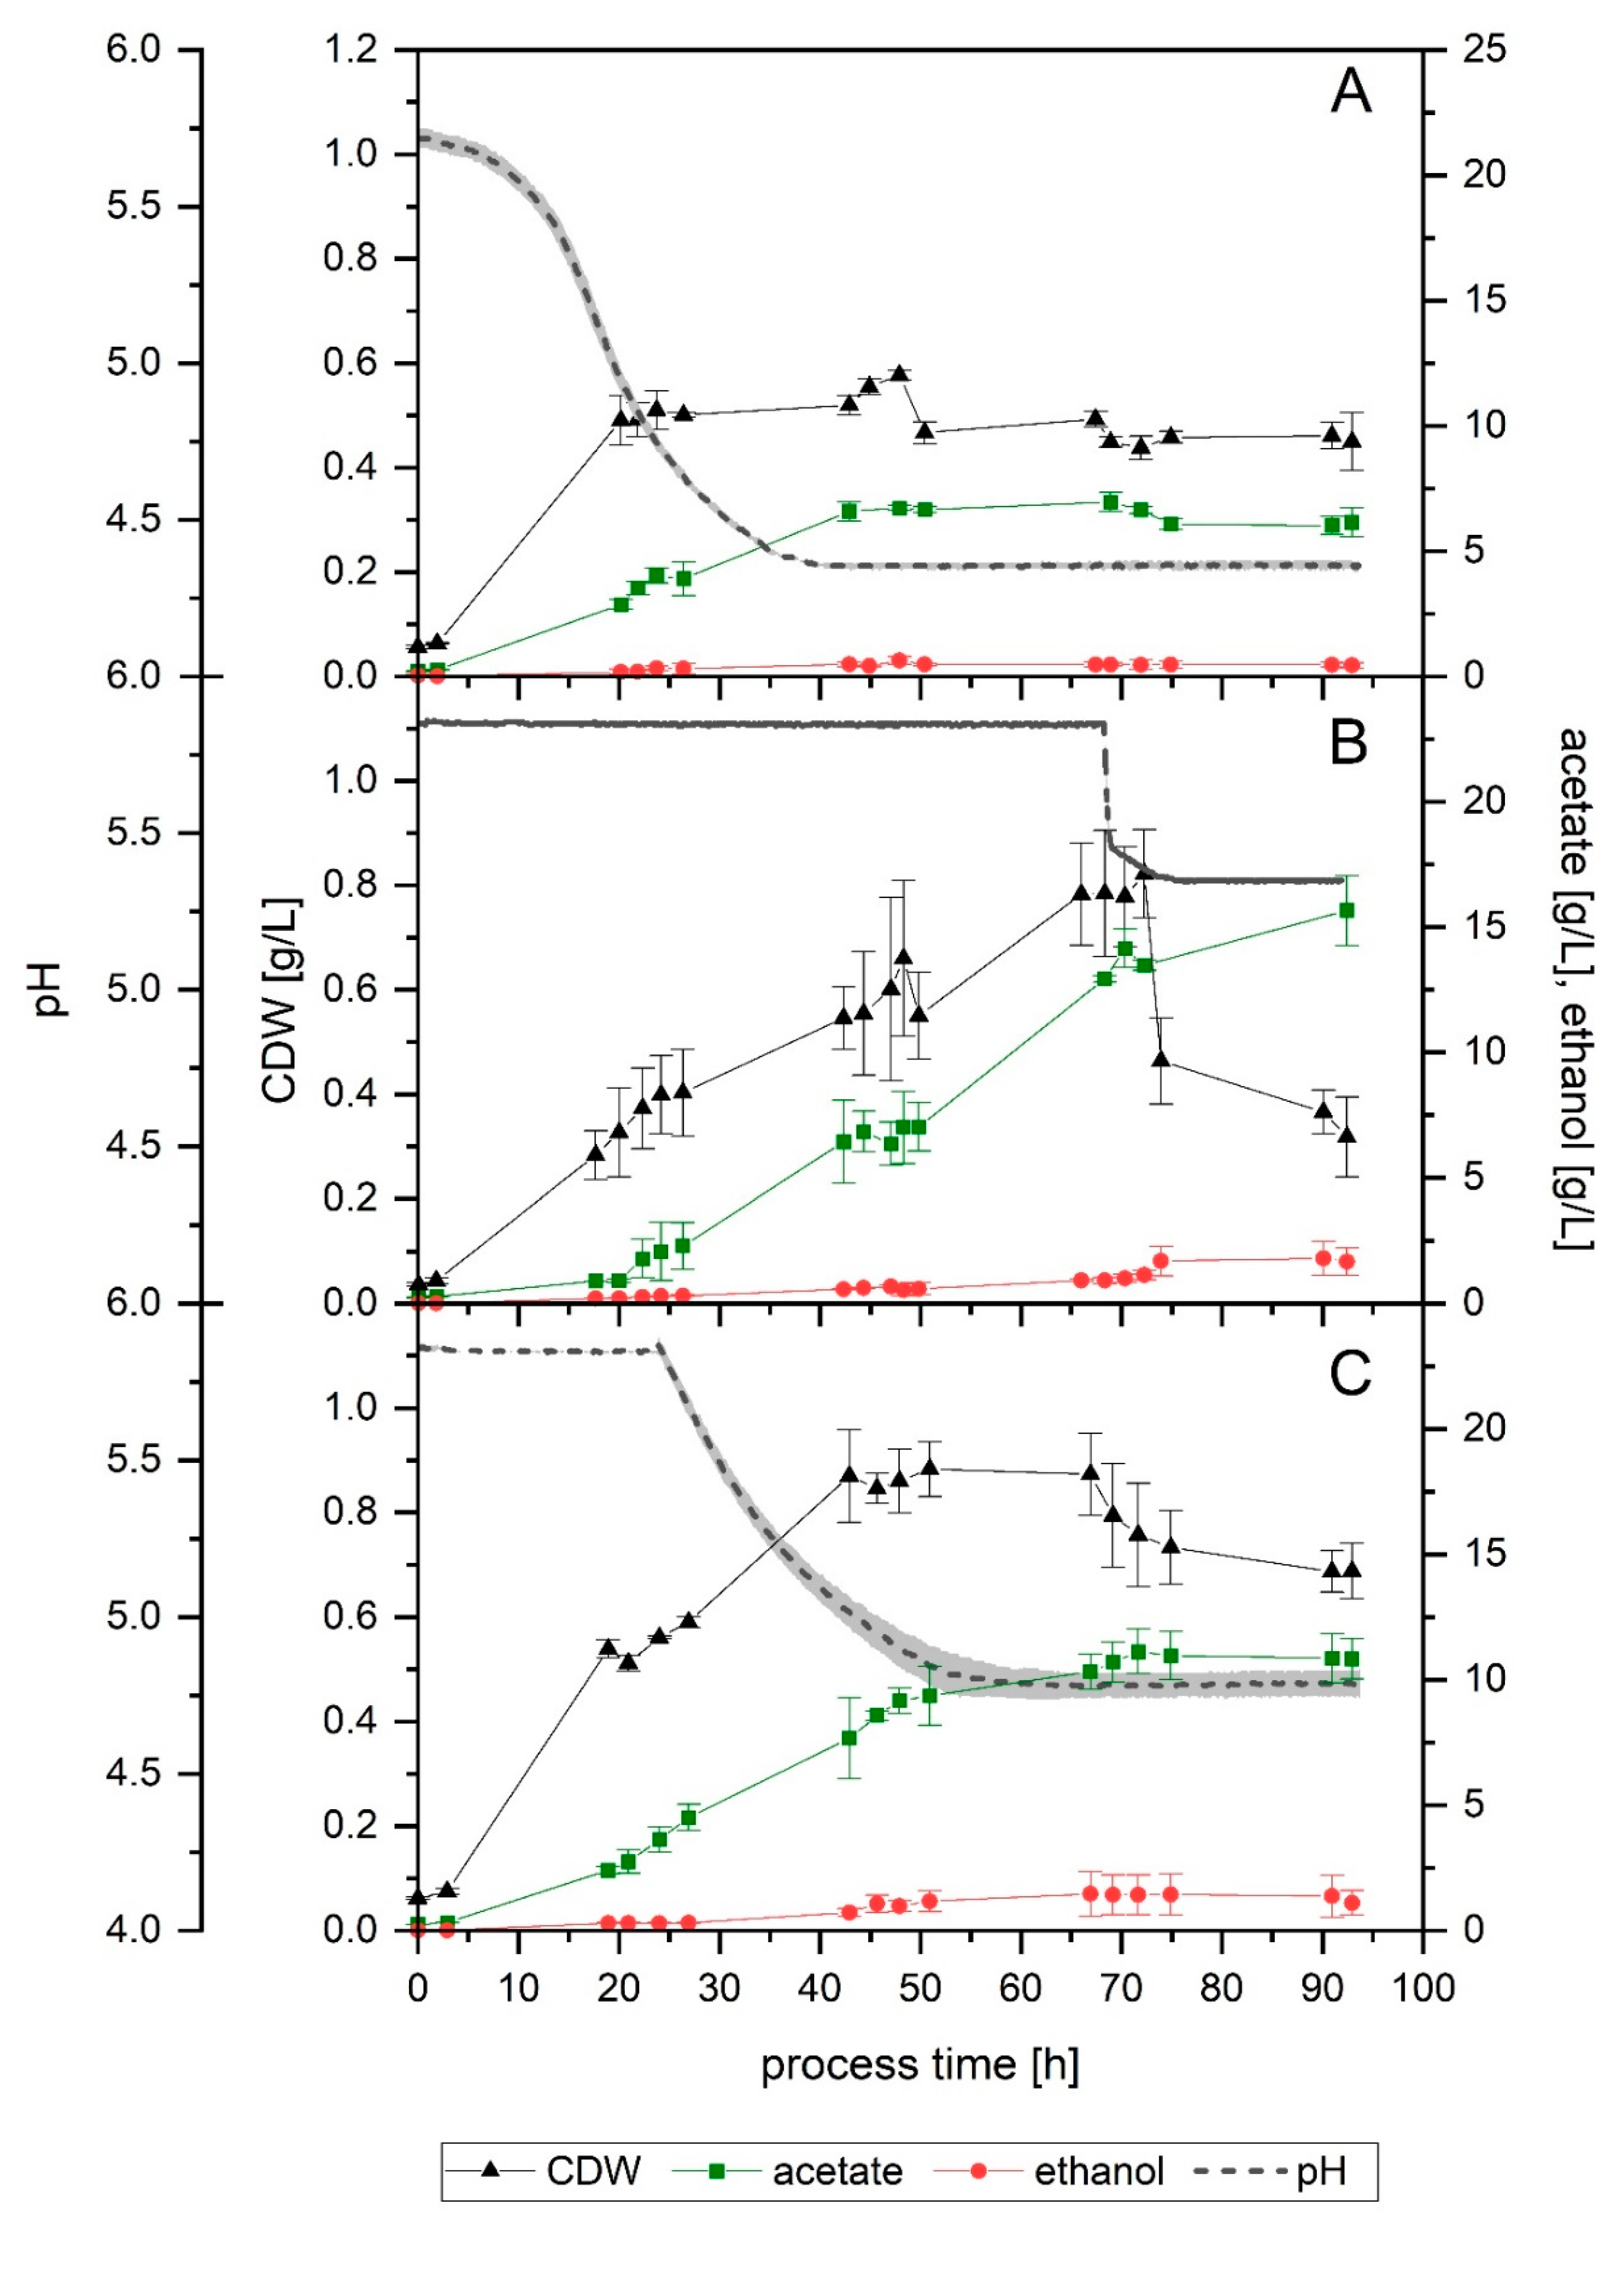
3.2. Effect of pH
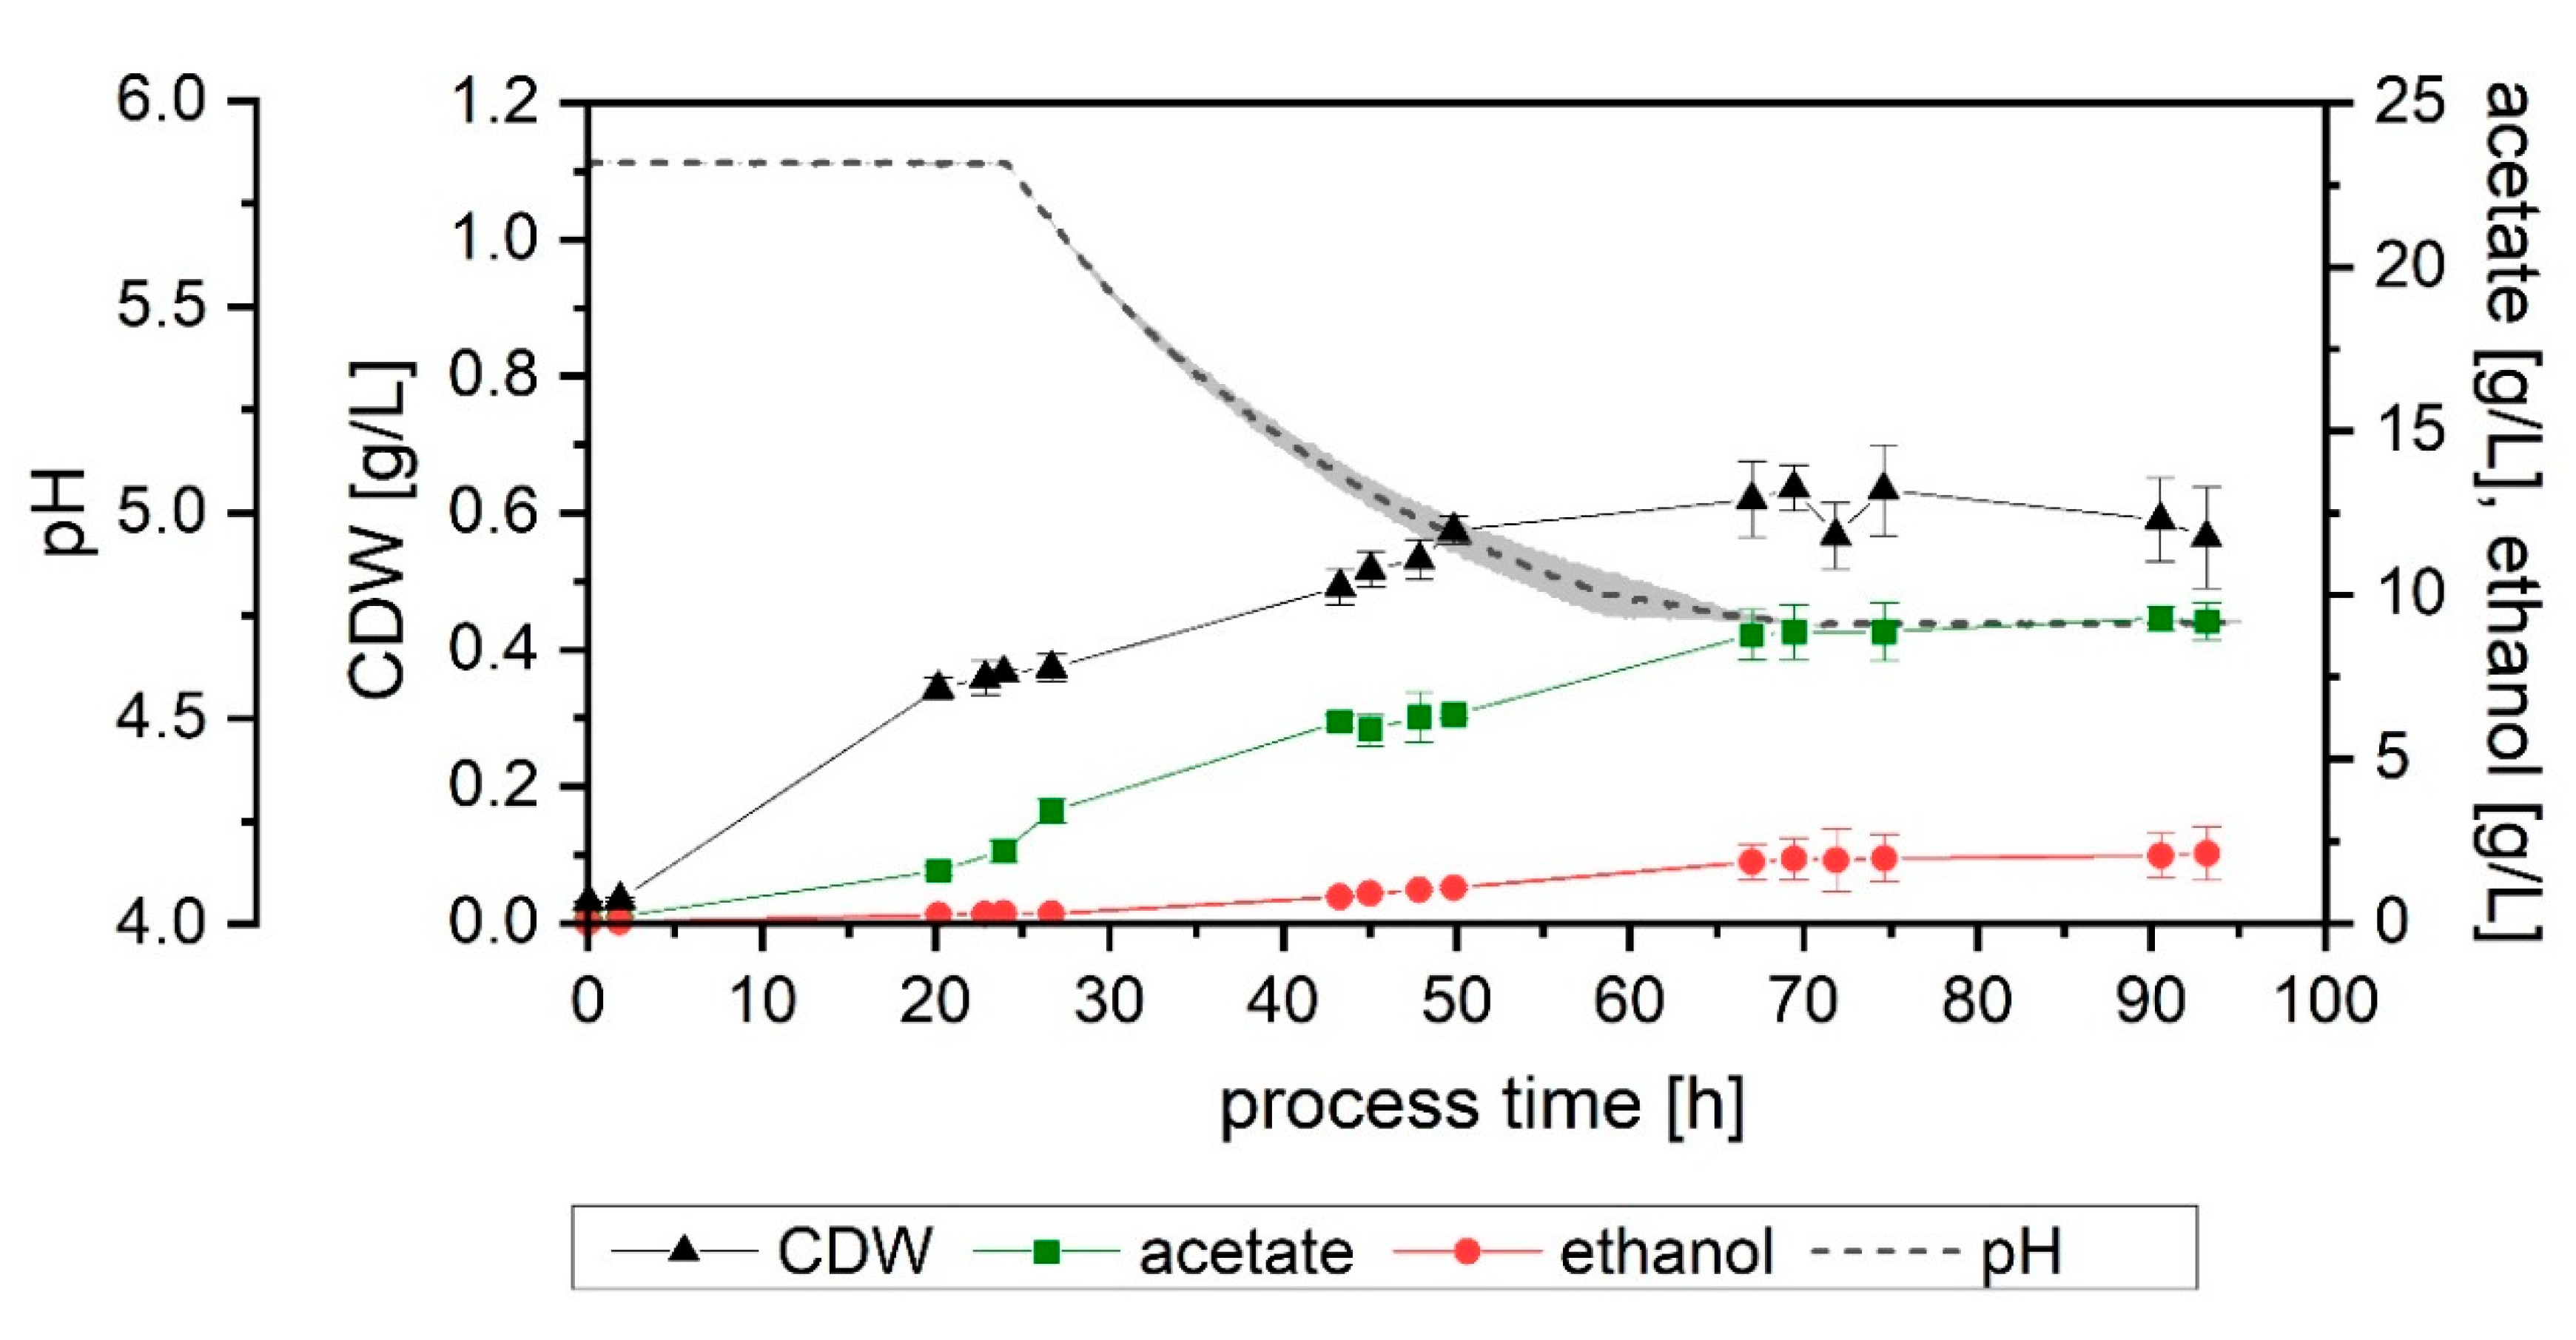
When a fermentation with no pH regulation was performed (Setup 2), growth slowed down after 20 h of process-time, with the pH having decreased to 5.0. After 43 h, when the pH value was already at its lowest (4.4), no significant growth or product formation could be detected. An increase in the CDW between 43 and 48 h was observed but was subsequently followed by a further decline and eventually remained mostly constant, with a final value of 0.5 g/L. The final acetate and ethanol concentration achieved were 6.2 and 0.4 g/L, respectively (
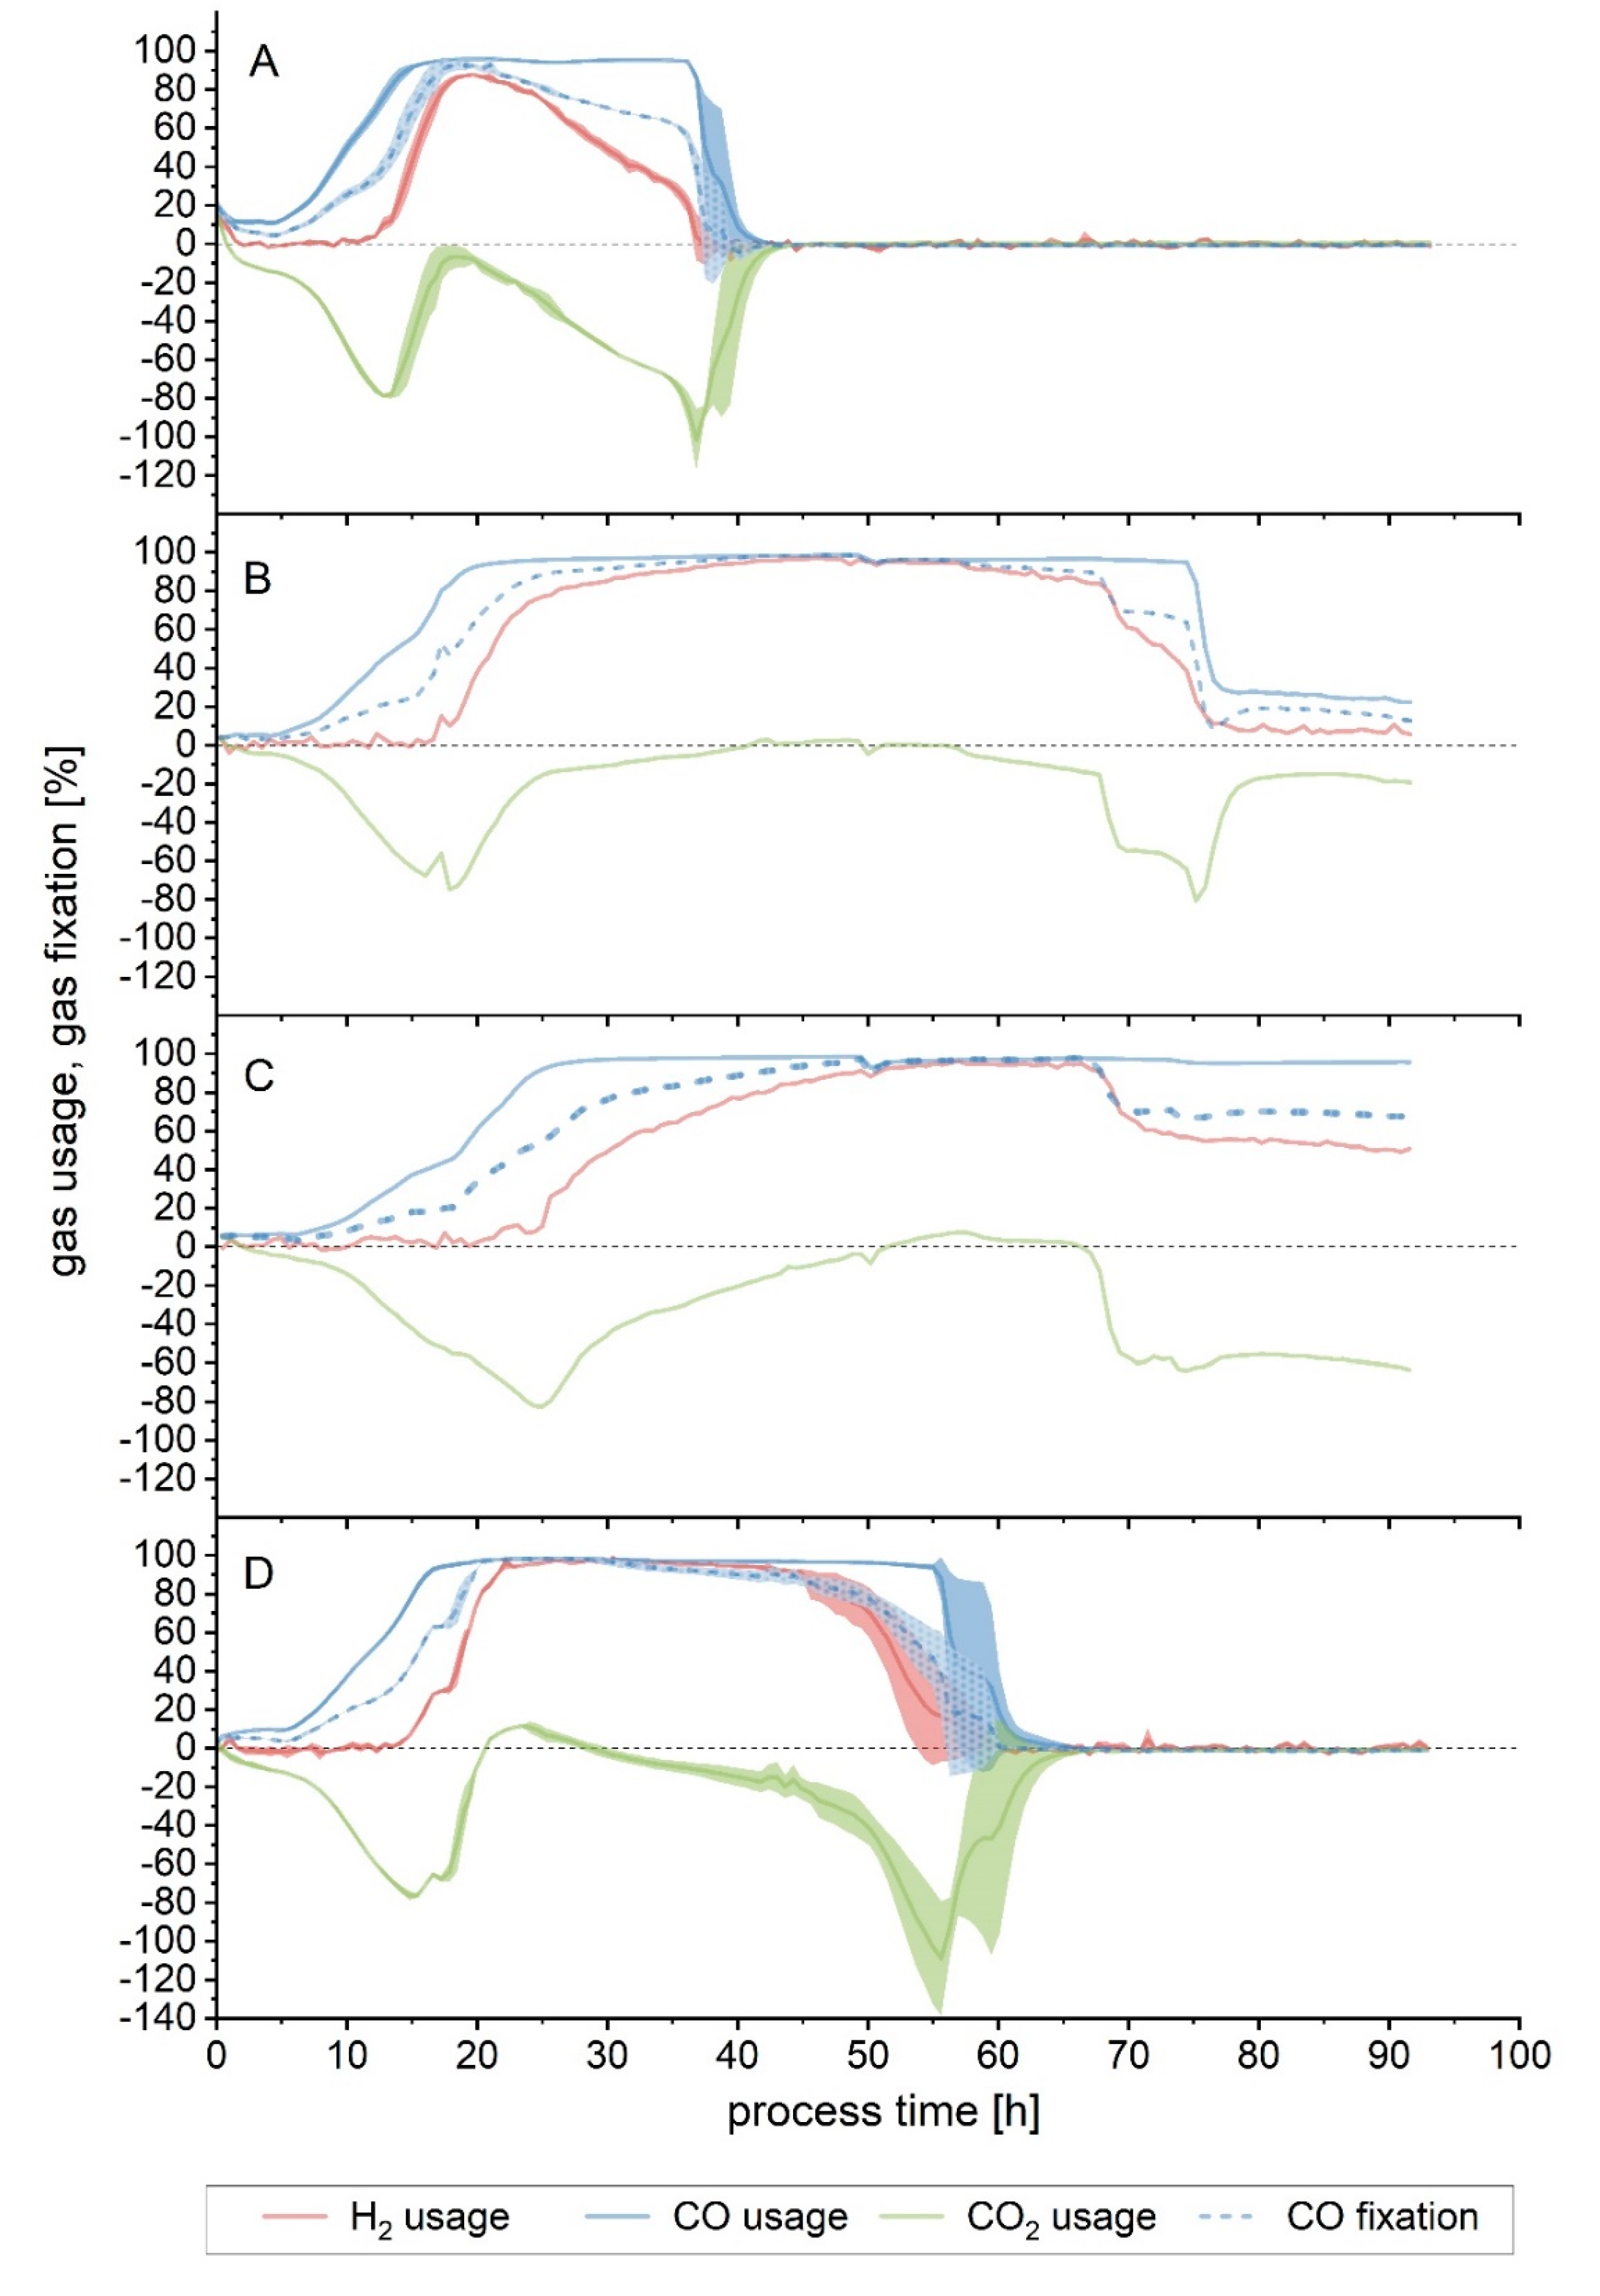
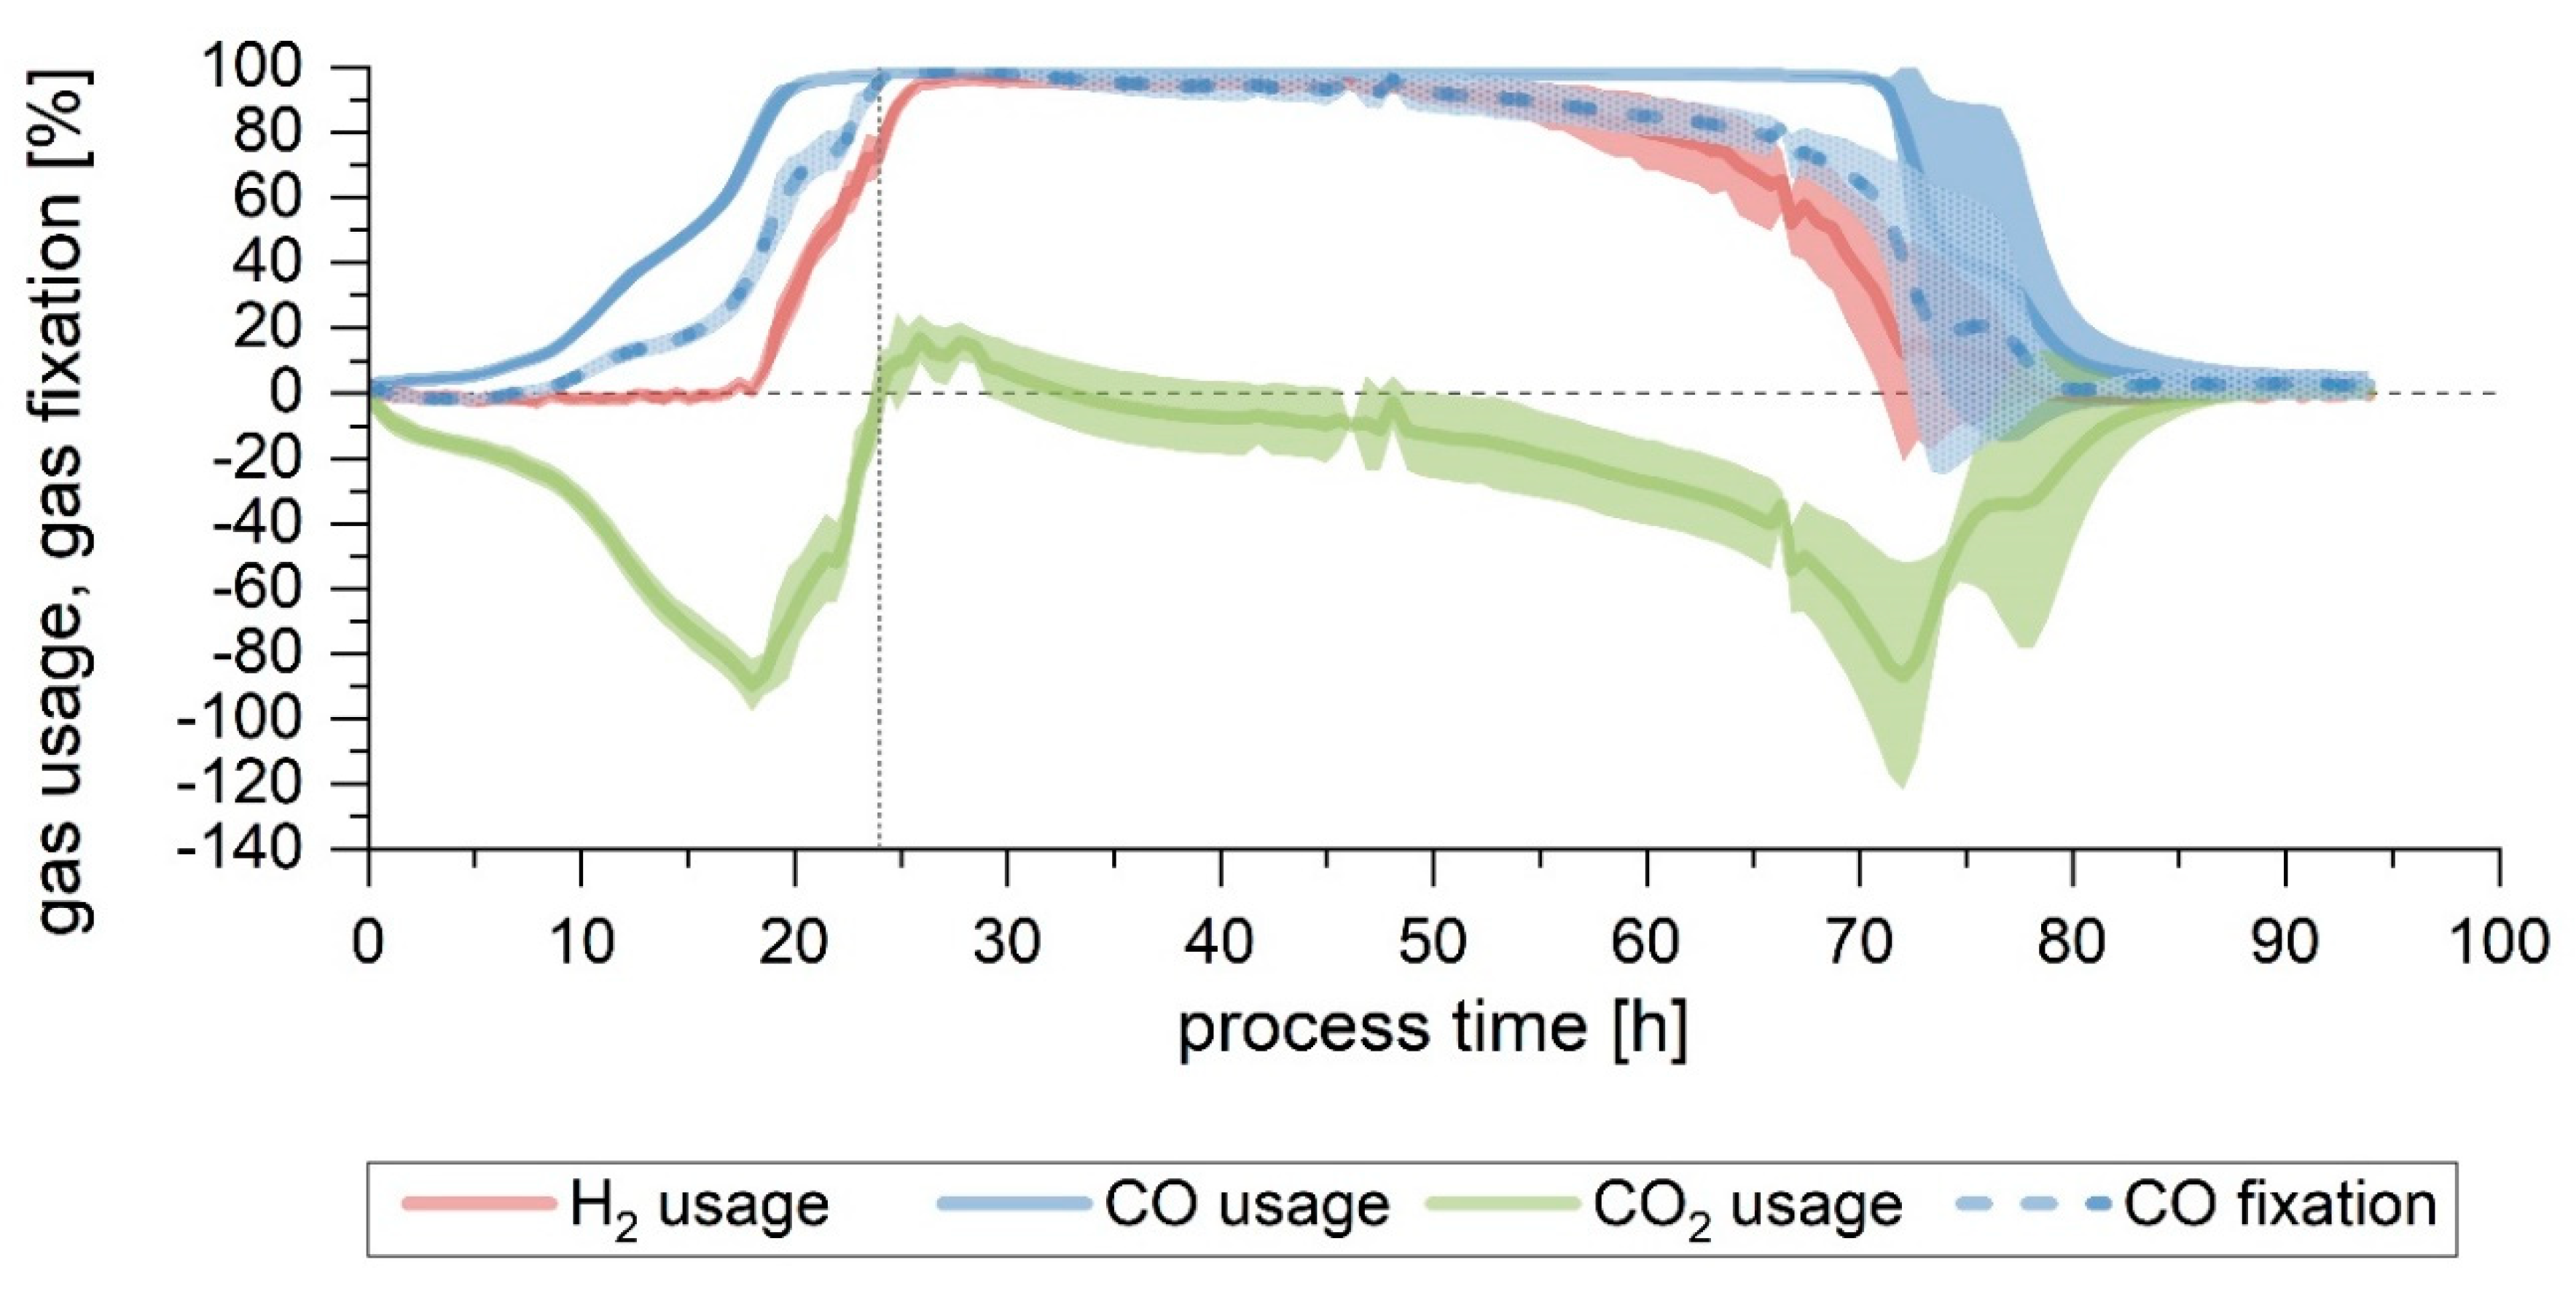
Figure 3A). Gas consumption stopped after 40 h, with the maximum overall usage interval lasting only 5 h (
Figure 4A and
Table 2). The yields and productivities for this fermentation were the lowest among all the tests performed, with the exception of Y
P/S, fixed (both end-of-process and up to the end of maximum CO fixation) and Y
P/S, used (calculated up to the end of the maximum CO fixation), which were analogous to the rest. More detail can be found in
Table 3 and
Table 4.
In Setup 1, gas consumption started to decrease after approximately 70 h. After observing that for the first 68 h hours in Setup 3 the gas consumption, growth and product formation were equivalent to that of Setup 1 (
Figure 1A,B and
Figure 2A,B), the effect of lowering the pH after that point was investigated in Setup 3b. Mainly, the aim was to observe the effect that a lower pH value would have in this late stage of the fermentation, especially regarding the product formation and its ratios. At 68 h, the pH was lowered in two of the fermenters by 0.5 units to 5.4, by using 4 M H
3PO
4. As a result, maximum CO fixation came to an end, and a noticeable divergence between fermenters could be noted from this point on. In one fermenter (
Figure 4B), immediately after the pH shift, the gas consumption started to decrease for CO
2 and H
2, and after a small delay, also for CO. Despite the declining tendency, some consumption could be detected up to 92 h: H
2, CO and CO
2 average usage was 8%, 25% and −16%, respectively, between 80 and 92 h. CO fixation during this interval was 17% on average. In the second fermenter (
Figure 4C), a drop in H
2 and CO
2 usage also happened, but it eventually stabilized at around 50% and −60%, respectively. CO usage was still at its maximum, but as a result of the cells not using CO
2 any further, net CO fixation decreased as well, to an average of 69% between 68 and 92 h. For the first fermenter, maximum overall usage lasted for 32 h (
Table 2, Fermenter “c”), while it was 10 h shorter in the second (
Table 2, Fermenter “d”). Looking at the CDW and product formation (
Figure 3B), the deviation between the fermenters is apparent in the biomass yield, as indicated by the standard deviation bars, but much less remarkable in the case of product formation. The maximum CDW measured was, on average, 0.9 g/L at 74 h. After that, the amount of biomass in the fermenter fell to its final value, 0.7 g/L. Acetate was produced throughout the fermentation, even after the biomass decreased. The final concentration obtained was 15.7 g/L. Ethanol, on the other hand, increased until 74 h of process time. Between 72 and 74 h, a somehow steeper increase of 0.4 g/L in the ethanol concentration in the fermenter was detected, from 1.1 to 1.5 g/L, a value which remained constant later on. The yields and productivities achieved in this test were, in general, lower compared to Setup 1, although not to such an extent as seen in the non-pH-regulated fermentation (
Table 3 and
Table 4).
In the non-pH-regulated fermentation (Setup 2), at 22.5 h, just before gas consumption started to diminish, and when the exponential phase had already ended, but there was still cell growth detected, the measured pH was 4.8 (
Figure 3A). This pH value was then chosen for a further test in Setup 5. Here, the fermentation was carried out under standard conditions for 24 h to ensure that gas consumption was already at its highest. Changing the pH by externally adding an acid can cause a sudden shock in the culture, as well as changing the ionic strength of the medium. To prevent this, the pH was allowed to drop naturally, as the result of metabolic activity, to pH 4.8, and then the pH control was further regulated to this new value, which was reached after 55 h, as
Figure 3C shows. In this setup, biomass concentration reached its maximum earlier than in Setup 1: at 43 h, when the pH value was 5.0, the CDW measured was already 0.9 g/L—it was 0.6 g/L in Setup 1. The biomass remained thus stable up to 70 h, dropping after that—15 h after the pH of 4.8 was reached. Up to 50 h of process-time, acetate formation followed a similar profile to that of Setup 1, reaching a value of 9.4 g/L in the reactor at that time. After this point, however, around the time when the lowest pH was reached and cell concentration decreased, the acetate production slowed down and eventually stopped at 11 g/L, at around 70 h. Ethanol formation also stopped at this point, reaching a final maximum concentration of 1.4 g/L. As shown in
Figure 4D, during the first 24 h of cultivation, the gas consumption followed a trend equivalent to that of Setup 1, although it reached its maximum 12 h earlier (
Table 2). It can also be noted that the maximum overall usage interval was shorter, as well as the time until the end of maximum CO fixation. Yields and productivities for this fermentation were also found to be lower in relation to Setup 1, and the productivities at the end of the 93 h were almost halved (
Table 3).
Finally, looking at the yields and productivities up to the end of the maximum CO fixation phase (
Table 4), the non-pH-regulated run achieved again the lowest Y
P/S, fed and Y
P/X. The values for the fermentation Setup 1 were, in all cases, higher than the rest of the setups where pH was modified. That being said, in these runs, the acetate to ethanol ratio was lower in comparison to the first setup, indicating a shift towards more ethanol per mol of acetate produced. Productivities of Setups 2, 3 (excluding the fermenter where the pH was not changed) and 5 were all similar.
The off-gas profile for Setups 2, 3b and 5 are shown in
Figure S2.
3.3. Effect of Gas Flow
It was noticed that, in Setup 5, despite the lower pH, the achieved cell growth was similar or even slightly higher than in the Setup 1 fermentation, but the product formation was lower. Because of this, the focus was turned to finding out if a reduction in the gas flow, as well as in the pH, would direct the culture towards the formation of more products rather than biomass. To do so, Setup 6 was run as Setup 5 for the first 24 h, after which the pH was allowed to drop naturally until 4.8. At the same time, the gas flow was reduced by 30% from 18 to 12.6 mL/min. This flow was deemed adequate to avoid excessive starvation of the culture, but to provide substrate limitation.
First, pH 4.8 was reached at 58 h, 3 h later than in Setup 5, but, in this case, and due to the configuration of the pH control, it continued to drop further until 4.7 at 69 h, at which value it remained constant thereafter. Concerning cell growth, a CDW of 0.4 g/L was achieved after 24 h, contrasting with the higher CDW of Setup 5 (0.56 g/L), even if the conditions in both runs were equal up to that point. The maximum biomass concentration for this fermentation was lower, namely 0.6 at 69 h, coinciding in time with the moment when the pH reached its final lower value. From this point on, no cell growth was detected, and the biomass concentration in the reactor eventually decreased. Acetate was produced until around this time point, as well. Its final concentration, 9 g/L, is lower than in Setup 5 (11 g/L), but not so for ethanol: in this last fermentation, 2 g/L could be formed (
Figure 5). Looking at the acetate to ethanol ratio, found in
Table 3 and
Table 4, this is the fermentation with the lowest value achieved, that is, the product formation is clearly shifted towards ethanol.
Gas consumption for the first 24 h was similar in both Setups 5 and 6 (
Figure 4D and
Figure 6). Maximum gas usage was attained after 24 h in Setup 6, similarly to Setup 5 (20 h) (
Table 2). In Setup 6, due to the reduced flow, both the maximum usage interval and the time up to the end of the maximum CO fixation were prolonged (8 and 14 h longer, respectively).
The off-gas profile for Setups 6 is shown in
Figure S3.
The yields achieved by lowering the flow after 24 h show that it did not have an impact on how much substrate was fixed into product (Y
P/S, fixed), given that the results achieved by this fermentation (0.94 ± 0.04 g/g for the complete run and 0.92 ± 0.03 g/g up to the end of maximum CO consumption) are comparable to the other setups (
Table 3 and
Table 4). The product yield per carbon fed was lower than in Setup 5 when calculating it up to the point of the end of maximum CO fixation phase, but, contrarily, was improved in this last run in terms of the overall values, as a result of a prolonged gas consumption phase and a lower substrate flow. Due to the diminished growth in Setup 6, the Y
P/X calculated at both points was higher, demonstrating that more products had been formed per gram of biomass. Nevertheless, the highest values of Setup 1 were not reached. The acetate to ethanol ratio, however, was the lowest of the six setups, being about half of that of Setup 1 (
Table 3 and
Table 4): overall, this fermentation was displaced towards less growth, as well as less acetate and more ethanol per gram of biomass. Despite this, productivities for this setup were lower than for Setup 5, and they were almost half of those of the Setup 1 run.
3.4. Carbon Balance
The ability of the system to provide a closed carbon balance, that is, to detect all carbon which has been fixed, according to the out-gas analysis, in the products, was assessed. A closed carbon balance is an important marker to determine the quality and relevance of the data, especially yields and productivities, as well as to ensure that all products were detected [
23].
As shown in
Table 5, in all except one case the carbon balance is closed, with values within 100 ± 3%. In Setup 1, an additional 6% of carbon was detected in the biomass and products, which was not accounted for as fixed. Even so, it is below 10% difference, and, looking at the other carbon balance results, this discrepancy could be attributed to analytical error.
Furthermore, the percentage of carbon fixed per carbon fed can be used to determine which fermentation parameters would be more beneficial in order to fix the maximum amount of carbon fed into products. The results obtained are in line with what has been described previously here: in the altered medium experiments, with an increase in yeast extract or cysteine (Setups 3a and 4, respectively), the effect observed was not as remarkable as in the lower pH fermentations, where the values are clearly lower than in Setup 1.
4. Discussion
With this bioreactor configuration, the effect of the two selected media components, as well as the different pH profiles, on product formation, growth and gas consumption could be tracked. From the results of the experiments with higher cysteine and yeast extract, it is clear that, in our particular setup, none of these approaches caused any advantage, in terms of an improved gas consumption or product formation. Richter et al. [
4] reported that
C. ljungdahlii seems unable to uptake sulfate, and recommended adding sulfide or cysteine to the medium. Since doubling the amount of cysteine did not improve the outcome of the fermentation, as mentioned above, sulfur was not a limiting component in the medium. Similarly, the original amount of yeast extract in the medium (0.5 g/L) is deemed to be sufficient, and a higher amount is not needed in this system, since the increased amount did not cause a significant improvement in biomass and product formation or gas consumption. Thus, the original medium composition, as used in Setup 1, was already enough to support the culture.
In the case of cysteine, a study by Abubackar et al. [
10] with
Clostridium autoethanogenum reported that an increase in the cysteine-HCl (1.2 g/L vs. 0.5 g/L) had a slightly detrimental impact on biomass, but a higher concentration of ethanol could be reached. The same negative influence on the biomass was observed on
C. aceticum with concentrations above 0.5 g/L in another study by Sim and Kamaruddin [
24], although, in that case, the product, acetic acid, was not significantly affected. Ethanol production was not reported there. In our case, the increased cysteine also had a slight detrimental effect in the biomass, with a lower final concentration of 0.8 g/L compared to 0.9 g/L in Setup 1. No increase in product formation was seen, but rather the opposite: the acetate concentration with higher cysteine was 3 g/L lower than that of Setup 1. The ethanol concentration did not change, though. It is possible that increasing the amount of cysteine caused an adverse effect. To improve the water solubility of cysteine, it is added to the reactor in the form of cysteine-HCl. The additional Cl
− ions that are added to the medium could be one reason for the potential adverse effect of the increased cysteine. With the available data, however, no conclusion can be drawn with certainty, and further investigation will be needed to clarify this point.
It is important to notice that the microorganisms used in the studies mentioned above were different to the one here used; besides, the study by Abubackar et al. [
10] was performed in 200 mL serum vials without pH control, and not bioreactors. The results obtained in that system are not directly comparable to the ones presented here due to the remarkable differences between the two, for instance, in the gas transfer to the liquid phase. The gas substrate differs, as well: in that study, only CO was used, with no CO
2 or H
2 present, unlike in our case.
Even if the increment of yeast extract in the medium did not translate to higher biomass formation, some changes could be observed: biomass slightly decreased and a higher Y
P/X was achieved. The acetate to ethanol ratio was not significantly altered, especially up to the point when maximum CO fixation stopped. Considering the complete run, only a slight increase in the acetate to ethanol ratio was detected. Besides, in this study, the amount of yeast extract did not have an impact on the final acetate or ethanol concentration in our setup, contrary to what has been reported elsewhere [
10,
13,
14,
15]. Similar to what has already been discussed regarding cysteine, it is very likely that the initial, lower yeast extract concentration in Setup 1 was already enough and not limiting. In addition, the studies mentioned above are not directly comparable in this case either, due to the different cultivation systems used (bottles rather than bioreactors), organisms or gas compositions. Another potential argument as to why yeast extract did not have an effect in our media could be that, since the gas mixture used contained N
2,
C. ljungdahlii could potentially be fixing it, as proposed by Richter et al. [
4] and Tremblay et al. [
25], thus minimizing the effect of other nitrogen sources, but this remains a controversial topic since Emerson et al. [
26] could not observe any nitrogen fixation in their experiments.
All fermentations performed with a lower pH had an increased amount of ethanol per acetate produced (in mol), during the maximum CO fixation phase, as it was expected and as described in the literature [
27]. Even so, if the values for the whole run are taken into consideration, lowering the pH did not produce a shift of the product formation towards ethanol. Kundiyana et al. [
28] reported a similar behavior, since lowering the pH below 6.0 did not produce an increase in ethanol production with
C. ragsdalei. In our case, the effect seen might be the result of the cell culture stopping to use H
2, and eventually CO, which could lead to a slowdown of the product formation towards the end of the fermentation. However, it was not the aim of the present study to elaborate further about this, and it will be analyzed in detail in the future with the system described here. The more acidic pH resulted in lower productivities as well, which could have been caused by the less favorable growing conditions. It must also be taken into account that acetate in its undissociated form is lipophilic and freely diffuses through the cell membrane, which results in the move of H
+ across the transmembrane gradient, lowering the intracellular pH [
28]. If the pH drops too low, it might negatively impact the culture since the microorganism could struggle to maintain a neutral intracellular pH [
9,
16,
29].
Acetate is regarded as a growth-associated product [
30]. Agreeing with this, in all pH-regulated experiments, acetate production increased continuously, and almost parallel to biomass after around 20 h and while cell growth happened. This is not the case only in the non-regulated experiment (Setup 2), but also in the one where pH was left to drop after 24 h (Setup 5). In the case of Setup 2 (no pH regulation), growth slowed down at approximately 20 h, a moment at which acetate production was seen to increase in the pH regulated experiments. This reduced growth influenced the acetate production. In Setup 5, due to the pH being regulated for the first 24 h, a higher biomass concentration could be achieved, and, thus, more acetate was produced than in Setup 2.
Regarding ethanol, different studies disagree on whether ethanol might or might not be growth associated. Barik et al. [
13] and Najafpour and Younesi [
31] reported that ethanol is not associated with growth; conversely, Cotter et al. [
16] showed that
C. ljungdahlii produced significantly less ethanol when the pH was lowered from 6.8 to 5.5 and concluded that this effect could be related to the slower growth observed.
Regarding the experiments here shown, the productivity of ethanol is not constant across the different setups, and does not seem to be related to biomass formation; however, when the conditions were too detrimental, as in the non-pH regulated run, both product formation and biomass were clearly affected. Again, in this case, the studies found in the literature were done with various organisms, gas compositions and vessels, and none reported the gas profiles during the fermentation.
The combined effect of lowering the pH and the gas flow resulted in less favorable growing conditions, and less substrate available for the cells. This caused the lower maximum CDW achieved in Setup 6 compared to Setup 5, as well as an increase of the ethanol ratio. This agrees with recent research on how ethanol production could be triggered, under growth-limited conditions, by the balance between intracellular and extracellular conditions, that is, total acetate concentration and extracellular pH [
4]. A lower amount of acetate accumulating in the culture broth, as a result of less biomass being formed, would result in less acetate being available intracellularly, and thus the microorganisms could have more time to adapt and shift towards ethanol. At the same time, the lower pH would potentiate this effect, since more undissociated acetic acid could diffuse through the membrane to be available for further conversion into ethanol. Even so, the less favorable conditions of this experiment caused a reduction in the overall productivity.
Finally, the obtaining of a closed carbon balance provides further proof of the sensitivity of the system.
5. Conclusions
The system here presented proved to be a valuable tool for performing syngas fermentation screening experiments aimed at the study of media components and/or process parameters. It is able to show even small changes in the consumption of each of the gaseous substrates together with growth and product formation profiles.
With the conditions tested, neither the supplementation with additional cysteine nor yeast extract increased the duration of the gas consumption, and no dramatic effects on product formation could be observed. Decreasing the pH did not immediately result in higher ethanol formation and impacted the productivity negatively. In the experiment where, in addition to the pH, the gas flow was reduced, a decrease in biomass production was observed, as well as a reduction in acetate production and an increased ethanol to acetate ratio.
The great variability of systems reported in the literature makes a direct comparison between differing systems a challenging task. Therefore, the need to establish a system where the most common parameters, such as growth and product formation, as well substrate consumption, can be monitored in a standardized way is high. Besides, for the proper identification of significant influences on a system, it must be highly sensitive and robust, so that the noise in the data is kept low.


