Article

Gas Fermentation Enhancement for Chemolithotrophic Growth of Cupriavidus necator on Carbon Dioxide

Hawaii Natural Energy Institute, University of Hawaii at Manoa, Honolulu, HI 96822, USA
*
Author to whom correspondence should be addressed.
Fermentation 2018, 4(3), 63; https://doi.org/10.3390/fermentation4030063
Submission received: 7 July 2018 / Revised: 3 August 2018 / Accepted: 7 August 2018 / Published: 9 August 2018
(This article belongs to the Special Issue Bioprocess and Fermentation Monitoring)

Abstract

:
Cupriavidus necator, a facultative hydrogen-oxidizing bacterium, was grown on carbon dioxide, hydrogen, and oxygen for value-added products. High cell density and productivity were the goal of gas fermentation, but limited by gas substrates because of their low solubility in the aqueous medium solution. Enhancement of gas fermentation was investigated by (i) adding n-hexadecane as a gas vector to increase the volumetric mass transfer coefficient (kLa) and gas solubility, (ii) growing C. necator under a raised gas pressure, and (iii) using cell mass hydrolysates as the nutrients of chemolithotrophic growth. In contrast to previous studies, little positive but negative effects of the gas vector were observed on gas mass transfer and cell growth. The gas fermentation could be significantly enhanced under a raised pressure, resulting in a higher growth rate (0.12 h−1), cell density (18 g L−1), and gas uptake rate (200 mmole L−1 h−1) than a fermentation under atmospheric pressure. The gain, however, was not proportional to the pressure increase as predicted by Henry’s law. The hydrolysates of cell mass were found a good source of nutrients and the organic nitrogen was equivalent to or better than ammonium nitrogen for chemolithotrophic growth of C. necator on carbon dioxide.

Graphical Abstract

1. Introduction

Carbon dioxide (CO2) released from fossil fuel combustion is a major greenhouse gas emission that has caused concerns over climate change. Production of value-added products from CO2 could help harness the greenhouse gas [1]. Hydrogen-oxidizing bacteria are primary biomass producers and play a niche role in the natural carbon cycle [2]. The chemolithotrophic prokaryotes use hydrogen (H2) as electron donor and oxygen (O2) as electron accepter for CO2 assimilation. Cupriavidus necator is a facultative hydrogen-oxidizing bacterium that populates soil and fresh water habitats at the aerobic–anaerobic interface [3]. C. necator is a promising producer of polyhydroxybutyrate (PHB) from CO2 [4,5] and the PHB content of cell mass varies from 0 to 65 wt % as found in a laboratory strain, depending on nutrient control [6]. PHB is a biodegradable plastic and also a platform material from which functional chemicals, hydrocarbons, and drop-in liquid fuels can be produced [7]. The residual cell mass (RCM) or a cell mass with little PHB is a good source of proteins and nutritive lipids [8,9]. Almost 93% of bacterial protein was found to be digestible by animals and the concentrations of certain important amino acids were similar to those found in casein [8]. RCM can also be liquefied in subcritical water (300 °C) to generate a bio-crude oil and water-soluble nitrogen-rich hydrolysates that may contain nutrients beneficial to chemolithotrophic growth [10].
Clean hydrogen, different from the hydrogen derived from fossil resources, is generated from water electrolysis by renewable powers such as solar and wind powers [11]. With technology progress and cost reduction, clean hydrogen could become an inexpensive feedstock of gas fermentation to produce value-added products from CO2. One major goal of gas fermentation is to obtain a high cell density in a short period of time for high productivity of desired products. However, the gas substrates, especially hydrogen and oxygen, are poorly soluble in the aqueous medium solution. The cell density and productivity are therefore dependent on the gas mass transfer rates (R), or volumetric mass transfer coefficients (kLa) of individual gases (Equation (1)):
  R i = ( k L a   ) i ( C i * C i ) = ( k L a   ) i ( P i H i C i )  
where R is the rate of gas mass transfer from gas phase to liquid phase (mmole L−1 h−1), subscript “i” refers to gas “i”, kLa is the liquid-phase volumetric mass transfer coefficient (h−1), C* and C are the gas solubility and instantaneous dissolved gas concentration in liquid solution (mmole L−1), P refers to the partial pressure (atm), and H the Henry’s constant (atm L mmole−1). Oxygen kLa in aerated bioreactors has been extensively studied and numerous correlations are available for different bioreactors and operation conditions [12]. In the same bioreactor’s configuration and operation conditions, hydrogen has a higher kLa than oxygen because of its higher diffusivity in water. The ratio of hydrogen kLa to oxygen kLa is 1.47, very close to the square root of their diffusion coefficients ratio [13]. In a laboratory bioreactor equipped with a basket-type agitator, a very high oxygen kLa (2970 h−1) was maintained in a gas fermentation of C. necator, resulting in a dry cell mass concentration of 91.3 g DCM L−1, ca. 29.4 g RCM L−1, and 61.9 g PHB L−1 [4]. However, the fermentation required a high mechanical power dissipation as well as gassing rate [12]. In industrial fermentations, the gassing rate, often expressed as the gas volume per liquid volume per min (vvm), ranges from 0.5 vvm to 2 vvm. When a conventional agitated bioreactor without gas recycling is used for gas fermentation, the hydrogen-rich exhaust gas causes a substantial hydrogen loss and raises a safety concern. Gas recycling in a closed bioreactor setup could minimize the hydrogen loss [4], but would raise the equipment and operation costs. A low gassing rate (<0.1 vvm) can reduce the costs if a high kLa could be maintained. This was achieved in a packed bed bioreactor, in which aqueous medium solution was circulated through an external loop and sprayed through nozzles into gas phase for good gas/liquid contact. Oxygen kLa up to 400 h−1 was maintained at a very low gassing rate (≤0.1 vvm) [13].
The gas mass transfer rate is also dependent on the concentration driving force (C*–C) as shown in Equation (1). The gas solubility (C*) determines the maximum driving force when the dissolved gas concentration (C) approaches zero. Because oxygen is a limiting substrate in many aerobic fermentations, a gas vector has been suggested to enhance the gas mass transfer rate [14]. The vectors are usually water-insoluble liquids such as perfluorocarbon, n-dodecane, n-hexadecane, and hydrocarbon oil, and have a higher oxygen solubility than water [15]. The gas vectors may also increase the volumetric mass transfer coefficient kLa by improving the gas/liquid contact [14]. A gas vector may therefore enhance gas fermentation without using extra energy. Gas vectors have been used in cultures of yeast and bacteria in shaking flasks, agitated bioreactors, and airlifters [15,16,17]. No work has been done with a gas mixture of O2, H2, and CO2 in a bioreactor with an external liquid circulation. Furthermore, according to Henry’s law (Equation (1)), the solubility (C*) of a gas is dependent on its partial pressure and can be increased by raising the operation pressure of a bioreactor [18].
In this work, we investigated three strategies to enhance gas fermentation for chemolithotrophic growth of C. necator on CO2. The first strategy was to use n-hexadecane as a gas vector. We measured oxygen kLa in a bioreactor with external liquid circulation as well as the effect of the organic compound on growth of C. necator under chemolithotrophic conditions. The second strategy was to cultivate C. necator under raised pressures. Since it was hard to find a commercial bioreactor that could be operated under a raised pressure (>1 atm), we fabricated a bioreactor by using a stainless steel vessel and equipped it with an external liquid circulation loop and a gas pressure regulator. Preliminary results of gas fermentation under a raised pressure are reported herein. In addition to the gas substrates, mineral nutrients including ammonium nitrogen are essential to microbial growth. The third strategy was to use the hydrolysates of cell mass as growth nutrients under chemolithotrophic conditions. We investigated if the water-soluble nitrogen-rich hydrolysates derived from cell mass could provide some unknown but essential nutrients to promote growth of C. necator. The result also tells if the organic carbons of cell mass can be reused by the facultative species under mixotrophic conditions.

2. Materials and Methods

2.1. Chemicals and Gases

n-Hexadecane and other chemicals were purchased from Sigma-Aldrich (St. Louis, MO, USA) and used as delivered. n-Hexadecane is a colorless liquid (melting point 18 °C, boiling point 287 °C) and has a density of 0.773 g mL−1 and viscosity of 3.45 cp at 20 °C. Its flash point is 135 °C (closed cup). Hydrogen, oxygen, carbon dioxide, and nitrogen gas were purchased from Airgas (Kapolei, HI, USA). The gas flow rates of H2, O2, and CO2 were controlled with three mass flow meters (PC3-series, Alicat Scientific, Tucson, AZ, USA) and measured as standard cubic centimeters per min (sccm) under the standard conditions (273 °K, 1 atm). According to the ideal gas law, one sccm is 0.0446 mmole gas min−1. The gases were mixed in a four-tube gas proportioner and through a 0.2 µm filter, introduced into a bottle or bioreactor as illustrated below. The exiting gas from the bottle or bioreactor was released into a fume hood through vent tubing and diluted immediately by air.

2.2. Strain, Media, and Nutrients

A strain of C. necator maintained in the laboratory was used in this work [19]. The strain was activated at 30 °C in a nutrient medium solution (5 mL) containing (per liter) 10 g yeast extract, 10 g peptone, 5 g meat extract, and 2 g (NH4)2SO4. The autotrophic bacterium was then cultivated in a mineral solution on a gas mixture of hydrogen (70 vol %), oxygen (20 vol %), and CO2 (10 vol %) in closed bottles. The mineral solution contained (per liter) 2.4 g KH2PO4, 2.5 g Na2HPO4·2H2O, 2 g (NH4)2SO4, 0.5 g MgSO4·7H2O, 0.5 g NaHCO3, 0.1 g ferric ammonium citrate, and 1 mL trace element solution. The trace element solution contained (per liter water) 0.6 g H3BO3, 0.4 g CoCl2·6H2O, 0.2 g ZnSO4·7H2O, 0.06 g MnCl2·4H2O, 0.06 g NaMoO4·2H2O, 0.04 g NiCl2·6H2O, and 0.02 g CuSO4·5H2O. The cell mass was recovered with centrifugation at 5000× g for 5 min, and the wet pellets were washed with distilled water twice and lyophilized to determine the dry cell mass. PHB in the dry cell mass was extracted out in hot chloroform (2 wt % DCM) at 60 °C overnight. The PHB chloroform solution was filtered through filter paper (Whatmann 41, Cole-Parmer, Chicago, IL, USA) and the residual cell mass (RCM) was recovered and dried in a fume hood in ambient conditions. RCM was subjected to hydrolysis in water at 300 °C and an aqueous solution of hydrolysates was obtained as reported before [10]. After membrane filtration (0.45 µm), the clean hydrolysates solution contained 10.8 g L−1 of organic carbon and 24.5 g L−1 of organic nitrogen, which was used as a nutrient source for chemolithotrophic growth in bottle cultures.

2.3. Bottle Cultures

A predetermined amount of additives (n-hexadecane or RCM hydrolysates) was added into 100 mL mineral solution in a heavy-duty polypropylene bottle (1000 mL) equipped with a 2-port filling/venting cap. The bottle was sterilized at 121 °C for 10 min. After 5 mL nutrient inoculum was added, the bottle was flushed with a gas stream of H2 (70 vol %), O2 (20 vol %), and CO2 (10 vol %) at 500 sccm for 6 min and sealed. The closed bottle with the gas mixture (1 atm absolute) was shaken in a rotary incubator at 200 rpm and 30 °C, and re-flushed with the gas mixture every 24 h. Liquid samples were taken and diluted appropriately (OD < 0.6) to measure the optical density (OD) at 620 nm with a UV/Vis spectrophotometer (DU530, Beckman-Coulter, Fullerton, CA, USA). At the end of bottle culture, the cell mass was recovered by centrifugation at 5000× g for 5 min and lyophilized to determine the dry cell mass concentration and PHB content. One OD was 0.45 g L−1 of dry cell mass. Duplicated bottle cultures were run in parallel and average results were presented with the deviation being less than 5%.

2.4. Bioreactor

The bioreactor was fabricated by using a stainless steel vessel (10 cm in diameter, 4 L, 20 atm max) as shown in Figure 1. The mineral solution (1.5 L) was filtered through a membrane filter (0.2 µm) and added into the bioreactor. An external liquid circulation loop connected with stainless steel tubing consisted of a stainless steel magnetic drive pump (13.8 atm max) and an in-line pH probe (10 atm max) obtained from Cole Parmer (Vernon Hills, IL, USA). The medium solution was sprayed through three nozzles (BETE Fog Nozzle, Greenfield, MA, USA) with a total open area of 0.1 cm2 into full cone plume (90°) and returned to the liquid pool. At a liquid circulation rate of 3 L min−1, the pressure drop through the nozzles was ca. 0.4 atm. The medium pH was controlled by an integrated pH controller (Etatron DLX/B series, 15 atm, Cole-Parmer, Chicago, IL, USA) with a base solution (5 wt % ammonium). The ammonium solution was also used as nitrogen source that was added according to pH drop. Because of the sufficient nitrogen nutrient, C. necator formed little P3HB (<4 wt %) and the gas fermentation was primarily for chemolithotrophic growth. The fermentation temperature was not controlled in an air-conditioned room (ca. 23 °C). At a total gas flow rate of 140 sccm, the inlet gas composition was controlled by adjusting the flow rates of individual gases. The operation pressure in the bioreactor was controlled at a predetermined level by using a backpressure regulator (BPR) that was set up with a nitrogen pressure. When the bioreactor pressure was higher than the preset pressure of BPR, gas was discharged and the exhaust gas was sampled with a plastic bag for composition analysis. The gas flow rate was measured with a soap film meter under ambient conditions (ca. 23 °C, 1 atm). The tightness of the bioreactor system was tested by using air up to 6 atm and the gas fermentation was conducted below 5 atm absolute.

2.5. kLa Measurement

The oxygen kLa of the bioreactor was measured by using a dynamic method in ambient conditions (open to air) [20]. The liquid solution (1.5 L) was first stripped with N2 until the dissolved oxygen concentration dropped to zero. Air was then introduced at 0.3 L min−1 (ca. 23 °C, 1 atm) and the concentration of dissolved oxygen was monitored by using an optical DO probe (ProODO, YSI, Yellow Springs, OH, USA). The kLa was calculated with Equation (2).
  L n (   C * C 0 C * C t ) = ( k L a ) t  
where C* is the oxygen solubility under air, Ct the instantaneous oxygen concentration at time t, and C0 the initial oxygen concentration when the measurement was recorded. The response time of the oxygen probe was a crucial parameter for the dynamic method and defined as the time taken for the probe to reach 63.2% of the final value when it was exposed to a step change in the dissolved oxygen concentration [21]. The measurement was reliable if the response time was less than or equal to (kLa) −1. When the probe was exposed to a step change in dissolved oxygen concentration in water under ambient conditions, its response time was ca. 6 s, and hence the maximum kLa that could be measured in this work was 0.17 s−1 or 610 h−1.

2.6. Chemical Analysis

The composition of gas samples was determined with a gas chromatograph (Model 450, Bruker, Fremont, CA, USA). The GC was equipped with a thermal conductivity detector (TCD) and a Carboxen PLOT 1006 column (0.15 mm × 30 m, Sigma-Aldrich, St Louis, MO, USA). The column temperature was started at 35 °C for 2 min and then ramped to 100 °C in 3 min. The peaks were integrated using Galaxie software and calibrated with gas standards [19]. The standard gas samples of different molar composition were prepared by using a gastight syringe from pure gas and nitrogen as the background gas.
The PHB content of dried cell mass was determined by using the GC equipped with a flame ionization detector (FID) [22]. Briefly, about 50 mg of PHB-containing dry cell mass was added in 2 mL methanol solution (H2SO4 3% v/v, benzoic acid 10 g L−1 as the internal standard) and 2 mL chloroform, and kept at 100 °C for 4 h. The intracellular polyester was converted into 3-hydroxybutyrate methyl ester and released into the reaction solution. After the mixture was cooled to room temperature, the solution and 1 mL distilled water were vortexed for 1 min. The organic solution was filtered through a PTFE membrane (0.45 µm) and analyzed with GC. A pure PHB (Sigma-Aldrich, St Louis, MO, USA) was treated in the same procedure for calibration.

3. Results

3.1. Enhancement by Gas Vector n-Hexadecane

3.1.1. Effect of n-Hexadecane on Oxygen kLa

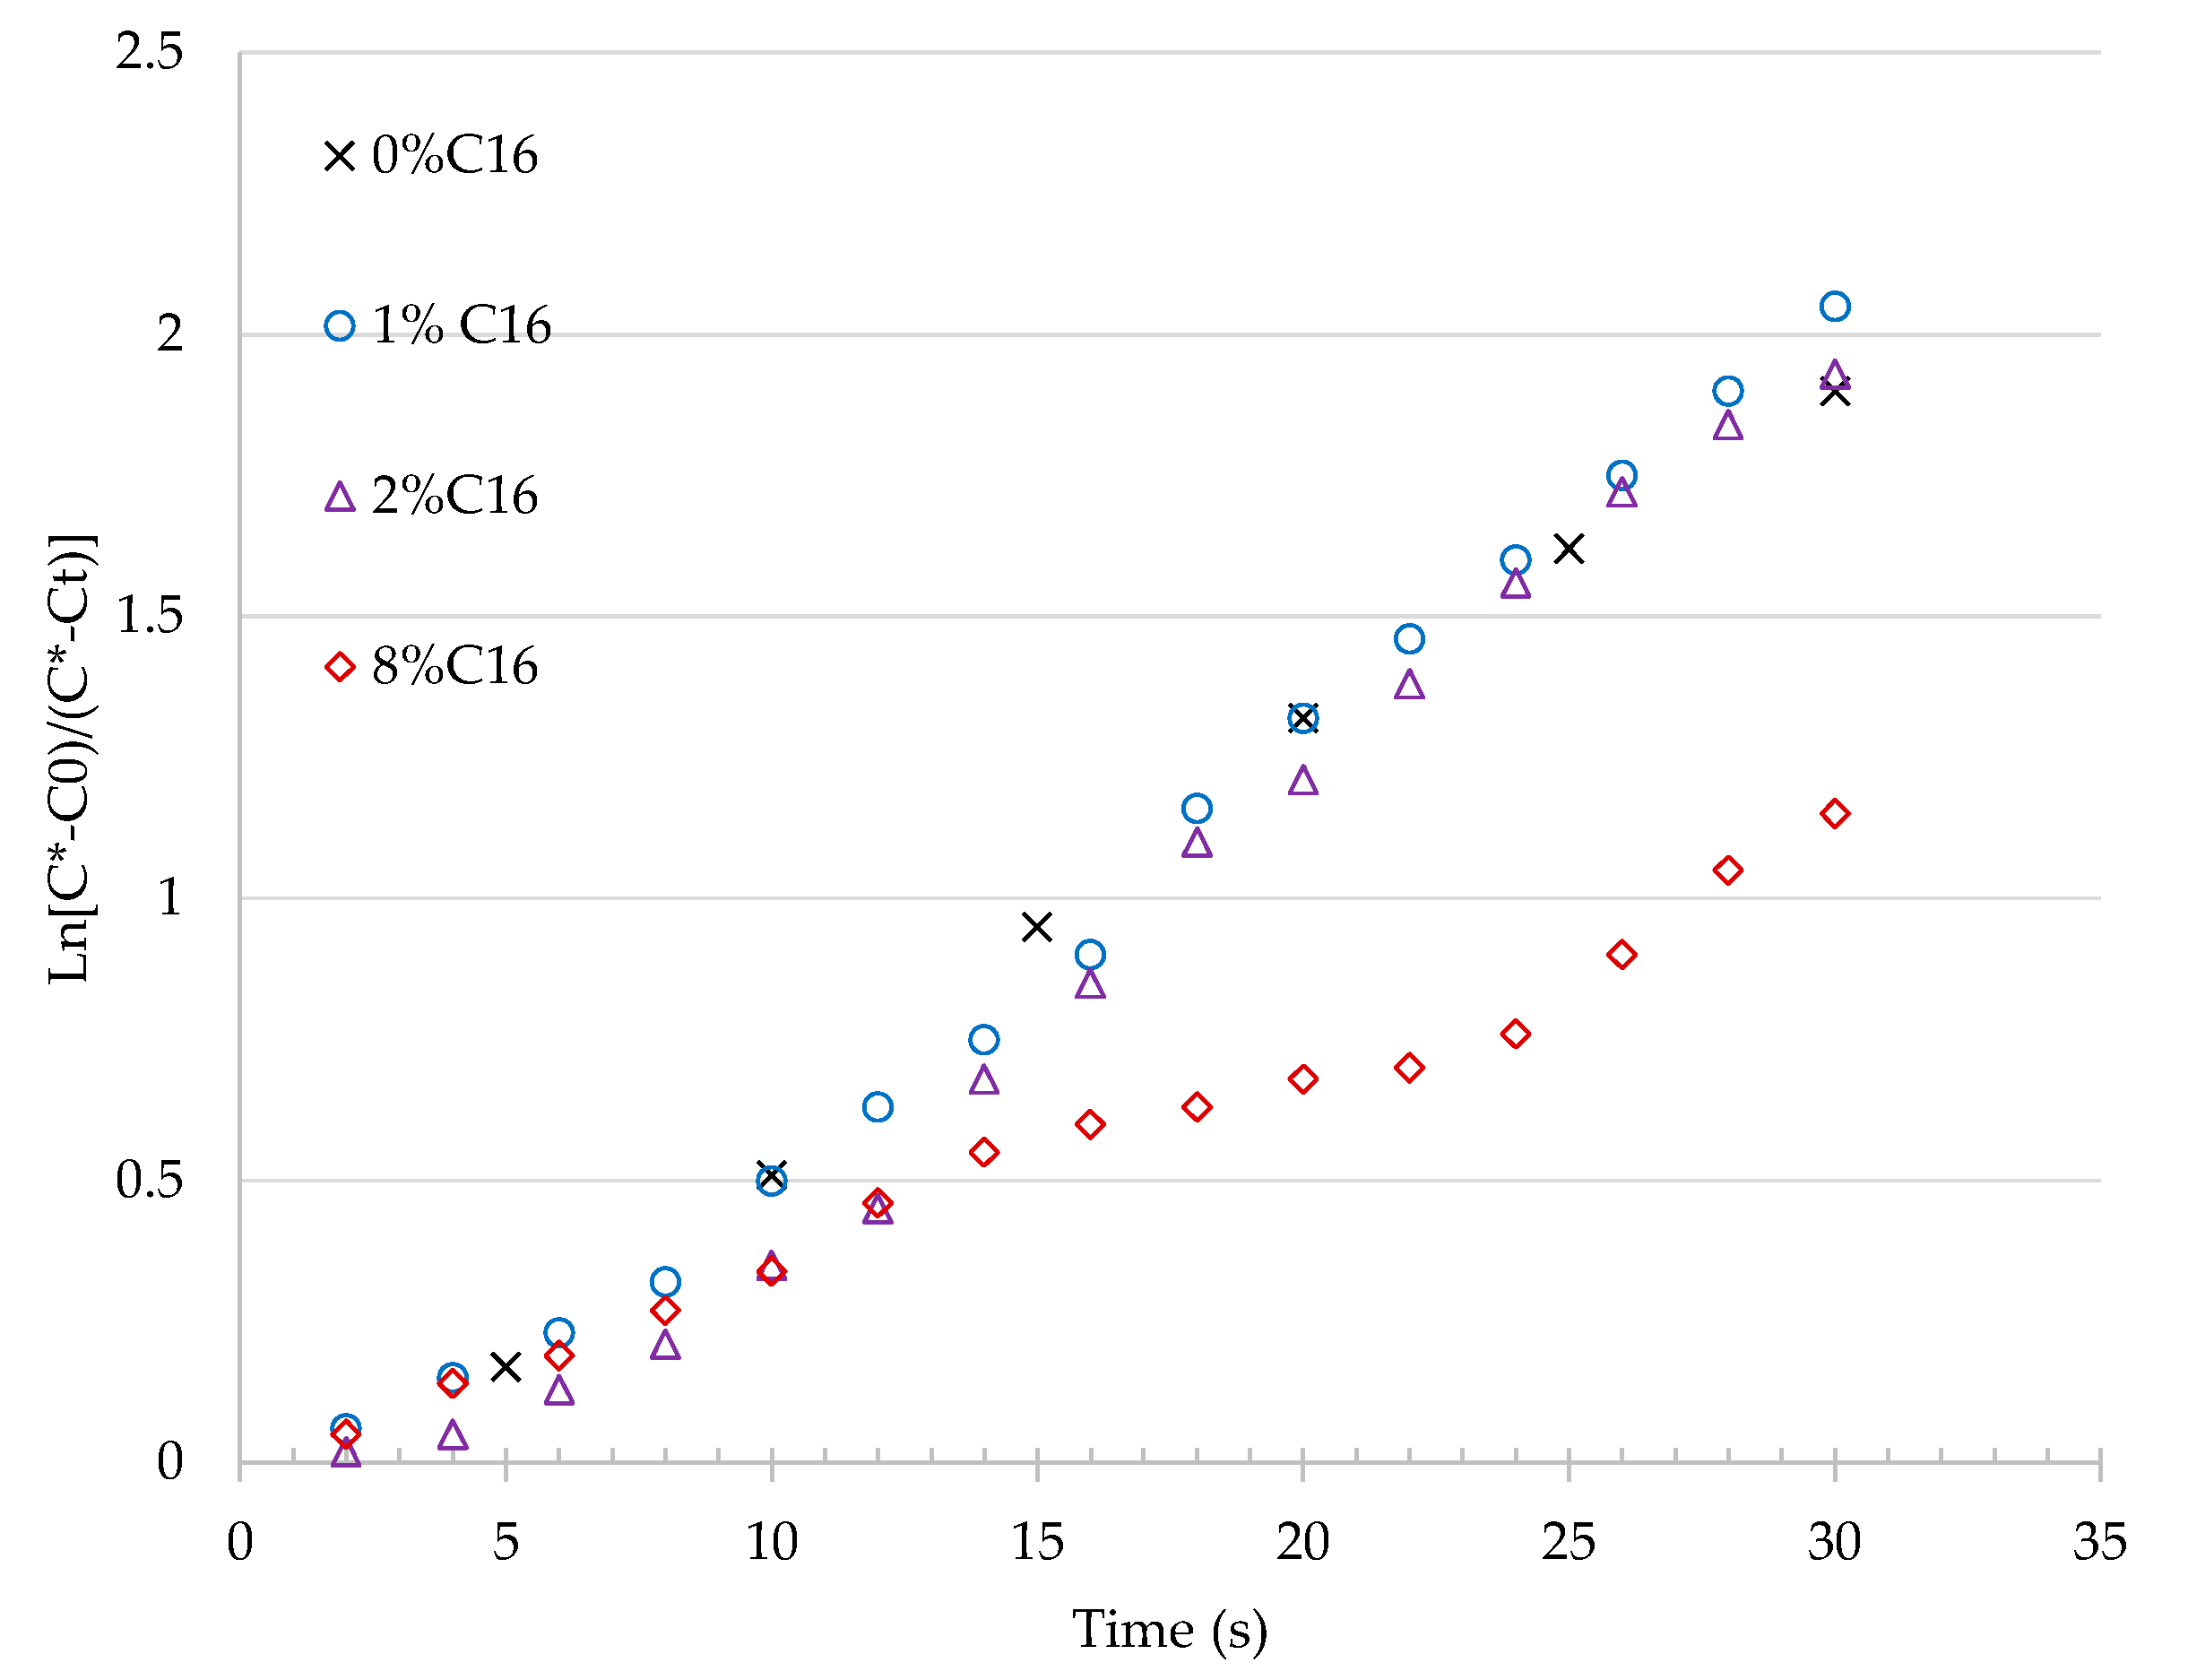
The gas vector n-hexadecane was added into the mineral solution at 1 vol %, 2 vol %, and 8 vol %. A control without n-hexadecane (0 vol %) was also conducted for comparison. The measurements of oxygen mass transfer are plotted with Equation (2) and presented in Figure 2. The values of kLa obtained from the slopes of linear correlations are listed in Table 1, along with their coefficient of determination (R2) and the ratio of kLa to the control without gas vector. The value of R2 is a statistical measure of how close the data points are to the correlation model (Equation (2)). n-Hexadecane (C16H34) increased oxygen kLa to a low extent (5–7%) at low volume percentages (<2 vol %), but decreased the volumetric mass transfer coefficient substantially by 49% at a high volume percentage (8 vol %). Since n-hexadecane has a lower density (0.77 g L−1) and higher viscosity (3.45 cp at 20 °C) than water, it formed an oily layer or film between the aqueous solution and gas. The vector did not promote the gas and water contact, but actually separated them by forming a stable oily film, especially at the high volume percentage (8 vol %).

3.1.2. Effect of n-Hexadecane on Cell Growth

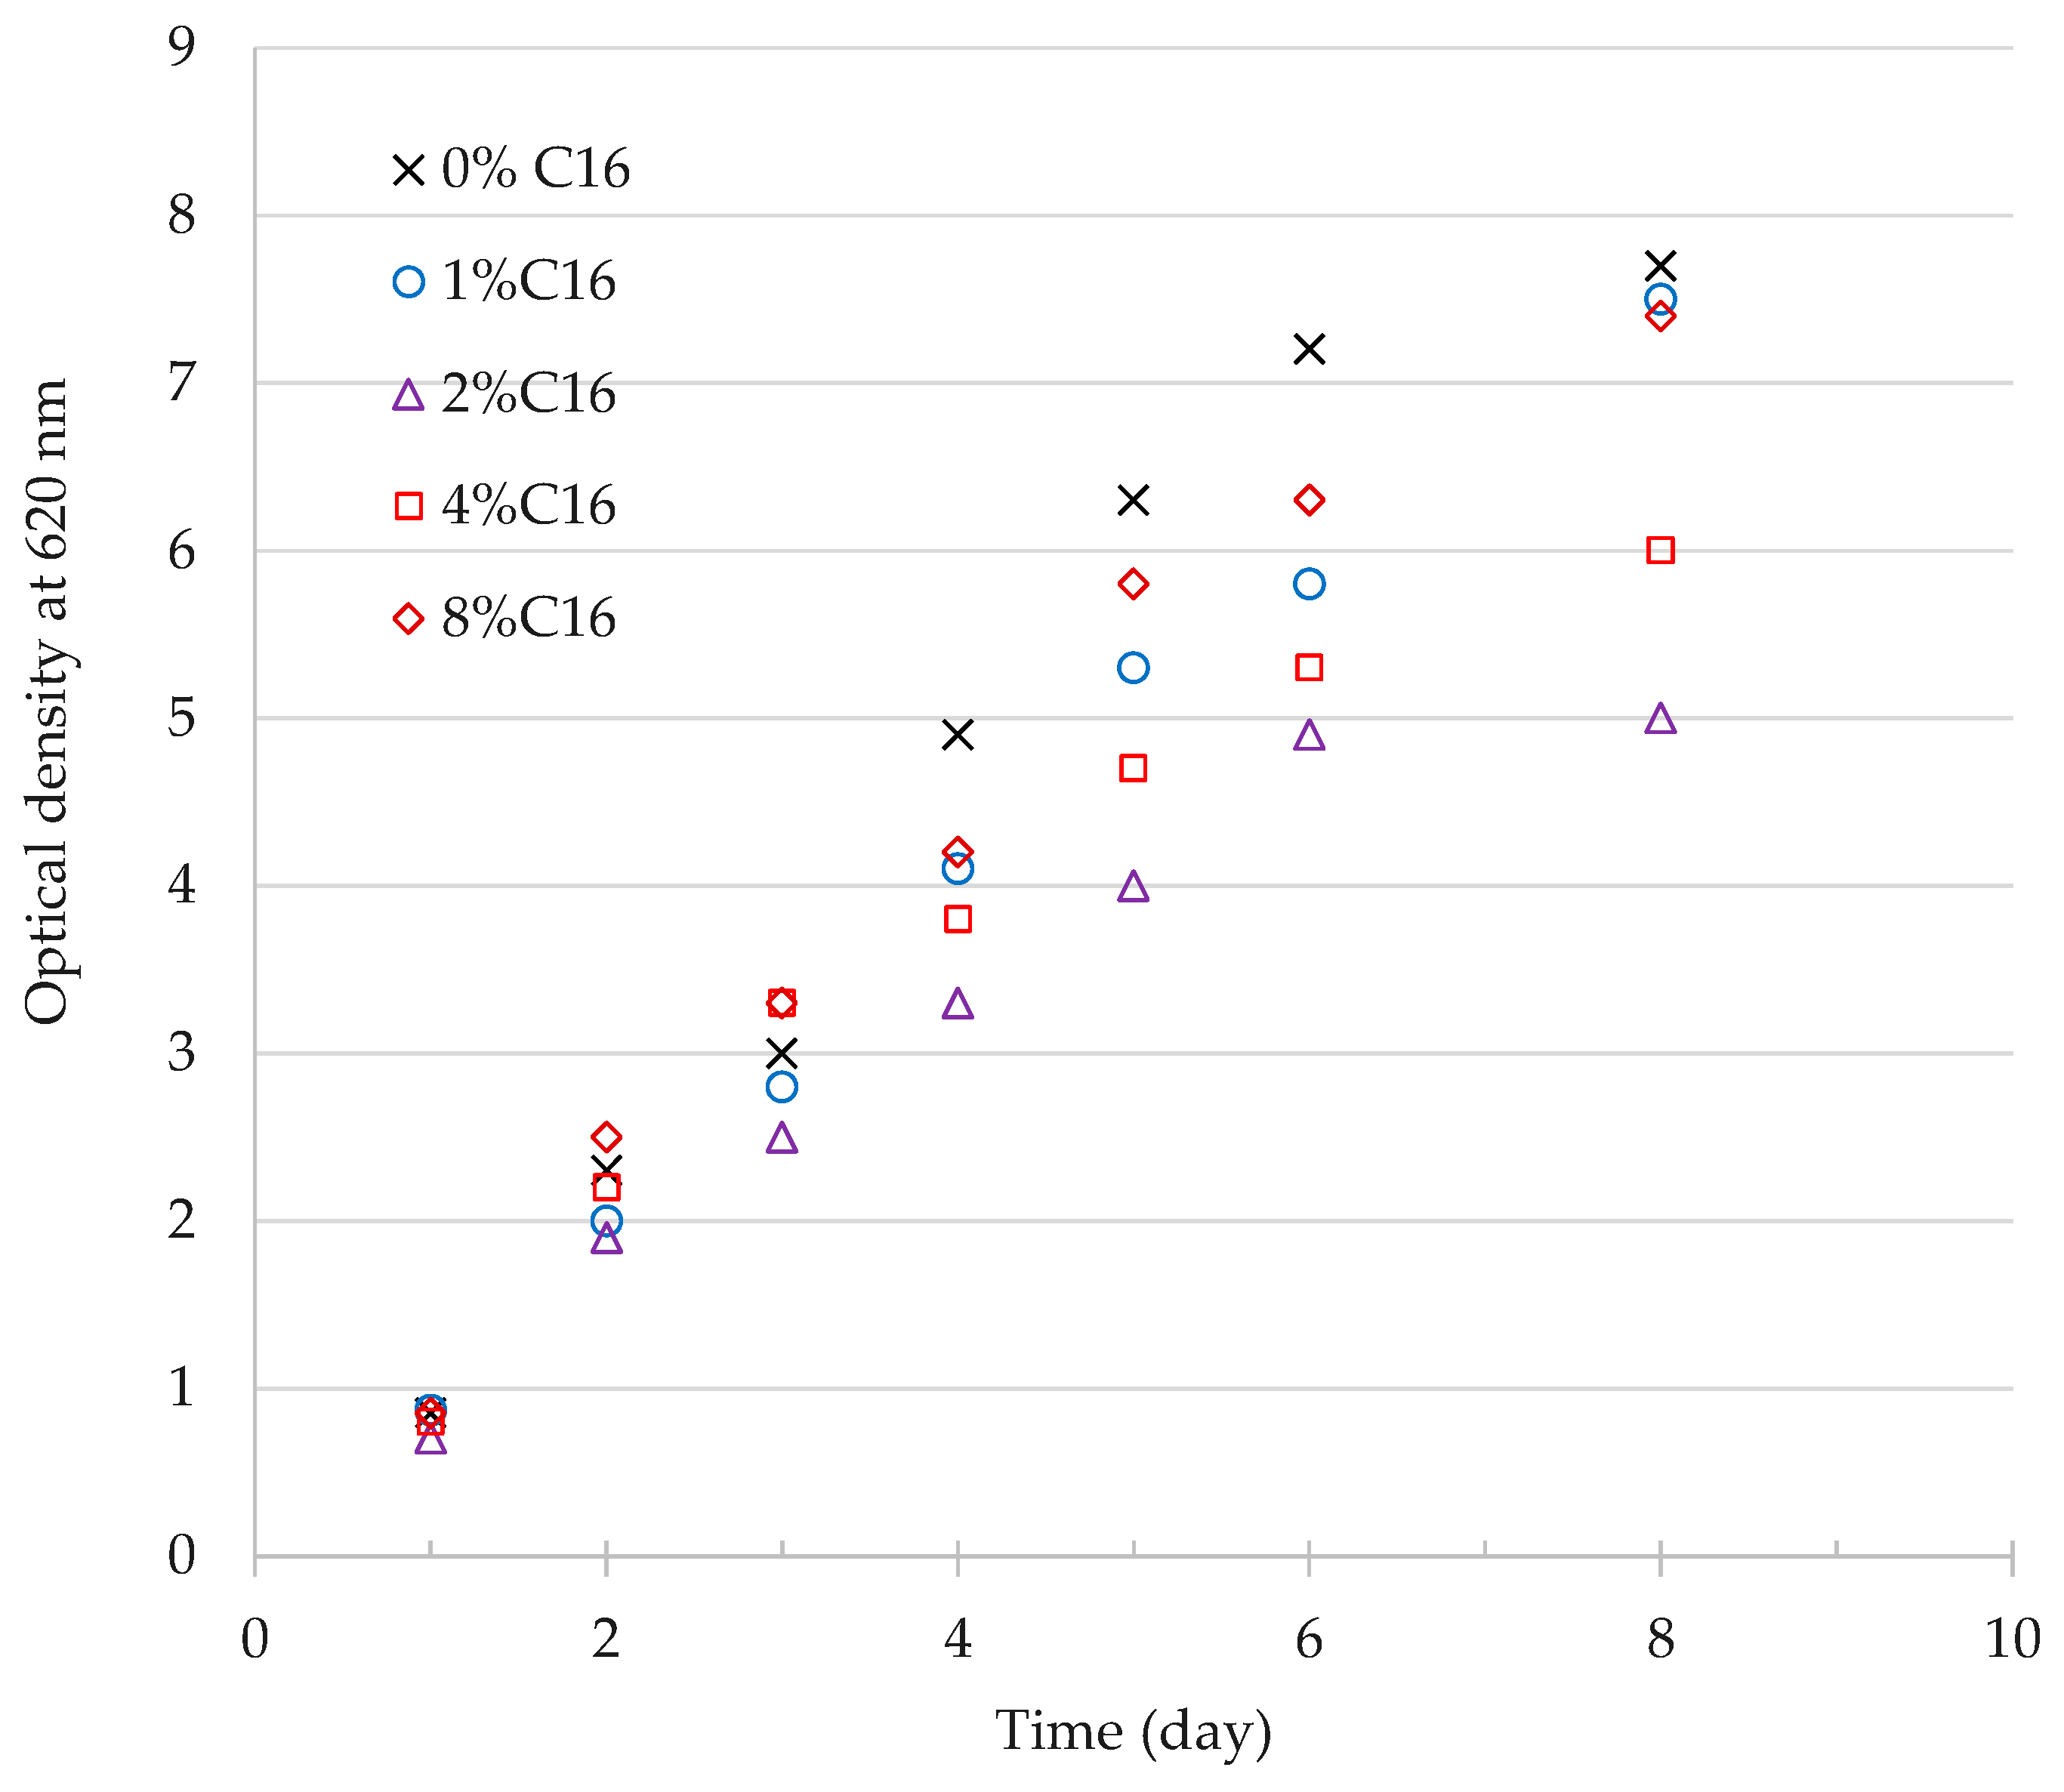
The effect of n-hexadecane on chemolithotrophic growth of C. necator was investigated in bottle cultures on a gas mixture of H2, O2, and CO2 (70:20:10 v:v:v). The volume percentages of the organic liquids were controlled at 0%, 1%, 2%, 4%, and 8%. As shown in Figure 3, the optical density of culture medium was followed to monitor cell growth (1 OD ≈ 0.45 g L−1 dry cell mass). Because of little positive effect of n-hexadecane on gas mass transfer, the gas vector did not benefit cell growth in comparison with the control (0% C16). The result also implies that C. necator did not use n-hexadecane as an organic carbon source under the chemolithotrophic conditions. In contrast, the hydrophobic gas vector exhibited some adverse effect on cell growth, probably by damaging cells’ membranes. This was observed with a low volume percentage of n-hexadecane (1%C16–4%C16) and attributed to a good contact of n-hexadecane and microbial cells under the shaking conditions. The oily film formed at 8%C16 was quite stable under the shaking conditions because of the high viscosity of n-hexadecane. The stable gas–oil–water phases actually reduced the contact of gas vector and microbes and hence reduced the adverse effect of n-hexadecane on living cells.

3.2. Enhancement by Gas Pressure

3.2.1. Effect of Gas Pressure on Cell Growth

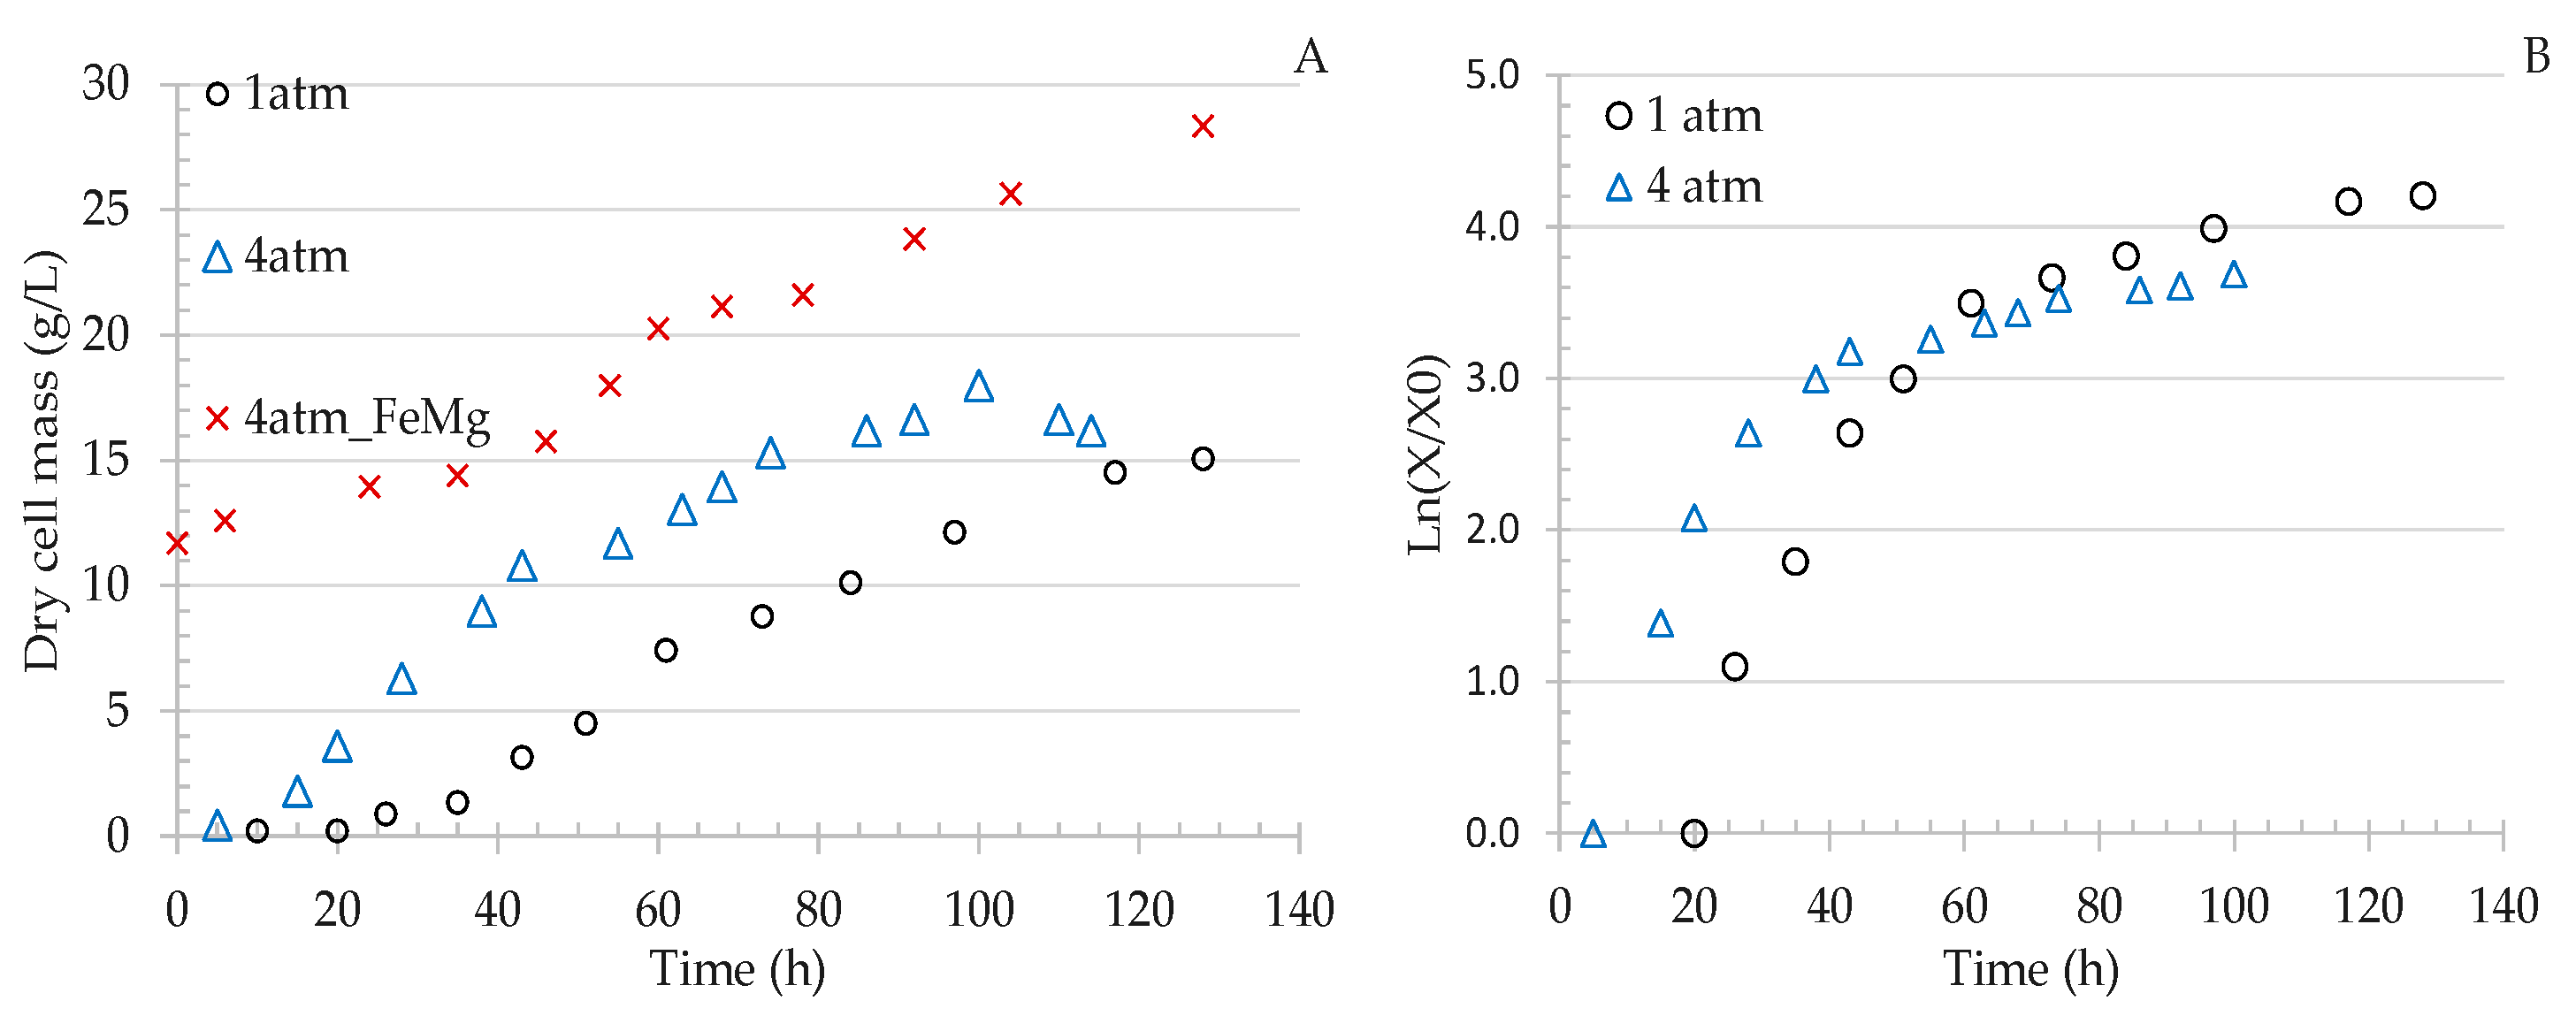
Gas fermentations were started by adding 200 mL bottle cultures (ca. OD 5) into 1.5 L mineral solution (13 vol %). Figure 4a shows the respective time courses of cell density (dry cell mass concentration) under 1 atm absolute pressure (Run A) and 4 atm absolute pressure (Run B). The specific growth rates are calculated by using the linear correlation of natural logarithm of cell density ratio (X/X0) versus time. As shown in Figure 4b, each curve of ln(X/X0) versus time has two linear sections and the slopes are taken as the values of specific growth rates listed in Table 2. Specifically, the two growth stages and rates were determined by a critical cell density (Xcr). Under 1 atm gas pressure, the critical cell density was ca. 4.5 g L−1, where the specific growth rate dropped from 0.094 h−1 to 0.011 h−1. Under 4 atm gas pressure, the critical cell density was ca. 6.3 g L−1, where the specific growth rate declined from 0.12 h−1 to 0.01 h−1. The linear correlations in each stage exhibited quite high coefficients of determination (R2) as shown in Table 2. The two growth stages can be recognized quite easily under 4 atm (Figure 3). In about 100 h, the dry cell mass concentration under 4 atm reached 18 g L−1 and started to decline, probably because of depletion of growth nutrients. This was confirmed by Run C in which the cell mass at the end of Run B was recovered with centrifugation and re-suspended in a fresh medium solution containing doubled amounts of ferric ammonium citrate (0.2 g L−1) and MgSO4·7H2O (1 g L−1). As shown in Figure 4a, the cell density was 11.7 g L−1 at the beginning and increased almost linearly with time. Because of the high initial cell density, only one low growth rate (0.0074 h−1) was observed throughout the gas fermentation (Table 2, Run C).
The high operation pressure in the bioreactor significantly enhanced gas fermentation even though the gain was not proportional to the pressure increase. The growth rate was increased from 0.094 h−1 to 0.12 h−1 under the pressures of 1 atm and 4 atm, respectively. The numbers imply that the chemolithotrophic growth under 1 atm was to some extent restricted by gas substrates. When the cell density reached a critical level (Xcr 4.5 g L−1), one gas might first become the limiting substrate and its dissolved concentration might be below a critical level. After that, the cell growth rate was reduced to and maintained at a quite low level (0.01 h−1) because of the limitation of gas substrate. Under a high pressure (4 atm), the solubility of gas was increased to support a higher critical cell density (Xcr 6.3 g L−1). The result shows that about 40% more cell mass was formed with sufficient gas substrates under the raised pressure. Once the critical cell density was reached, however, the specific growth rates dropped to the same low level (0.01 h−1). The slow chemolithotrophic growth was attributed to gas limitation as well as the extra energy required for cell maintenance. This was confirmed by using an inoculum of very high cell density under which the gas became limited right at the beginning and no high growth rate was observed throughout the gas fermentation.

3.2.2. Effect of Pressure on Gas Uptake Rates

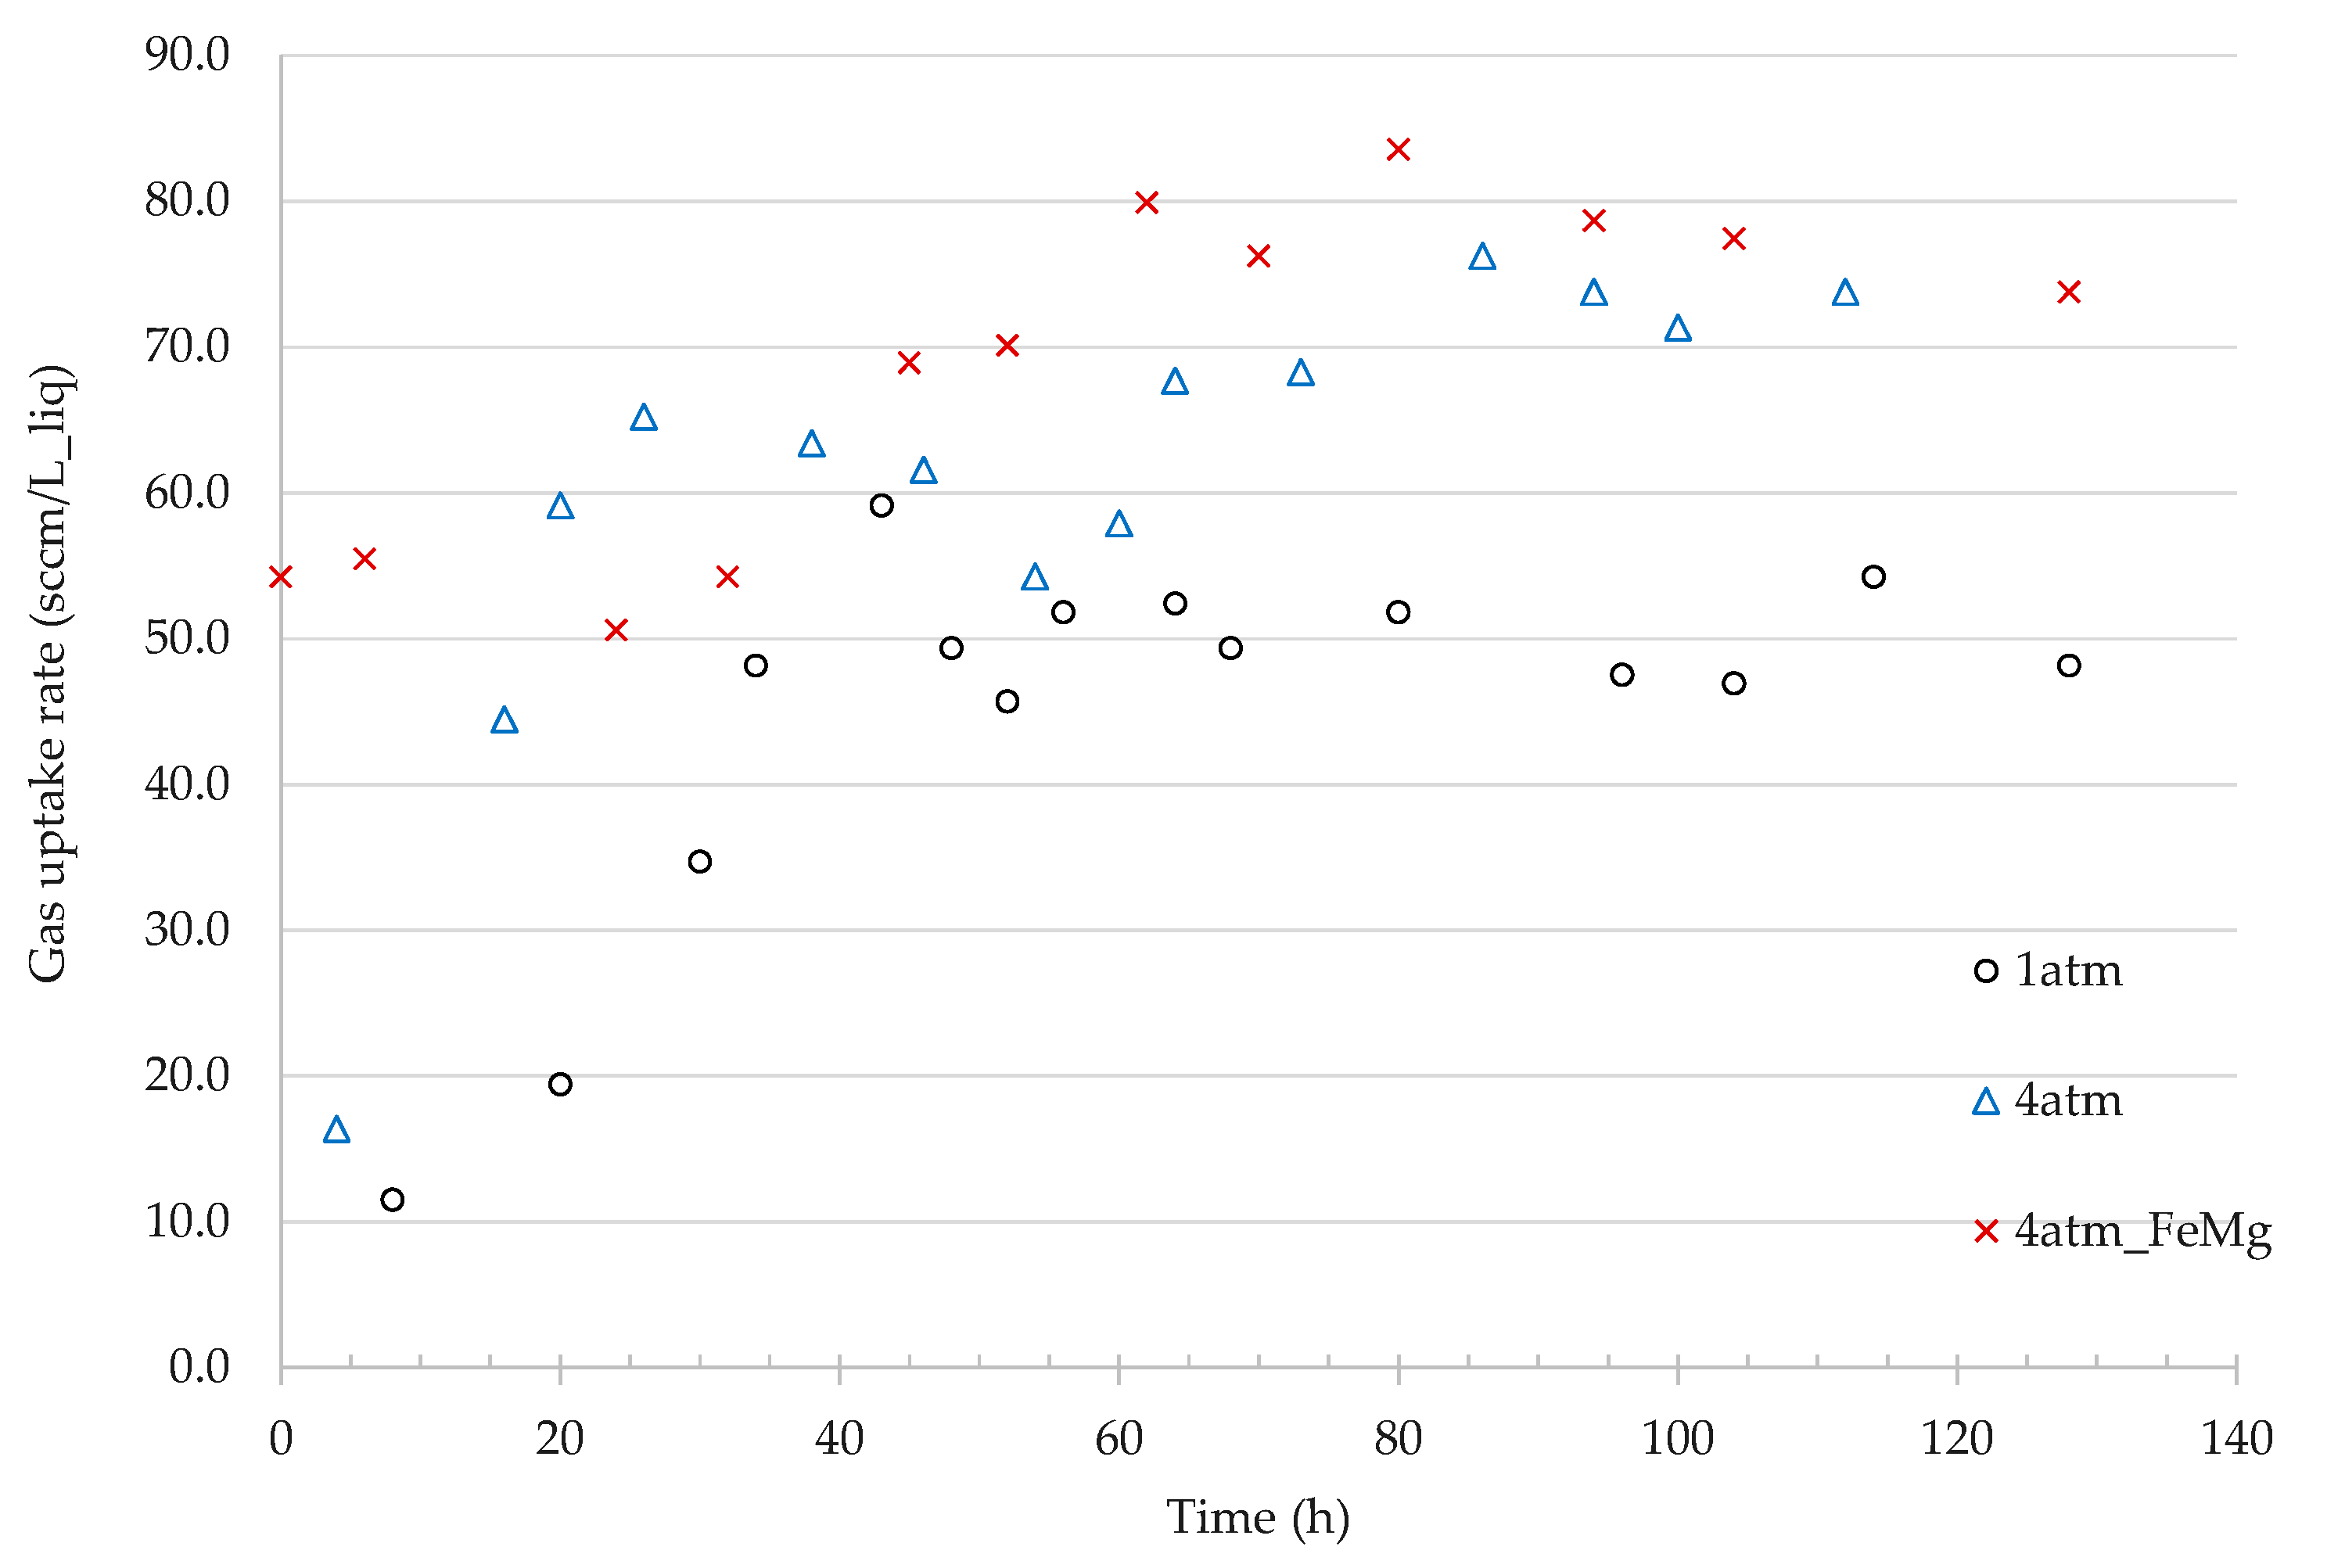
In the gas fermentations shown above (Table 2), 1.5 L of mineral solution was gassed with a constant gas stream at 140 sccm or 93 sccm gas per L liquid volume (<0.1 vvm). The exhaust gas flow rate was measured under room conditions (23 °C, 1 atm) and converted into sccm under the standard conditions (0 °C, 1 atm). Figure 5 shows the gas uptake rates, i.e., the difference of inlet and outlet gas flow rates, by the microbes in 1 L medium solution. Under 1 atm gas pressure, the gas uptake rate increased with time (i.e., cell density), and reached a plateau around 50 sccm L−1. About 54 vol % of the inlet gas was absorbed and utilized by the microbes. Under 4 atm gas pressure, the gas uptake rate increased with time much faster, approaching a higher plateau around 70 sccm L−1. About 75 vol % of the inlet gas was absorbed and utilized by the microbes. With an inoculum of very high cell density, the gas uptake rate under 4 atm gas pressure started at ca. 55 sccm L−1 and increased to a plateau around 80 sccm L−1. About 86 vol % of the inlet gas was absorbed and utilized by the microbes. Table 3 gives the gas uptake rates and gas compositions at the end of fermentations, from which the uptake rates of individual gases at the quasi-steady state are calculated.
The microbial gas uptake rate was increased under high pressure because of the enhancement of gas mass transfer rate (Equation (1)). At the end of gas fermentations, ca. 80 vol % of inlet gas was taken up by microbes under 4 atm gas pressure while about 50% of the inlet gas was consumed under 1 atm gas pressure (Table 3). Interestingly, the same CO2 uptake rate (11.4–11.9 sccm or ca. 0.5 mmole min−1) was observed at the quasi-steady state regardless of the pressure. This was in line with the same low specific growth rate under the gas limitation as shown above.

3.3. Residual Cell Mass Hydrolysates as Growth Nutrients

The residual cell mass (RCM, a dry cell mass with 0 wt % PHB) was subjected to ultimate analysis as shown in Table 4 [10]. Its ash content was 8.0 wt % of dry mass. Based on the composition, the experimental formula of residual cell mass is CH1.69O0.46N0.25 (FW 24.55), indicating that nitrogen, accounting for 14 wt % of the residual cell mass, is an essential nutrient for chemolithotrophic growth on CO2. For comparison, the experimental formula of PHB is CH1.5O0.5 (FW 21.5) and its synthesis does not need nitrogen nutrient. Water-soluble nitrogen-rich hydrolysates were prepared through thermal liquefaction of RCM as reported before [10].
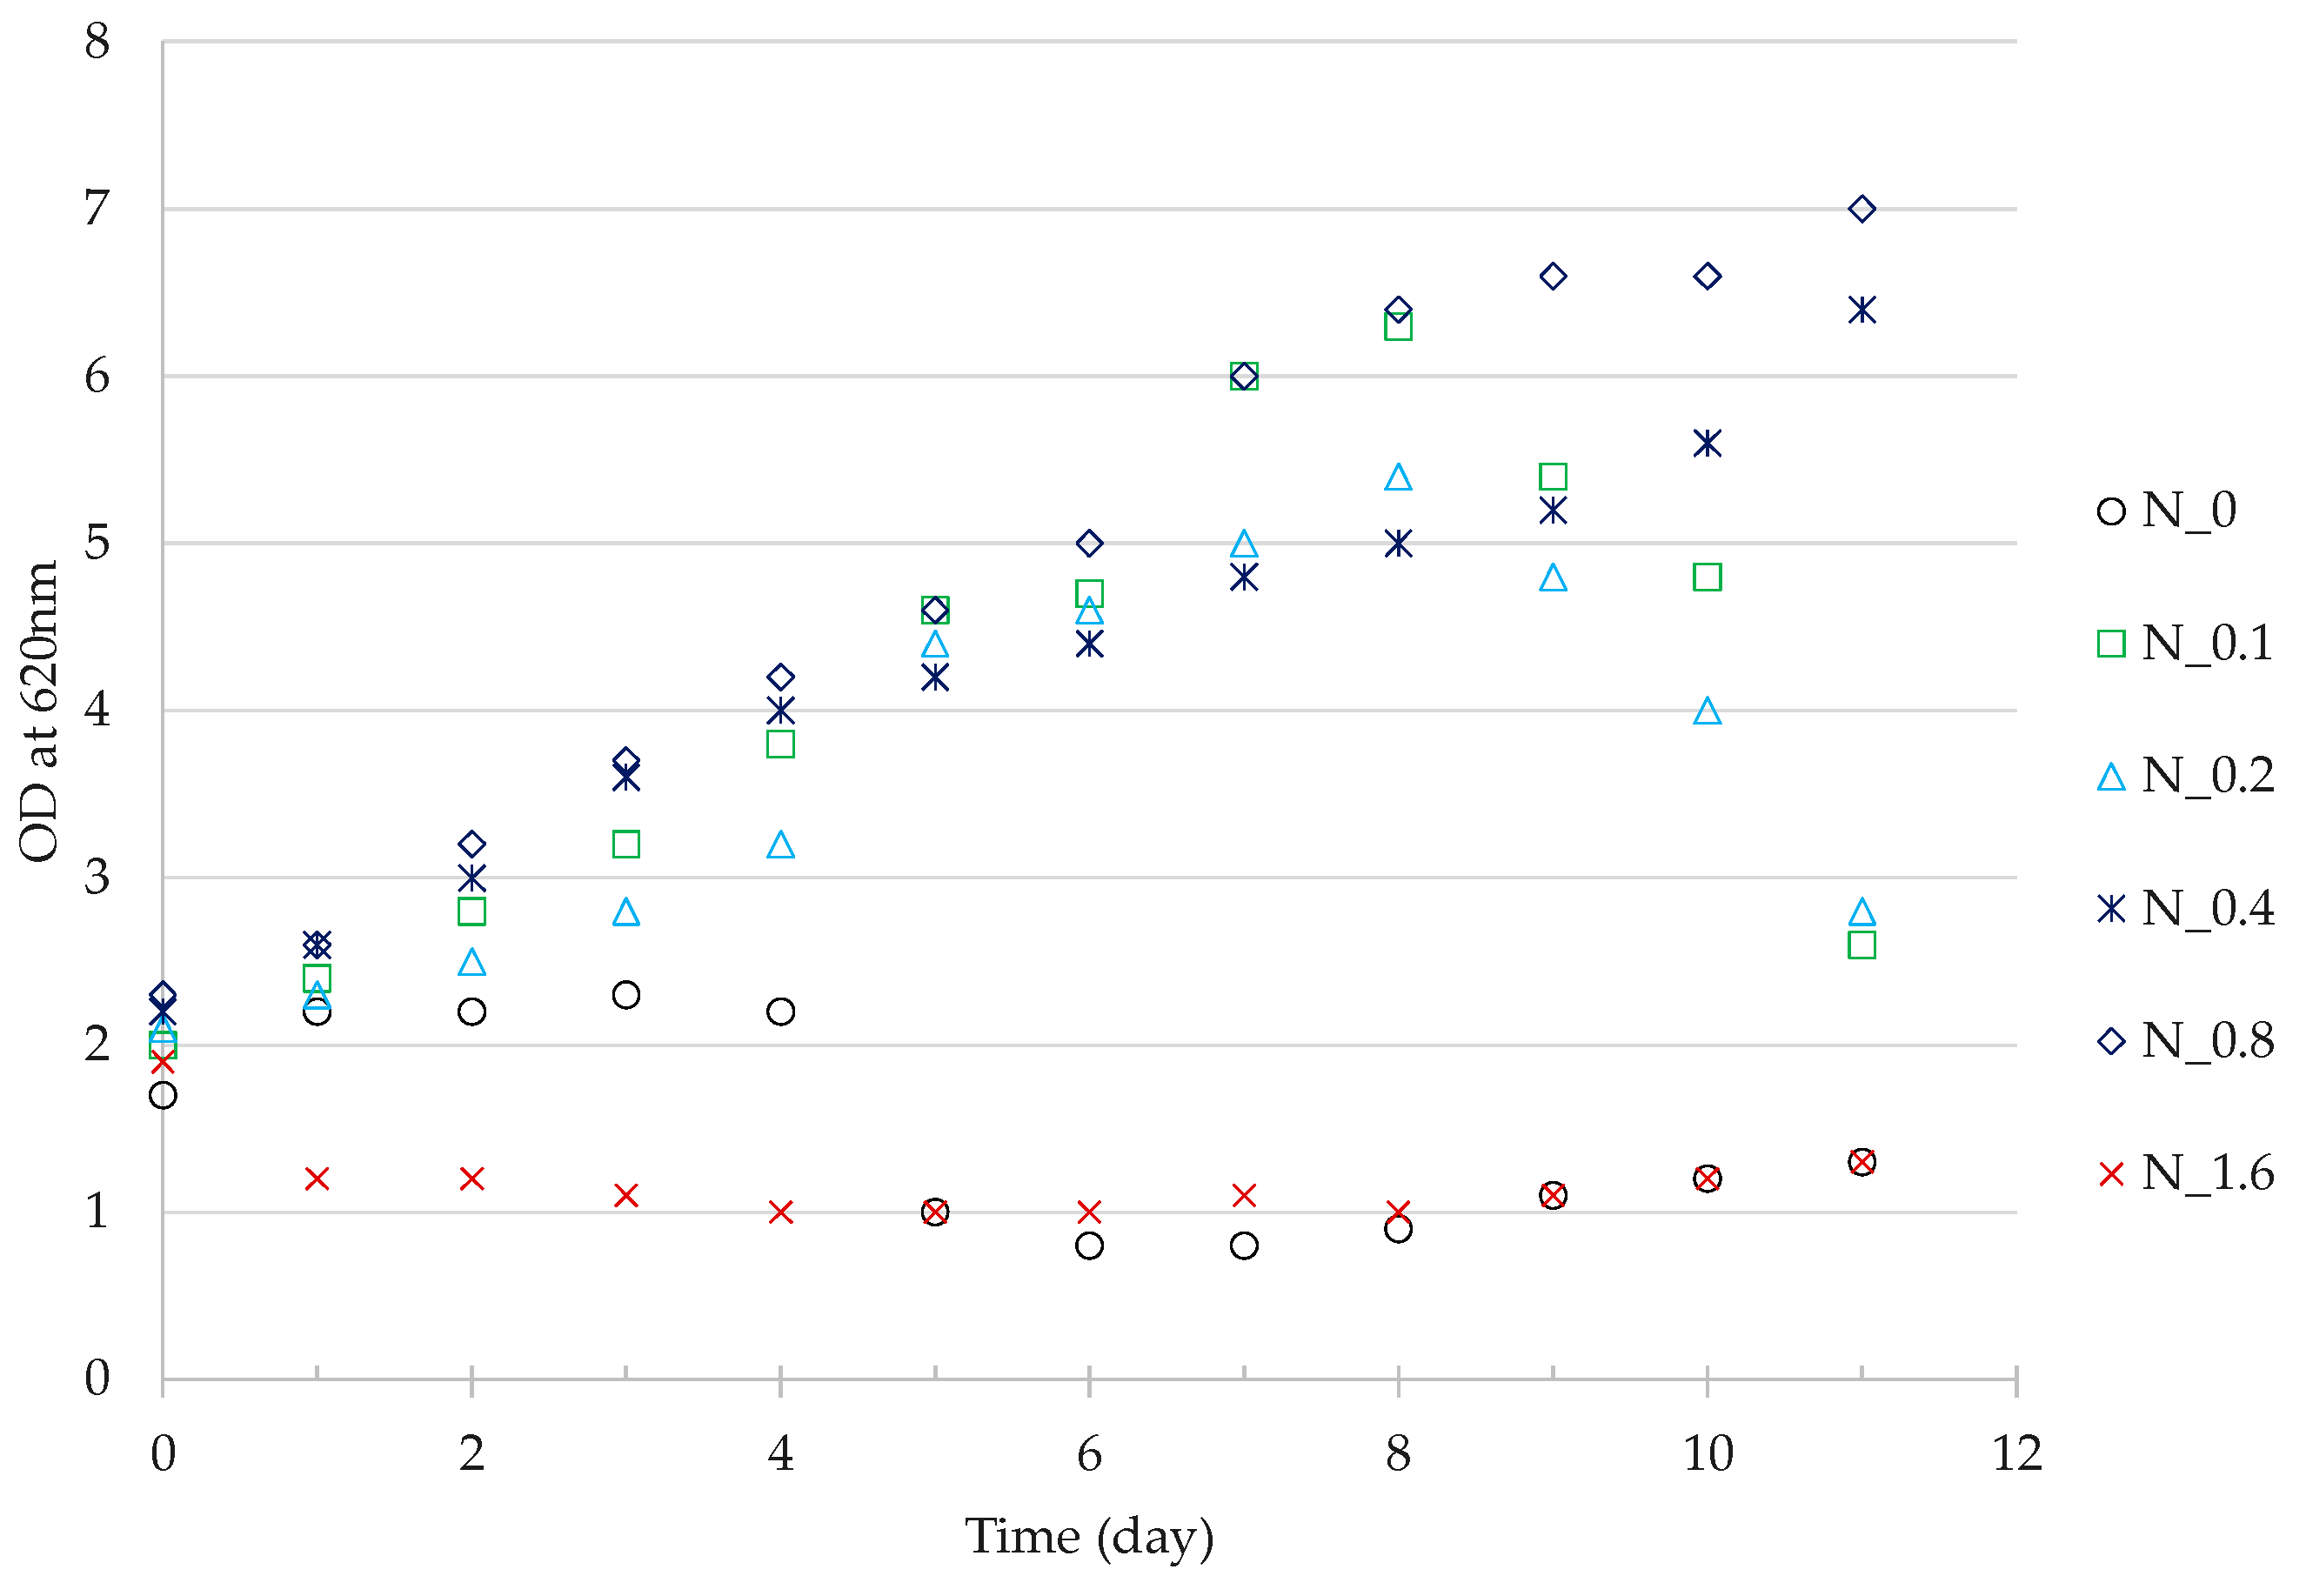
The hydrolysates were added into a nitrogen-free mineral solution to give initial concentrations of organic N from 0 to 1.6 g N L−1. C. necator was grown on a gas mixture (H2/O2/CO2 = 70:20:10 v:v:v) in bottle cultures and the optical densities (OD) of medium solution were monitored for cell growth as shown in Figure 6. In the control without nitrogen nutrient (N_0), the bacterium did not grow and lysed after 4 days. With an initial nitrogen of 0.1 to 0.8 g L−1, the chemoautotroph grew very well up to 11 days with a high nitrogen concentration (N_0.4, N_0.8), or lysed after 8–9 days with a low initial nitrogen concentration (N_0.1, N_0.2). Nutrient nitrogen depletion might cause the cell lysis as observed with the control. A very high concentration of organic nitrogen (N_1.6), however, inhibited microbial growth, probably because of high concentrations of inhibitors formed during the thermal liquefaction of residual cell mass. At the end of bottle cultures (11 days), the dry cell mass generated with high nitrogen concentrations (N_0.4 and N_0.8) was recovered for PHB analysis and the PHB contents were 32 wt % and 4 wt %, respectively. The numbers indicate that the amount of RCM nitrogen could determine the carbon flow to PHB synthesis under nutrient limitation (N_0.4) or to cell growth under sufficient nutrients (N_0.8).
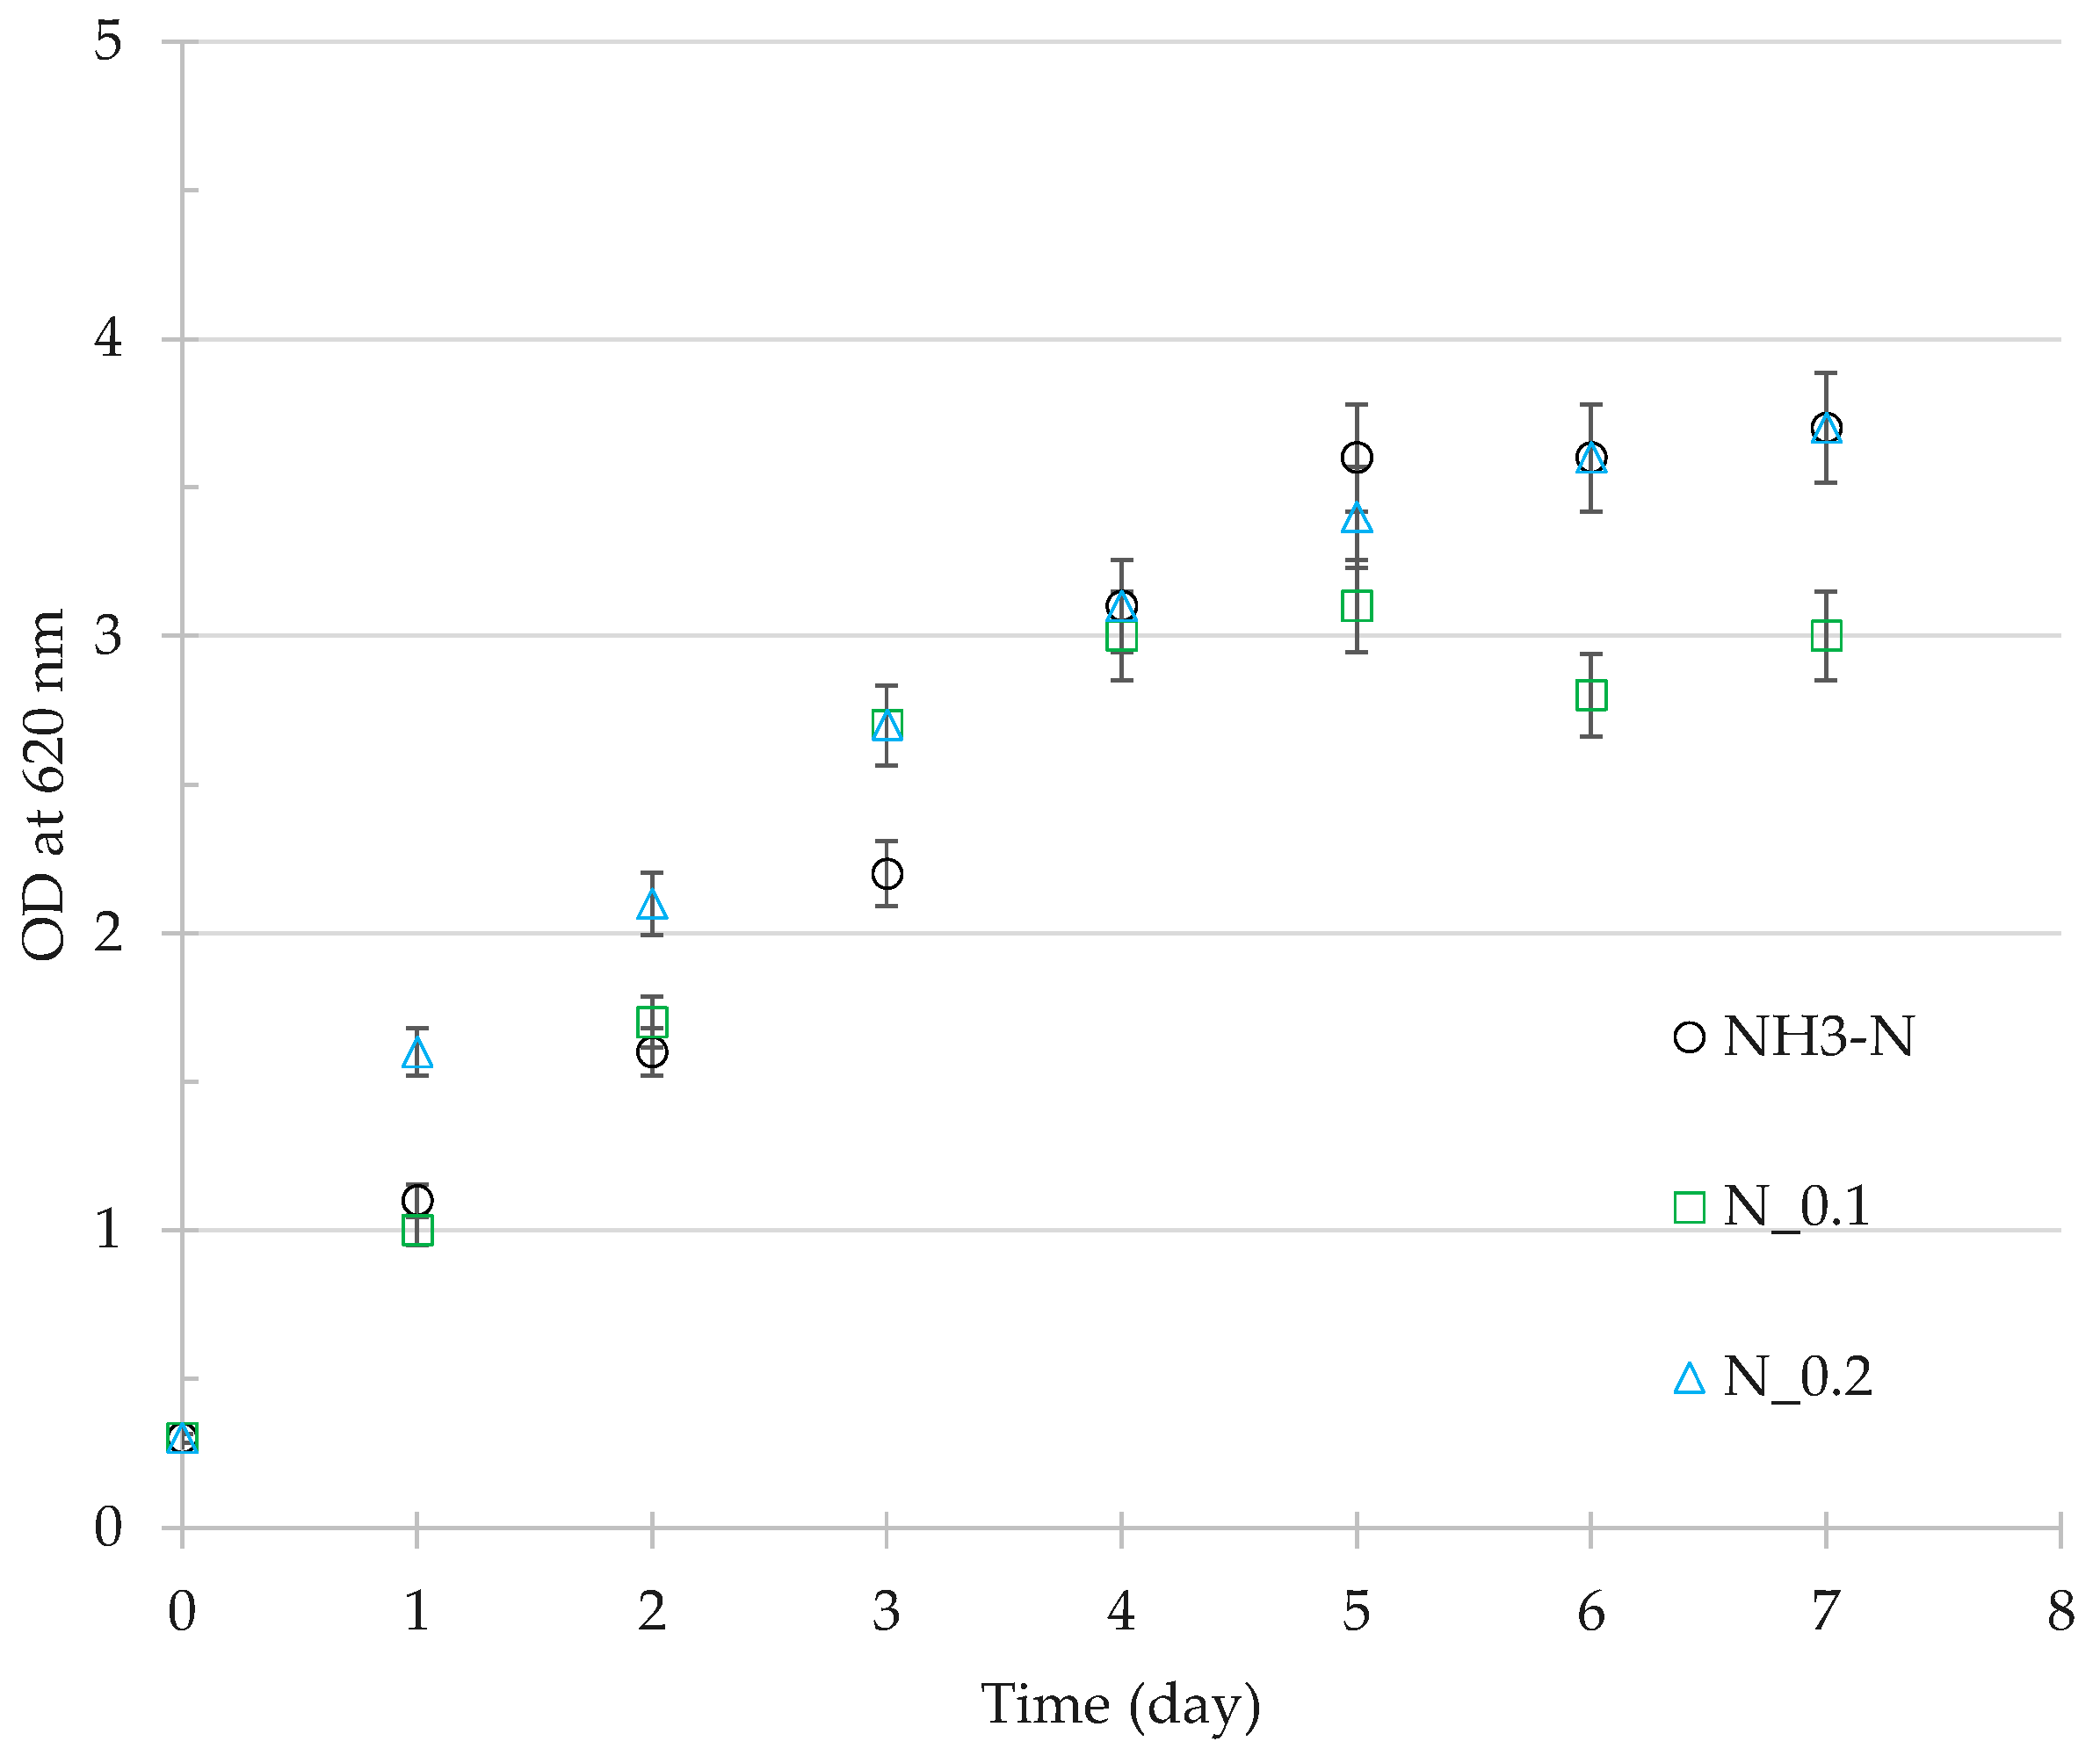
The nutrient value of RCM nitrogen in autotrophic growth was compared with ammonia-nitrogen under the same conditions above. Ammonium N is a common nitrogen source for growth of C. necator under chemolithotrophic conditions [6]. As shown in Figure 7, with an initial 0.25 g NH3–N L−1, the optical density increased with time to OD 3.6 or ca. 1.62 g DCM L−1. This was close to a theoretical dry cell mass concentration (ca. 1.7 g DCM L−1) based on the nitrogen content of residual cell mass. With 0.2 g N L−1 of RCM nitrogen, the organic nitrogen promoted cell growth in early time (Day 1–Day 3), probably because of the organic carbons or other minor nutrients of the cell mass hydrolysates, but finally gave the same cell density as ammonia nitrogen did. With an initial 0.1 g L−1 of RCM nitrogen, the OD reached the same levels as with ammonium nitrogen in early time (Day 1 to Day 4) till a final OD around 3, most likely because of depletion of nitrogen nutrient. These numbers indicate that the RCM hydrolysates are a good source of nutrients, primarily nitrogen, for chemotrophic growth of C. necator.

4. Discussion

4.1. Effect of Gas Vector on Gas Fermentation

Under 1 atm pure O2, the solubility of O2 in water at 30 °C is 1.17 mmole L−1, and the solubility in n-hexadecane is about 10 times higher [15,17]. Under a partial pressure of 0.2 atm, the oxygen solubility was 0.23 mmole L−1 in water and ca. 2.3 mmole L−1 in n-hexadecane, respectively. The little positive effect of n-hexadecane on oxygen kLa at a low volume percentage (<2 vol %) might be attributed to the high oxygen solubility in n-hexadecane. A good contact between water and n-hexadecane might be beneficial to oxygen mass transfer from the gas vector to water. However, the O2 concentration in the gas phase (23 °C and 0.2 atm O2) was 8.2 mmole L−1 according to the ideal gas law, which was much higher than the oxygen concentration in n-hexadecane (2.3 mmole L−1). According to thermodynamics, the high gas concentration actually favored a direct mass transfer from gas to water, rather than an indirect gas transfer via the gas vector. This explained the negative effect of n-hexadecane on oxygen kLa when water and gas were separated by a stable oily film at a high volume percentage (8 vol %). Because of the adverse effect of n-hexadecane on cell growth at low volume percentages (<4 vol %), it is concluded that the organic gas vector n-hexadecane cannot enhance the gas fermentation.

4.2. Effect of Pressure on Gas Fermentation

Assimilation of CO2 (oxidation state +4) into cellular carbon (average oxidation state 0 as in CH2O) requires reducing equivalents such as nicotinamide adenine dinucleotide (NADH) and energy input that is provided by hydrolysis of adenosine triphosphate (ATP). Hydrogen is the sole source of the reducing agents and ATP for chemolithotrophic growth of C. necator [23]. A high operation pressure in the bioreactor could enhance the gas fermentation by increasing the driving force of gas mass transfer. Specifically, a higher cell density was obtained in a shorter period of time to give a higher fermentation productivity. The enhancement, however, was not proportional to the pressure increase as predicted by Henry’s law (Equation (1)). Most likely, one gas became the limiting substrate when the cell density reached a critical level. The partial pressures of individual gases were determined by the operation pressure in the bioreactor as well as the gas composition. A high chance was that one gas became the limiting substrate, rather than two and three at the same time. As shown in Table 3, the inlet gas composition affected the outlet gas composition as well as H2 consumption for CO2 assimilation. A high inlet CO2 (20 vol %) resulted in an increased outlet CO2 (24.3 vol %) because of consumption of H2 and O2 by the microbes (Table 3, Run A). Under the conditions of sufficient CO2, O2 was most likely the limiting gas and the uptake molar ratios of H2/CO2 and O2/CO2 were 3.7 and 1.5, respectively. With a low inlet CO2 (10 vol %) and high H2 (70 vol %), the outlet CO2 declined to 7.2 vol % (Table 3 Run B). The gas uptake molar ratios of H2/CO2 and O2/CO2 were 6.2 and 2.1, respectively. Obviously, more oxygen was used in CO2 fixation, resulting in a relatively high hydrogen consumption (H2/CO2 = 6.2). Because more gas was consumed per CO2 assimilation, the cell mass gain obtained under a high pressure was not proportional to the pressure increase. The different oxygen and hydrogen consumption might be attributed to the key enzyme of CO2 fixation. C. necator fixes CO2 via the Calvin–Benson–Bassham (CBB) cycle under aerobic conditions with hydrogen as the only source for energy and reducing equivalents [23]. The key enzyme is ribulose-1,5-bisphosphate carboxylase/oxygenase (RubisCO) which catalyzes the electrophilic addition of CO2 to a C5 sugar ribulose-1,5-bisphosphate (Ru1,5P), giving rise to an unstable C6 intermediate that is reduced into two molecules of glyceraldehyde-3-phospahte (GA3P) [24]. RubisCO, however, is a low-efficiency enzyme exhibiting a low affinity for CO2 (high Kc), a slow catalytic turnover rate (kcat = 2–12 s−1), and a wasteful oxygenase activity that results in a futile cleavage of Ru1,5P into 2-phosphoglycolate and CO2 formation [24,25]. In the gas fermentation, the dissolved CO2 had to compete with O2 for RubisCO [25]. Although CO2 had a relatively higher solubility in water than H2 and O2, its predominant form around pH 7 was bicarbonate (CO2 + H2O ↔ HCO3 + H+). Since free CO2 was the substrate of Rubisco, it might become the limiting gas under a relatively lower composition (10 vol %) in competition with oxygen, and the oxygenase activity of Rubisco might become substantial under the fermentation conditions. As a result, some oxygen was used for oxidation of reduced carbon to form CO2.

4.3. Nutrient Value of Residual Cell Mass

The residual cell mass or a cell mass with little PHB is mainly composed of proteins (50%), nucleic acids (15%), lipids (8%), and cell wall substances (20%) [26]. Under chemolithotrophic conditions, the amount of total lipids of a C. necator strain is ca. 7.8% of the residual cell mass [27]. Through the hydrothermal liquefaction process, 85–90 wt % of the residual biomass was hydrolyzed in subcritical water (300 °C) [10]. About 45 wt % of carbon biomass was recovered as a bio-crude oil and about 40 wt % carbon biomass as hydrolysates left in the aqueous solution. Most N-containing components (ca. 67 wt %) were decomposed and left in the aqueous solution [10]. The concentrations of organic C and N were 10.8 g L−1 and 24.5 g L−1, respectively. When the solution was diluted as N nutrient source (0.2 g N L−1), the organic carbon concentration was diluted to ca. 0.09 g C L−1. The organic carbon might be utilized under the mixotrophic conditions, but contributed less than 10% of organic carbon in the final dry cell mass (Figure 7). The RCM hydrolysates were primarily a nitrogen source with little other nutritive benefit to C. necator.

5. Conclusions

Three strategies were investigated in this work to enhance gas fermentation. The gas pressure can considerably enhance the gas fermentation because of the increased dissolved gas concentrations under a high pressure. The cell mass yield was not proportional to the increased pressure, probably because of the molar composition of the gas. The hydrolysates of residual cell mass do not provide unknown essential nutrients to microbial growth, indicating that the strain of C. necator was a true chemolithoautotroph. The cell mass hydrolysates are good source of nitrogen nutrients for the chemolithotrophic growth and can replace ammonia nitrogen in gas fermentations. A gas vector such as n-hexadecane has been proposed to enhance microbial fermentation, but was found to have little positive effect on the gas mass transfer coefficient (kLa) and chemolithotrophic growth of C. necator.

Author Contributions

Conceptualization, J.Y.; Methodology, J.Y. and P.M.; Investigation, P.M.; Formal analysis, J.Y. and P.M.; Writing—original draft preparation, J.Y. and P.M.; Writing—review & editing, J.Y.; Project administration, J.Y.; Funding acquisition, J.Y.

Funding

This research was funded by Office of Naval Research (APRISES 14 N00014-15-1-0028, APRISES 15 N00014-16-1-2116).

Conflicts of Interest

The authors declare no conflict of interest.

References

  1. Hunt, A.J.; Sin, E.H.K.; Marriott, R. Generation, capture, and utilization of industrial carbon dioxide. Chem. Sus. Chem. 2010, 3, 306–332. [Google Scholar] [CrossRef] [PubMed]
  2. Huber, R.; Eder, W. Aquificales. In The Prokaryotes: A Handbook on the Biology of Bacteria, 3rd ed.; Dworkin, M., Falkow, S., Rosenberg, E., Eds.; Springer-Verlag: New York, NY, USA, 2006; Volume 7, pp. 925–928. ISBN 978-0-387-30740-4. [Google Scholar]
  3. Vandamme, P.; Coeyne, T. Taxonomy of the genus Cupriavidus: A tale of lost and found. Int. J. Syst. Evol. Micr. 2004, 54, 2285–2289. [Google Scholar] [CrossRef] [PubMed]
  4. Tanaka, K.; Ishizaki, A.; Kanamaru, T. Production of poly (D-3-hydroxybutyrate) from CO2, H2, and O2 by high cell density autotrophic cultivation of Alcaligenes eutrophus. Biotech. Bioeng. 1995, 45, 268–275. [Google Scholar] [CrossRef] [PubMed]
  5. Volova, T.G.; Kiselev, E.G.; Shishatskaya, E.I. Cell growth and accumulation of polyhydroxyalkanoates from CO2 and H2 of a hydrogen-oxidizing bacterium, Cupriavidus eutrophus B.-10646. Bioresour. Technol. 2013, 146, 215–222. [Google Scholar] [CrossRef] [PubMed]
  6. Lu, Y.; Yu, J. Comparison analysis on the energy efficiencies and biomass yields in microbial CO2 fixation. Process Biochem. 2017, 62, 151–160. [Google Scholar] [CrossRef]
  7. Yu, J. Fixation of carbon dioxide by a hydrogen-oxidizing bacterium for value-added products. World J. Microbiol. Biotechnol. 2018, 34, 89–98. [Google Scholar] [CrossRef] [PubMed]
  8. Calloway, D.H.; Kumar, A.M. Protein quality of the bacterium Hydrogenomonas eutropha. Appl. Microbiol. 1969, 17, 176–178. [Google Scholar] [PubMed]
  9. Waslien, C.I.; Calloway, D.H. Nutritional value of lipids in Hydrogenomonas eutropha as measured in the rat. Appl. Microbiol. 1969, 18, 152–155. [Google Scholar] [PubMed]
  10. Kang, S.; Yu, J. Hydrophobic organic compounds from hydrothermal liquefaction of bacterial biomass. Biomass Bioenergy 2015, 74, 92–95. [Google Scholar] [CrossRef]
  11. Nowotny, J.; Bak, T.; Chu, D. Sustainable practices: Solar hydrogen fuel and education program on sustainable energy systems. Int. J. Hydrogen Energy 2014, 39, 4151–4157. [Google Scholar] [CrossRef]
  12. Garcia-Ochoa, F.; Gomez, E.; Santos, V. Oxygen uptake rate in microbial processes: An overview. Biochem. Eng. J. 2010, 49, 289–307. [Google Scholar] [CrossRef]
  13. Lu, Y.; Yu, J. Gas mass transfer with microbial CO2 fixation and poly(3-hydroxybutyrate) synthesis in a packed bed bioreactor. Biochem. Eng. J. 2017, 122, 13–21. [Google Scholar] [CrossRef]
  14. Van Ede, C.J.; Van Houten, R.; Beenackers, A.A.C.M. Enhancement of gas to mass transfer rates by a dispersed organic phase. Chem. Eng. Sci. 1995, 50, 2911–2922. [Google Scholar] [CrossRef]
  15. Jia, S.; Wang, M.; Kahar, P. Enhancement of yeast fermentation by addition of oxygen vectors in air-lift bioreactor. J. Ferm. Bioeng. 1997, 84, 176–178. [Google Scholar] [CrossRef]
  16. Preusting, H.; Van Houten, R.; Hoefs, A. High cell density cultivation of Pseudomonas oleovorans: Growth and production of poly(3-hydroxyalkanaotes) in two-liquid phase batch and fed-batch systems. Biotech. Bioeng. 1993, 41, 550–556. [Google Scholar] [CrossRef] [PubMed]
  17. Liu, Y.S.; Wu, J.Y. Use of n-hexadecane as an oxygen vector to improve Phaffia rhodozyma growth and carotenoid production in shake-flask cultures. J. Appl. Microbiol. 2006, 101, 1033–1038. [Google Scholar] [CrossRef] [PubMed] [Green Version]
  18. Knabeen, I.; Regestein, L.; Marquering, F. High cell-density processes in batch mode of a genetically engineered Escherichia coli strain with minimized overflow metabolism using a pressurized bioreactor. J. Biotech. 2010, 150, 73–79. [Google Scholar] [CrossRef] [PubMed]
  19. Yu, J.; Dow, A.; Pingali, S. The energy efficiency of carbon dioxide fixation by a hydrogen-oxidizing bacterium. Int. J. Hydrogen Energy 2013, 38, 8683–8690. [Google Scholar] [CrossRef]
  20. Tribe, L.A.; Briens, C.L.; Margaritis, A. Determination of the volumetric mass transfer coefficient (kLa) using the dynamic gas-out gas-in method: Analysis of errors caused by dissolved oxygen probes. Biotechnol. Bioeng. 1995, 46, 388–392. [Google Scholar] [CrossRef] [PubMed]
  21. Ruchti, G.; Dunn, I.J.; Bourne, J.R. Comparison of dynamic oxygen electrode methods for measurement of kLa. Biotechnol. Bioeng. 1981, 23, 277–290. [Google Scholar] [CrossRef]
  22. Tanadchangsaeng, N.; Yu, J. Microbial synthesis of polyhydroxybutyrate from glycerol: Gluconeogenesis, molecular weight and material properties of biopolyester. Biotechnol. Bioeng. 2012, 109, 2808–2818. [Google Scholar] [CrossRef] [PubMed]
  23. Bowien, B.; Kusian, B. Genetics and control of CO(2) assimilation in the chemoautotroph Ralstonia eutropha. Arch. Microbiol. 2002, 178, 85–93. [Google Scholar] [CrossRef] [PubMed]
  24. Berg, I.A. Ecological aspects of the distribution of different autotrophic CO2 fixation pathways. Appl. Environ. Microbiol. 2011, 77, 1925–1936. [Google Scholar] [CrossRef] [PubMed]
  25. Badger, M.R.; Bek, E.J. Multiple Rubisco forms in proteobacteria: Their functional significance in relation to CO2 acqusition by the CBB cycle. J. Exp. Bot. 2008, 59, 1525–1541. [Google Scholar] [CrossRef] [PubMed]
  26. Schlegel, H.; Lafferty, R. Novel energy and carbon sources A. The production of biomass from hydrogen and carbon dioxide. In Advances in Biochemical Engineering; Ghose, T.K., Fiechter, A., Eds.; Springer-Verlag: New York, NY, USA, 1971; pp. 143–168. [Google Scholar]
  27. Zhila, N.; Kalacheva, G.; Volova, T. Fatty acid composition and polyhydroxyalkanoates production by Cupriavidus eutrophus B-10646 cells grown on different carbon sources. Process Biochem. 2015, 50, 69–78. [Google Scholar] [CrossRef]
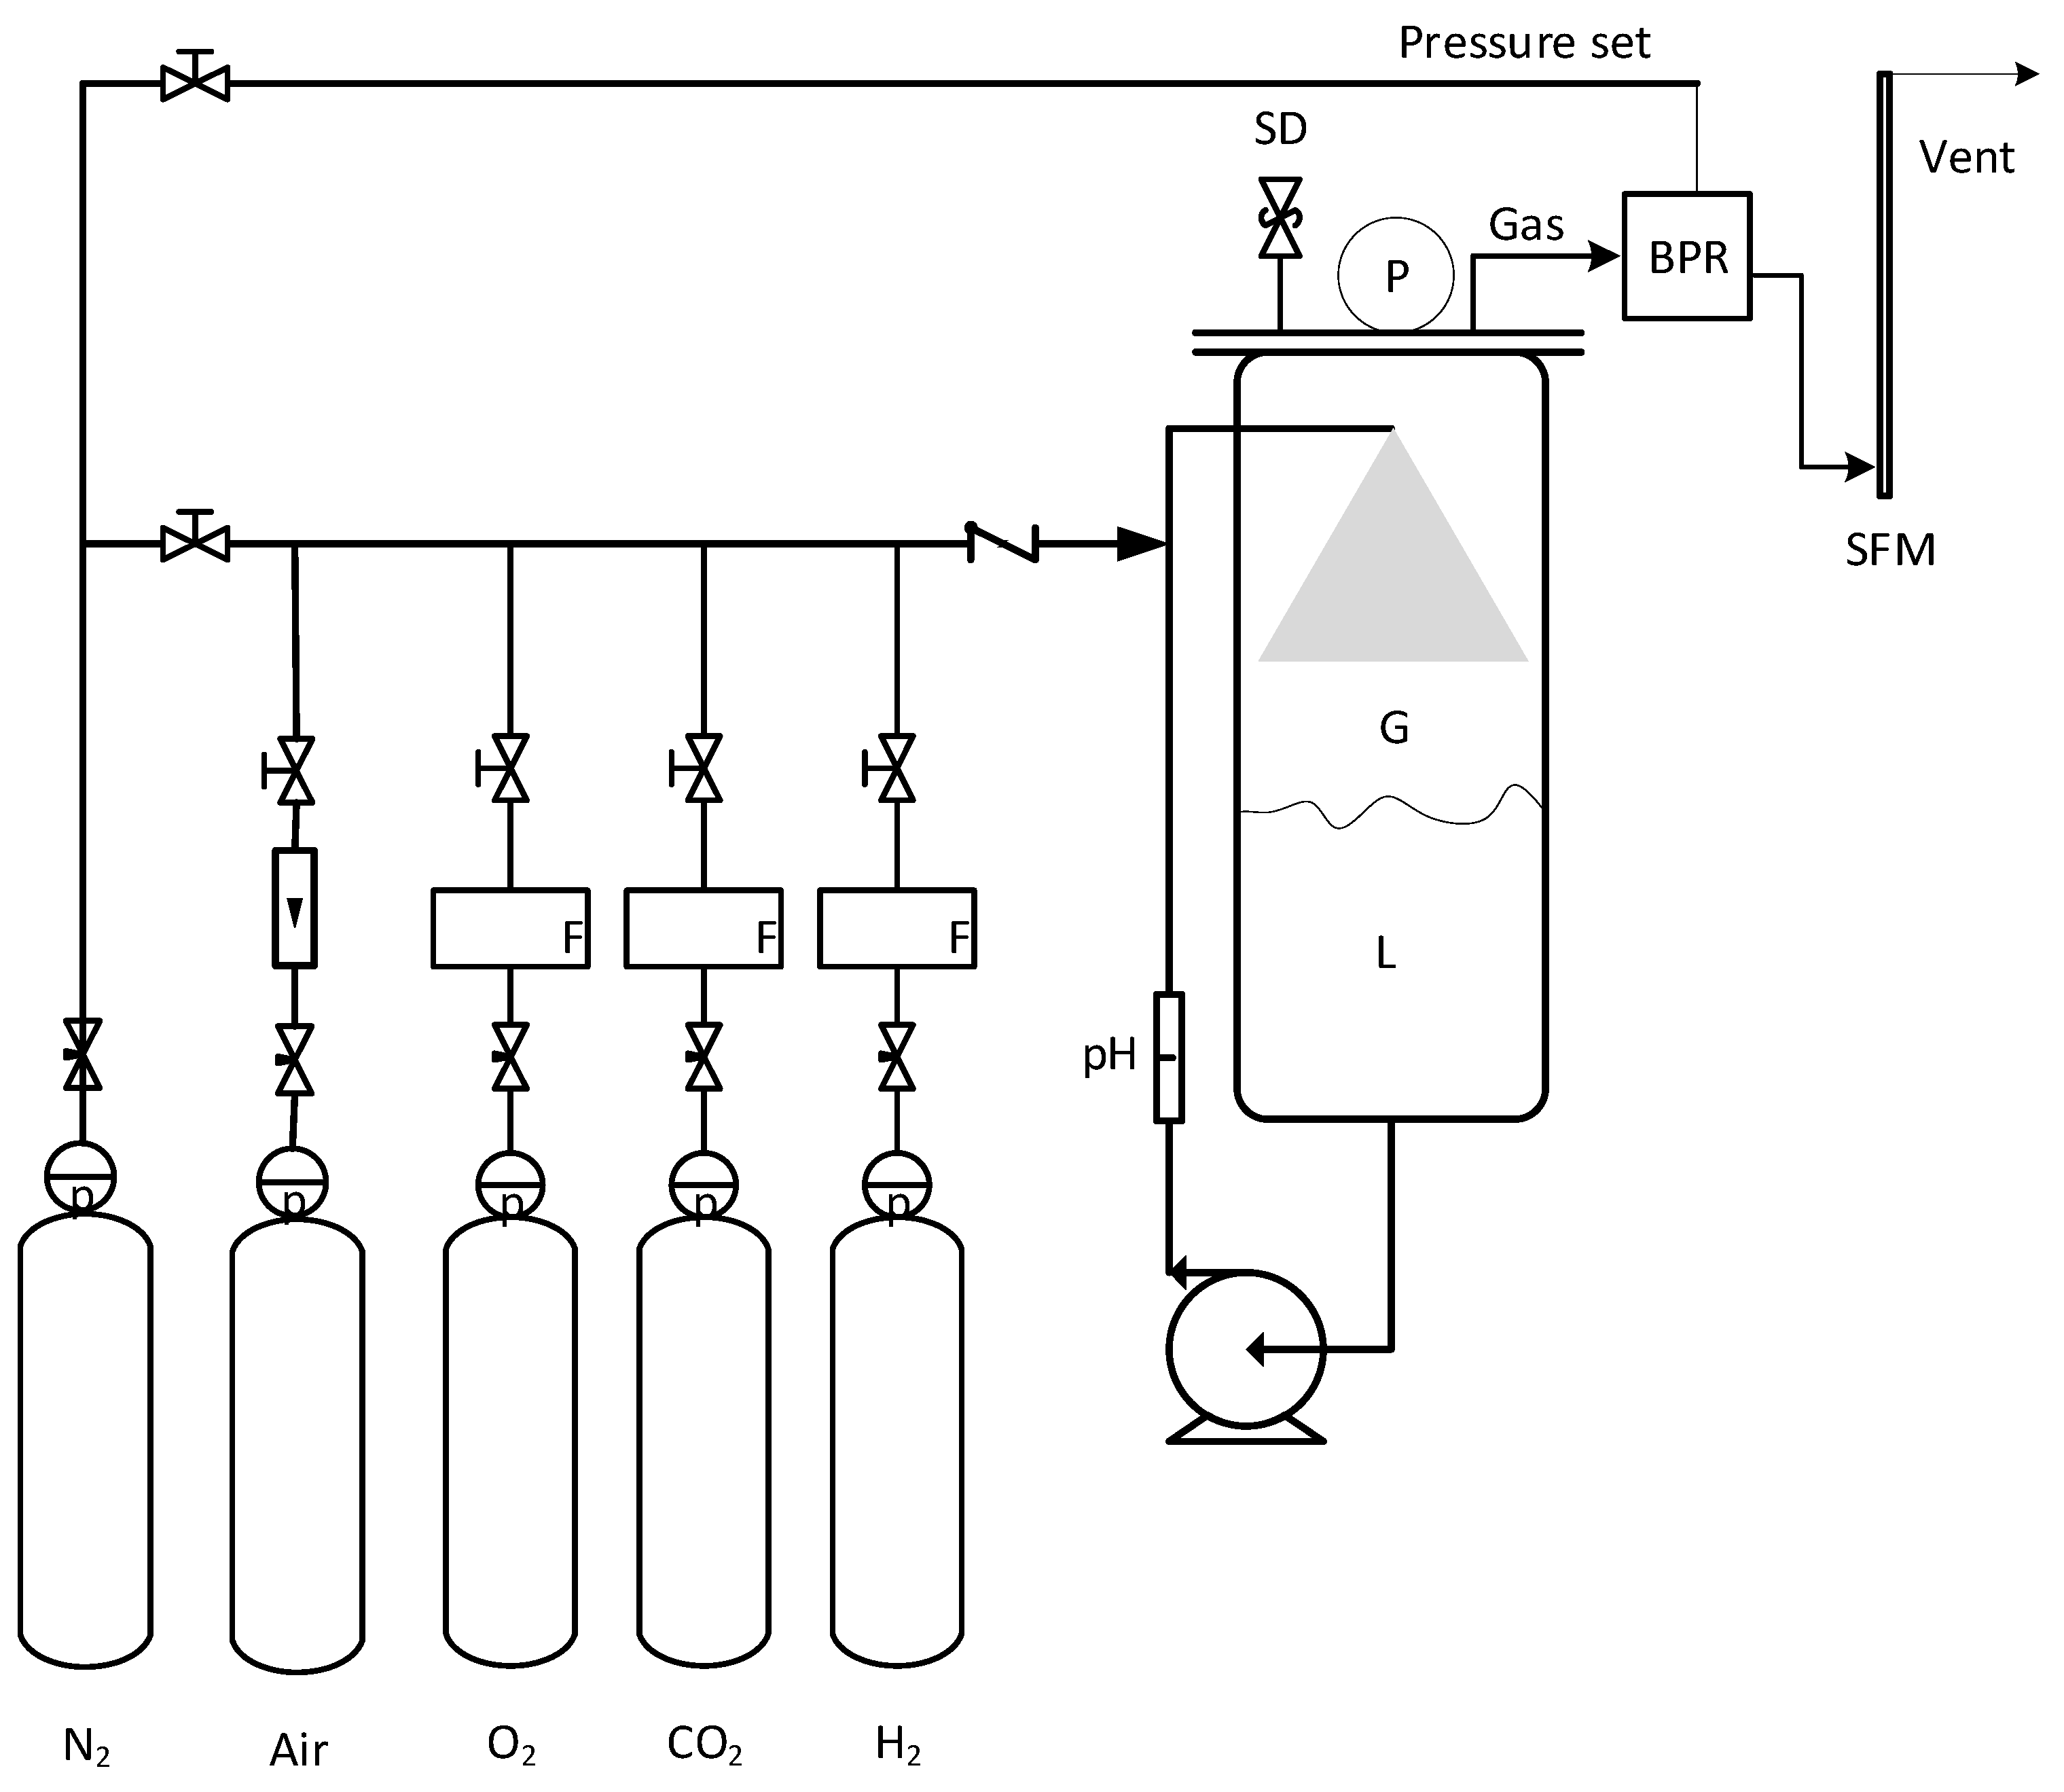
Figure 1. A pressured bioreactor setup consisting of a stainless steel vessel (4L), gas cylinders, gas mass flow meters (F), in-line pH probe (pH), safety disk (SD), pressure gauge (P), and soap film meter (SFM). The liquid (L) was circulated by a magnetic pump through an external loop and sprayed through nozzles into gas phase (G) for gas/liquid contact and liquid mixing. The gas pressure in the bioreactor was controlled by a backpressure regulator (BPR) that in turn was set by nitrogen gas pressure.
Fermentation 04 00063 g001
Figure 2. Measurements and correlations (Equation (2)) of oxygen kLa in a mineral solution containing n-hexadecane (C16H34): 0 vol %, 1 vol %, 2 vol %, and 8 vol %.
Fermentation 04 00063 g002
Figure 3. Chemolithotrophic growth of C. necator with different volume % of n-hexadecane (C16H34). Average ODs of duplicated bottle cultures are presented with the deviation less than 5%. Error bars are not plotted for clearness.
Fermentation 04 00063 g003
Figure 4. (A) Chemolithotrophic growth of C. necator under two gas pressures (1 atm and 4 atm). See Table 2 for the fermentation conditions and concentrations of Fe and Mg. The amounts of Fe and Mg were doubled in one fermentation (4atm_FeMg). (B) Logarithm of cell density ratio (X/X0) versus time under two gas pressures (1 atm and 4 atm). X0 is the initial cell density.
Fermentation 04 00063 g004
Figure 5. Gas uptake rates under different gas pressures (1 atm and 4 atm). See Table 2 for the fermentation conditions and the concentrations of Fe and Mg. The amounts of Fe and Mg were doubled in one fermentation (4 atm_FeMg).
Fermentation 04 00063 g005
Figure 6. Chemolithotrophic growth of C. necator with different initial RCM nitrogen concentrations (0, 0.1, 0.2, 0.4, 0.8, 1.6 g N L−1). Average ODs of duplicated bottle cultures are presented with the deviation less than 5%. Error bars are not plotted for clearness.
Fermentation 04 00063 g006
Figure 7. Chemolithotrophic growth of C. necator with ammonium nitrogen (NH3–N) and residual cell mass nitrogen (N_0.1, N_0.2). Average ODs of duplicated bottle cultures are presented.
Fermentation 04 00063 g007
Table 1. Oxygen kLa in a mineral solution with n-hexadecane.
n-Hexadecane (% Volume)kLa (h−1)R2 (-)kLa Ratio (-)
02540.99401
12670.99271.05
22730.98581.07
81300.97830.51
Table 2. Effect of gas pressure on cell growth rate.
RunP a (atm)FeMg bX0 c (g L−1)Xcr d (g L−1)High RateLow Rate
µ e (h−1)R2 (-)µ e (h1)R2
A110.54.50.0940.9600.0110.975
B410.456.30.120.9760.0100.954
C4211.7None--0.00740.969
a. The absolute gas pressure in bioreactor; b. Concentrations of Fe and Mg: (1) ferric ammonium citrate 0.1 g L1, MgSO4·7H2O 0.5 g L1, and (2) ferric ammonium citrate 0.2 g L1, MgSO4·7H2O 1 g L1; c. The initial cell density or dry cell mass concentration; d. A critical cell density between a high growth stage and a slow growth stage; e. The specific growth rate = the slope of linear correlation of ln (cell density ratio) with time. R2 value is a statistical measure of how close the data are to the regression model.
Table 3. The inlet and outlet gas flow rates and gas compositions at the end of fermentations.
Run aInlet GasOutlet GasUptake Rate (sccm)
Fin b (sccm)H2 (v %)O2 (v %)CO2 (v %)Fout b (sccm)H2 (v %)O2 (v %)CO2 (v %)H2O2CO2
A14060202067.860.315.424.343.117.611.5
B14070201029.383.09.87.273.725.111.9
C14070201029.378.013.09.075.124.211.4
a. See Table 1 for the operation conditions; b. Gas flow rate (cm3 min−1) under standard conditions (273 K, 1 atm) and gas composition in volume % (=mole %).
Table 4. Elemental composition of residual cell mass and PHB of C. necator (ash free, dry base) a.
Residual Cell MasPolyhydroxybutyrate (PHB)
C (wt %)H (wt %)O (wt %)N (wt %)C (wt %)H (wt %)O (wt %)
49.06.930.114.055.86.937.2
a. The ash content of residual cell mass is 8.0 wt % (dry base).