1. Introduction
In spontaneous fermentations conducted at commercial wineries, it is common to find more than one
Saccharomyces cerevisiae strain fermenting the wine must [
1]; however, multiple strains have also been detected even in inoculated fermentations [
2,
3]. It is well documented that different wine strains of
S. cerevisiae affect flavor and aroma properties differently [
1]. Although the sensory influence of co-inoculation between non-
Saccharomyces and a single
S. cerevisiae strain has been widely studied [
4,
5,
6,
7,
8], fewer studies have reported on the co-inoculation of multiple
S. cerevisiae strains [
9,
10,
11,
12,
13]. The commercial active dry yeast (ADY) strains, Lalvin
® Bourgorouge RC212 (RC212) and Lalvin
® ICV-D254 (D254), are frequently used to ferment Pinot Noir and Chardonnay musts, respectively. Together, they have been found to dominate operational fermentations, with an overall relative abundance of >80% in both inoculated (where RC212 was used as the sole inoculum and D254 entered as a contaminant) and spontaneous Pinot Noir fermentations [
14,
15]. Furthermore, D254 was the dominant strain at the end of these fermentations, even when tanks were inoculated with RC212 [
3]. These findings suggest, when observing their dynamics during operationally conducted fermentations, that D254 out-competes RC212. Originally, the strain RC212 was selected by the Burgundy Wine Board (BIVB) to extract and protect the polyphenols of Pinot Noir. In the information supplied by the manufacturer, it is claimed that wines fermented by RC212 have good structure with fruity and spicy characteristics (Lallemand Inc., Montreal, QC, Canada). The strain D254 is commonly used in both red and white wines. Red wines fermented with D254 contribute to high fore-mouth volume, smooth tannins, intense fruits and a slightly spicy finish (Lallemand Inc., Montreal, QC, Canada). Nevertheless, there is a lack of information on the sensorial attributes when these two strains co-exist during fermentation. Given that there are many factors that can affect the interactions of these two strains under operational conditions, it is important to determine how these two strains interact and affect key fermentation-derived chemicals under controlled conditions.
The formation of aroma and flavor compounds is dependent on the nutrient availability, the physicochemical properties of the fermentation, and the yeast strains present, especially
S. cerevisiae strains. Higher alcohols and esters are usually yeast-derived and can greatly contribute to the aroma and flavor profile of the wine [
16]. Many of these flavor compounds are derivatives of amino acids, and it has been shown that amino acid uptake by yeasts is strain-dependent [
11,
17]. Other wine aroma and flavor compounds include pyrazines, terpenes, lactones, sulfur-containing compounds, phenols, organic acids, and aldehydes, which are usually not strain-dependent. The concentration of these other compounds is strongly influenced by varietal, grape ripeness, non-
Saccharomyces organisms, aging, and winemaking practices [
16,
18]. Several studies have concluded that different strains of
S. cerevisiae produce strain-specific metabolites [
19,
20]. For example, higher alcohols and esters can differ with varying dominance of two or more strains [
11,
19,
20]. At low concentrations, higher alcohols contribute to increased aroma complexity, but at high concentrations (>300 mg/L), their presence can be undesirable [
21,
22]. At low concentrations (<100 mg/L), ethyl esters, such as ethyl acetate, often contribute fruity aromas, but at high concentrations they can produce undesirable solvent-like aromas and flavors [
16,
23]. In the present study, we targeted only compounds that are known to be fermentation-derived and are integral to aroma and flavor development.
Knowledge of the competitive interaction between different
S. cerevisiae strains and its effect on aroma and flavor compounds will guide winemakers in choosing commercial yeasts, because final wine composition may be enhanced with the use of the most suitable combination of yeast strains [
11]. In addition, we are not aware of any competition or metabolomic studies that have conducted co-fermentations with RC212 and D254 strains in grape must. For our study, competition between two strains, which ultimately results in competitive exclusion, is defined at the end of a co-inoculated fermentation, where one strain has a greater relative abundance than it did when it was inoculated.
The aim of this study was to generate and test hypotheses that were based on observations from operational settings and from the literature. We tested, under controlled conditions, the hypotheses that: (1) D254 will out-compete RC212 when inoculated as a 1:1 or as a 4:1 RC212:D254 ratio; (2) D254 will have a greater impact than RC212 on key fermentation-derived chemicals when the inoculation abundances of the two strains are equal; and (3) D254 will have a greater impact than RC212 on key fermentation-derived chemicals when the inoculation is administered in a 4:1 RC212:D254 ratio. Our results indicate that no competitive exclusion occurred in the co-inoculated treatments, but rather the inoculated ratios remained constant throughout fermentation. Furthermore, we found that the chemical profile of the 1:1 RC212:D254 treatment closely resembled the chemical profile of the pure D254 fermentations, but the 4:1 RC212:D254 treatment more closely resembled the chemical profile of the pure RC212 fermentations. We conclude that although D254 does not appear to competitively exclude RC212 under controlled conditions, it has a relatively larger impact on the sensory profile of the resulting wines than RC212.
2. Materials and Methods
2.1. Experimental Design
The experiment consisted of four fermentation treatments: a pure culture control of RC212; a pure culture control of D254; a 1:1 co-inoculation ratio of RC212:D254; and a 4:1 co-inoculation ratio of RC212:D254. Each treatment was replicated using three separate fermentation flasks for a total of 12 flasks, with each flask containing 100 mL Pinot Noir juice. Each flask was sampled for strain abundance at the start (180 g/L sugar, 0 h), early (83–102 g/L sugar, 24 h), mid (64–73 g/L, 32 h), and end stages (<2 g/L sugar, 97 h) of the 100 h fermentation. Samples for chemical analysis were taken only at the end stage of fermentation. The co-inoculation treatments represented one situation where the two strains were inoculated in equal abundance (1:1 ratio) and another where RC212 was inoculated at a higher proportion than D254 (4:1 ratio); these two co-inoculation treatments, along with their pure-culture controls, allowed us to adequately test all of our hypotheses.
2.2. Juice Preperation
Pinot Noir juice was obtained from WineExpert™ (Port Coquitlam, BC, Canada). The juice was prepared by centrifugation for 45 min at 3500×
g and was subsequently filtered through a series of filters, which had a decreasing pore size: 2.7 μm glass fiber filter (GF), 1 μm GF, 0.45 μm mixed cellulose ester membrane filter (MCE), and 0.22 μm MCE and polyvinylidene difluoride filter (PVDF). The filtered juice was adjusted to 180 g/L sugar with sterile Milli-Q water and stored at −20 °C until it was needed for the experiment. We selected this concentration because it was within the typical range (180–220 g/L) at which grape juice fermentation commences [
24]. The filtered juice, following the adjustment to 180 g/L sugar, had a pH of 3.8 and its sterility was confirmed by plating 0.1 mL onto yeast extract peptone dextrose (YEPD) media and observing an absence of colonies after 4 days of incubation at 28 °C. The adjusted filtered juice (>2 L) was used as the source to make the RC212 and D254 inoculated solutions, described in the section below.
2.3. Inoculation and Fermentations
For both strains, (~10 mg) ADY inoculum was rehydrated in 25 mL liquid YEPD media and was shaken for eight hours (120 rpm) at 28 °C. Yeast abundance (cells/mL) in the rehydrated suspension was counted using a hemocytometer. Rehydrated yeasts were added in a quantity of 1 × 10⁶ cells/mL to 100 mL diluted Pinot Noir grape juice (1:1 juice:sterile Milli-Q H2O) for each strain. Once yeast cell count was determined in each solution, the RC212 and D254 solutions were added separately to 1.2 L and 700 mL of the filtered Pinot Noir juice, respectively, to produce a concentration of 5 × 10⁶ cells/mL. The resulting master mixes of each strain were combined in the appropriate ratios to obtain 300 mL of each co-inoculation treatment. Subsequently, for each co-inoculation treatment, the resulting solution was divided into three independent flasks (each containing 100 mL juice). The pure-culture controls were treated the same way; however, the RC212 and D254 solutions were not mixed. For all treatments, the final inoculation concentration was 5 × 10⁶ cells/mL.
Fermentations (100 mL per flask) were conducted in 250 mL fermentation flasks, which contained sampling ports and air-locks. The flasks were shaken (120 rpm) at 28 °C until the end of the fermentation. To monitor the progression of fermentation and to identify strains, 0.5 mL samples were collected aseptically at the start, early, mid, and end stages of fermentation. At the end of fermentation, all wines contained <2 g/L residual sugar, as indicated with a d-Glucose/d-Fructose sugar assay kit (Megazyme, Bray, Ireland). The wine was clarified by centrifugation (1200× g; 2 min) and filtered (0.45 µm) at the end of fermentation. At the end stage, 40 mL were transferred to glass vials and stored at −80 °C until chemical analysis was performed.
2.4. Yeast Strain Identification
Wine must samples from each stage were plated on YEPD agar and incubated at 28 °C for 48 h. Twenty colonies from each plate (960 colonies total) were randomly chosen for DNA analysis. Extraction and amplification of the DNA followed the methods of Lange
et al. [
15], except that amplification of the isolates was performed with primer sets for the microsatellite loci C11 and SCYOR267c [
25]. These two loci were chosen because RC212 is heterozygous and D254 is homozygous at both of these loci, resulting in two fragments for RC212 and one fragment for D254 [
14]. Additionally, the size of the two loci was separated by 78 base pairs, which allowed for simultaneous analysis.
2.5. Chemical Analysis
A total of 11 fermentation-derived compounds were selected based on reports of their importance to Pinot Noir, their importance to flavor and aroma, and whether they were yeast strain-dependent. Four of these compounds (ethyl butyrate, isoamyl acetate, 1-hexanol, and phenethyl alcohol) were quantified with gas chromatography mass spectrometry (GC-MS) at UBC Okanagan. A Varian/Agilent CP-3800 GC equipped with a VF-5MS 30 m × 0.25 mm FactorFour capillary column and with a CP-8400 auto sampler was used for a splitless analysis. The injector was ramped from 40 to 100 °C at 10 °C/min. The oven was ramped from 40 to 240 °C at 10 °C/min and a solvent delay of 2.5 min was used. Samples were extracted with liquid-liquid extraction using a 1:1 ratio of the solvents pentane and diethyl ether. A combination of 5 mL sample, 5 μL of 1.615 mg/L methyl isobutyl carbinol (MIBC), and 5 mL solvent were shaken vigorously in large test tubes. The solution settled for 1 h and the extract was transferred from the top layer to GC–MS vials. The other seven compounds (ethyl acetate, acetaldehyde, methanol, 1-propanol, isobutanol, amyl alcohol, and isoamyl alcohol) were quantified by ETS laboratories (St. Helena, CA, USA), using a gas chromatography flame ionization detector (GC-FID), as per the methods of the American Association for Laboratory Accreditation.
2.6. Data Analysis
Strain ratios at the start of the fermentation were compared with expected ratios and with pooled data from subsequent stages by performing a Chi-square goodness of fit test. Relative abundance of strains was compared between treatments and controls by performing a one-way analysis of variance (ANOVA) on data that had fermentation stages pooled, as well as a one-way ANOVA on the end-stage of each treatment. Furthermore, the relative abundance of RC212 in the co-inoculated fermentations was compared between fermentation stages of the same treatment by performing one-way ANOVAs. When significance was indicated, a Tukey–Kramer honest significant difference (HSD)
post-hoc test was performed. The relationship between the abundance of RC212 and the concentrations of fermentation-derived compounds was determined using regression analysis. Hierarchical cluster analysis, based on Ward’s method with euclidean distance, was used to group treatments [
9,
26]; these results were visualized using a Principal Component Analysis (PCA). The statistical analyses mentioned above were conducted using JMP
® 11.0.1. The hierarchical cluster analysis and PCA employed an R 2.0 platform add-in. The concentrations of fermentation-derived chemical compounds were compared between inoculation treatments by performing one-way ANOVAs. When significant differences were detected, Tukey–Kramer HSD
post-hoc tests were performed to determine differences between treatments. Statistical analysis of chemical compounds was performed using the Rcmdr package in RStudio version 3.1.1. All results were considered significant at
p < 0.05.
3. Results
The starting proportions of RC212 to D254, sampled immediately after co-inoculation, were not different from their expected ratios (1:1 treatment: X
2 = 0.563,
p = 0.453; 4:1 treatment: X
2 = 0.039,
p = 0.844) (
Table 1). This indicated that our inoculation treatments were accurate, which was important in order to make conclusions about the competition between these two strains and about the specificity of chemical compounds to one strain or the other. The co-fermentation treatments differed significantly in their proportion of yeast strains from both control treatments and from each other, when all fermentation stages were pooled (F = 436.1,
p < 0.0001). Furthermore, the yeast ratios at the end stage of fermentation differed significantly between the two co-fermentation treatments (F = 171.4,
p < 0.0001), but the yeast proportions of each co-inoculation treatment were constant throughout fermentation (1:1 treatment: F = 0.50,
p = 0.70; 4:1 treatment: F = 1.6,
p = 0.27). These results confirm that the proportions of RC212 and D254 differed between all co-inoculation and control treatments at both the beginning and throughout fermentation, and that the inoculated yeast ratios remained constant over the course of fermentation for both co-inoculated treatments.
There was a positive linear relationship between the abundance of RC212 and the quantity of four compounds present during fermentations. These compounds were acetaldehyde, 1-propanol, isobutanol, and isoamyl alcohol (
Table 2). Alternatively, there was a negative linear relationship between the abundance of RC212 and the quantity of ethyl acetate, amyl alcohol, and isoamyl acetate. We considered that a positive relationship indicated specificity towards RC212 and a negative relationship indicated specificity towards D254. The compounds, ethyl butyrate and phenethyl alcohol, while detected, were not significantly correlated with the relative abundance of RC212 (
Table 2). The compounds 1-hexanol and methanol were not detected in any treatment (
Table 3).
In our study, RC212 produced significantly higher levels of isobutanol than did D254. Production of this compound by RC212 was also evident in the two co-inoculated treatments, which both contained higher levels of this compound than the pure D254 treatment, but lower levels than the pure RC212 treatment (
Table 3). In the pure RC212 cultures, the concentration of this compound approached the sensory threshold of 300 mg/L [
18]. For all treatments, isoamyl alcohol was detected at concentrations approaching its bitter sensory threshold of 300 mg/L, although its production was significantly higher in the pure RC212 treatment than the pure D254 treatment (
Table 3). Acetaldehyde and 1-propanol concentrations were well below their aroma thresholds of 100–125 mg/L for all treatments [
27,
28] (
Table 3). Ethyl acetate was detected in all treatments at levels above its detection threshold but well below its solvent-like threshold of 100 mg/L, and above the sensory threshold for fruitiness [
23]. Unlike previous studies [
10,
29,
30], no strain specificity in the production of ethyl butyrate or phenethyl alcohol was detected (
Table 3).
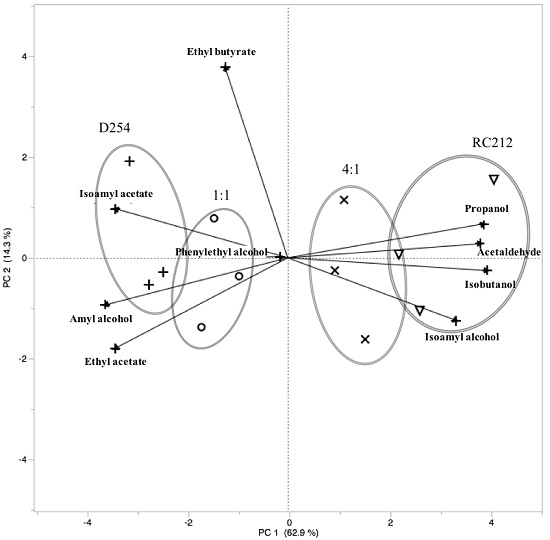
A Principal Components Analysis (PCA) showed the chemical profile of the 4:1 RC212:D254 co-inoculation treatment clustering with the chemical profile of the pure RC212 fermentations, while the profiles of the 1:1 ratio co-inoculation treatment clustered with the D254 pure culture (
Figure 1). The pure RC212 culture fermentations, as well as the 4:1 RC212:D254 co-inoculated fermentations, were correlated with the presence of 1-propanol, acetaldehyde, isobutanol, and isoamyl alcohol. The D254 pure culture fermentations, as well as the 1:1 RC212:D254 co-inoculated fermentations, were correlated with the presence of isoamyl acetate, amyl alcohol, and ethyl acetate.
4. Discussion
The finding that the proportion of RC212 to D254 remained constant throughout fermentation in both co-inoculation treatments suggests that there was a lack of competitive exclusion under controlled conditions between RC212 and D254, which does not support our first hypothesis that D254 would out-compete RC212 even when RC212 was inoculated in a 4:1 RC212:D254 ratio. Our original hypothesis was based on winery-based studies [
3,
14], where physical, chemical, and microbial conditions likely differ from in-lab fermentations. We are not aware of any other in-lab studies that have followed the interaction of these two strains during co-fermentation. Nevertheless, one study has followed mixtures of different
S. cerevisiae strains throughout fermentation and showed both strain exclusion as well as situations where inoculated ratios remained the same throughout fermentation [
12]. A second co-inoculation study, using three different commercial strains, observed one strain (Anchor
® Vin7) competively excluding Anchor
® Vin13 and Lalvin
® QA23 [
13].
Production of isobutanol was highest in the pure RC212 treatment and lowest in the pure D254 treatment. Thus, the presence of D254 in the co-inoculated treatments appeared to have an inhibiting effect on the production of isobutanol by RC212, as evidenced by the decrease in isobutanol concentration with increasing relative abundance of D254 in the co-fermentations. Although we are not aware of any study that has worked with these two strains in grape must, one other study has shown levels of both n-butanol and isobutanol to differ between some
S. cerevisiae pure cultures and their mixtures, indicating a significant production trend due to strain interactions [
10]. In our RC212 pure cultures, the concentration of isobutanol approached the sensory threshold of 300 mg/L [
18], where it could produce bitter flavors; however, solvent-like aromas and flavors probably would not be produced until it neared concentrations of 400 mg/L [
18,
24]. Although isoamyl alcohol showed the same trend as isobutanol, with respect to pure cultures, the co-inoculations did not result in a significant trend. We are not aware of any studies that have observed the effects of
S. cerevisiae strain interactions on isoamyl alcohol. As with isobutanol, isoamyl alcohol could produce bitter flavors at the concentrations we found, but not solvent-like aromas and flavors. Both isobutanol and isoamyl alcohol are derivatives of amino acids, so the high concentrations of these compounds were likely, in part, a reflection of the amino acid content in the initial must [
9,
17]. We did not find a significant interaction trend for isoamyl acetate in both co-inoculation treatments. Our results were similar to another study where ethyl ester concentrations of strain mixtures were similar or slightly higher than those of pure cultures [
10]. Supporting our results, this previously conducted study found ethyl esters, including ethyl acetate, above their sensory thresholds for fruity aromas, but not for solvent-like characteristics [
10]. Acetaldehyde and 1-propanol concentrations were well below their aroma thresholds of 100–125 mg/L for all treatments, and thus they did not likely contribute directly to the sensorial characteristics of these wines. Many of the compounds we evaluated were below their detection limits, but it is important to note that our study reports on only a small portion of chemicals that are important in contributing to the sensory profile of wine. A full metabolomics study may reveal other chemicals that are important in the interaction of these two strains.
The results of PCA cluster analysis revealed the RC212 pure culture and the 4:1 co-inoculation treatment shared similar chemical profiles, separate from the D254 pure culture and the 1:1 co-inoculation treatment, which also shared similar chemical profiles. This suggests that when the two strains were equally abundant, D254 had a greater effect on the chemical profile than did RC212. This also suggests that the presence of D254 reduced the chemical profile that was contributed by RC212, as evidenced by the reduction in production of a number of chemicals positively correlated with RC212, including acetaldehyde, isobutanol, and 1-propanol. These results support our second hypothesis that D254 would have a greater impact on the chemical profile than RC212 when the cell numbers of the two strains were equal. Nevertheless, our results did not support our third hypothesis that D254 would have a greater impact than RC212 on key fermentation-derived chemicals when the inoculation was administered in a 4:1 RC212:D254 ratio. In our study, both co-inoculated abundance ratios remained constant throughout the fermentations, and when a 4:1 RC212:D254 ratio was in place, the chemical profile resembled the RC212 pure culture more than the D254 pure culture. Nevertheless, the chemical profiles of the co-inoculations shared some of the characteristics of both pure culture fermentations, which supports the results of other studies showing that chemical profiles differ between co-inoculation and pure culture fermentations [
9,
10,
11,
12]. This indicates that the interaction between two or more strains creates a new chemical profile not seen in the pure cultures. The interactions of multiple strains during fermentation can have synergistic or antagonistic effects on the final sensory attributes of wine [
9,
12,
31], which makes strain selection an important consideration for commercial winemakers. Our results, along with those of Saberi
et al. [
10], suggest that by increasing the number of different strains in a fermentation, a more complex wine, in terms of chemical profile, can be achieved and managed due to multiple interactions between different strains of yeasts. Further research is necessary to determine whether increasing the number of strains in fermentation has an additive effect on the complexity of the wine’s chemical profile.


