Article

The Feasibility of Integrating an Autotrophic Acetobacterium woodii Process for CO2-Neutral Yeast Oil Production


Chair of Biochemical Engineering, School of Engineering and Design, Technical University of Munich, 85748 Garching, Germany
*
Author to whom correspondence should be addressed.
Fermentation 2026, 12(5), 229; https://doi.org/10.3390/fermentation12050229
Submission received: 28 February 2026 / Revised: 28 April 2026 / Accepted: 29 April 2026 / Published: 6 May 2026
(This article belongs to the Section Fermentation Process Design)

Abstract

The efficient production of microbial oils from agricultural residues and acetic acid has recently been shown with Cutaneotrichosporon oleaginosus. However, around 50% of the carbon is released as CO2 during aerobic yeast oil production. Anaerobic fermentation of CO2 and H2 with A. woodii enables the carbon-efficient production of acetate. The semi-continuous autotrophic production of acetate with A. woodii was studied in a stirred-tank bioreactor with continuous gassing, where the time of the repeated batch processes was adjusted to the batch process time for microbial oil production (6–7 days). Eight repeated batch processes with 80% medium exchange were performed with A. woodii within 48 days. After adaptation of the A. woodii cells, 48.29 ± 0.35 g L−1 acetate was achieved in the last four repeated batch processes with 70% H2 and 30% CO2 gassing. Acetic acid was extracted from the clarified and acidified fermentation broth with ethyl acetate, yielding 94.3% (w/w). Based on our process performance data with A. woodii and previously published data with C. oleaginosus, it was shown that, for providing enough acetic acid for microbial oil production, a 3.08 times higher bioreactor capacity is needed for the gas fermentation compared to the aerobic yeast fermentation. The lack of CO2 produced by C. oleaginosus may be compensated for by increasing the sugar supply (hydrolysate) during yeast oil production, or by the additional use of other biogenic CO2 sources. Thus, CO2-neutral production of microbial oils from sugars or hydrolysates of agricultural residues is possible by reusing the CO2 produced in the aerobic yeast oil production for the autotrophic production of acetic acid, which is fully recycled as an additional carbon source for yeast oil production.

1. Introduction

The valorization of CO2 as a renewable carbon feedstock represents a cornerstone in the transition towards climate-neutral bioprocesses. Although CO2 emissions from industrial biotechnology are classified as unavoidable byproducts, they constitute a concentrated, readily exploitable carbon source in the off-gas stream. Particularly in aerobic microbial production, respiratory metabolism generates substantial CO2 fluxes [1,2]. Recoupling this CO2 with the synthesis of value-added chemicals offers a direct trajectory to enhance the carbon economy and mitigate the net greenhouse gas footprint of biotechnological value chains. Techniques for the capture, concentration, and purification of CO2 from off-gas streams from many industrial processes, such as, for example, in the chemical industry or from combustion processes (power plants or waste incineration), are readily available and well investigated, e.g., chemical absorption with amines or membrane separation [3,4]. They can easily be transferred to CO2-scrubbing from fermentation processes. So-called biogenic CO2 from anaerobic fermentations, e.g., ethanol production plants, is widely used in the food industry for the production of beverages and sparkling water [5].
Gas fermentation using acetogenic bacteria provides a biologically efficient route for CO2 conversion. Acetogens utilize the Wood–Ljungdahl pathway (WLP) for the fixation of CO2 as acetyl-CoA, which is subsequently converted into acetate as the primary metabolic product [6]. This pathway enables near-stoichiometric carbon fixation with minimal byproduct formation and operates close to thermodynamic limits. As a result, acetogenic gas fermentation has gained increasing attention as a platform technology for carbon capture and utilization [7,8]. Acetogens, such as Clostridium autoethanogenum, Moorella thermoacetica, and Clostridium carboxidivorans, are extensively studied and examined in detail, mostly for their ability to use syngas (CO2, H2, and CO) [9,10].
Acetobacterium woodii is one of the most comprehensively studied and technically robust homoacetogens, which was originally isolated from anaerobic sediment [11]. It is capable of converting CO2 and H2 into acetate with high selectivity and stable performance [12]. Its strict homoacetogenic metabolism, metabolic robustness, and tolerance towards fluctuating gas compositions make A. woodii a particularly attractive microorganism for CO2-based acetate production [13]. In addition, its physiology and energy conservation mechanisms have been investigated in detail, providing a solid foundation for process development and scale-up [14,15]. Furthermore, it has been shown that A. woodii is capable of producing and withstanding high acetate concentrations of up to 60 g L−1 in batch processes with continuous gassing while maintaining metabolic activity [16].
As acetate is a bulk chemical with low added value, achieving high volumetric productivity (space-time yield) with high product concentrations is necessary. As continuous syngas fermentation processes are particularly suitable for this purpose, many approaches have already been studied. The continuous operation of a gassed stirred tank bioreactor utilizing a submerged microfiltration membrane for full cell retention enabled a maximum acetate concentration of approximately 25 g L−1 with A. woodii, but at the same time requires a subtly balanced process operation towards the feed and filtration regime [17,18]. However, product concentration was reduced compared to batch processes (25 g L−1 instead of 60 g L−1). Unfortunately, during continuous operation of stirred-tank bioreactors, cells are exposed to high product concentrations most of the time. To avoid product inhibition during continuous operation, repeated-batch processes offer an alternative, as the acetogens are exposed solely to high product concentrations at the end of each batch before harvest.
Repeated-batch processes are posing a cost-effective alternative with a simple operation regime [19]. Harvest is incomplete for the direct inoculation of the next batch, which starts after refilling the bioreactor with fresh fermentation medium. A seed train is not necessary as long as the repeated-batch process is stable. In addition, self-optimization may occur by adapting the production strain to higher product concentrations and higher growth rates driven by selection pressure from consecutive batch processes (adaptive evolution). Repeated-batch processes are also frequently used on a laboratory scale to improve growth-related properties of production strains, called adaptive laboratory evolution (ALE) [20,21].
Only one study has been reported so far on repeated autotrophic batch processes with A. woodii [22]. However, acetate concentrations before each medium exchange were low (<1.0 g L−1) and decreased after each of the two medium exchanges (total process time of 78 h).
Acetate produced by acetogenic gas fermentation may also serve as a biogenic carbon source in industrial biotechnology. One example is the production of microbial oils with oleaginous yeasts such as Cutaneotrichosporon oleaginosus [23,24,25]. Different yeast species have been investigated, highlighting the future prospects for the implementation of biorefinery concepts into the sustainable utilization of waste streams, such as lignocellulosic residuals, and the production of plant oil and fat substitutes used in the food industry [26,27]. Furthermore, metabolic engineering strategies have been implemented to enhance the lipid accumulation capacity of oleaginous yeasts and their usability in food-related applications [28].
It has been demonstrated that the conversion of a synthetic lignocellulosic hydrolysate into yeast oil with Cutaneotrichosporon oleaginosus is possible without cost-intensive nitrogen or phosphorus limitation by additional pH-controlled feeding of acetic acid [23,25]. This finding is of great importance if microbial oils are produced from hydrolyzed lignocellulosic residues, e.g., wheat straw, corn stover, extracted sugar beet press pulp, or others. As plant materials, hydrolyzed agricultural residues contain nitrogen and phosphorus compounds in varying proportions, depending on plant species, agricultural cultivation (fertilizer use and climate), and their treatment to release the lignocellulosic sugars [29]. Without additional pretreatment, e.g., repeated phosphate precipitation [30], hydrolyzed agricultural residues cannot be used for the production of microbial oils in a nutrient-limited production process.
Very recently, it was shown that more than 50% of the carbon fed as synthetic straw hydrolysate and acetic acid during the microbial oil production with C. oleaginosus was released as CO2 [25], clearly demonstrating the benefits of reusing CO2, e.g., for acetate production, to reduce the loss of carbon in biotechnological production processes. Combining both anaerobic acetate production by A. woodii from H2 and biogenic CO2, and aerobic yeast oil production by C. oleaginosus from biogenic acetate and lignocellulosic hydrolysate in an integrated process, is a promising approach for producing long-chain hydrocarbons with improved carbon use (Figure 1).
As a first proof of concept, this study investigates repeated autotrophic batch fermentations with A. woodii in a controlled 1 L stirred tank bioreactor with continuous gassing with H2 and CO2. Repeated-batch process times are adjusted to the typical batch process times for yeast oil production with C. oleaginosus of 6–7 days [25]. The primary objectives were to evaluate process stability, acetate productivity, and robustness of A. woodii in the repeated-batch process. Finally, the possibilities of integrating gas fermentation and microbial oil production, e.g., relative reactor volumes, were estimated based on total CO2 consumption and acetate production determined in this study, and on recently published microbial oil production data [25].

2. Materials and Methods

2.1. Microorganism and Cultivation Media

Acetobacterium woodii (DSM 1030) was obtained from the German Collection of Microorganisms and Cell Cultures (DSMZ) (Braunschweig, Germany) as a living culture. To maintain long-term strain stability, the living culture was transferred into anaerobic serum bottles with 100 mL of a complex medium as described before [31], grown heterotrophically with fructose at 30 °C in a shaking incubator (WIS-20, Witeg Labortechnik GmbH, Wertheim, Germany) at 110 rpm until the beginning of the exponential growth phase, mixed with 10% (v/v) of dimethyl sulfoxide, and subsequently stored at −80 °C as cryostocks, each with a volume of 5 mL.
For the preparation of anaerobic media in serum bottles, all media components except the vitamins and trace elements were dissolved in deionized water, and pH 7.0 was adjusted with 6 M KOH (medium composition, see Table S1 in the Supplementary Material). Afterwards, the medium was degassed by boiling for 20 min using a heating mantle (WiseTherm WHM 230V, Witeg Labortechnik GmbH, Wertheim, Germany), followed by cooling on ice for 20 min with simultaneous gassing with N2 to strip any traces of O2 out of the liquid phase. Afterwards, the medium was anaerobically transferred to serum bottles which were sealed with gas-tight butyl plugs, autoclaved at 121 °C for 20 min, and stored at room temperature. The vitamin and trace element solutions were added just before inoculation using a syringe equipped with a sterile filter (0.2 µm) through the gas-tight butyl plugs. All chemicals were obtained in analysis quality by Carl Roth GmbH & Co. KG (Karlsruhe, Germany) and Merck KGaA (Darmstadt, Germany).
The same medium was used for the two-step preculture preparations: 5 mL of the cryo-stock was suspended in 100 mL medium in anaerobic serum bottles and incubated at 30 °C and 110 rpm for 3 days. 5 mL of the incubated cells was transferred into serum bottles with 100 mL of fresh medium and incubated at 30 °C and 110 rpm for 24 h to obtain exponentially growing cells.
For the preparation of the autotrophic reactor medium, no fructose was added, and the concentrations of K2HPO4 and KH2PO4 were reduced to 0.45 g L−1 and 0.33 g L−1, respectively.

2.2. Repeated-Batch Operation of the Stirred-Tank Bioreactor

The repeated-batch processes were carried out in an autoclavable stirred-tank reactor (STR) with a total volume of 2 L (Labfors 2, Infors HT, Bottmingen, Switzerland) in a walk-in fume hood equipped with H2-sensors. The reactor’s working volume was set to 1 L. All process variables were controlled by the reactor’s control software (Iris 6.0, Infors HT, Bottmingen, Switzerland). The stirrer speed was set to 1200 rpm, corresponding to a power input of 11.9 W L−1 [17]. At this stirrer speed, the H2 transfer rate is much higher than the maximum measured H2 consumption rate in autotrophic batch processes with A. woodii, indicating no H2 limitation, as it was observed at lower power inputs. The stirrer axis was equipped with two 6-bladed Rushton turbines, spaced approximately 6 cm apart. The gas flow rate was set to 5 L h−1, which corresponds to a gassing rate of 0.083 vvm. The gas mixture consisted of H2 and CO2 (70:30), controlled by a gas-mixing unit (WMR, Westphal Mess- und Regelungstechnik, Ottobrunn, Germany). The STR was equipped with autoclavable probes: one for online pH measurement (405-DPAS-SC-K8S/120, Mettler Toledo GmbH, Gießen, Germany) and the other for online redox potential measurement (Pt4805-DPAS-SC-K8S/120, Mettler Toledo GmbH, Germany). An amount of 6 M KOH or 2 M H2SO4 was used for the automated control of pH 7.0 in the fermentation broth. To suppress foam formation, 150 µL L−1 of sterile polypropylene glycol (PPG400, Carl Roth GmbH, Karlsruhe, Germany) was added at the beginning of each (repeated) batch process. Afterwards, polypropylene glycol was added manually any time foam formation was observed, with a maximum of up to 300 µL L−1 for each (repeated) batch process. For sterilization, the reactor was filled with the autotrophic production medium, heated to 121 °C for 20 min, and cooled down to 30 °C. The trace element and vitamin solution was sterilized by microfiltration (0.2 µm) and was added aseptically via septum after heat sterilization of the bioreactor. Afterwards, the sterile STR was gassed with H2/CO2 for at least 12 h to ensure full anaerobic conditions before inoculation of the first batch process with A. woodii cells.
For the initial inoculation, the cells grown with fructose during precultivation in serum bottles were washed twice: first, the second preculture was anaerobically transferred into 50 mL centrifugation tubes (CELLSTAR, Greiner Bio-One GmbH, Frickenhausen, Germany) and subsequently centrifuged at 2500 rpm for 20 min (Rotixa 50 RS, Andreas Hettich GmbH, Tuttlingen, Germany). The supernatant was discarded, and the cell pellets were suspended in 10 mL of anaerobic phosphate-buffered saline (8.0 g L−1 NaCl, 0.2 g L−1 KCl, 1.44 g L−1 Na2HPO4, 0.24 g L−1 KH2PO4). The cell suspensions were subsequently centrifuged at 2500 rpm for 20 min, and the supernatant was also discarded. Afterwards, the cell pellets were suspended in 10 mL of anaerobic phosphate-buffered saline and transferred to a single-use syringe, which was used to inoculate the STR via cannulas through a septum on the lid, achieving an initial biomass concentration of 0.15 g L−1 CDW.
Each of the repeated-batch processes was harvested after the redox potential in the STR was identified as increasing, indicating a reduction in the metabolic activity of the A. woodii cells. First, stirring and pH control were interrupted manually. Afterwards, 800 mL of culture broth was pumped from the STR using a peristaltic pump (MSC-WM5, Chemap AG, Zürich, Switzerland) into a sterile 1 L harvest bottle via a dip tube attached to the reactor lid, ensuring a residual broth volume of 200 mL. The harvest bottle (Rotilabo SIMAX 1000 mL, Carl Roth GmbH, Karlsruhe, Germany) was connected via sterile filter to the fume hood for pressure equalization. The continuous gassing with CO2/H2 was not interrupted to ensure a fully anaerobic gas phase in the STR. Immediately afterwards, 800 mL of an autoclaved anaerobic medium without vitamins and trace elements was pumped into the STR using a peristaltic pump (MSC-WM5, Chemap AG, Switzerland) after connecting the gas-tight tubing (Marprene process tubing, Watson-Marlow GmbH, Rommerskirchen, Germany) from the anaerobic medium bottle to a sterile coupling device attached to a port on the reactor lid. The serum bottle with the autoclaved medium was equipped with a gas bag (PLASTIGAS, Linde GmbH, Pullach, Germany) filled with N2 for pressure compensation. After refilling the STR with the fresh medium, the vitamin and trace element solutions were added with single-use syringes and cannulas via a septum at the lid. Hereafter, the stirrer and pH control were switched on again, and the next batch process was started. The anaerobic medium exchanges lasted in total between 20 and 25 min.

2.3. Cell Dry Weight and Optical Density

For the determination of the cell dry weight (CDW), samples with a volume of 3 mL were collected with a syringe and a cannula through a silicon septum in the reactor lid. CDW was determined gravimetrically by centrifugation of samples at 14,500 rcf for 15 min (Espresso Personal Microcentrifuge, Thermo Fisher Scientific, Waltham, MA, USA) in pre-dried and pre-weighted tubes (Eppendorf Safe-Lock 2 mL, Eppendorf SE, Hamburg, Germany). The supernatant was discarded, and the cell pellet was dried to constant weight at 80 °C for at least 48 h before final weighing.
The optical density of samples was determined in triplicate by measuring the optical density at a wavelength of 600 nm (OD600) using single-use cuvettes (ROTILABO PMMA semi-micro, Carl Roth GmbH, Karlsruhe, Germany) with a UV-Vis spectrometer (Genesys 10S UV-Vis, Thermo Fisher Scientific Inc., Waltham, MA, USA). If necessary, the samples were diluted with phosphate-buffered saline solution (PBS) (8 g L−1 NaCl, 0.2 g L−1 KCl, 1.44 g L−1 Na2HPO4, 0.24 g L−1 KH2PO4) to keep the optical density within the linear correlation range of the UV-Vis spectrometer. The CDW concentration was estimated based on the measured OD600 by linear correlation (0.51 g L−1 OD600−1).

2.4. Substrate Analysis

High Performance Liquid Chromatography (Agilent 1100 LC, Agilent Technologies Inc., Santa Clara, CA, USA) was applied to measure the concentrations of the monosaccharides and acetic acid using an ion exchange column (Aminex HPX-87H, 300 mm × 7.8 mm, Bio-Rad Laboratories Inc., Hercules, CA, USA) with a refractive index (RI) detector (Agilent 1200 G1362A RID, Agilent Technologies Inc., Santa Clara, CA, USA). 5 mM sulfuric acid was used as the mobile phase with a flow rate of 0.5 mL min−1, and the RI detector was operated at 65 °C.
The measured acetate concentrations of each repeated batch process were interpolated with a sigmoidal function (see Supplementary Material and Table S2) for the estimation of the maximum volumetric production rate (QAcetate,max).

2.5. Online Analysis of Exhaust Gas and Determination of Gas Uptake Rates and Uptake Yields

The exhaust gas was analyzed online using a mass flow meter (EL-FLOW, Bronkhorst HIGH-TECH, Ruurlo, The Netherlands) and a micro gas chromatograph (µ-GC) equipped with a thermal conductivity detector (490 Micro GC Dual, Agilent Technologies, Santa Clara, CA, USA). After passing the mass flow meter, a gas sample was automatically collected by the µ-GC every ten minutes. For the accurate determination of the gas components, hydrogen and carbon dioxide, two columns were employed. A Mol Sieve 5 Å column (10 m) for hydrogen detection operated at a column temperature of 45 °C, and a PoraPLOT PPQ column (10 m) for carbon dioxide detection operated at 60 °C. Nitrogen was used as the carrier gas for both columns at a flow rate of 10 mL min−1.
The gas uptake rates U R i (Equation (S1)) and the uptake yield Yieldi (Equation (S2)) of CO2 and H2 were determined from the volumetric proportion of each gas component xi determined via the online gas analysis, a mixed gas conversion factor f i determined during calibration of the µ-GC ( f i = 0.945 ), and the gas flow rate V ˙ G a s , t o t a l measured in the off-gas. The Equations (S1) and (S2) were used with the gas flow rate V ˙ i , i n of the gas component i that was fed to the stirred tank bioreactor and V m = 22.414 L mol−1.

2.6. Extraction of Acetate

At the end of each repeated-batch process, the harvested culture broth was first autoclaved (121°, 20 min) to ensure complete cell inactivation and to prevent further metabolic activity. The autoclaved broth was then clarified by vacuum filtration using diatomaceous earth (Carl Roth GmbH & Co. KG, Karlsruhe, Germany) and a filter paper (0.45 µm) to remove the solids (A. woodii). The filtrate was subsequently acidified by H2SO4 to pH 1.2 to gain the undissociated acetic acid for extraction. Liquid–liquid extraction was performed by mixing the acidified aqueous phase with saturated NaCl solution and the non-water miscible organic solvent ethyl acetate at a 1:1:2 (v/v) ratio, followed by phase separation using a separatory funnel. To maximize the extraction yield, the aqueous phase was extracted two more times with fresh ethyl acetate under identical conditions. The combined organic phases were collected, and the solvent was removed and condensed for recycling using a rotary evaporator (Hei-VAP Expert, Heidolph Scientific Products GmbH, Schwabach, Germany) operated at 42 °C and 150 mbar, yielding purified acetic acid as the residual product. The mass of the recovered acetic acid was determined, and samples of 500 µL were subsequently diluted with deionized water for analysis by high-performance liquid chromatography (HPLC).

2.7. Carbon Balance and Electron Balance

For the determination of the carbon balance, mass balances of the carbon that was added to the reactor (MC,in) through CO2, yeast extract, and the vitamins, and the carbon that was recovered from formed biomass and acetate via analysis (MC,out). To determine carbon recovery, Equation (S3) was used, where RC is the carbon recovery in percent.
The electron balance (Re) of the repeated batch cultivations was determined by comparing the electrons supplied via hydrogen with the electrons recovered from biomass and acetate. The input of electrons was determined from the consumed hydrogen, using a degree of reduction of 2 mol e equivalents per mol H2. The recovery of electrons was calculated from the formation of biomass and acetate, through the degree of reduction. The degree of reduction was derived from the elemental composition according to γ = 4C + H − 2O − 3N. Based on this approach, acetate has a degree of reduction of γAcetate = 4.0 on a C-mol basis. For biomass, an elemental composition of CH1.8O0.5N0.2 was assumed. From this, the degree of reduction was determined to be γX = 4.2 on a C-mol basis. Thus, the final electron balance was expressed as the electron input from hydrogen and the electron recovery in formed biomass and acetate as presented in Equation (S4).

3. Results and Discussion

3.1. Biomass Formation and Acetate Production

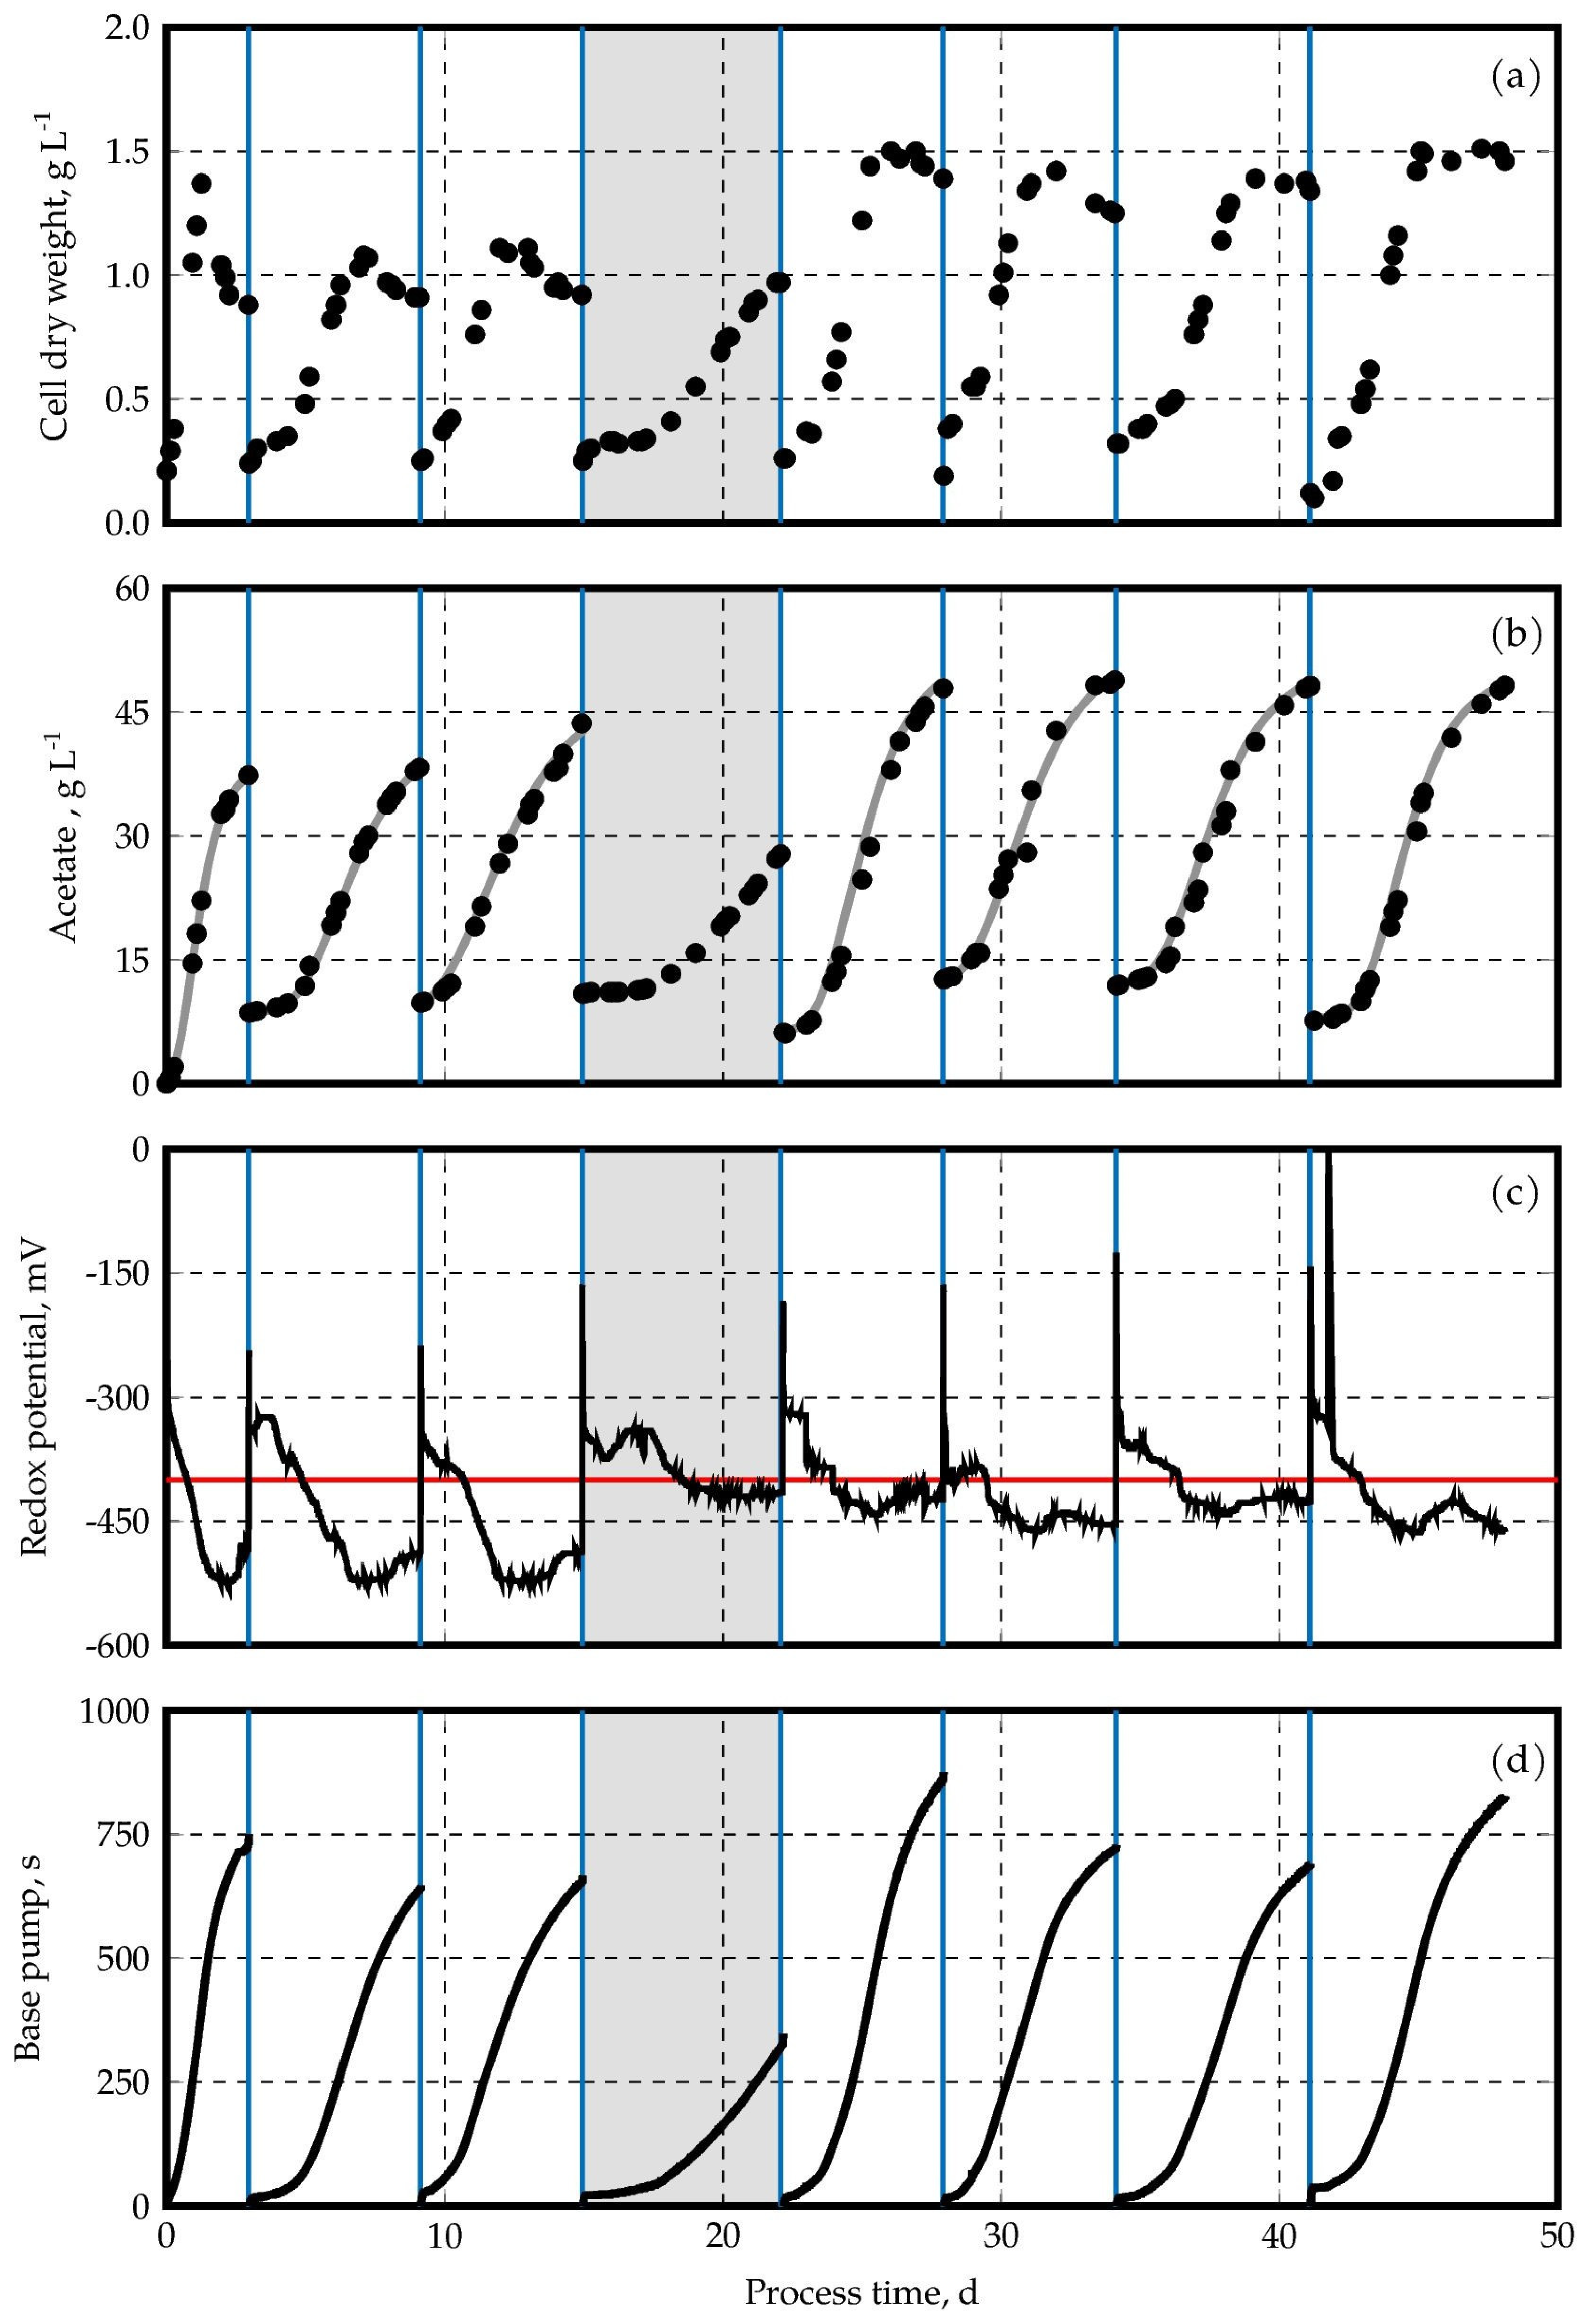
The biomass concentrations of A. woodii during the semi-continuous repeated-batch operation are depicted in Figure 2a as a function of the process time. Each start of a new batch process is indicated by a blue line, corresponding to 80% partial medium exchange.
Within 48 days, eight repeated autotrophic batch processes were performed in the controlled STR with continuous gassing. After each medium exchange, only a short lag phase was observed. Except for the fourth batch process, where an unintended interruption (technical failure) of the gas supply for a few hours occurred shortly after the medium exchange (marked with gray in Figure 2). The process times of the repeated-batch processes (excluding the first) varied between 5.8 and 7.0 days (Table 1). These deviations may be caused, in part, by the manually initiated medium exchange after the online-measured redox potential was identified as increasing (Figure 2c). The first batch process, inoculated with cells of the preculture, was significantly shorter (3.0 days).
The initial CDW concentration after each medium exchange was 0.230 ± 0.055 g L−1. After reaching the maximum CDW concentration in the repeated-batch processes, a decline in the A. woodii cells was observed (except in the last batch process), most probably due to the exhaustion of one or more growth factors provided with the medium, e.g., components of the yeast extract or vitamins. The maximum CDW concentrations varied considerably between 1.08 and 1.51 g L−1, with more stable results at a higher level in the last four batch processes (1.39–1.51 g L−1), indicating adaptation of the A. woodii cells during repeated-batch operation.
Compared to published autotrophic batch process data, the general growth profiles of the repeated-batch processes are similar to those described, e.g., in [31]. Even under increased absolute pressure (10 bar), a modified A. woodii strain showed autotrophic batch growth patterns similar to ours [32].
The acetate concentrations in the repeated-batch processes increased after each medium exchange, once the cells had passed through the initial adaptation phase (Figure 2b). The final maximum acetate concentrations were always measured at the time the medium exchanges were initiated. Acetate concentrations were increasing progressively from 37.4 g L−1 in the first batch process to a maximum of 47.8–48.8 g L−1 in the last four repeated-batch processes. These final acetate concentrations at harvest are comparable to those described before in autotrophic batch processes with A. woodii [16].
The maximum volumetric acetate production rates varied in the last four batch processes between 9.90 and 13.63 g L−1 d−1 (see Table 1). This leads to a mean maximum volumetric production rate of 11.6 (±1.7) g L−1 d−1. Our production rates are in the same order of magnitude compared to literature data with 9.4–18.1 g L−1 d−1 [16]. Summarizing it can be noted that the consistent recovery of acetate synthesis following each dilution step demonstrates sustained homoacetogenic activity of A. woodii. Remarkably, even as CDW concentrations decreased during the repeated-batch processes, acetate production slowed but continued.
A similar behavior of acetate production was observed in previous autotrophic batch studies with A. woodii, with final acetate concentrations up to 50 g L−1 and CDW formation up to 1.9 g L−1 [33]. The ability of A. woodii to further produce acetate in autotrophic batch processes, even under declining CDW concentrations, has been described in [16] as well. Other acetogens, such as Clostridium autoethanogenum, cease acetate production once some cells begin to lyse in autotrophic batch processes, as shown previously [34]. On the other hand, repeated-batch processes with Moorella thermoacetica at 60 °C showed acetate production even as the CDW concentration decreased, but with significantly lower final maximum acetate concentrations of 25 g L−1 [35].
The redox potential of the medium at the beginning of each batch process after medium exchange was around −300 mV and decreased with increasing CDW concentrations. As far as the redox potential fell below −400 mV, acetate formation began to increase rapidly due to the redox-dependent bifurcating hydrogenase of A. woodii. This enzymatic complex is supposed to provide sufficient reduced ferredoxin for acetate formation as long as a redox potential of −414 mV is achieved inside the cells [15,36]. The minimum redox potential of around –510 mV in the first three batch processes shifted to a minimum ranging between −425 mV and −475 mV afterwards. Because the same medium was used in the repeated-batch processes during medium exchange, the redox electrode might shift during long-term operation [37], e.g., caused by biofouling on or within the ceramic diaphragm of the redox probe. Additionally, it has to be mentioned that biofouling on or within the ceramic diaphragm of the redox probe might influence the measurement accuracy, as it has been shown in other studies [38,39]. However, there is no possibility to recalibrate the redox electrode during the running autotrophic process.
The cumulative working time of the base pump (6 M KOH) required for pH control is shown in Figure 2d. Base additions followed, as expected, the dynamics of acetate formation in the repeated-batch processes (Figure 2b). Cumulative base additions may thus serve as an online signal for estimating acetate formation, as already shown with Moorella thermoacetica [35].

3.2. Gas Uptake Rates of CO2 and H2

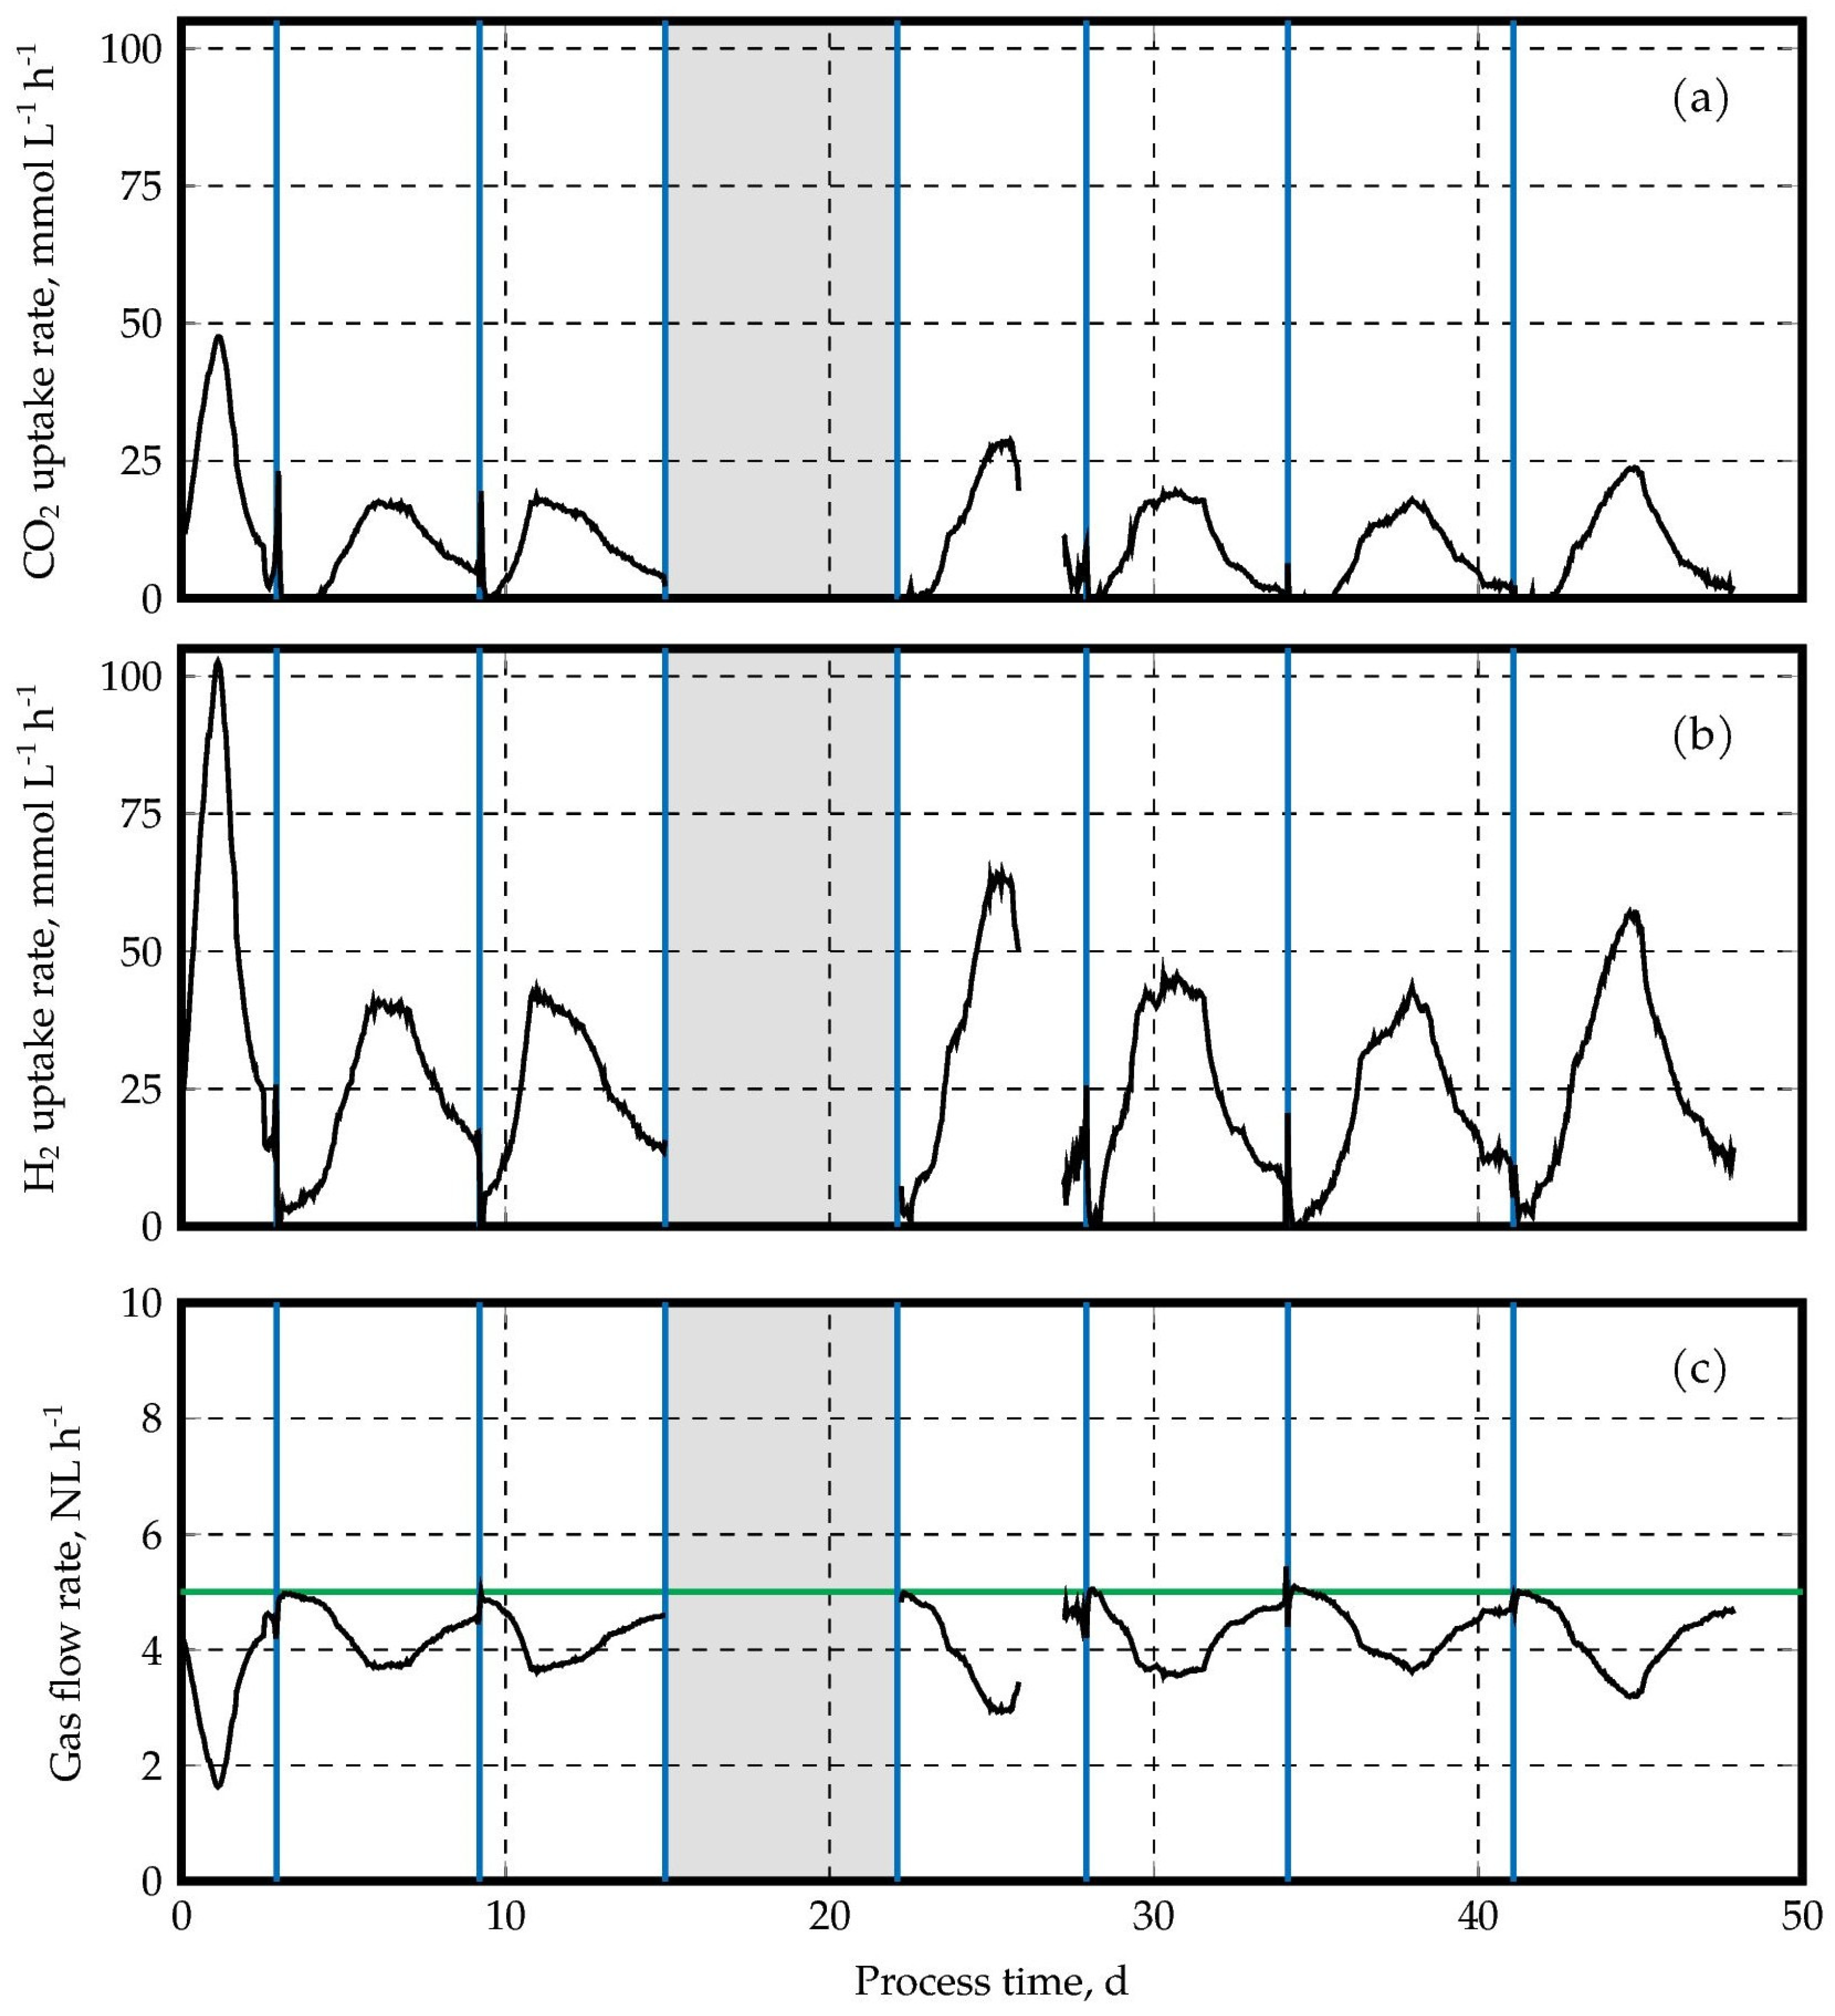
The CO2 and H2 uptake rates of the repeated-batch processes increased until the maximum biomass concentrations were achieved (Figure 3). Afterwards, both uptake rates decreased, approaching zero mM h−1 before medium exchange. Data from the fourth batch process are missing (technical failure of the gas supply). Between day 26 and day 27, the off-gas flow rates are missing due to a communication problem between the mass flow meter and the control software of the stirred tank bioreactor, which was resolved after the problem was recognized and the mass flow meter was restarted. The maxima of the CO2 and H2 uptake rates of the repeated-batch processes were determined as a 2 h average due to the noisy signals. The average maxima of the CO2 uptake rates were between 17.6 and 28.6 mM CO2 h−1, except for the first batch process (47.5 mM CO2 h−1). The maximum H2 uptake rates were 41.0–64.1 mM H2 h−1 and 102.6 mM H2 h−1 in the first batch process, respectively. These maximum gas uptake rates are of the same order of magnitude as previously reported for autotrophic batch processes with A. woodii, e.g., [31]. The measured ratio of the consumed gases H2 versus CO2 is thus 2.16–2.42 in the maximum (Table 1), meaning that in the repeated batch processes, more H2 is consumed by the cells compared to the stoichiometric ratio of 2.0 for pure autotrophic acetate production without biomass formation [40]. This has already been observed in other autotrophic studies with A. woodii, showing molar H2 versus CO2 ratios of 2.15–2.24, e.g., [31].
The gas flow rate dynamics of the off-gas were inversely proportional to the gas uptake rates (Figure 3c): the minimum off-gas flow rates were measured at the maximum gas uptake rates of the A. woodii cells. These minimum values ranged between 2.93 and 3.69 NL h−1 for the repeated-batch processes (Table 1). It should be noted that the incoming gas mixture with 70% H2 and 30% CO2 was composed in a superstoichiometric ratio for acetate production to ensure a sufficient supply of reduction equivalents (H2: CO2 = 2.33 > 2.0). As a consequence, no significant change between the incoming and the off-gas partial pressures of H2 and CO2 was observed within the estimation error, as already described in the literature [17].
The maximum CO2 yields of the repeated-batch processes in the lab-scale stirred tank bioreactors with continuous gassing were low, ranging from 11.8 to 15.1%, except for the first batch, showing a maximum CO2 yield of 36%. The same trend was observed with the maximum H2 yields (14.0–17.5%) in the repeated batch processes and 34.5% in the first batch process (Table 1). This is typical for lab-scale studies that aim to ensure high gas–liquid mass transfer rates by applying high volumetric power inputs at high gassing rates to avoid mass transfer limitations. On an industrial scale, with liquid heights of 20–30 m above the sparger, much higher CO2- and H2-yields are the standard due to the long travel time of the gas bubbles in the liquid phase and the improved gas–liquid mass transfer caused by the increased hydrostatic pressure. Gaseous carbon utilization of 70–75% has already been demonstrated in syngas fermentation on a pilot scale [41]. Currently, almost complete utilization of the limiting syngas components is achieved in gas fermentation on an industrial scale [42].
Carbon and electron balances of the repeated batch processes are closed within typical estimation errors of +/− 10%, showing carbon recoveries of 91.5–98.7%, and electron recoveries of 92.5–110%, respectively (Table 1). Deviations from complete closure of the balances are most likely caused by cumulative uncertainties in gas flow and off-gas analysis, and the assumed biomass composition. However, the carbon recovery in the first batch process was only 84.5%, and this may be due to more cell lysis than in the other batches. Overall, our carbon and electron balances in the later batches were closed within the same order of magnitude as reported previously (96–115%) [43,44], indicating that the process performance data from our repeated batch processes are reliable within the estimation error.

3.3. Extraction of Acetic Acid from the Clarified Fermentation Broth

At pH 7.0, acetate is predominant in the fermentation broth. To get concentrated acetic acid as a carbon source for microbial oil production with C. oleaginosus, the clarified fermentation broth was first titrated to pH 1.2 with H2SO4. After adding a saturated NaCl solution with a ratio of 1:1, the resulting aqueous solution was extracted with the non-water miscible organic solvent ethyl acetate at a 1:1 (v/v) ratio, as suggested in [45]. Acetic acid was extracted exemplarily from the clarified fermentation broth of the last repeated batch process with a simple mixer-settler approach, repeated two times, with total recycling of the organic phase. Concentrated acetic acid with a purity of 90% (951.25 g L−1) was produced with an extraction yield of 94.3% (w/w). This is in accordance with literature data, where extraction yields of 88–96% have been reported [46,47]. More sustainable separation methods, avoiding pH titration and salt addition, are the direct extraction of organic acids like acetate via reactive extraction or the application of electrodialysis with bipolar membranes [48,49]. However, both approaches are technically more complex and are not part of standard laboratory equipment.

3.4. Feasibility of Process Integration of Microbial Oil Production and Gas Fermentation

The feasibility of an integrated production of yeast oil from lignocellulosic hydrolysate by combining aerobic yeast oil production with C. oleaginosus and anaerobic gas fermentation with A. woodii is evaluated based on the following assumptions:
(i)
The mean of the gas fermentation performance data of the last four repeated batch processes (Table 1) was used as reference, resulting in a mean repeated batch process time of 6.5 days. The mean final acetate concentration was 48.3 g L−1 (805 mM). 80% of the fermentation broth will be harvested during medium exchange. Assuming an acetic acid extraction yield of 95% will result in the delivery of 805 · 0.8 · 0.95 = 611.8 mmol acetic acid per L of gas fermentation volume. The mean CO2 uptake rate was 8.59 mmol L−1 h−1. Within 6.5 days, 8.59 · 24 · 6.5 = 1.34   M CO2 is consumed by the A. woodii cells for acetate and biomass formation.
(ii)
The batch process performance data for the aerobic microbial oil production with C. oleaginosus have been published before [25]. The microbial oil production process operated at an absolute pressure of 1.5 bar was used as a reference. Within a batch process time of 6 days, 45 g L−1 sugars (synthetic straw hydrolysate) and 112.9 g L−1 (1882 mM) acetic acid were consumed by C. oleaginosus for the production of 33 g L−1 microbial oils, 6.8 g L−1 lipid-free cell mass, and 3.27 M CO2. It is assumed that CO2 scrubbing from the off-gas of the aerobic fermentation can be achieved with a 100% yield.
(iii)
Both fermentation processes are operated in parallel with the aerobic microbial oil production by C. oleaginosus, producing the CO2 for the acetic acid production with A. woodii as one of the carbon sources for the yeast oil. The ratio of acetic acid needed for the aerobic yeast oil production and the acetic acid produced by A. woodii is 1882 mM/611.8 mM = 3.08. This means that the bioreactors for the gas fermentation need a 3.08 times higher working volume compared to the bioreactors for yeast oil production, as the (repeated) batch process times of both processes are nearly identical (6.5 days for the gas fermentation, and 6 days plus setup time for the aerobic yeast oil production).
However, the amount of CO2 needed for the production of acetic acid by A. woodii, with a 3.08 times higher working volume, is 3.08 · 1.34 = 4.13 M CO2, resulting in a deficit of 4.13 − 3.27 = 0.86 M CO2. Three options will be available for replacing the missing CO2. All three scenarios ensure CO2-free production of microbial oils from straw hydrolysate in the fermentation plant, provided renewable energy is used for plant operation, and H2 is produced via water electrolysis (green hydrogen).
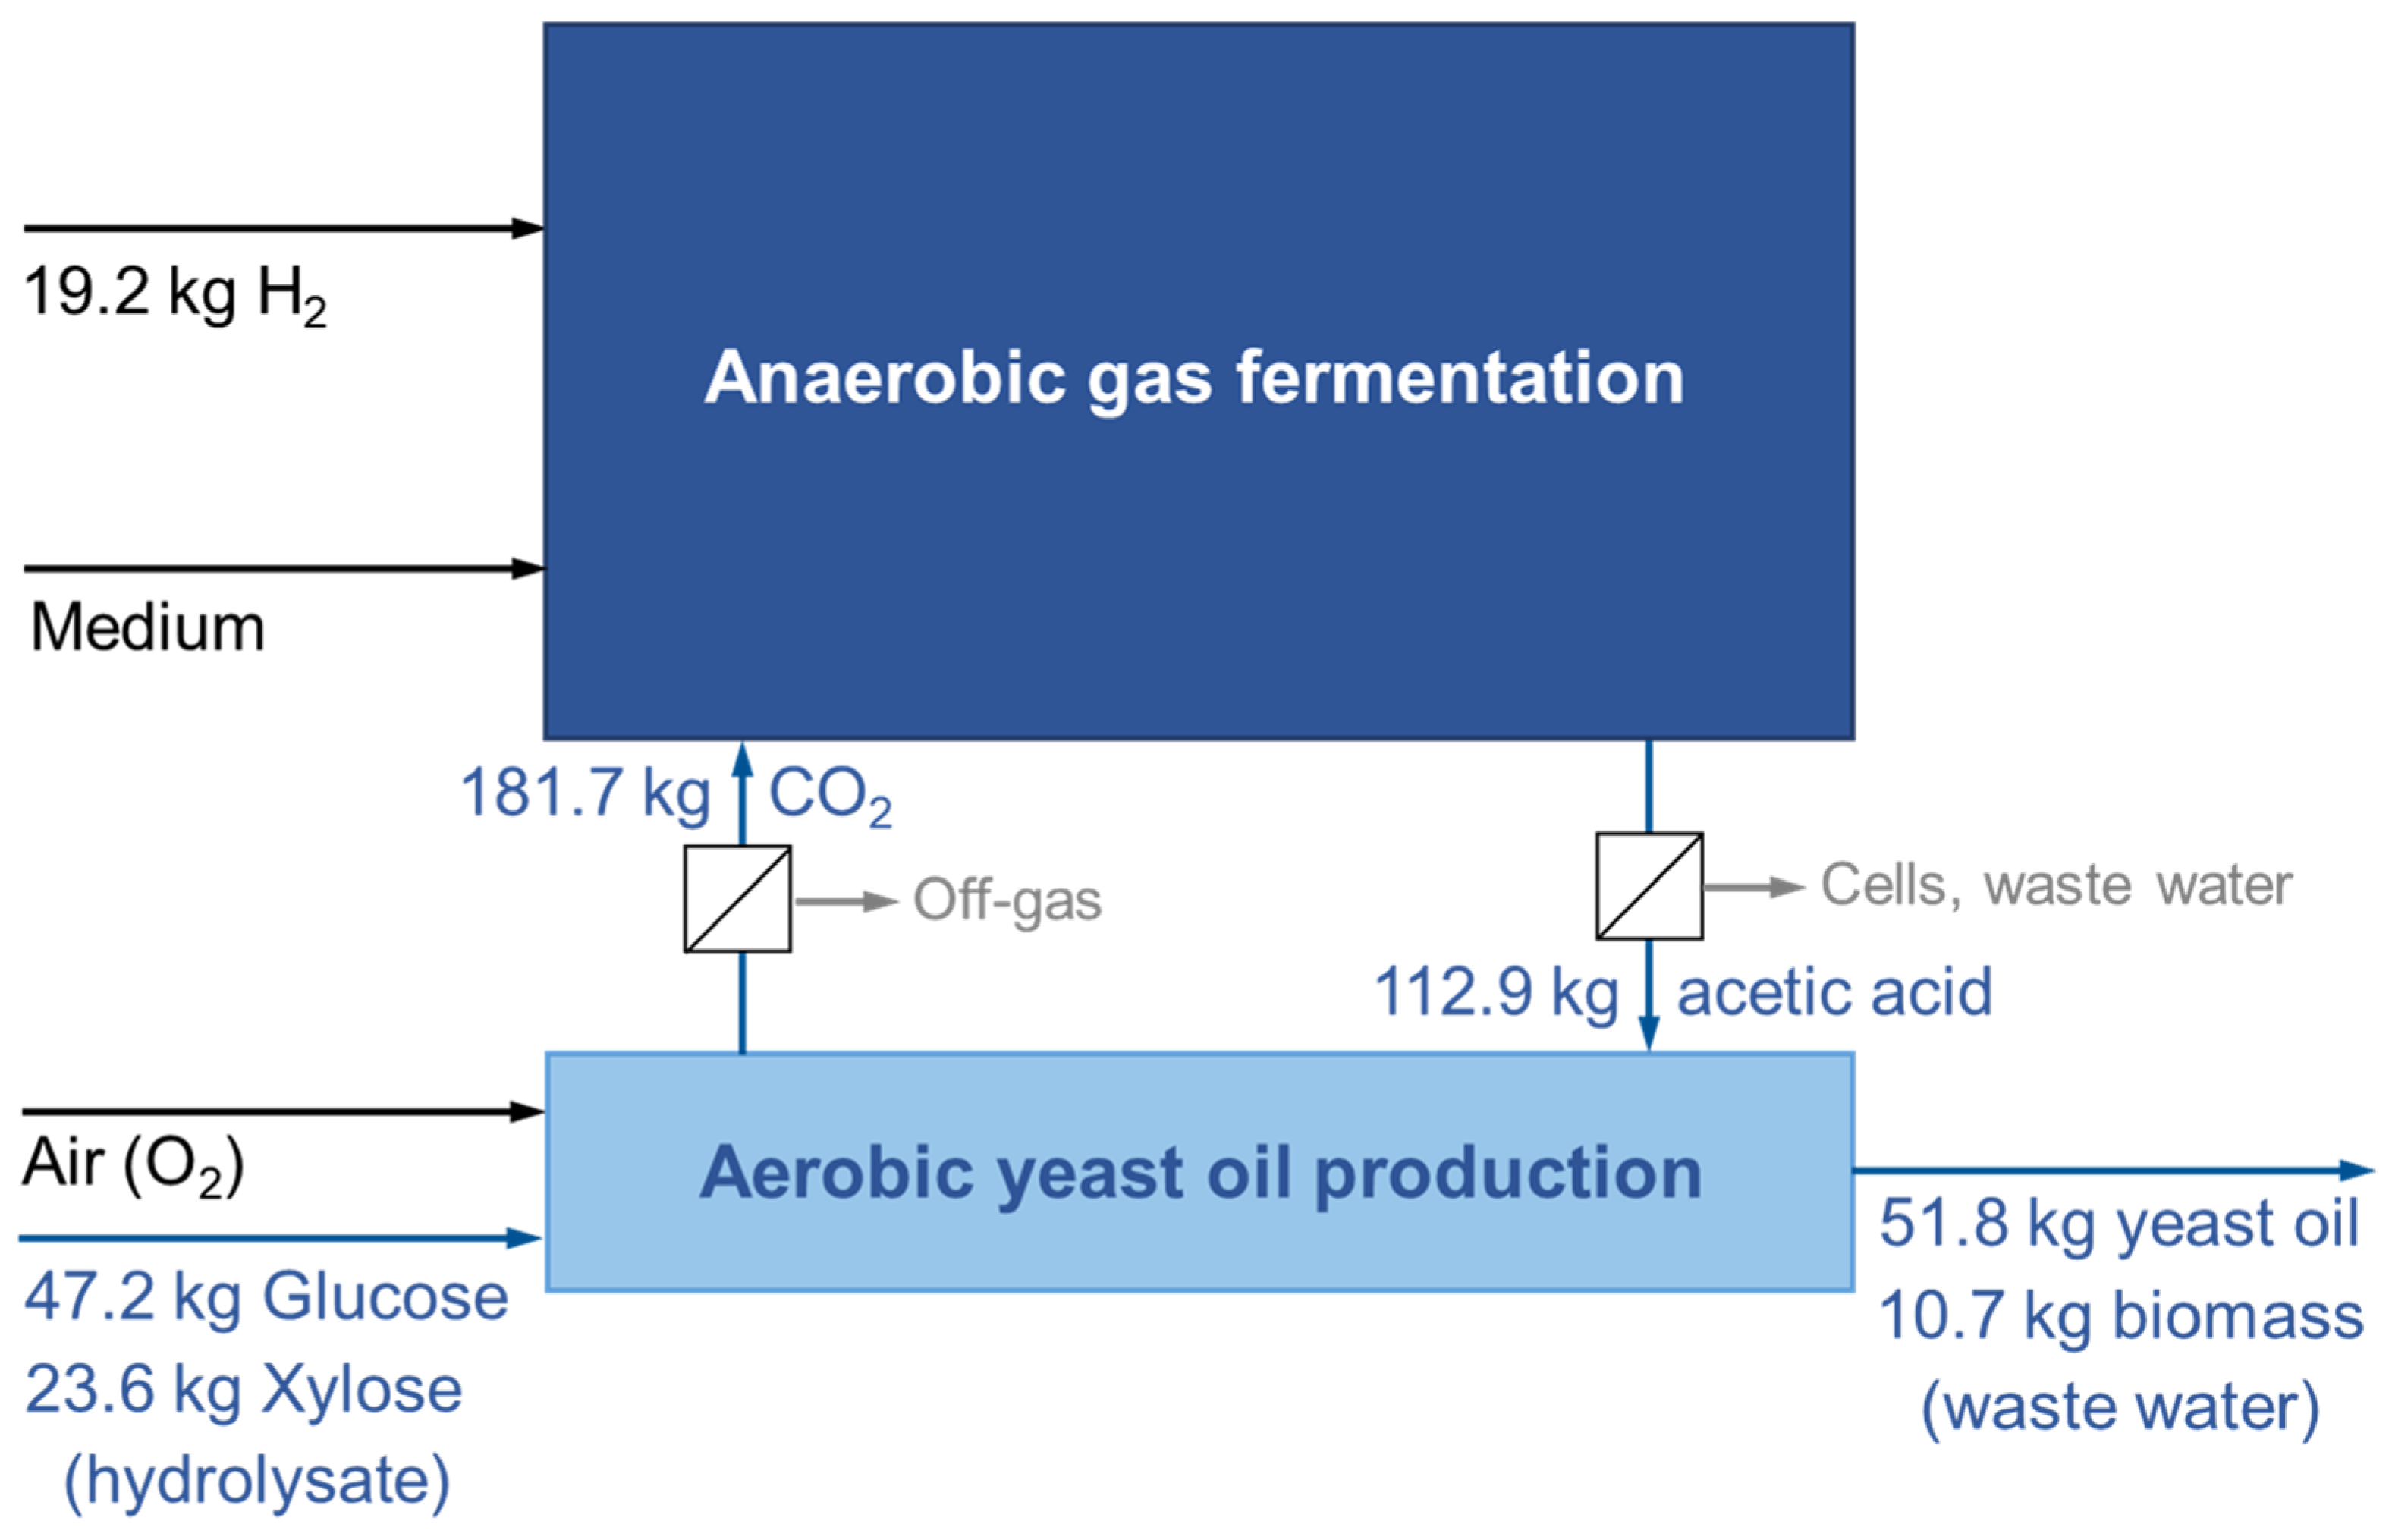
First, the concentration of sugars can be increased during aerobic microbial oil fermentation. Assuming complete oxidation of the additionally supplied sugars in the synthetic hydrolysate, both glucose and xylose yield 33.3 mmol CO2 per gram of sugar. With a sugar ratio of 2:1 in the synthetic hydrolysate, the addition of 17.2 g L−1 glucose and 8.6 g L−1 xylose will result in the release of ( 17.2 + 8.6 ) · 0.0333 = 0.86 M CO2, compensating for the deficit needed for the production of acetic acid with A. woodii. Increasing the sugar concentration to 45 + 17.2 + 8.6 = 70.8 g L−1 sugars at the minimum should be possible, because straw hydrolysates with sugar concentrations of up to 123 g L−1 have been reported in the literature, e.g., [50]. This approach is illustrated in Figure 4 based on an aerobic fermentation volume for yeast oil production of 1 m3.
However, the first of both fermentation processes requires the supply of initial carbon sources. The first anaerobic acetate production batch can be operated with biogenic CO2 (commercially available from ethanol fermentation plants) or with CO2 obtained from power plants or waste incineration. The first yeast oil production process, operated in parallel, needs biogenic acetic acid from the classical oxidation of ethanol with aerobic acetic acid bacteria or fossil acetic acid.
A second option to replace the missing CO2 is to use other sources of biogenic CO2, e.g., the off-gas from wastewater treatment, which is necessary to treat the liquid wastes from the fermentation processes (consumed fermentation media, biomass, cell debris, and cleansing water).
Third, the gas fermentation capacity is adapted to the available CO2 from the yeast oil production, and missing acetic acid is replaced by other (biogenic) sources. With this scenario, the working volume of the gas fermentation is reduced: 3.27 M CO2 is produced by C. oleaginosus in the reference process, and 1.34 M CO2 is consumed by A. woodii in the repeated batch process, resulting in a working volume ratio of 3.27 / 1.34 = 2.44 .
Other studies on the combination of gas fermentation for acetate production followed by microbial oil production with yeasts attempted to use the filtered effluent from gas fermentation directly for microbial oil production. An example is the combination of a gas fermentation with Clostridium aceticum and the microbial oil production with Yarrowia lipolytica [51]. However, the microbial oil content of the yeast cells was low (<22.9% (w/w)) at low final CDW concentrations of 5.5 g L−1. Nearly the same results were reported after autotrophic acetate production with Moorella thermoacetica and converting the filtered gas fermentation broth with Y. lipolytica [52]. Here, a rather low lipid content of 36% (w/w) was measured, yielding a final lipid concentration of solely 18 g L−1. Both acetogens, C. aceticum and M. thermoacetica, produced significantly lower acetate concentrations (7–30 g L−1) compared to A. woodii.

4. Conclusions

CO2-neutral production of microbial oils from sugars or hydrolysates of agricultural residues is possible by reusing the CO2 produced in the aerobic yeast oil production for the autotrophic production of acetic acid, which is recycled as an additional carbon source for yeast oil production. Repeated batch processes with A. woodii enable the stable and semi-continuous production of acetate from CO2 and H2 within 6.5 days. Acetic acid can be extracted from the fermentation broth with high yields. The batch process time (6 days plus setup time) of the aerobic microbial oil production from a synthetic straw hydrolysate and acetic acid with C. oleaginosus fits well, as shown before [25]. For providing enough acetic acid for microbial oil production, a 3.08 times higher bioreactor capacity is needed for the gas fermentation compared to the aerobic yeast fermentation. The lack of CO2 produced by C. oleaginosus may be compensated for by increasing the sugar supply (hydrolysate) during yeast oil production, or by the additional use of other biogenic CO2 sources. However, additional research and development work is necessary for scale-up and further adaptation of both fermentation processes.

Supplementary Materials

The following supporting information can be downloaded at: https://www.mdpi.com/article/10.3390/fermentation12050229/s1, Figure S1: Repeated-batch process with A. woodii in a STR with continuous gassing with 700 mbar H2 and 300 mbar CO2: Partial pressure of H2 (grey) and CO2 (black) in the exhaust gas (Incoming gas flow rate of 5 L h−1, T = 30 °C, P = 1 bar, V = 1 L). The blue lines represent the time points at which 80% of the cultivation broth was harvested, and the STR was refilled with 800 mL fresh medium. The partial pressures of the incoming gas components are indicated with green (H2) and red (CO2) lines. The fourth batch process is indicated in gray due to the interruption (technical failure) of the gas supply shortly after medium exchange.; Table S1: Composition of the medium for serum bottles, the vitamin solution and trace element solution used in this study; Table S2: Variables determined through a Gompertz function through the acetate concentrations for each repeated batch process.

Author Contributions

Conceptualization, F.H. and D.W.-B.; methodology, validation, formal analysis, and investigation, F.H., A.S., A.O. and E.P.; writing—original draft preparation, F.H.; writing—review and editing, F.H. and D.W.-B.; visualization, F.H.; supervision, D.W.-B.; project administration, D.W.-B.; funding acquisition, D.W.-B. All authors have read and agreed to the published version of the manuscript.

Funding

This research was funded by the Federal Ministry of Research, Technology, and Space (BMFTR, Berlin, Germany) within the research project ‘H2-Reallabor Burghausen/ChemDelta Bavaria’ under grant number 03SF0705B.

Institutional Review Board Statement

Not applicable.

Informed Consent Statement

Not applicable.

Data Availability Statement

Data presented in this manuscript are available upon request from the corresponding author.

Acknowledgments

The authors thank Ingmar Polte and Christopher Graf at the Chair of Biochemical Engineering (TUM), and Simon Gregg at the TUM Pilot Plant for Industrial Biotechnology, Garching, Germany, for the technical support and many helpful discussions. The fruitful cooperation within the ‘H2-Reallabor Burghausen/ChemDelta Bavaria’ with Thomas Brück, Daniel Garbe, and Max Schneider at the Werner Siemens-Chair of Synthetic Biotechnology (TUM) is also gratefully acknowledged. Finally, the authors thank Fabian Herrmann by the TUM Graduate School for the provided support.

Conflicts of Interest

The authors declare no conflicts of interest. The funders had no role in the design of the study; in the collection, analyses, or interpretation of data; in the writing of the manuscript; or in the decision to publish the results.

Abbreviations

The following abbreviations are used in this manuscript:
DSMZDeutsche Sammlung für Mikroorganismen und Zellkulturen Braunschweig
YPDYeast–Peptone–Dextrose
STRStirred Tank Reactor
vvmVessel Volumes per Minute
KOHPotassium Hydroxide
HClHydrogenchloride
CDWCell Dry Weight
PBSPhosphate-Buffered Saline Solution
HPLCHigh-Performance Liquid Chromatography
pabsAbsolute Pressure
pH2Partial Pressure H2
pCO2Partial Pressure of CO2
n.d.Not Determined
v/vVolume per Volume
OD600Optical Density Determined at 600 nm Wavelength
rpmRevolutions per Minute
rcfRelative Centrifugal Force
RIRefractive Index
MC,inMass of Carbon Introduced
MC,outMass of Carbon Recovered
MAcMass of Acetic Acid/Acetate
xC,AcFraction of Carbon in Acetic Acid/Acetate
MYEMass of Yeast Extract
xC,YEFraction of Carbon of Yeast Extract
MXMass of Biomass
xC,XFraction of Carbon in Biomass
MCO2Mass of Carbon Dioxide
xC,CO2Fraction of Carbon in CO2
MVitMass of Vitamins
XC,VitFraction of Carbon of Vitamins
RCCarbon Recovery Rate
EinElectrons Brought into the System
EoutElectrons Found in the System
nH2Molar Amount of Hydrogen Consumed
γXDegree of Reduction for the Formation of Biomass
γAcDegree of Reduction for the Formation of Acetate
γH2Degree of Reduction from the Reduction of Hydrogen
nXMolar Amount of Biomass Produced
nAcMolar Amount of Acetate Produced
ReElectron Balance/Recovery
ALEAdaptive Laboratory Evolution
LCLiquid Chromatography
µ-GCMicro Gas Chromatography
NL h−1Normal Liters per Hour
RIDRefractive Index Detector
URiUptake Rate of Gas Component i
URmax,iMaximum Uptake Rate of Gas Component i
WLPWood–Ljungdahl Pathway
PPGPolypropylene Glycol
V ˙ i , i n Gas Flow Rate of Gas Component i at the Reactor Entrance
xiProportion of the Gas Component i
fiMixed Gas Conversion Factor
QAcetate,maxMaximum Volumetric Production Rate of Acetate
V ˙ G a s , t o t a l Total Gas Flow Rate of the Off-Gas Stream
V m Molar Gas Volume (22.414 L mol−1)
V R Working Volume of the Reactor
YieldiYield of the Gas Uptake
γ X Degree of Biomass Reduction
n X Molar Amount of Biomass Produced
γ A c Degree of Acetate Reduction
n A c Molar Amount of Acetate

References

  1. Dürre, P.; Eikmanns, B.J. C1-carbon sources for chemical and fuel production by microbial gas fermentation. Curr. Opin. Biotechnol. 2015, 35, 63–72. [Google Scholar] [CrossRef] [Scilit]
  2. Claassens, N.J.; Sousa, D.Z.; Dos Santos, V.A.; de Vos, W.M.; van der Oost, J. Harnessing the power of microbial autotrophy. Nat. Rev. Microbiol. 2016, 14, 692–706. [Google Scholar] [CrossRef] [Scilit] [PubMed]
  3. Thiedemann, T.M.; Wark, M. A compact review of current technologies for carbon capture as well as storing and utilizing the captured CO2. Processes 2025, 13, 283. [Google Scholar] [CrossRef] [Scilit]
  4. Fernández, J.R. An overview of advances in CO2 capture technologies. Energies 2023, 16, 1413. [Google Scholar] [CrossRef] [Scilit]
  5. Sanchez, D.L.; Johnson, N.; McCoy, S.T.; Turner, P.A.; Mach, K.J. Near-term deployment of carbon capture and sequestration from biorefineries in the United States. Proc. Natl. Acad. Sci. USA 2018, 115, 4875–4880. [Google Scholar] [CrossRef] [Scilit]
  6. Poehlein, A.; Zeldes, B.; Flaiz, M.; Boer, T.; Luschen, A.; Hofele, F.; Baur, K.S.; Molitor, B.; Kroly, C.; Wang, M.; et al. Advanced aspects of acetogens. Bioresour. Technol. 2025, 427, 131913. [Google Scholar] [CrossRef] [Scilit]
  7. Ragsdale, S.W.; Pierce, E. Acetogenesis and the Wood-Ljungdahl pathway of CO2 fixation. Biochim. Biophys. Acta 2008, 1784, 1873–1898. [Google Scholar] [CrossRef] [Scilit] [PubMed]
  8. Lee, H.; Bae, J.; Jin, S.; Kang, S.; Cho, B.K. Engineering acetogenic bacteria for efficient one-carbon utilization. Front. Microbiol. 2022, 13, 865168. [Google Scholar] [CrossRef] [Scilit]
  9. Drake, H.L.; Daniel, S.L. Physiology of the thermophilic acetogen Moorella thermoacetica. Res. Microbiol. 2004, 155, 869–883. [Google Scholar] [CrossRef] [Scilit] [PubMed]
  10. Lanzillo, F.; Giacomo, R.; Raganati, F.; Russo, M.E.; Marzocchella, A. Batch syngas fermentation by Clostridium carboxidivorans for production of acids and alcohols. Processes 2020, 8, 1075. [Google Scholar] [CrossRef] [Scilit]
  11. Balch, W.E.; Schoberth, S.; Tanner, R.S.; Wolfe, R.S. Acetobacterium, a new genus of hydrogen-oxidizing, carbon dioxide-reducing, anaerobic bacteria. Int. J. Syst. Bacteriol. 1977, 27, 355–361. [Google Scholar] [CrossRef] [Scilit]
  12. Bertsch, J.; Müller, V. CO metabolism in the acetogen Acetobacterium woodii. Appl. Environ. Microbiol. 2015, 81, 5949–5956. [Google Scholar] [CrossRef] [Scilit] [PubMed]
  13. Neuendorf, C.S.; Vignolle, G.A.; Derntl, C.; Tomin, T.; Novak, K.; Mach, R.L.; Birner-Grünberger, R.; Pflügl, S. A quantitative metabolic analysis reveals Acetobacterium woodii as a flexible and robust host for formate-based bioproduction. Metab. Eng. 2021, 68, 68–85. [Google Scholar] [CrossRef] [Scilit]
  14. Schuchmann, K.; Müller, V. Autotrophy at the thermodynamic limit of life: A model for energy conservation in acetogenic bacteria. Nat. Rev. Microbiol. 2014, 12, 809–821. [Google Scholar] [CrossRef] [Scilit]
  15. Schuchmann, K.; Müller, V. A bacterial electron-bifurcating hydrogenase. J. Biol. Chem. 2012, 287, 31165–31171. [Google Scholar] [CrossRef] [Scilit]
  16. Kantzow, C.; Weuster-Botz, D. Effects of hydrogen partial pressure on autotrophic growth and product formation of Acetobacterium woodii. Bioprocess Biosyst. Eng. 2016, 39, 1325–1330. [Google Scholar] [CrossRef] [Scilit]
  17. Kantzow, C.; Mayer, A.; Weuster-Botz, D. Continuous gas fermentation by Acetobacterium woodii in a submerged membrane reactor with full cell retention. J. Biotechnol. 2015, 212, 11–18. [Google Scholar] [CrossRef] [Scilit] [PubMed]
  18. Akkoyunlu, B.; Daly, S.; Casey, E. Membrane bioreactors for the production of value-added products: Recent developments, challenges and perspectives. Bioresour. Technol. 2021, 341, 125793. [Google Scholar] [CrossRef] [Scilit]
  19. Zhao, B.; Wang, L.; Ma, C.; Yang, C.; Xu, P.; Ma, Y. Repeated open fermentative production of optically pure L-lactic acid using a thermophilic Bacillus sp. strain. Bioresour. Technol. 2010, 101, 6494–6498. [Google Scholar] [CrossRef] [Scilit] [PubMed]
  20. Mavrommati, M.; Daskalaki, A.; Papanikolaou, S.; Aggelis, G. Adaptive laboratory evolution principles and applications in industrial biotechnology. Biotechnol. Adv. 2022, 54, 107795. [Google Scholar] [CrossRef] [Scilit] [PubMed]
  21. Peng, W.; Zhang, X.; Qi, Q.; Liang, Q. Advances in adaptive laboratory evolution applications for Escherichia coli. Synth. Syst. Biotechnol. 2025, 10, 1306–1321. [Google Scholar] [CrossRef] [Scilit]
  22. Suzuki, T.; Matsuo, T.; Ohtaguchi, K.; Koide, K. Continuous production of acetic acid from CO2 in repeated-batch cultures using flocculated cells of Acetobacterium woodii. J. Chem. Eng. Jpn. 1993, 26, 459–462. [Google Scholar] [CrossRef] [Scilit]
  23. Masri, M.A.; Garbe, D.; Mehlmer, N.; Brück, T.B. A sustainable, high-performance process for the economic production of waste-free microbial oils that can replace plant-based equivalents. Energy Environ. Sci. 2019, 12, 2717–2732. [Google Scholar] [CrossRef] [Scilit]
  24. Rerop, Z.S.; Stellner, N.I.; Graban, P.; Haack, M.; Mehlmer, N.; Masri, M.; Brück, T.B. Bioconversion of a lignocellulosic hydrolysate to single cell oil for biofuel production in a cost-efficient fermentation process. Fermentation 2023, 9, 189. [Google Scholar] [CrossRef] [Scilit]
  25. Herrmann, F.; Kazemian, N.; Petzel, E.; Weuster-Botz, D. Pressure-dependent microbial oil production with Cutaneotrichosporon oleaginosus converting lignocellulosic hydrolysate. Processes 2026, 14, 228. [Google Scholar] [CrossRef] [Scilit]
  26. Silva, J.M.E.; Martins, L.; Moreira, D.K.T.; Silva, L.D.P.; Barbosa, P.P.M.; Komesu, A.; Ferreira, N.R.; Oliveira, J.A.R. Microbial lipid based biorefinery concepts: A review of status and prospects. Foods 2023, 12, 2074. [Google Scholar] [CrossRef] [Scilit] [PubMed]
  27. Ferreira, G.F.; Ríos Pinto, L.F.; Maciel Filho, R.; Fregolente, L.V. A review on lipid production from microalgae: Association between cultivation using waste streams and fatty acid profiles. Renew. Sustain. Energy Rev. 2019, 109, 448–466. [Google Scholar] [CrossRef] [Scilit]
  28. Nguyen, Q.D.; Nguyen, T.-V.-L.; Tran, T.T.V.; Khatri, Y.; Chandrapala, J.; Truong, T. Single cell oils from oleaginous yeasts and metabolic engineering for potent cultivated lipids: A review with food application perspectives. Future Foods 2025, 11, 100658. [Google Scholar] [CrossRef] [Scilit]
  29. Byrne, E.; Kovacs, K.; van Niel, E.W.J.; Willquist, K.; Svensson, S.E.; Kreuger, E. Reduced use of phosphorus and water in sequential dark fermentation and anaerobic digestion of wheat straw and the application of ensiled steam-pretreated lucerne as a macronutrient provider in anaerobic digestion. Biotechnol. Biofuels 2018, 11, 281. [Google Scholar] [CrossRef] [Scilit] [PubMed]
  30. Koruyucu, A.; Peest, T.; Korzin, E.; Gröninger, L.; Patricia; Brück, T.; Weuster-Botz, D. Cell disruption and hydrolysis of Microchloropsis salina biomass as a feedstock for fermentation. Appl. Sci. 2024, 14, 9667. [Google Scholar] [CrossRef] [Scilit]
  31. Novak, K.; Neuendorf, C.S.; Kofler, I.; Kieberger, N.; Klamt, S.; Pflügl, S. Blending industrial blast furnace gas with H2 enables Acetobacterium woodii to efficiently co-utilize CO, CO2 and H2. Bioresour. Technol. 2021, 323, 124573. [Google Scholar] [CrossRef] [Scilit] [PubMed]
  32. Tarraran, L.; Agostino, V.; Vasile, N.S.; Azim, A.A.; Antonicelli, G.; Baker, J.; Millard, J.; Re, A.; Menin, B.; Tommasi, T.; et al. High-pressure fermentation of CO2 and H2 by a modified Acetobacterium woodii. J. CO2 Util. 2023, 76, 102583. [Google Scholar] [CrossRef] [Scilit]
  33. Straub, M.; Demler, M.; Weuster-Botz, D.; Dürre, P. Selective enhancement of autotrophic acetate production with genetically modified Acetobacterium woodii. J. Biotechnol. 2014, 178, 67–72. [Google Scholar] [CrossRef] [Scilit] [PubMed]
  34. Liew, F.; Henstra, A.M.; Köpke, M.; Winzer, K.; Simpson, S.D.; Minton, N.P. Metabolic engineering of Clostridium autoethanogenum for selective alcohol production. Metab. Eng. 2017, 40, 104–114. [Google Scholar] [CrossRef] [Scilit] [PubMed]
  35. Acuña López, P.; Rebecchi, S.; Vlaeminck, E.; Quataert, K.; Frilund, C.; Laatikainen-Luntama, J.; Hiltunen, I.; De Winter, K.; Soetaert, W.K. Demonstrating pilot-scale gas fermentation for acetate production from biomass-derived syngas streams. Fermentation 2024, 10, 285. [Google Scholar] [CrossRef] [Scilit]
  36. Rosenbaum, F.P.; Müller, V. Energy conservation under extreme energy limitation: The role of cytochromes and quinones in acetogenic bacteria. Extremophiles 2021, 25, 413–424. [Google Scholar] [CrossRef] [Scilit]
  37. Druzynska, M.; Lenar, N.; Paczosa-Bator, B. Advances in Reference Membranes for Potentiometric Sensing Applications. Membranes 2025, 15, 376. [Google Scholar] [CrossRef] [Scilit]
  38. Rinn, P.; Boruta, F.; Czermak, P.; Ebrahimi, M. Fouling Control of Ion-Selective Electrodes (ISEs) in Aquatic and Aquacultural Environments: A Comprehensive Review. Sensors 2025, 25, 7515. [Google Scholar] [CrossRef] [Scilit]
  39. Liu, Z.; Zhao, H.; Jiang, T.; Qin, W. Influences of marine biofouling on the potential responses of polymeric membrane ion-selective electrodes. Sens. Actuators B Chem. 2025, 422, 136692. [Google Scholar] [CrossRef] [Scilit]
  40. Bertsch, J.; Müller, V. Bioenergetic constraints for conversion of syngas to biofuels in acetogenic bacteria. Biotechnol. Biofuels 2015, 8, 210. [Google Scholar] [CrossRef] [Scilit]
  41. Heijstra, B.D.; Leang, C.; Juminaga, A. Gas fermentation: Cellular engineering possibilities and scale up. Microb. Cell Fact. 2017, 16, 60. [Google Scholar] [CrossRef] [Scilit] [PubMed]
  42. Takors, R.; Kopf, M.; Mampel, J.; Bluemke, W.; Blombach, B.; Eikmanns, B.; Bengelsdorf, F.R.; Weuster-Botz, D.; Dürre, P. Using gas mixtures of CO, CO2 and H2 as microbial substrates: The do’s and don’ts of successful technology transfer from laboratory to production scale. Microb. Biotechnol. 2018, 11, 606–625. [Google Scholar] [CrossRef] [Scilit]
  43. Peters, V.; Janssen, P.H.; Conrad, R. Efficiency of hydrogen utilization during unitrophic and mixotrophic growth of Acetobacterium woodii on hydrogen and lactate in the chemostat. FEMS Microbiol. Ecol. 1998, 26, 317–324. [Google Scholar] [CrossRef]
  44. Moon, J.; Donig, J.; Kramer, S.; Poehlein, A.; Daniel, R.; Müller, V. Formate metabolism in the acetogenic bacterium Acetobacterium woodii. Environ. Microbiol. 2021, 23, 4214–4227. [Google Scholar] [CrossRef] [Scilit]
  45. Garner, F.H.; Ellis, S.R.M. Extraction of acetic acid from water 2. ethyl acetate—Acetic acid water. Chem. Eng. Sci. 1953, 282, 282–286. [Google Scholar] [CrossRef] [Scilit]
  46. Park, S.-J.; Moon, J.-K.; Um, B.-H. Evaluation of the efficiency of solvent systems to remove acetic acid derived from pre-pulping extraction. J. Korean Wood Sci. Technol. 2013, 41, 447–455. [Google Scholar] [CrossRef] [Scilit]
  47. Cebreiros, F.; Guigou, M.D.; Cabrera, M.N. Integrated forest biorefineries: Recovery of acetic acid as a by-product in the production of bioethanol from green liquor extracted eucalyptus chips. In Proceedings of the 7th International Colloquium on Eucalyptus Pulp, Vitoria, Brazil, 26–29 May 2015. [Google Scholar]
  48. Tönjes, S.; Uitterhaegen, E.; De Winter, K.; Soetaert, W. Reactive extraction technologies for organic acids in industrial fermentation processes—A review. Sep. Purif. Technol. 2025, 356, 129881. [Google Scholar] [CrossRef] [Scilit]
  49. Atasoy, M.; Owusu-Agyeman, I.; Plaza, E.; Cetecioglu, Z. Bio-based volatile fatty acid production and recovery from waste streams: Current status and future challenges. Bioresour. Technol. 2018, 268, 773–786. [Google Scholar] [CrossRef] [Scilit]
  50. Yuan, Z.; Li, G.; Hegg, E.L. Enhancement of sugar recovery and ethanol production from wheat straw through alkaline pre-extraction followed by steam pretreatment. Bioresour. Technol. 2018, 266, 194–202. [Google Scholar] [CrossRef] [Scilit] [PubMed]
  51. Robles-Iglesias, R.; Nicaud, J.M.; Veiga, M.C.; Kennes, C. Integrated fermentative process for lipid and beta-carotene production from acetogenic syngas fermentation using an engineered oleaginous Yarrowia lipolytica yeast. Bioresour. Technol. 2023, 389, 129815. [Google Scholar] [CrossRef] [Scilit]
  52. Hu, P.; Chakraborty, S.; Kumar, A.; Woolston, B.; Liu, H.; Emerson, D.; Stephanopoulos, G. Integrated bioprocess for conversion of gaseous substrates to liquids. Proc. Natl. Acad. Sci. USA 2016, 113, 3773–3778. [Google Scholar] [CrossRef] [Scilit] [PubMed]
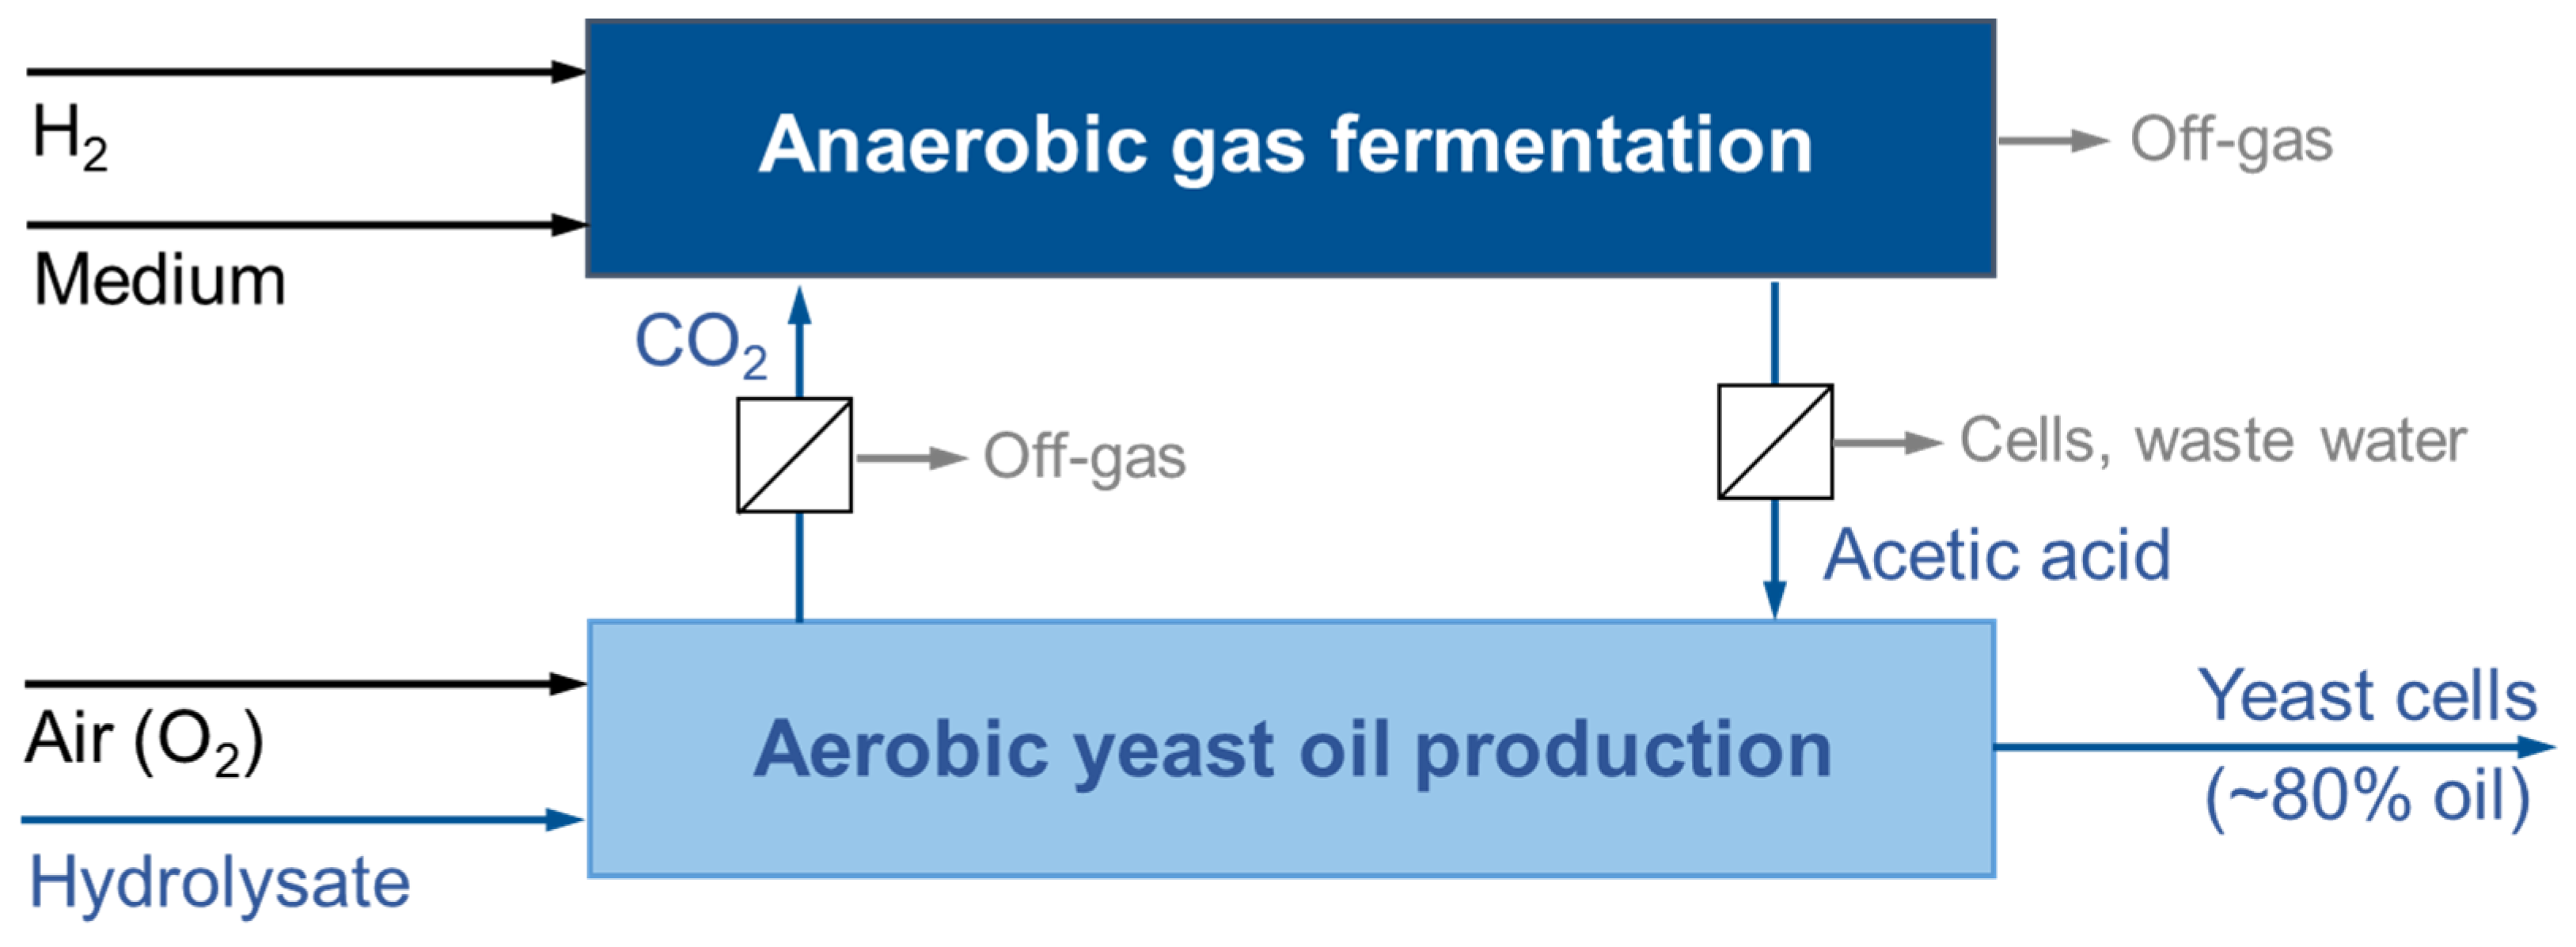
Figure 1. Concept for an integrated production of yeast oil from lignocellulosic hydrolysate by combining aerobic yeast oil production with C. oleaginosus and anaerobic gas fermentation with A. woodii, interconnected by CO2 released from the aerobic yeast oil production, and acetic acid produced in the anaerobic gas fermentation. The separation of acetic acid from the anaerobic fermentation broth and CO2 from the aerobic gas phase is indicated.
Fermentation 12 00229 g001
Figure 2. Repeated-batch process with A. woodii in a STR with continuous gassing with 700 mbar H2 and 300 mbar CO2: (a) cell dry weight concentration, (b) acetate concentration (gray lines represent interpolated acetate concentrations estimated with a sigmoidal function), (c) redox potential, and (d) recorded process time of the base pump to achieve the set-point of pH 7.0 for each repeated-batch process (incoming gas flow rate of 5 L h−1, T = 30 °C, P = 1 bar, V = 1 L). The blue lines represent the time points at which 80% of the cultivation broth was harvested, and the STR was refilled with 800 mL of fresh medium. The red line indicates a redox potential of −400 mV. The fourth batch process is indicated in gray due to the interruption (technical failure) of the gas supply shortly after medium exchange.
Fermentation 12 00229 g002
Figure 3. Repeated-batch process with A. woodii in a STR with continuous gassing with 700 mbar H2 and 300 mbar CO2: (a) CO2 uptake rate, (b) H2 uptake rate, and (c) flow rate of the exhaust gas (incoming gas flow rate of 5 L h−1, T = 30 °C, P = 1 bar, V = 1 L). The blue lines represent the time points at which 80% of the cultivation broth was harvested, and the STR was refilled with 800 mL of fresh medium. The green line indicates the incoming gas flow rate of 5.0 L h−1. The fourth batch process is indicated in gray due to the interruption (technical failure) of the gas supply shortly after medium exchange.
Fermentation 12 00229 g003
Figure 4. Mass flows for 6.5 days operation of an integrated production of yeast oil from lignocellulosic hydrolysate by combining aerobic yeast oil production with C. oleaginosus on a 1 m3-scale (batch process with pH-controlled acetic acid feeding) and anaerobic gas fermentation with A. woodii (repeated batch processes), with a 3.08 higher working volume, interconnected by CO2 released from the aerobic yeast oil production, and acetic acid produced in the anaerobic gas fermentation. The separation of acetic acid from the anaerobic fermentation broth and CO2 from the aerobic gas phase is indicated. Full consumption of H2/CO2 is assumed in the anaerobic fermentation process (for more details, see text).
Fermentation 12 00229 g004
Table 1. Process performance data of the repeated batches performed with A. woodii in a STR with continuous gassing. The fourth batch process was not evaluated due to a technical failure of the gas supply shortly after medium exchange. Some process performance indicators of the fifth repeated batch process are not available due to temporarily missing off-gas flow rate data. The maximum gas uptake rates are given as the mean rates integrated over a time period of 2 h. The first process is diplayed in gray because it is not used for the determination of average values as it is the initiating process.
Process12345678Mean 5–8
Process time, d2.976.175.82-5.766.216.966.996.5 ± 0.5
CDWinitial, g L−10.210.240.25-0.260.200.320.120.23 ± 0.07
CDWmax, g L−11.371.081.11-1.501.421.391.511.46 ± 0.05
CDWfinal, g L−10.880.910.92-1.391.251.341.461.36 ± 0.08
CDWproduced, g L−10.670.670.67-1.131.051.021.341.14 ± 0.13
cAcetate,initial, g L−10.008.619.82-6.1712.6411.897.639.6 ± 2.7
cAcetate,final, g L−137.3638.3243.65-47.8848.8448.1948.2348.3 ± 0.4
cAcetate,produced, g L−137.3629.7133.83-41.7136.2036.3040.6038.7 ± 2.5
QAcetate,max, g L−1 d−123.548.578.12-13.639.909.9512.8011.6 ± 1.7
Base pump, s726.9646.5667.7-875.5728.5690.5827.5780.5 ± 74.2
Base pump/cAcetate,produced, s L g−119.4621.7619.74-20.9920.1219.0220.3820.1 ± 0.7
CO2 URmax, mmol L−1 h−147.517.618.4-28.619.518.023.822.5 ± 4.1
H2 URmax, mmol L−1 h−1102.641.042.7-64.145.543.557.152.6 ± 8.4
H2 URmax/CO2 URmax, -2.162.332.32-2.242.332.422.402.4 ± 0.1
Gas flow rate min, NL h−11.633.693.63-2.933.553.623.193.3 ± 0.3
Gas consumption max, NL h−13.371.311.37-2.071.451.381.811.7 ± 0.3
YieldCO2,max, % (n/n)36.013.315.0--15.111.814.313.7 ± 1.4
YieldH2,max, % (n/n)34.515.216.7--16.614.017.516.0 ± 1.5
Carbon recovery, %84.595.594.9--98.797.591.595.9 ± 3.2
Electron recovery, %104.892.598.1--109.1110.0107.9109.0 ± 0.9
Disclaimer/Publisher’s Note: The statements, opinions and data contained in all publications are solely those of the individual author(s) and contributor(s) and not of MDPI and/or the editor(s). MDPI and/or the editor(s) disclaim responsibility for any injury to people or property resulting from any ideas, methods, instructions or products referred to in the content.