
Article

Functional Valorization and Bioactivity Enhancement of Spent Coffee Grounds Through Lactic Acid Fermentation

1
Department of Food Science and Nutrition, Kyungpook National University, 80 Daehak-ro, Buk-gu, Daegu 41566, Republic of Korea
2
Department of Food and Nutrition, Gimcheon University, 214 Daehak-ro, Gimcheon 39528, Republic of Korea
*
Author to whom correspondence should be addressed.
Fermentation 2026, 12(2), 96; https://doi.org/10.3390/fermentation12020096
Submission received: 7 January 2026 / Revised: 30 January 2026 / Accepted: 5 February 2026 / Published: 8 February 2026
(This article belongs to the Section Probiotic Strains and Fermentation)

Abstract

Spent coffee grounds are an abundant agro-industrial by-product with considerable potential as a functional food ingredient. This study investigated the effects of lactic acid fermentation on the antioxidant and anti-inflammatory activities of spent coffee grounds, as evaluated using their extracts, with a focus on fermentation-induced remodeling of phenolic compounds and the functional implications. Fermentation was conducted using Lactobacillus plantarum, and changes in microbial growth, pH, reducing sugar content, phenolic composition, antioxidant capacity, and anti-inflammatory activity were evaluated. During fermentation, viable cell counts increased from 6.73 log colony-forming units (CFU)/mL at 0 h to 9.27 log CFU/mL at 48 h, accompanied by a decrease in pH and an increase in reducing sugar content, indicating active microbial metabolism. Total polyphenol content increased markedly, reaching 97.44 mg gallic acid equivalents (GAE)/100 g in water extracts fermented for 48 h compared with 62.96 mg GAE/100 g in non-fermented controls. High-performance liquid chromatography analysis revealed significant enrichment of phenolic acids, including caffeic, ferulic, and protocatechuic acids. Correspondingly, fermented extracts exhibited enhanced antioxidant activities, as determined by 2,2-diphenyl-1-picrylhydrazyl (DPPH), 2,2′-azino-bis(3-ethylbenzothiazoline-6-sulfonic acid) (ABTS), ferric reducing antioxidant power (FRAP), superoxide dismutase (SOD-like, and catalase assays. In addition, fermented extracts showed improved cellular compatibility and significantly inhibited nitric oxide production (approximately 50–60% at 200–300 μg/mL) and pro-inflammatory cytokine production, with interleukin-6 (IL-6) and tumor necrosis factor-α (TNF-α) inhibition rates exceeding 60% at 200–300 μg/mL in lipopolysaccharide (LPS)-stimulated RAW 264.7 macrophages. These biological effects were closely linked to fermentation-induced qualitative and quantitative changes in phenolic composition, providing mechanistic insight beyond simple activity enhancement. Overall, lactic acid fermentation enhances the functional properties of spent coffee grounds, highlighting their potential as upcycled, value-added ingredients for functional food and nutraceutical applications.

1. Introduction

Coffee is one of the most widely consumed beverages worldwide, valued for its distinctive aroma, flavor, and rich composition of bioactive compounds [1]. It is primarily produced from the beans of Coffea arabica and Coffea canephora (robusta), which contain physiologically active constituents such as caffeine and chlorogenic acids that are associated with various health-promoting effects [2]. With the continuous global increase in coffee consumption, the sustainable management of coffee processing by-products has become an important environmental and industrial challenge. Among these by-products, spent coffee grounds have attracted growing attention because they are reported to retain considerable amounts of phenolic compounds and other bioactive constituents, as well as nutritionally and functionally relevant macromolecules including proteins, lipids, and polysaccharides, indicating strong potential for valorization as functional ingredients rather than disposal as waste [2,3,4].
Among the bioactive constituents of coffee, phenolic acids are particularly noteworthy due to their potent antioxidant properties, including reactive oxygen species (ROS) scavenging, inhibition of lipid peroxidation, protection of intracellular glutathione, and modulation of inflammatory mediators [5,6]. These biological activities play a critical role in mitigating oxidative stress–related cellular damage and chronic inflammatory conditions [7]. Consequently, the recovery and functional enhancement of such compounds from coffee by-products has attracted increasing scientific interest. In line with a circular bioeconomy strategy, spent coffee grounds have been increasingly explored as antioxidant-rich resources for diverse applications, including incorporation into food matrices (e.g., bakery and cereal-based products), development of nutraceutical ingredients or extracts, and formulation of active biomaterials and cosmetic-related products, supporting their practical value beyond waste management [4,8]. These utilization trends underscore that phenolic compounds and related antioxidant constituents are key drivers of the functional potential of spent coffee grounds, thereby providing a clear rationale for focusing on phenolic remodeling and associated bioactivities.
Lactic acid bacteria are known to produce organic acids and hydrolytic enzymes, including β-glucosidase and ferulic acid esterase, which can facilitate the hydrolysis of glycosidic bonds in plant matrices and promote the release or modification of phenolic compounds during fermentation. Previous studies have demonstrated that such enzymatic and metabolic activities contribute to increased phenolic contents and enhanced antioxidant capacity in fermented plant substrates [9,10,11]. This eco-friendly bioprocessing approach has been widely recognized as a promising strategy for upgrading agro-industrial by-products into value-added functional materials [1,2]. Solid-state fermentation (SSF) using lactic acid bacteria has been widely applied to agro-industrial by-products and plant materials to enhance the release of bound phenolic compounds and improve antioxidant capacity, as demonstrated in studies on phenolics enrichment through SSF [12,13]. Recent reviews also highlight SSF as an effective strategy for valorizing renewable substrates by increasing bioactive compound content [14,15]. Recent state-of-the-art studies indicate that LAB-driven SSF can remodel phenolic composition through enzymatic hydrolysis and ester cleavage, leading to accumulation of low-molecular-weight phenolic acids and concomitant improvements in redox-related functional outcomes, although the magnitude and direction of these changes depend on the substrate matrix and fermentation conditions [16].
However, information remains limited regarding how lactic acid fermentation remodels the phenolic composition of spent coffee grounds under solid substrate conditions and how such compositional shifts are mechanistically linked to antioxidant and anti-inflammatory activities. Therefore, this study aimed to investigate the fermentation-induced transformation of phenolic compounds in spent coffee grounds using Lactobacillus plantarum KCTC 3108 and to evaluate its impact on antioxidant and anti-inflammatory functions. By integrating phenolic profiling with multiple antioxidant assays and macrophage-based inflammatory readouts, this work provides mechanistic insight into phenolic remodeling during lactic acid fermentation and its functional implications, supporting the valorization of spent coffee grounds as a sustainable ingredient for functional food and nutraceutical applications.

2. Materials and Methods

2.1. Materials

Spent coffee grounds derived from roasted Coffea arabica beans were obtained from a local coffee shop in Daegu, Republic of Korea (2022). Lactobacillus plantarum KCTC 3108 was obtained from the Korean Collection for Type Cultures (Jeongeup, Republic of Korea). De Man, Rogosa and Sharpe (MRS) broth and MRS agar were purchased from Oxoid (Hampshire, UK). 2,2-Diphenyl-1-picrylhydrazyl (DPPH, 0.2 mM), ABTS, Folin–Ciocalteu reagent, gallic acid, quercetin, glucose, 3,5-dinitrosalicylic acid (DNS) reagent, phenol, sulfuric acid, 2,4,6-tripyridyl-s-triazine (TPTZ), and high-performance liquid chromatography (HPLC) standards (caffeic acid, p-coumaric acid, ferulic acid, chlorogenic acid, and protocatechuic acid) were purchased from Sigma-Aldrich (St. Louis, MO, USA). RAW 264.7 murine macrophage cells were obtained from the Korean Cell Line Bank (Seoul, Republic of Korea). RPMI-1640 medium, fetal bovine serum (FBS), penicillin–streptomycin, and trypsin–EDTA were purchased from Gibco BRL (Rockville, MD, USA). MTT [3-(4,5-dimethylthiazol-2-yl)-2,5-diphenyltetrazolium bromide] was obtained from Sigma-Aldrich (St. Louis, MO, USA) and used for cell viability analysis. Mouse IL-6, TNF-α, and IL-1β ELISA kits were purchased from R&D Systems (Minneapolis, MN, USA). All other chemicals used were of analytical grade.

2.2. Preparation and Lactic Acid Fermentation of Spent Coffee Grounds

Spent coffee grounds derived from roasted Coffea arabica beans (Daegu, Korea, 2022) were dried at 60 °C for 24 h to reduce moisture variability (final moisture content: 13.74%), ground to pass through a 60-mesh sieve, and stored at −20 °C until use. For solid-state fermentation, 50 g (dry weight) of the prepared spent coffee grounds was placed into a 500 mL Erlenmeyer flask and sterilized by autoclaving at 121 °C for 15 min. Lactobacillus plantarum KCTC 3108 was activated by two successive subcultures in MRS broth at 37 °C for 18–24 h under anaerobic conditions. The viable cell concentration was determined by the plate count method using MRS agar and adjusted to approximately 1 × 10⁷ CFU/mL. The sterilized spent coffee grounds were aseptically inoculated with 4 mL of the bacterial suspension and mixed thoroughly. Fermentation was carried out statically at 37 °C for 24, 48, or 72 h, and all fermentation procedures were conducted in triplicate. At designated fermentation times (0, 24, 48, and 72 h), samples were serially diluted with sterile phosphate-buffered saline (PBS), spread onto MRS agar plates, and incubated at 37 °C for 48 h under anaerobic conditions. Colonies were counted, and viable cell numbers were expressed as log colony-forming units per milliliter (log CFU/mL).

2.3. Preparation of Spent Coffee Grounds Extracts

Fermented spent coffee grounds were extracted using either hot water or 70% (v/v) ethanol. Unfermented spent coffee grounds (CG) were sterilized and extracted under the same conditions and served as the control. For hot water extraction, the fermented or unfermented spent coffee grounds were mixed with distilled water at a ratio of 1:20 (w/v) and heated at 90 °C for 1 h. For ethanol extraction, the samples were mixed with 70% ethanol at the same ratio and extracted at room temperature for 24 h with continuous shaking. After extraction, the mixtures were centrifuged at 3000× g for 15 min to remove insoluble residues. The collected supernatants were filtered and concentrated under reduced pressure using a rotary evaporator (Eyela, Tokyo Rikakikai Co., Tokyo, Japan). The concentrated extracts were subsequently freeze-dried to obtain powdered extracts, which were stored at −20 °C until further analysis. Samples were classified according to fermentation time as unfermented spent coffee grounds (CG) and spent coffee grounds fermented for 24, 48, or 72 h (FCG24, FCG48, and FCG72). Extracts were further designated based on the extraction solvent, with “–W” indicating hot water extracts and “–E” indicating ethanol extracts. Accordingly, the samples were denoted as CG-W, CG-E, FCG24-W, FCG24-E, FCG48-W, FCG48-E, FCG72-W, and FCG72-E.

2.4. Reducing Sugar to Total Sugar Ratio and pH Measurement

Total sugar content was determined using the phenol–sulfuric acid method as described by Dubois et al. [17], with glucose used as the standard. Reducing sugar content was measured using the 3,5-dinitrosalicylic acid (DNS) method according to Miller [18], also using glucose as the standard. The reducing sugar to total sugar ratio (%) was calculated based on these values.
For pH measurement, 1 g of each sample was homogenized with 9 mL of distilled water, and the pH was measured using a calibrated pH meter (SevenCompact™ S220-Bio, Mettler–Toledo Inc., Zurich, Switzerland). All measurements were performed in triplicate.

2.5. Total Polyphenol and Flavonoid Contents

Total polyphenol content was determined using the Folin–Ciocalteu method with gallic acid as the standard, and the results were expressed as mg gallic acid equivalents (GAE) per 100 g of sample [19]. Total flavonoid content was measured using the aluminum chloride colorimetric method with quercetin as the standard, following the method described by Zhishen et al. [20].

2.6. HPLC Analysis of Phenolic Compounds

Phenolic compounds were quantified using high-performance liquid chromatography (HPLC; Shimadzu, Kyoto, Japan) equipped with a C18 column. The mobile phase consisted of 0.1% formic acid in water (solvent A) and acetonitrile (solvent B). Detection wavelengths were set at 280 and 320 nm. Caffeic acid, p-coumaric acid, ferulic acid, chlorogenic acid, and protocatechuic acid were used as authentic standards. Compound concentrations were calculated using external calibration curves and expressed as mg/g of extract.

2.7. Antioxidant Activities

2.7.1. DPPH Radical Scavenging Activity

DPPH radical scavenging activity was evaluated according to the method of Blois [21]. Each extract was prepared at concentrations of 50–500 μg/mL, and 100 μL of each extract (CG-W, CG-E, FCG24-W, FCG48-W, FCG72-W, FCG24-E, FCG48-E, and FCG72-E) was mixed with 100 μL of 0.2 mM DPPH solution. The reaction mixture was incubated in the dark at room temperature for 30 min, and absorbance was measured at 517 nm. Radical scavenging activity (%) was calculated relative to the control.

2.7.2. ABTS Radical Scavenging Activity

ABTS radical scavenging activity was determined according to the method described by Re et al. [22]. The ABTS+ working solution was adjusted to an absorbance of 0.70 ± 0.02 at 734 nm. Each extract (50–500 μg/mL, 100 μL) was mixed with 900 μL of the ABTS+ solution and incubated for 10 min at room temperature. Absorbance was measured at 734 nm, and scavenging activity (%) was calculated.

2.7.3. Ferric Reducing Antioxidant Power (FRAP)

FRAP activity was evaluated according to the method of Benzie and Strain [23]. The FRAP reagent was freshly prepared by mixing acetate buffer, TPTZ solution, and FeCl3·6H2O in a ratio of 10:1:1. Each extract was prepared at 50–400 μg/mL. An aliquot (50 μL) of each prepared extract was added to the reagent and incubated at 37 °C for 30 min. Absorbance was measured at 593 nm, and results were expressed as μmol Fe2+ equivalents per gram of extract.

2.7.4. SOD-like Activity

SOD-like activity was evaluated using the pyrogallol autoxidation method described by Marklund and Marklund [24]. Each extract was added to the reaction mixture containing pyrogallol, and the suppression of pyrogallol autoxidation was monitored spectrophotometrically. Results were expressed as SOD-like activity, calculated based on the percentage inhibition of autoxidation.

2.7.5. Catalase Activity

Catalase activity was determined according to the method of Aebi [25]. The reaction was initiated by adding each extract to a hydrogen peroxide solution, and the decrease in absorbance at 240 nm was recorded. Catalase activity was calculated based on the rate of hydrogen peroxide decomposition.

2.8. Anti-Inflammatory Activity

2.8.1. MTT Cell Viability Assay

Cell viability was evaluated using the MTT assay as described by Carmichael et al. [26]. RAW 264.7 macrophages were treated with each extract for 24 h. Subsequently, 20 μL of MTT solution (5 mg/mL) was added to each well and incubated at 37 °C for 4 h. The resulting formazan crystals were dissolved in 100 μL of dimethyl sulfoxide (DMSO), and absorbance was measured at 570 nm using a microplate reader (VersaMax, Molecular Devices, San Jose, CA, USA). Cell viability was expressed as a percentage relative to untreated control.

2.8.2. NO Production Inhibition

Nitric oxide (NO) production was quantified using the Griess reaction. RAW 264.7 cells were pretreated with each extract (0–300 μg/mL) for 1 h, stimulated with LPS (1 μg/mL), and incubated for 24 h. The supernatant was collected and mixed with Griess reagent, and absorbance was measured at 540 nm. Nitrite levels were calculated using a sodium nitrite standard curve. L-NAME (1 mM) served as the positive control.

2.8.3. Pro-Inflammatory Cytokines

Levels of the pro-inflammatory cytokines IL-6, TNF-α, and IL-1β in LPS-stimulated RAW 264.7 cells were measured using ELISA kits (R&D Systems, Minneapolis, MN, USA) according to the manufacturer’s instructions. Cytokine concentrations were calculated from standard curves provided with each kit.

2.9. Statistical Analysis

All data are presented as mean ± standard deviation (n = 3). Statistical significance was evaluated by one-way ANOVA followed by Duncan’s multiple range test (p < 0.05). Pearson’s correlation coefficients (r) were calculated to assess the relationships between chemical parameters (phenolic acids, total polyphenol content, and total flavonoid content) and functional indicators (DPPH, ABTS, FRAP, IL-6, IL-1β, and TNF-α). Correlation strength was classified as weak (|r| < 0.3), moderate (0.3 ≤ |r| < 0.7), or strong (|r| ≥ 0.7). Heatmap visualization of correlation coefficients was generated using Python (version 3.9) with the seaborn package (version 0.12.2).

3. Results

3.1. Viable Cell Count, pH, and Reducing Sugar Ratio

The viable cell counts of Lactobacillus plantarum increased significantly from 6.73 log colony-forming units (CFU)/mL at 0 h to 8.81 log CFU/mL at 24 h and 9.27 log CFU/mL at 48 h, indicating active microbial proliferation during the early to mid-fermentation stages (p < 0.05). A slight decrease to 9.05 log CFU/mL was observed at 72 h (Table 1). Concomitantly, the pH of the fermented samples decreased progressively with fermentation time, while the reducing sugar ratio increased throughout the fermentation period (Table 2). These changes were consistently observed across fermented samples at different time points.

3.2. Total Polyphenol and Total Flavonoid Contents

Total polyphenol and total flavonoid contents of spent coffee grounds extracts were significantly influenced by lactic acid fermentation (Table 2). Compared with non-fermented samples (CG), all fermented samples (FCG24, FCG48, and FCG72) exhibited markedly higher levels of polyphenols and flavonoids, demonstrating a clear fermentation-dependent enhancement. Both total polyphenol and flavonoid contents showed a general increasing trend with fermentation time, with the most pronounced increase observed at 48 h (p < 0.05). In particular, total polyphenol content increased from 62.96 mg GAE/100 g in CG-W to 97.44 mg GAE/100 g in FCG48-W, while total flavonoid content increased from 27.61 mg QE/100 g in CG-E to 53.81 mg QE/100 g in FCG48-E. Although ethanol extracts generally exhibited higher flavonoid contents than water extracts, the fermentation effect was more pronounced than the solvent effect, as evidenced by the consistent increase in both polyphenol and flavonoid contents across all fermented samples regardless of extraction solvent.

3.3. HPLC Quantification of Bioactive Compounds

High-performance liquid chromatography (HPLC) analysis revealed marked changes in the phenolic acid profiles of spent coffee grounds extracts following lactic acid fermentation (Table 3). Compared with non-fermented samples (CG), all fermented samples (FCG24, FCG48, and FCG72) exhibited significantly higher concentrations of major phenolic acids, including caffeic acid, ferulic acid, and protocatechuic acid (p < 0.05). The concentrations of individual phenolic acids increased markedly after fermentation, with significant enrichment observed at 48–72 h of fermentation. In particular, caffeic acid content increased from 2.83 mg/g in CG-W to 5.16 mg/g in FCG72-E, while ferulic acid increased from 0.78 mg/g to 1.73 mg/g over the fermentation period. Protocatechuic acid showed a similar trend, increasing from 0.66 mg/g in CG-W to 1.31 mg/g in FCG72-E. These increases were consistently observed in both water and ethanol extracts. Overall, fermented samples exhibited higher individual phenolic acid contents than non-fermented counterparts, with no further significant increase observed between 48 and 72 h for most phenolic acids. These results suggest that fermentation time exerts a stronger influence on phenolic acid enrichment than the extraction solvent under the conditions tested.

3.4. Antioxidant Activities

3.4.1. DPPH Radical Scavenging Activity

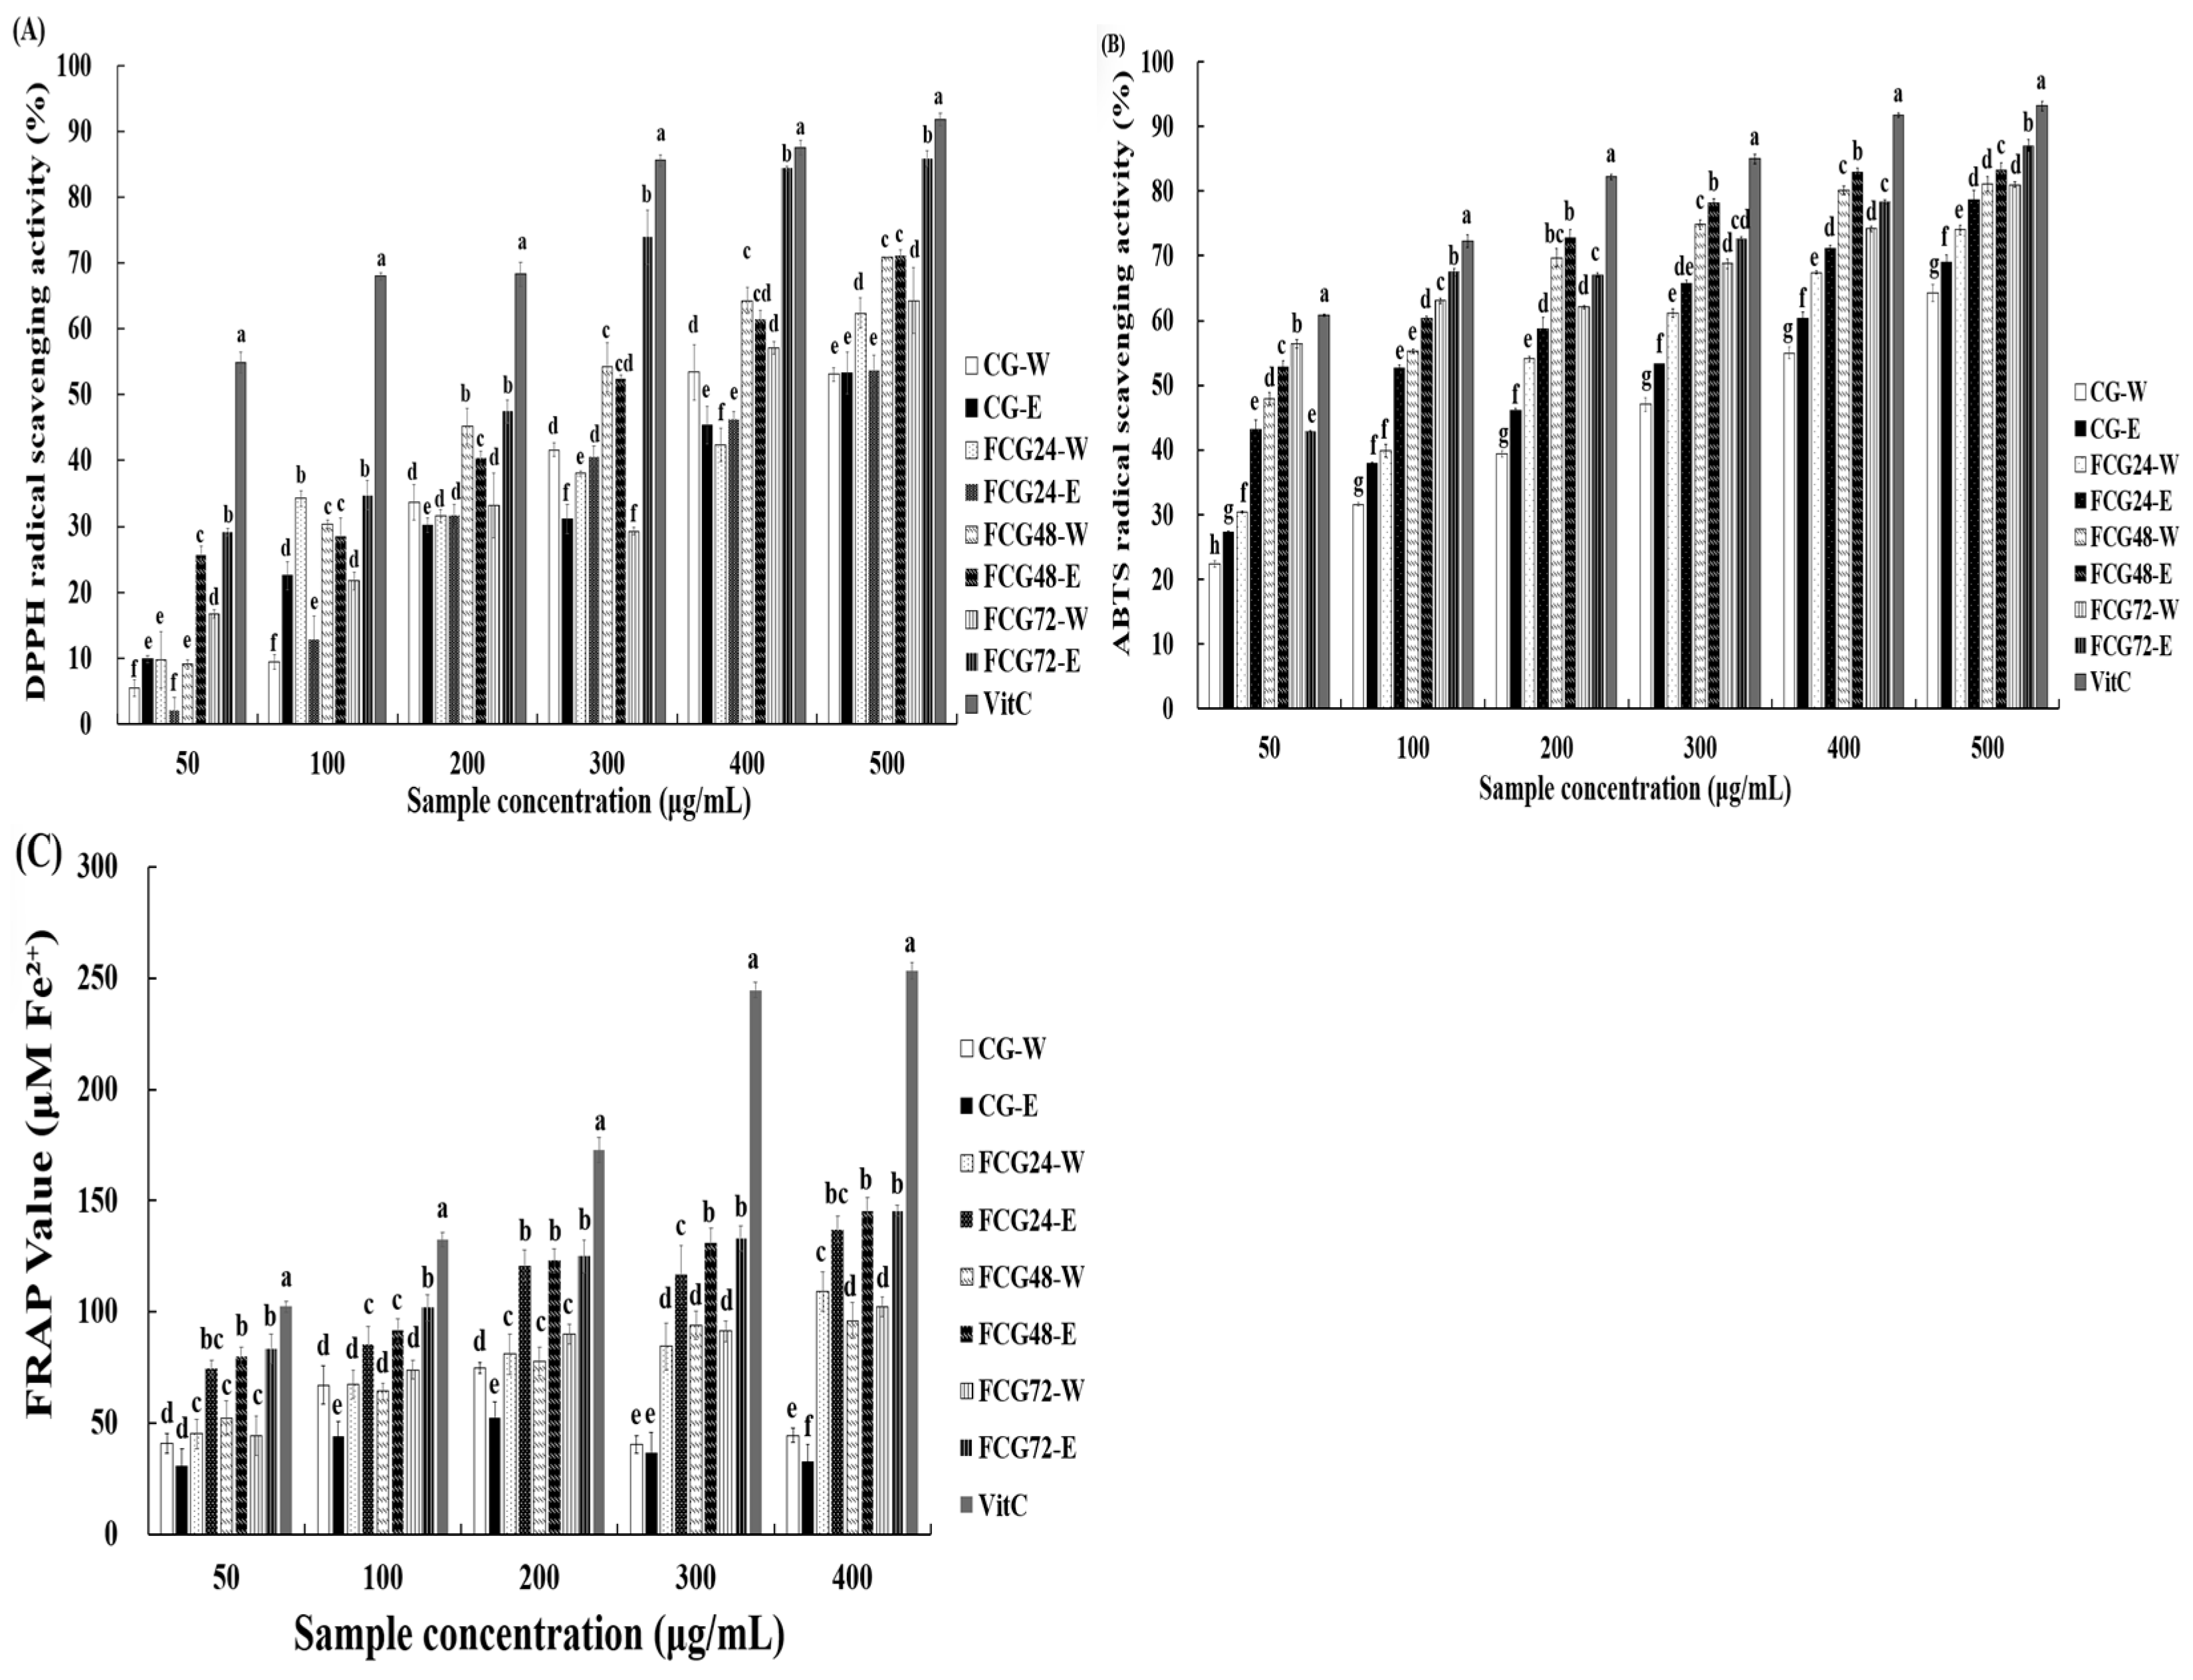
As shown in Figure 1A, fermented spent coffee grounds extracts exhibited higher DPPH radical scavenging activity than non-fermented extracts across the tested concentration range. In particular, ethanol extracts fermented for 48–72 h showed the strongest antioxidant activity. These improvements are likely attributable to fermentation-induced increases in phenolic compounds, which are known to contribute to free radical scavenging capacity.

3.4.2. ABTS Radical Scavenging Activity

As shown in Figure 1B, fermented spent coffee grounds extracts demonstrated higher ABTS radical scavenging activity than non-fermented extracts. Ethanol extracts fermented for 48–72 h exhibited the most pronounced activity. This enhanced ABTS radical scavenging capacity is likely related to the higher phenolic acid contents of ethanol extracts, reflecting the greater efficiency of ethanol in extracting phenolic compounds from both fermented and non-fermented spent coffee grounds.

3.4.3. Ferric Reducing Antioxidant Power (FRAP)

As shown in Figure 1C, fermented spent coffee grounds extracts exhibited greater ferric reducing antioxidant power than non-fermented extracts. Among the samples, ethanol extracts fermented for 72 h showed the highest reducing capacity, while water extracts displayed more moderate increases. This trend is consistent with the enhanced phenolic composition of fermented extracts, particularly in ethanol-soluble fractions.

3.4.4. SOD-like Activity

SOD-like activity increased in a concentration-dependent manner across all samples, with fermented extracts exhibiting significantly higher activity than non-fermented counterparts (p < 0.05) (Table 4). This enhancement may be attributed not only to increased total phenolic content but also to qualitative changes in phenolic composition induced by lactic acid fermentation.

3.4.5. Catalase Activity

Catalase activity reflects the enzymatic detoxification of hydrogen peroxide, a secondary reactive oxygen species generated during oxidative stress. In this study, catalase activity increased in a concentration-dependent manner across all samples, with fermented extracts exhibiting significantly higher activity than non-fermented counterparts (p < 0.05) (Table 4). Among the samples, fermented ethanol extracts showed the highest catalase activity, followed by fermented water extracts.

3.5. Anti-Inflammatory Activity

3.5.1. Cell Viability Analysis

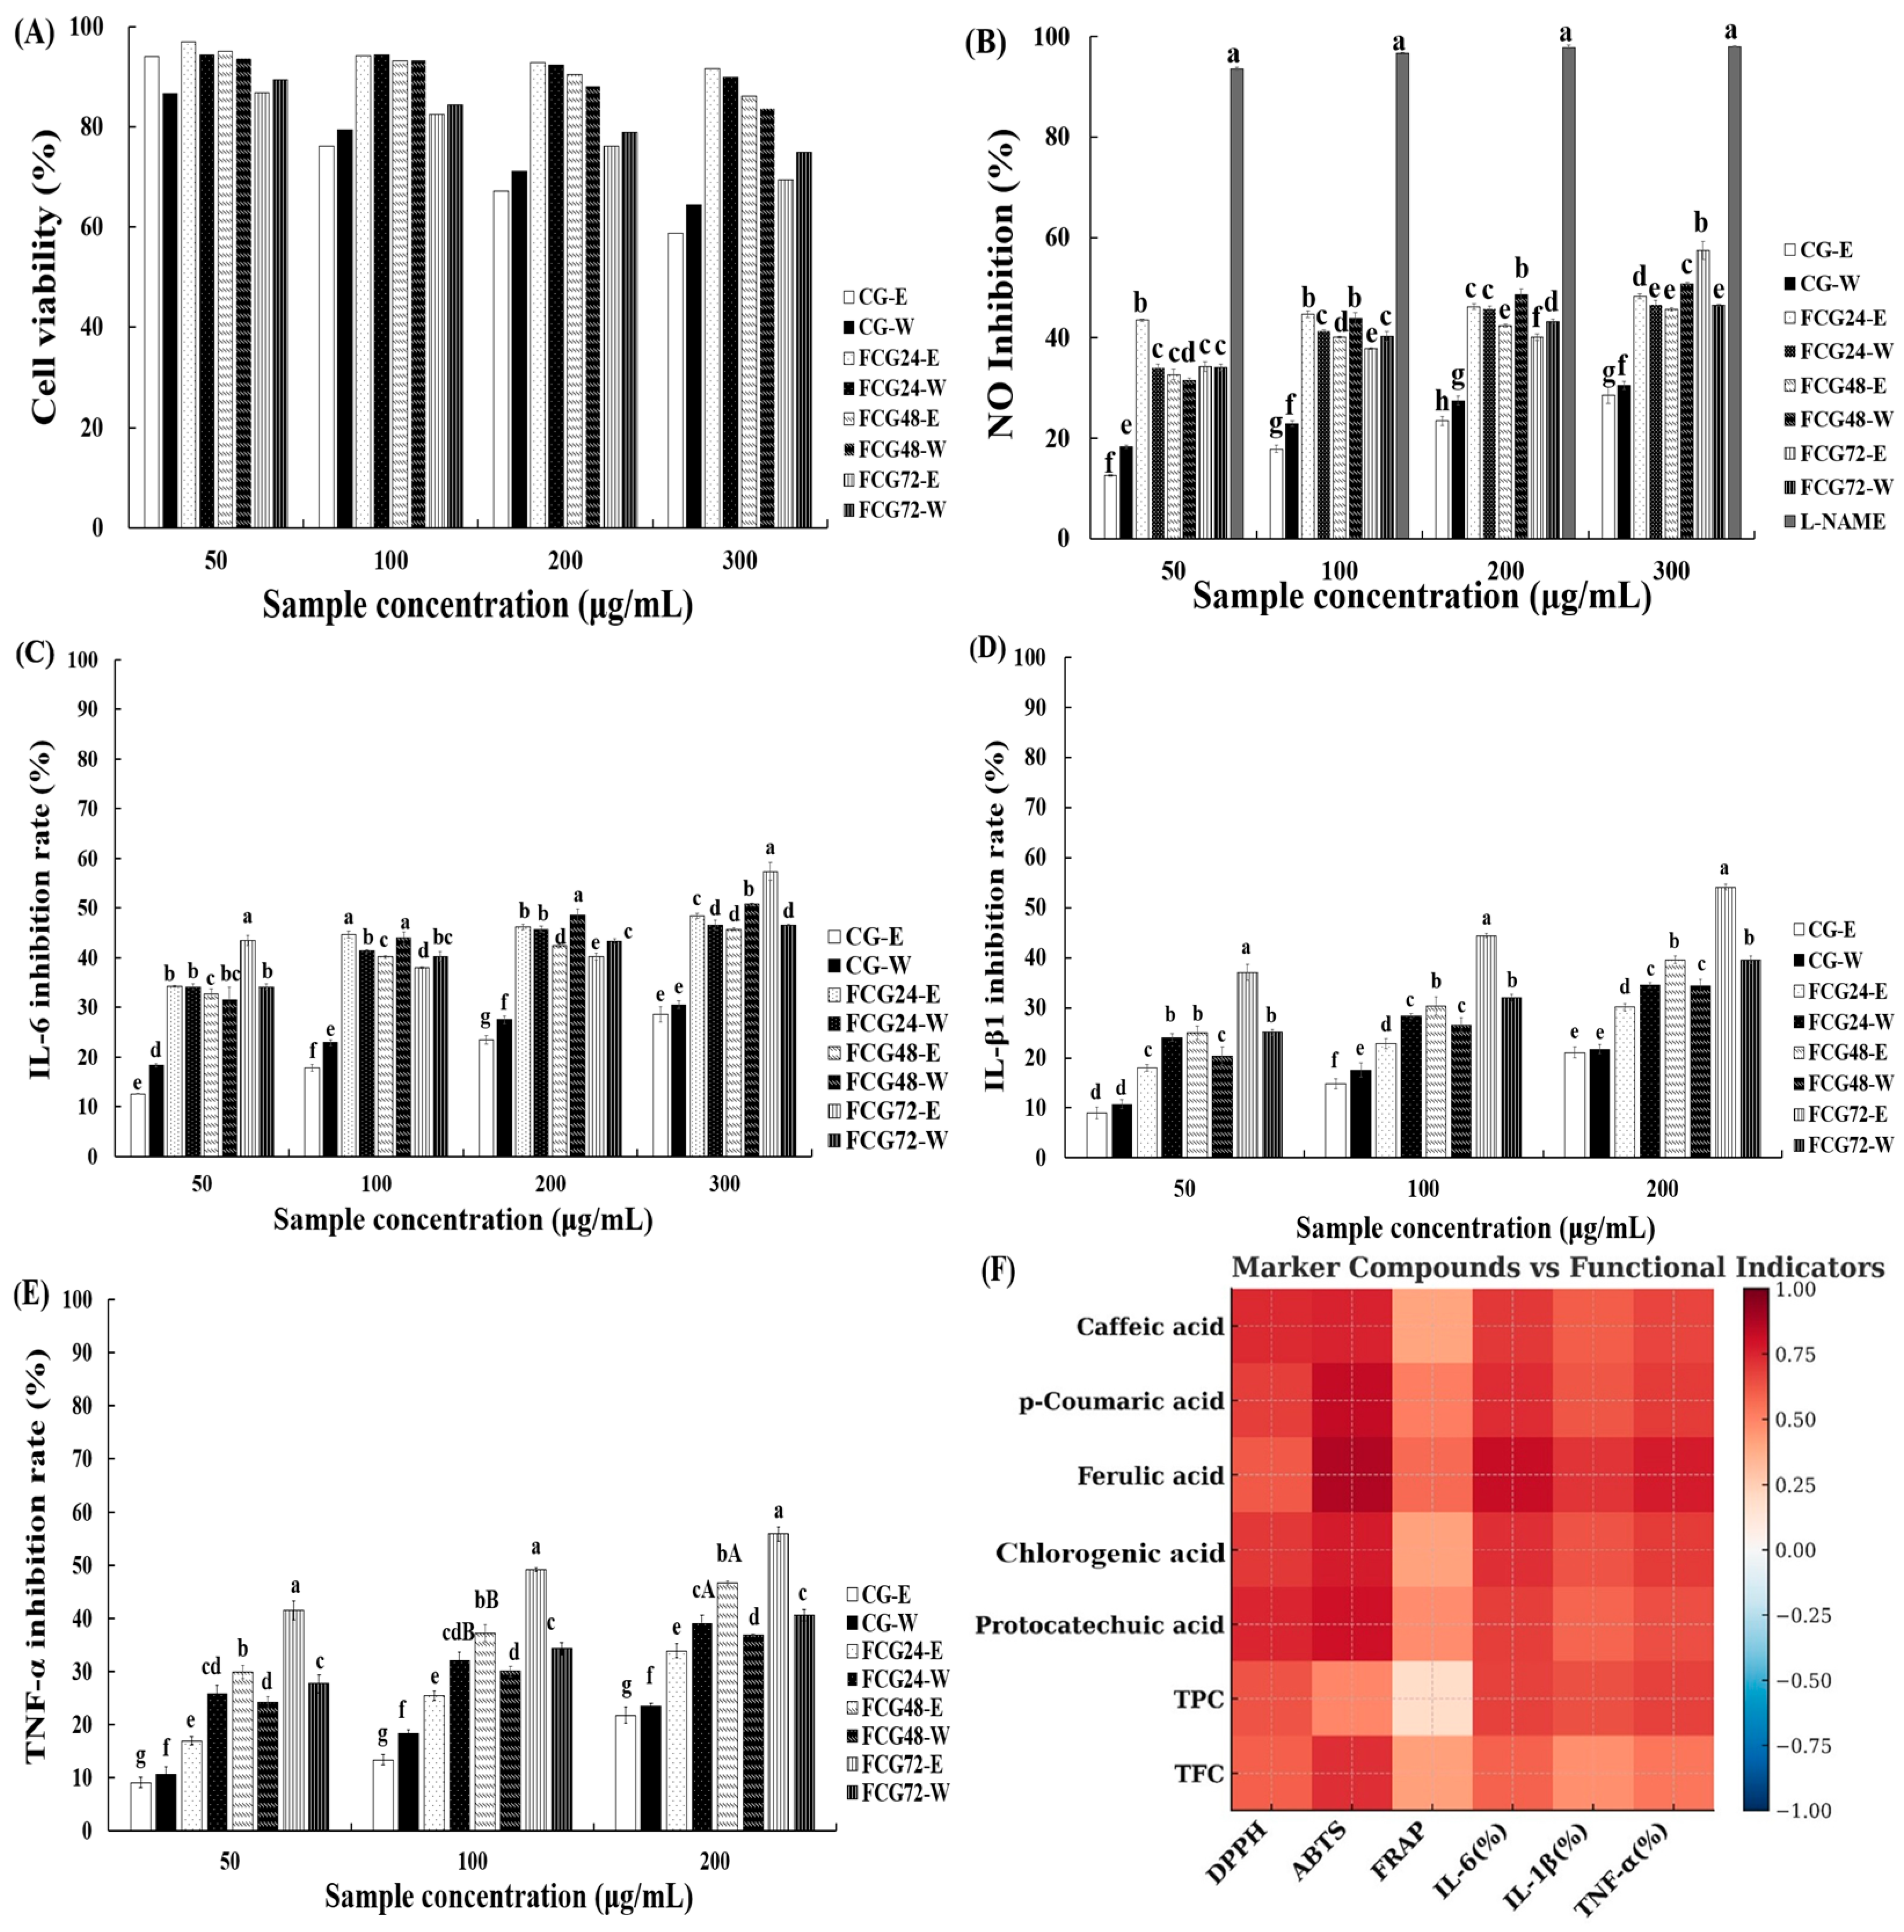
Cell viability of RAW 264.7 macrophages treated with extracts of non-fermented (CG) and fermented (FCG) spent coffee grounds was evaluated using the MTT assay (Figure 2A). At a concentration of 50 μg/mL, all samples exhibited cell viabilities exceeding 85%, indicating no cytotoxic effects at this concentration. At higher treatment levels, cell viability tended to decrease, with CG-treated cells exhibiting a greater reduction than FCG-treated cells. Specifically, CG reduced cell viability to approximately 70% at 200 μg/mL and below 60% at 400 μg/mL, whereas FCG maintained viability above 80% at 200 μg/mL and between 70 and 85% at 300 μg/mL. Based on these results, subsequent experiments were conducted at concentrations up to 300 μg/mL to ensure acceptable cell viability.

3.5.2. NO Production Inhibition

The inhibitory effects of CG and FCG extracts on nitric oxide (NO) production in LPS-stimulated RAW 264.7 murine macrophages are shown in Figure 2B. At 50 μg/mL, CG-W and CG-E showed less than 20% inhibition, whereas FCG24-E exhibited more than 40% inhibition. At 100 μg/mL, fermented extracts showed significantly greater inhibition (40–45%) than CG (<25%, p < 0.05). At higher concentrations (200–300 μg/mL), FCG samples maintained the highest inhibitory effects (approximately 50–60%).

3.5.3. Inhibition of Pro-Inflammatory Cytokine Production

The inhibitory effects of CG and FCG on IL-6, IL-1β, and TNF-α production in LPS-stimulated RAW 264.7 macrophages are presented in Figure 2C–E. For IL-6, FCG48-W and FCG48-E exhibited the strongest inhibition, showing more than 70% reduction at 300 μg/mL, which was significantly higher than that observed for non-fermented extracts (p < 0.05). For TNF-α, FCG48-E and FCG72-E showed pronounced inhibitory effects at 200 μg/mL, exceeding 60% inhibition. Although IL-1β inhibition was lower overall, fermented extracts, particularly FCG48-E, exhibited higher inhibitory activity than non-fermented extracts.

3.5.4. Correlation Between Phenolic Compounds and Functional Activities

Correlation analysis revealed strong positive relationships between individual phenolic acids and antioxidant activities (Figure 2F). In particular, ferulic, p-coumaric, and protocatechuic acids exhibited strong correlations (r > 0.7, p < 0.05) with DPPH, ABTS, and FRAP values, indicating their substantial contribution to radical scavenging capacity. In addition, total phenolic content showed strong negative correlations with IL-6, IL-1β, and TNF-α levels (r < −0.7, p < 0.05), supporting its involvement in anti-inflammatory activity. These findings are consistent with previous reports demonstrating that phenolic compounds contribute to the modulation of inflammatory responses through their antioxidant and signaling regulatory properties.

4. Discussion

The present study demonstrates that lactic acid fermentation with Lactobacillus plantarum KCTC 3108 enhances the functional properties of spent coffee grounds through coordinated physicochemical and compositional changes that are associated with improved antioxidant and anti-inflammatory activities. The observed increase in viable cell counts, together with the progressive decrease in pH and increase in reducing sugar ratio, reflects the successful establishment and progression of lactic acid fermentation. These trends are commonly reported indicators of lactic acid bacteria growth and fermentative activity in plant-derived substrates [27,28]. Spent coffee grounds are known to contain structural carbohydrates, primarily cellulose and hemicellulose-based polysaccharides, which are not readily fermentable by lactic acid bacteria in their native form [2,3]. However, previous studies have reported that lactic acid bacteria can contribute to the modification of complex plant carbohydrate matrices, primarily through the production of organic acids and the modulation of endogenous or associated glycosidase activities, thereby facilitating the release of soluble or low-molecular-weight carbohydrate fractions [29,30]. In this context, the increase in reducing sugar ratio observed during fermentation in the present study is interpreted as an indirect indicator of fermentation-associated matrix modification rather than direct assimilation of bulk structural carbohydrates. Collectively, these physicochemical shifts suggest that lactic acid fermentation created conditions conducive to microbial activity and to subsequent changes in the extractable fraction of bioactive constituents, thereby facilitating the functional enhancement observed in fermented spent coffee grounds.
HPLC profiling corroborated the fermentation-driven remodeling of the phenolic acid composition, showing progressive increases in caffeic acid, ferulic acid, and protocatechuic acid. Such shifts are consistent with reports that L. plantarum can enhance the liberation of bound phenolics and modify phenolic profiles through enzyme-mediated reactions [30,31]. Because these low-molecular-weight phenolic acids possess well-established redox properties, their enrichment provides a mechanistic basis for the subsequent enhancement of antioxidant performance. The generally higher concentrations observed in ethanol extracts further indicate that extraction solvent polarity interacts with fermentation-induced compositional changes to influence phenolic recovery.
In line with these compositional improvements, fermented extracts exhibited stronger antioxidant activities in DPPH and ABTS radical scavenging assays as well as higher reducing power in the FRAP assay. The concurrent enhancement across multiple antioxidant assays indicates that fermentation improves both radical quenching and electron-donating capacities, rather than producing assay-specific effects. Similar fermentation-associated increases in antioxidant activity have been reported in fermented plant-derived substrates, including Hizikia fusiforme water extract fermented with Lactobacillus brevis [32], supporting that fermentation-associated phenolic remodeling is a principal driver of enhanced antioxidant potential [30,33].
Beyond direct radical scavenging, fermentation also increased SOD-like and catalase activities, suggesting reinforcement of antioxidant defense mechanisms. SOD-like activity reflects the capacity to neutralize superoxide radicals, while catalase detoxifies hydrogen peroxide generated downstream of superoxide dismutation. Catalase is a key antioxidant enzyme that prevents oxidative damage by decomposing H2O2 into water and oxygen [25]. The elevated catalase activity observed in fermented samples implies that fermentation enhances antioxidant functionality not only through chemical scavenging but also by supporting enzymatic detoxification pathways. Phenolic compounds have been reported to modulate antioxidant enzyme systems and contribute to improved redox balance [34], which is consistent with the higher enzyme-related activities measured in fermented extracts.
The MTT assay indicated that fermented extracts maintained comparatively higher RAW 264.7 cell viability than non-fermented extracts at higher concentrations. This improved cellular compatibility is consistent with previous observations that lactic acid fermentation can mitigate cytotoxicity and enhance cellular tolerance in fermented plant materials [35]. Accordingly, the anti-inflammatory assays performed within the non-cytotoxic range provide a reliable basis for interpreting fermentation-associated improvements in immunomodulatory activity. Fermented extracts exhibited pronounced anti-inflammatory effects, including stronger inhibition of nitric oxide production and greater suppression of pro-inflammatory cytokines (IL-6, TNF-α, and IL-1β) in LPS-stimulated macrophages. These effects are mechanistically consistent with the enrichment of phenolic acids such as caffeic acid, and ferulic acid, which have been reported to downregulate inflammatory mediators by suppressing iNOS expression and NF-κB signaling in activated macrophages [5,36]. Similar reductions in cytokine secretion following lactic acid fermentation have also been reported in other fermented plant extracts [16,37].
Correlation analysis further supported the linkage between phenolic enrichment and functional outcomes. Strong positive correlations between phenolic acids and antioxidant indices, together with negative correlations between phenolic contents and inflammatory markers, indicate that fermentation-induced increases in key phenolics contribute substantially to both antioxidant and anti-inflammatory activities. In particular, the inverse correlations observed between specific phenolic acids (e.g., ferulic and protocatechuic acids) and cytokine levels are consistent with prior reports associating these compounds with attenuation of pro-inflammatory pathways [36,37]. Collectively, these findings substantiate that lactic acid fermentation enhances the biofunctional performance of spent coffee grounds primarily through phenolic remodeling and improved availability of redox-active compounds, rather than through direct evidence of structural biotransformation.
From an application perspective, these results highlight the potential of lactic acid fermentation as an effective upcycling strategy to convert spent coffee grounds, an abundant agro-industrial by-product, into value-added biofunctional ingredients. The enhanced antioxidant and anti-inflammatory properties observed in fermented spent coffee grounds suggest their applicability in functional food and nutraceutical formulations.

5. Conclusions

In this study, the effects of lactic acid fermentation on the functional properties of spent coffee grounds were evaluated, and an overall tendency toward enhanced antioxidant and anti-inflammatory activities was observed following fermentation. These functional changes were associated with fermentation-induced alterations in phenolic composition, with increases in specific phenolic acids showing correlations with reduced oxidative stress– and inflammation-related markers. Taken together, these findings suggest that lactic acid fermentation can influence the biofunctional characteristics of spent coffee grounds through phenolic remodeling. The present results indicate the potential of spent coffee grounds, an abundant coffee-processing by-product, to be valorized as a functional material, and suggest that lactic acid fermentation may serve as a promising upcycling approach for enhancing their functional attributes. However, further studies focusing on process optimization, standardization of bioactive components, and comprehensive biological validation are required to support practical applications. Such efforts would contribute to a clearer understanding of the industrial feasibility and functional relevance of fermented spent coffee grounds in food and nutraceutical contexts.

Author Contributions

Conceptualization, M.P. and K.-o.K.; methodology, M.P.; formal analysis, M.P.; investigation, M.P.; data curation, M.P.; writing—original draft preparation, M.P.; writing—review and editing, K.-o.K.; supervision, K.-o.K.; project administration, K.-o.K. All authors have read and agreed to the published version of the manuscript.

Funding

This research was funded by Gimcheon University, grant number gc23001. The APC was funded by Gimcheon University.

Institutional Review Board Statement

Not applicable.

Informed Consent Statement

Not applicable.

Data Availability Statement

The original contributions presented in this study are included in the article. Further inquiries can be directed to the corresponding author.

Acknowledgments

The authors would like to thank the laboratory staff for their technical support during the experiments. During the preparation of this manuscript, the authors used ChatGPT (OpenAI, GPT-4) for language editing and clarity improvement. The authors have reviewed and edited the content and take full responsibility for the final version of the manuscript.

Conflicts of Interest

The authors declare no conflicts of interest.

Abbreviations

ABTS2,2′-azino-bis(3-ethylbenzothiazoline-6-sulfonic acid)
CFUcolony-forming units
CGunfermented spent coffee grounds
DMSOdimethyl sulfoxide
DNS3,5-dinitrosalicylic acid
DPPH2,2-diphenyl-1-picrylhydrazyl
FBSfetal bovine serum
FCGfermented spent coffee grounds
FRAPferric reducing antioxidant power
GAEgallic acid equivalents
HPLChigh-performance liquid chromatography
IL-1βinterleukin-1 beta
IL-6interleukin-6
iNOSinducible nitric oxide synthase
L-NAMEN(G)-nitro-L-arginine methyl ester
LPSlipopolysaccharide
MRSDe Man, Rogosa and Sharpe
MTT3-(4,5-dimethylthiazol-2-yl)-2,5-diphenyltetrazolium bromide
NF-κBnuclear factor kappa B
NOnitric oxide
PBSphosphate-buffered saline
QEquercetin equivalents
RPMIRoswell Park Memorial Institute
TNF-αtumor necrosis factor-alpha
TPTZ2,4,6-tripyridyl-s-triazine

References

  1. Mussatto, S.I.; Ballesteros, L.F.; Martins, S.; Teixeira, J.A. Extraction of antioxidant phenolic compounds from spent coffee grounds. Sep. Purif. Technol. 2011, 83, 173–179. [Google Scholar] [CrossRef]
  2. Campos-Vega, R.; Loarca-Piña, G.; Vergara-Castañeda, H.A.; Oomah, B.D. Spent coffee grounds: A review on current research and future prospects. Trends Food Sci. Technol. 2015, 45, 24–36. [Google Scholar] [CrossRef]
  3. Ballesteros, L.F.; Teixeira, J.A.; Mussatto, S.I. Chemical, functional, and structural properties of spent coffee grounds and coffee silverskin. Food Bioprocess Technol. 2014, 7, 3493–3503. [Google Scholar] [CrossRef]
  4. Dordevic, D.; Gablo, N.; Zelenkova, L.; Dordevic, S.; Tremlova, B. Utilization of spent coffee grounds as a food by-product to produce edible films based on κ-carrageenan with biodegradable and active properties. Foods 2024, 13, 1833. [Google Scholar] [CrossRef]
  5. Shin, H.S.; Satsu, H.; Bae, M.J.; Zhao, Z.; Ogiwara, H.; Totsuka, M.; Shimizu, M. Anti-inflammatory effect of chlorogenic acid on IL-8 production in Caco-2 cells and dextran sulphate sodium-induced colitis in mice. Food Chem. 2015, 168, 167–175. [Google Scholar] [CrossRef]
  6. Tajik, N.; Tajik, M.; Mack, I.; Enck, P. The potential effects of chlorogenic acid, the main phenolic components in coffee, on health: A comprehensive review. Eur. J. Nutr. 2017, 56, 2215–2244. [Google Scholar] [CrossRef]
  7. Leyva-López, N.; Peraza-Arias, M.; Avalos-Soriano, A.; Hernández, C.; Lizárraga-Velázquez, C.E.; Heredia, J.B. Polyphenolic extracts from spent coffee grounds prevent H2O2-induced oxidative stress in Centropomus viridis brain cells. Molecules 2021, 26, 6195. [Google Scholar] [CrossRef] [PubMed]
  8. Martínez-Saez, N.; García, A.T.; Pérez, I.D.; Rebollo-Hernanz, M.; Mesías, M.; Morales, F.J.; Martín-Cabrejas, M.A.; del Castillo, M.D. Use of spent coffee grounds as food ingredient in bakery products. Food Chem. 2017, 216, 114–122. [Google Scholar] [CrossRef] [PubMed]
  9. Michlmayr, H.; Kneifel, W. β-Glucosidase activities of lactic acid bacteria: Mechanisms, impact on fermented food and human health. FEMS Microbiol. Lett. 2014, 352, 1–10. [Google Scholar] [CrossRef] [PubMed]
  10. Zhang, L.; Li, A.; Liu, H.; Mo, Q.; Zhong, Z. Effects of lactic acid bacteria fermentation on the release and biotransformation of bound phenolics in Ma bamboo shoots (Dendrocalamus latiflorus Munro). Foods 2025, 14, 2573. [Google Scholar] [CrossRef]
  11. Zhao, M.; Mu, Y.; Shi, Z.; Wang, X.; Liu, W.; Zhou, Y.; Yi, H.; Zhang, L.; Zhang, Z. Effects of different lactic acid bacteria on the physicochemical properties, functional characteristics and metabolic characteristics of fermented hawthorn juice. Food Chem. 2025, 470, 142672. [Google Scholar] [CrossRef]
  12. Bautista-Hernández, I.; Gómez-García, R.; Aguilar, C.N.; Martínez-Ávila, G.C.G.; Torres-León, C.; Chávez-González, M.L. Solid-state fermentation for phenolic compounds recovery from Mexican oregano (Lippia graveolens Kunth) residual leaves applying a lactic acid bacterium (Leuconostoc mesenteroides). Agriculture 2024, 14, 1342. [Google Scholar] [CrossRef]
  13. Sawangwan, T.; Porncharoennop, C.; Nimraksa, H. Antioxidant compounds from rice bran fermentation by lactic acid bacteria. AIMS Agric. Food 2021, 6, 578–587. [Google Scholar] [CrossRef]
  14. Yegin, S. Solid-state fermentation as a strategy for improvement of bioactive properties of the plant-based food resources. Bioresour. Bioprocess. 2025, 12, 140. [Google Scholar] [CrossRef]
  15. Sarıtaş, S.; Mondragon Portocarrero, A.C.; Miranda López, J.M.; Lombardo, M.; Koch, W.; Raposo, A.; El-Seedi, H.R.; de Brito Alves, J.L.; Esatbeyoglu, T.; Witkowska, A.M. The impact of fermentation on the antioxidant activity of food products. Molecules 2024, 29, 3941. [Google Scholar] [CrossRef] [PubMed]
  16. Choi, Y.E.; Yang, J.M.; Jeong, C.W.; Hur, H.S.; Cho, J.H. Immunomodulatory effect of Benincasa hispida extract fermented by Bacillus subtilis CJH 101 on RAW 264.7 macrophages. Fermentation 2023, 9, 701. [Google Scholar] [CrossRef]
  17. Dubois, M.; Gilles, K.A.; Hamilton, J.K.; Rebers, P.A.; Smith, F. Colorimetric method for determination of sugars and related substances. Anal. Chem. 1956, 28, 350–356. [Google Scholar] [CrossRef]
  18. Miller, G.L. Use of dinitrosalicylic acid reagent for determination of reducing sugar. Anal. Chem. 1959, 31, 426–428. [Google Scholar] [CrossRef]
  19. Singleton, V.L.; Rossi, J.A. Colorimetry of total phenolics with phosphomolybdic–phosphotungstic acid reagents. Am. J. Enol. Vitic. 1965, 16, 144–158. [Google Scholar] [CrossRef]
  20. Jia, Z.; Tang, M.; Wu, J. Determination of flavonoid contents in mulberry and their scavenging effects on superoxide radicals. Food Chem. 1999, 64, 555–559. [Google Scholar] [CrossRef]
  21. Blois, M.S. Antioxidant determinations by the use of a stable free radical. Nature 1958, 181, 1199–1200. [Google Scholar] [CrossRef]
  22. Re, R.; Pellegrini, N.; Proteggente, A.; Pannala, A.; Yang, M.; Rice-Evans, C. Antioxidant activity applying an improved ABTS radical cation decolorization assay. Free Radic. Biol. Med. 1999, 26, 1231–1237. [Google Scholar] [CrossRef] [PubMed]
  23. Benzie, I.F.F.; Strain, J.J. The ferric reducing ability of plasma (FRAP) as a measure of antioxidant power. Anal. Biochem. 1996, 239, 70–76. [Google Scholar] [CrossRef]
  24. Marklund, S.; Marklund, G. Involvement of the superoxide anion radical in the autoxidation of pyrogallol and a convenient assay for superoxide dismutase. Eur. J. Biochem. 1974, 47, 469–474. [Google Scholar] [CrossRef]
  25. Aebi, H. Catalase in vitro. Methods Enzymol. 1984, 105, 121–126. [Google Scholar] [CrossRef]
  26. Carmichael, J.; DeGraff, W.G.; Gazdar, A.F.; Minna, J.D.; Mitchell, J.B. Evaluation of a tetrazolium-based semi-automated colorimetric assay: Assessment of chemosensitivity testing. Cancer Res. 1987, 47, 936–942. [Google Scholar] [PubMed]
  27. Liu, L.; Zhang, C.; Zhang, H.; Qu, G.; Li, C.; Liu, L. Biotransformation of polyphenols in apple pomace fermented by β-glucosidase-producing Lactobacillus rhamnosus L08. Foods 2021, 10, 1343. [Google Scholar] [CrossRef]
  28. Zhao, Y.S.; Eweys, A.S.; Zhang, J.Y.; Zhu, Y.; Bai, J.; Darwesh, O.M.; Zhang, H.B.; Xiao, X. Fermentation affects the antioxidant activity of plant-based food material through the release and production of bioactive components. Antioxidants 2021, 10, 2004. [Google Scholar] [CrossRef]
  29. Gänzle, M.G. Enzymatic and bacterial conversions during sourdough fermentation. Food Microbiol. 2014, 37, 2–10. [Google Scholar] [CrossRef]
  30. Filannino, P.; Azzi, L.; Cavoski, I.; Vincentini, O.; Rizzello, C.G.; Gobbetti, M.; Di Cagno, R. Exploitation of the health-promoting and sensory properties of organic pomegranate (Punica granatum L.) juice through lactic acid fermentation. Int. J. Food Microbiol. 2013, 163, 184–192. [Google Scholar] [CrossRef] [PubMed]
  31. Rodríguez, H.; Curiel, J.A.; Landete, J.M.; de las Rivas, B.; de Felipe, F.L.; Gómez-Cordovés, C.; Mancheño, J.M.; Muñoz, R. Food phenolics and lactic acid bacteria. Int. J. Food Microbiol. 2009, 132, 79–90. [Google Scholar] [CrossRef]
  32. Song, H.S.; Eom, S.H.; Kang, Y.M.; Choi, J.D.; Kim, Y.M. Enhancement of the antioxidant and anti-inflammatory activity of Hizikia fusiforme water extract by lactic acid bacteria fermentation. Korean J. Fish. Aquat. Sci. 2011, 44, 111–117. [Google Scholar] [CrossRef]
  33. Hur, S.J.; Lee, S.Y.; Kim, Y.C.; Choi, I.; Kim, G.B. Effect of fermentation on the antioxidant activity in plant-based foods. Food Chem. 2014, 160, 346–356. [Google Scholar] [CrossRef]
  34. Rice-Evans, C.A.; Miller, N.J.; Paganga, G. Structure–antioxidant activity relationships of flavonoids and phenolic acids. Free Radic. Biol. Med. 1996, 20, 933–956. [Google Scholar] [CrossRef]
  35. Lee, H.W.; Jung, H.S.; Lee, N.K.; Paik, H.D. Anti-inflammatory effects of paraprobiotic Lactiplantibacillus plantarum KU15122 in LPS-induced RAW 264.7 cells. J. Microbiol. Biotechnol. 2024, 34, 1491–1500. [Google Scholar] [CrossRef] [PubMed]
  36. Kang, N.J.; Lee, K.W.; Shin, B.J.; Jung, S.K.; Hwang, M.K.; Bode, A.M.; Heo, Y.S.; Lee, H.J.; Dong, Z. Caffeic acid, a phenolic phytochemical in coffee, directly inhibits Fyn kinase activity and UVB-induced COX-2 expression. Carcinogenesis 2009, 30, 321–330. [Google Scholar] [CrossRef] [PubMed]
  37. Yu, P.; Ke, C.; Guo, J.; Zhang, X.; Li, B. Lactobacillus plantarum L15 alleviates colitis by inhibiting LPS-mediated NF-κB activation and ameliorates DSS-induced gut microbiota dysbiosis. Front. Immunol. 2020, 11, 575173. [Google Scholar] [CrossRef] [PubMed]
Figure 1. Antioxidant activity of spent coffee grounds extracts and fermented spent coffee grounds extracts. (A) DPPH radical scavenging activity, (B) ABTS radical scavenging activity, and (C) FRAP value. CG-W, CG-E: Water and ethanol extracts of non-fermented coffee grounds, respectively. FCG24-W, FCG48-W, FCG72-W: Water extracts of coffee grounds fermented for 24, 48, and 72 h, respectively. FCG24-E, FCG48-E, FCG72-E: Ethanol extracts of coffee grounds fermented for 24, 48, and 72 h, respectively. Values are presented as mean ± standard deviation (n = 3). Different lowercase letters indicate significant differences among samples (p < 0.05).
Fermentation 12 00096 g001
Figure 2. Anti-inflammatory and correlation analysis of fermented spent coffee grounds extracts. (A) Cell viability (%), (B) NO inhibition (%), (C) IL-6 inhibition rate (%), (D) IL-1β inhibition rate (%), (E) TNF-α inhibition rate (%), and (F) correlation heatmap between marker compounds and functional indicators. CG-W, CG-E: Water and ethanol extracts of non-fermented coffee grounds, respectively. FCG24-W, FCG48-W, FCG72-W: Water extracts of coffee grounds fermented for 24, 48, and 72 h, respectively. FCG24-E, FCG48-E, FCG72-E: Ethanol extracts of coffee grounds fermented for 24, 48, and 72 h, respectively. Different lowercase letters indicate significant differences among samples at the same concentration (p < 0.05). Different uppercase letters within the same sample indicate significant differences among different concentrations (p < 0.05) according to Duncan’s multiple range test. Positive correlations in (F) are shown in red and negative correlations in blue, with color intensity indicating the magnitude of correlation (ranging from −1.0 to +1.0). Significant correlations are indicated at p < 0.05.
Fermentation 12 00096 g002
Table 1. Changes in viable cell count (log CFU/mL) during lactic acid fermentation of spent coffee grounds with Lactobacillus plantarum.
Time (h)Viable Cell Count (log CFU/mL)
06.73 ± 0.06 d
248.81 ± 0.01 c
489.27 ± 0.04 a
729.05 ± 0.02 b
Values are expressed as mean ± standard deviation (n = 3). Different superscript letters within the same column indicate significant differences (p < 0.05) according to Duncan’s multiple range test.
Table 2. Physicochemical properties of fermented and non-fermented spent coffee grounds extracts.
SamplepHReducing Sugar/Total Sugar (%)Total Polyphenols
(mg GAE/100 g)
Total Flavonoids
(mg QE/100 g)
CG-W6.83 ± 0.02 a28.96 ± 1.81 d62.96 ± 2.16 d35.83 ± 5.43 c
CG-E6.80 ± 0.06 a30.01 ± 0.22 c74.08 ± 2.80 b27.61 ± 0.63 d
FCG24-W6.50 ± 0.02 ab30.00 ± 0.53 c68.21 ± 2.13 c34.75 ± 4.40 c
FCG24-E6.29 ± 0.02 b33.24 ± 0.39 b67.93 ± 2.31 c42.87 ± 3.97 b
FCG48-W6.20 ± 0.02 b30.09 ± 0.07 c97.44 ± 1.05 a54.14 ± 0.34 a
FCG48-E6.01 ± 0.03 c31.42 ± 0.25 c91.35 ± 0.13 b53.81 ± 0.34 a
FCG72-W5.90 ± 0.02 c32.76 ± 0.06 b97.26 ± 0.63 a53.89 ± 1.50 a
FCG72-E5.93 ± 0.05 c35.35 ± 0.31 a96.89 ± 0.08 a52.64 ± 1.14 a
CG-W and CG-E indicate water and ethanol extracts of non-fermented coffee grounds, respectively. FCG24-W, FCG48-W, and FCG72-W indicate water extracts of coffee grounds fermented for 24, 48, and 72 h, respectively. FCG24-E, FCG48-E, and FCG72-E indicate ethanol extracts of coffee grounds fermented for 24, 48, and 72 h, respectively. Values are expressed as mean ± standard deviation (n = 3). Different superscript letters within the same column indicate significant differences (p < 0.05) according to Duncan’s multiple range test.
Table 3. Contents of individual phenolic acids in fermented and non-fermented spent coffee grounds extracts determined by HPLC analysis.
SampleCaffeic Acid (mg/g)p-Coumaric Acid (mg/g)Ferulic Acid (mg/g)Chlorogenic Acid (mg/g)Protocatechuic Acid (mg/g)
CG-W2.83 ± 0.36 b1.35 ± 0.08 d0.78 ± 0.06 c0.92 ± 0.02 e0.66 ± 0.04 d
CG-E3.01 ± 0.33 b1.47 ± 0.06 d0.91 ± 0.32 b1.01 ± 0.02 d0.75 ± 0.05 d
FCG24-W3.24 ± 0.46 b1.69 ± 0.10 c1.24 ± 0.02 b1.12 ± 0.02 d0.84 ± 0.05 c
FCG24-E3.72 ± 0.79 b1.85 ± 0.03 c1.36 ± 0.13 a1.35 ± 0.02 c0.93 ± 0.08 c
FCG48-W4.36 ± 0.35 a2.02 ± 0.14 b1.55 ± 0.03 a1.58 ± 0.03 b1.05 ± 0.03 b
FCG48-E4.89 ± 0.44 a2.24 ± 0.08 a1.66 ± 0.13 a1.72 ± 0.12 a1.19 ± 0.05 a
FCG72-W4.52 ± 0.27 a2.11 ± 0.01 b1.58 ± 0.10 a1.63 ± 0.02 b1.12 ± 0.03 b
FCG72-E5.16 ± 0.36 a2.35 ± 0.07 a1.73 ± 0.03 a1.85 ± 0.08 a1.31 ± 0.06 a
CG-W and CG-E indicate water and ethanol extracts of non-fermented coffee grounds, respectively. FCG24-W, FCG48-W, and FCG72-W indicate water extracts of coffee grounds fermented for 24, 48, and 72 h, respectively. FCG24-E, FCG48-E, and FCG72-E indicate ethanol extracts of coffee grounds fermented for 24, 48, and 72 h, respectively. Values are expressed as mean ± standard deviation (n = 3) and are reported in mg/g. Different lowercase letters within the same column indicate significant differences among samples (p < 0.05).
Table 4. SOD-like activity and catalase activity of spent coffee grounds extracts and fermented samples.
SampleSOD-Like Activity (%)Catalase Activity (Units/mg Protein)
50 μg/mL300 μg/mL500 μg/mL50 μg/mL100 μg/mL300 μg/mL
CG-W10.81 ± 0.01 c22.57 ± 4.62 d41.89 ± 0.11 e12.37 ± 0.55 f15.42 ± 0.12 e17.26 ± 0.20 e
CG-E9.25 ± 0.43 d26.13 ± 1.39 b40.24 ± 0.31 f14.25 ± 0.17 d17.39 ± 0.71 d17.49 ± 0.23 e
FCG24-W12.16 ± 0.01 b27.03 ± 2.47 b40.54 ± 0.02 g15.83 ± 0.19 b18.94 ± 0.23 c18.63 ± 0.37 d
FCG24-E12.04 ± 0.02 b25.95 ± 2.66 ab44.59 ± 0.51 c16.32 ± 0.07 a19.05 ± 0.20 b18.89 ± 0.15 d
FCG48-W12.35 ± 0.31 b24.82 ± 3.46 bc43.24 ± 0.02 d14.67 ± 0.08 c17.53 ± 0.12 d21.15 ± 0.07 b
FCG48-E10.81 ± 0.01 c26.44 ± 0.62 b47.38 ± 0.08 b14.88 ± 0.09 c17.81 ± 0.07 d21.34 ± 0.08 b
FCG72-W9.46 ± 0.12 d24.10 ± 0.98 c43.24 ± 0.10 d13.11 ± 0.07 e18.86 ± 0.11 c20.15 ± 0.17 c
FCG72-E15.76 ± 0.01 a26.04 ± 0.16 b47.30 ± 0.06 b13.30 ± 0.04 e19.19 ± 0.04 b20.14 ± 0.10 c
Ascorbic acid18.81 ± 0.01 a33.66 ± 2.33 a56.76 ± 0.01 a15.86 ± 0.19 b20.86 ± 0.99 a23.35 ± 0.11 a
CG-W and CG-E indicate water and ethanol extracts of non-fermented coffee grounds, respectively. FCG24-W, FCG48-W, and FCG72-W indicate water extracts of coffee grounds fermented for 24, 48, and 72 h, respectively. FCG24-E, FCG48-E, and FCG72-E indicate ethanol extracts of coffee grounds fermented for 24, 48, and 72 h, respectively. Values are expressed as mean ± standard deviation (n = 3). Different lowercase letters within the same column indicate significant differences among samples at the same concentration (p < 0.05). Ascorbic acid was used as a reference antioxidant for SOD-like activity; its catalase-related values are presented for comparative reference only.
Disclaimer/Publisher’s Note: The statements, opinions and data contained in all publications are solely those of the individual author(s) and contributor(s) and not of MDPI and/or the editor(s). MDPI and/or the editor(s) disclaim responsibility for any injury to people or property resulting from any ideas, methods, instructions or products referred to in the content.