Article

Green Tea Modulates Temporal Dynamics and Environmental Adaptation of Microbial Communities in Daqu Fermentation

School of Brewing Engineering, Moutai Institute, Renhuai 564507, China
*
Author to whom correspondence should be addressed.
Fermentation 2025, 11(9), 511; https://doi.org/10.3390/fermentation11090511
Submission received: 2 August 2025 / Revised: 26 August 2025 / Accepted: 27 August 2025 / Published: 31 August 2025
(This article belongs to the Special Issue Development and Application of Starter Cultures, 2nd Edition)

Abstract

This study investigated the impact of green tea addition on microbial community dynamics during Daqu fermentation, a critical process in traditional baijiu production. Four Daqu variants (0%, 10%, 20%, 30% tea) were analyzed across six fermentation periods using 16S rRNA/ITS sequencing, coupled with STR, TDR, Sloan neutral model, and phylogenetic analyses. Results showed time-dependent increases in bacterial/fungal richness, with 30% tea maximizing species richness. Tea delayed bacterial shifts until day 15 but accelerated fungal reconstruction from day 6, expanding the temporal response window. While stochastic processes dominated initial assembly (77–94% bacteria, 88–99% fungi), deterministic processes intensified with tea concentration, particularly in fungi (1% → 12%). Tea increased bacterial dispersal limitation and reduced phylogenetic conservatism of endogenous factors. This work proposed a framework for rationally engineering fermentation ecosystems by decoding evolutionary-ecological rules of microbial assembly. It revealed how plant-derived additives can strategically adjust niche partitioning and ancestral constraints to reprogram microbiome functionality. These findings provided a theoretical foundation in practical strategies for optimizing industrial baijiu production through targeted ecological interventions.

1. Introduction

Baijiu, a traditional Chinese distilled spirit with over 2000 years of history, employs spontaneous solid-state fermentation using Daqu as the saccharification and fermentation starter. This cereal-based microbial consortium introduces essential microorganisms and enzymes that govern fragrance development and flavor formation during fermentation [1]. As the primary microbial inoculum, Daqu determines the microbial community structure throughout the fermentation stages, contributing 9.1–27.4% of bacterial biomass and 61.1–80.0% of fungal biomass to the fermentation ecosystem [2,3]. Beyond microbial provisioning, Daqu serves critical metabolic functions in ethanol production and aroma compound biosynthesis through its enzymatic repertoire [4]. The indigenous microbial communities inherent to raw materials and processing environments fundamentally shape Daqu’s biochemical characteristics during its production [5].
Raw material composition exerts profound impacts on fermentation dynamics and final product quality through multiple mechanisms. Variations in cereal substrates alter microbial succession patterns, enzyme system development, and precursor compound availability, ultimately determining the metabolic output of fermentation ecosystems [6]. Comparative studies demonstrate that distinct grains impart characteristic flavor profiles to fermented products through species-specific combinations of starch composition, protein content, and lipid fractions [7]. This material-dependent microbial selection has been documented across fermentation systems, with [8] reporting altered microbial consortia and sensory characteristics in spirits produced from different substrates, whereas Qiao et al. [9] observed substrate-driven divergence in microbial diversity and bioactive components during tea fermentation. These findings establish raw material optimization as a crucial strategy for improving Daqu quality through targeted microbial community engineering.
Recent innovations in Daqu production have investigated botanical additives as microbial and biochemical enhancers. Tea (Camellia sinensis), rich in polyphenols, amino acids, and bioactive compounds, shows particular promise due to its documented health benefits and microbial-modulating properties [10]. The phytochemical profile of green tea, marked by high catechin and theanine content, contributes both astringent bitterness and subtle sweetness. These compounds also confer antioxidant and antimicrobial activities [11]. In Moutai-flavored Daqu production, wheat-based raw materials harbor diverse microbial communities including Bacillus, Kosakonia, Weissella, Staphylococcus, Pediococcus, Pantoea, Aspergillus, Rhizopus, etc. [12,13,14]. Notably, dominant Daqu microbial taxa such as Bacillus, Aspergillus, and Rhizopus species demonstrate ecological compatibility with tea phyllosphere communities [15,16]. This phylogenetic overlap suggests the potential for tea supplementation to enhance microbial diversity in fermentation systems. Preliminary evidence [17] supports this hypothesis, with tea flower supplementation in light-aroma Daqu production yielding novel aroma compounds like phenethyl ketone and α-phenylethanol.
Building on these foundations, we investigate the microbial ecological impacts of green tea supplementation in Daqu manufactured according to traditional Moutai-flavored Daqu protocols. As the leading green tea production region in China [18], Guizhou Province provides both geographical relevance and material consistency for this investigation. Our study employs a 40-day fermentation protocol with varying tea: wheat ratios, integrating ITS/16S rRNA gene amplicon sequencing with physicochemical analyses to address three fundamental questions: (1) How does tea proportion influence temporal microbial succession patterns during Daqu fermentation? (2) Through what mechanisms do different tea ratios modify microbial community assembly processes? (3) Could the addition of green tea alter phylogenetic conservatism in microbial adaptation?
This systematic investigation advances our understanding of botanical supplementation effects on traditional fermentation ecosystems. By elucidating the relationships between tea composition, microbial dynamics, and environmental parameters, we establish a theoretical framework for optimizing Daqu production through targeted material formulation. Furthermore, our findings contribute to the broader comprehension of microbial adaptation mechanisms in multicomponent fermentation systems, particularly regarding phylogenetic responses to phytochemical selection pressures. The integration of microbial ecology principles with traditional fermentation practice offers technical insights for developing enhanced Daqu starters while preserving the characteristic flavor profiles of traditional Chinese baijiu.

2. Materials and Methods

2.1. Preparation of Daqu Blocks and Sample Collection

Following the traditional protocol for Moutai-flavor Daqu [19], we prepared the Daqu with hard wheat and green tea as the raw materials. Detailed information on the preparation of Daqu blocks and sample collection can be found in the previous studies [14] or is available in the Appendix S1 of Supplementary Information. Finally, three sample replicates were collected at each time point (Days 1, 6, 12, 15, 30, and 40) across four types of Daqu, namely, original Daqu (pure wheat with no green tea), 10% tea-added Daqu (10% green tea by weight of the Daqu block), 20% tea-added Daqu (20% green tea), and 30% tea-added Daqu (30% green tea), resulting in a total of 72 Daqu samples (4 types of Daqu × 6 time points × 3 replicates).

2.2. Endogenous Factor Determination

Block temperature (Temp) was monitored via direct insertion of a thermometer probe. Endogenous factors including acidity (Acids), saccharifying power (SAC), starch content (Starch), and moisture content (Moisture) were quantified following the national standard QB/T 4257—2011 (2011) [20].

2.3. Total DNA Extraction, PCR Amplification, and Sequencing

DNA extraction, PCR amplification, and sequencing were executed following standardized protocols. Sample preparation for Daqu adhered to the methodology outlined by Dai et al. [12]. Cell pellets obtained were processed for total DNA extraction using the MP FastDNA® SPIN Kit (MP Biomedicals, Irvine, CA, USA) for Soil, in accordance with the manufacturer’s guidelines.
The bacterial 16S rRNA gene V3–V4 region was amplified using the primer pair 319F/806R, as described by [21]. PCR conditions included an initial denaturation at 98 °C for 30 s, followed by 35 cycles of denaturation at 98 °C for 10 s, annealing at 54 °C for 30 s, and extension at 72 °C for 45 s, with a final extension at 72 °C for 10 min. For fungal community analysis, the ITS1 region was amplified using the primer pair ITS1F/ITS2. The PCR conditions were set as follows: initial denaturation at 95 °C for 2 min, followed by 30 cycles of denaturation at 95 °C for 30 s, annealing at 61 °C for 30 s, and extension at 72 °C for 45 s, with a final extension at 72 °C for 10 min [22].
PCR products were verified via 2% agarose gel electrophoresis stained with GenGreen nucleic acid dye (Tiangen Biotech, Beijing, China) at 90 V for 30 min. PCR products exhibiting bright bands in the target regions (16S V3–V4 or ITS1) were pooled in equidensity ratios and then purified using the Monarch® DNA Gel Extraction Kit (New England Biolabs, Ipswich, MA, USA). The purified PCR amplicons were sequenced using the Illumina MiSeq PE300 platform (Illumina, San Diego, CA, USA) at Beijing Biomarker Technologies Co., Ltd. (Beijing, China).

2.4. Sequence Data Processing

Paired-end (PE300) sequencing reads were merged using FLASH, and sequences were demultiplexed based on unique barcodes. Raw reads underwent quality filtering with Trimmomatic v0.33 to remove low-quality sequences, whereas Cutadapt v1.9.1 was used to identify and trim primers, generating high-quality clean reads. Merged reads were further processed using Usearch v10, with length filtering applied to ensure the correct size range for the targeted regions. Denoising was performed using the DADA2 plugin in QIIME2, which included paired-end read merging and chimera removal, yielding high-quality amplicon sequence variants (ASVs).
Taxonomic classification of ASVs was performed using the Naive Bayes classifier in QIIME2 based on the Sliva 16S rRNA database (v 132) and ITS rRNA database (unite 8.0) [23].

2.5. Statistical Analysis

To comprehensively unravel the ecological processes governing microbial community assembly and dynamics in Daqu treatments, a multi-faceted analytical strategy was deliberately employed, integrating diverse statistical tools with distinct theoretical foundations and ecological insights. The selection of species–time relationships (STRs) and time–decay relationships (TDRs) was motivated by their capacity to quantify temporal patterns in microbial diversity and community turnover, respectively, providing foundational metrics for assessing ecological stability and resilience. For each Daqu treatment, species–time relationships (STRs) were constructed based on the richness and calculated using the moving window approach [24]. In brief, time series data were partitioned into as many window subsets as possible based on the number of observations, and the Gleason model [25] was fitted for each window, modeling the linear relationship between ln(T) and richness, with the equation Richness = K + slope × ln(T); where Richness is species (ASVs) richness, K is the intercept, T is the time interval. Time–decay relationships (TDRs) were estimated by fitting a linear model to the changes in community structure, assessed via pairwise Bray–Curtis dissimilarities, over time. Community dissimilarities were converted to similarities by subtracting them from 1. Least squares regression was used to model TDRs with the equation Ss = constantwT, where Ss represents pairwise similarity in community composition, T is the time interval, and w is the slope, reflecting the rate of community turnover across time [26]. Nonmetric multidimensional scaling (NMDS) based on Bray–Curtis distances was used to visualize differences in bacterial and fungal community structures across Daqu treatments at each time point, with significance further tested via permutational multivariate analysis of variance (Adonis) and Analysis of Similarities (Anosim).
Time response thresholds for dominant ASVs (relative abundance > 0.5%) were determined using Threshold Indicator Species Analysis (TITAN2) [27]. Null model analysis was employed to calculate the beta nearest taxon (βNTI) and Raup–Crick Bray–Curtis metrics (RCbray) to assess the contributions of stochastic and deterministic processes in microbial community assembly across different Daqus. Quantification of these processes can be achieved through the application of the phylogenetic bin-based null model analysis statistical framework [28], which utilizes the null model developed by [29]. In parallel, the Sloan neutral model [30] was applied to assess the role of neutral processes, such as random birth-death events and passive dispersal, in shaping microbial abundance distributions. While null models focus on community-level turnover, the neutral model evaluates species-specific dynamics, offering complementary insights into how stochasticity operates at different organizational scales. The observed discrepancies between these models—for instance, when null models indicate deterministic selection but the neutral model suggests significant non-neutral processes—highlight scenarios where both selection and stochasticity co-occur, emphasizing the complexity of microbial ecology in Daqu systems. The Sloan’s model fit was evaluated using the generalized R2 statistic. Bootstrapping with 1000 replicates was performed to calculate 95% confidence intervals for all fit statistics. The number of ASVs that conformed to the neutral model, as well as those outside the confidence intervals, were examined.
Associations between changes in endogenous factors (Table S1) and β-diversity metrics (including βMNDT, Bray–Curtis, and βNTI) were evaluated using random forest analysis [31], with changes in endogenous factors as predictors (transferred to Euclidean distances for sample pairs) for β-diversity. The random forest models’ significance was evaluated using the A3 package in R, which performed 10-fold cross-validation with 1000 permutations to assess global model validity. Variable importance was determined by the percentage increase in mean squared error (%IncMSE), with higher values indicating stronger predictive contributions. To evaluate the statistical significance of individual predictors, the rfPermute package was employed, conducting 1000 permutations to compute empirical p-values for each endogenous factor. Model-wide R2 values, derived from permutation-based testing, were shown to reflect the overall explanatory power of the random forest models. Predictors with p < 0.05 were considered statistically significant. As referred to in previous report [32], Spearman’s correlations were calculated between relative ASV abundances and endogenous factors, and two types of correlation matrices were generated based on robust associations (r ≥ 0.6, p < 0.05). The qualitative matrix assigned values of 1 or −1 to positive or negative correlations, respectively, whereas the quantitative matrix retained the original correlation coefficients. These matrices were used to perform phylogenetic conservatism analysis via Blomberg’s K [33], Pagel’s λ [34], and the Fritz and Purvis D-test [35], as outlined in Zhao et al. [32]. These phylogenetic conservatism analyses were used to test whether microbial traits are evolutionarily constrained by historical factors or shaped by contemporary environmental filters, addressing a key gap in understanding trait-environment linkages.
All data analysis and visualization were performed using R software (v4.2.1) (https://www.r-project.org/, accessed on 27 January 2025).

3. Results

3.1. Microbial Community Dynamics During Daqu Fermentation

Microbial richness accumulation dynamics across Daqu types showed strong STRs model fit (p < 0.001), confirmed by Figure 1a,b curves and Table 1 equations. All groups demonstrated significant progressive species accumulation during fermentation. Specifically, original Daqu exhibited steady bacterial richness (K = 443.13, slope = 24.84), while tea treatments increased initial richness (K = 453.56–466.58 at 10–30% tea). This dose-dependent enhancement suggests tea promotes bacterial taxonomic diversity. Fungal communities displayed parallel trends, with tea-treated groups showing enhanced overall richness accumulation compared to controls.
TDRs revealed significant reductions in microbial community similarity over time (p < 0.001; Figure 1c,d, Table 2), with bacterial communities maintaining higher baseline similarity (e.g., original: 0.636; 10% tea: 0.566) compared to fungi (e.g., original: 0.577; 10% tea: 0.523). Both groups showed gradual divergence with low decay rates (w = 0.007–0.01 for bacteria; 0.008–0.009 for fungi) that remained unaffected by tea concentration.
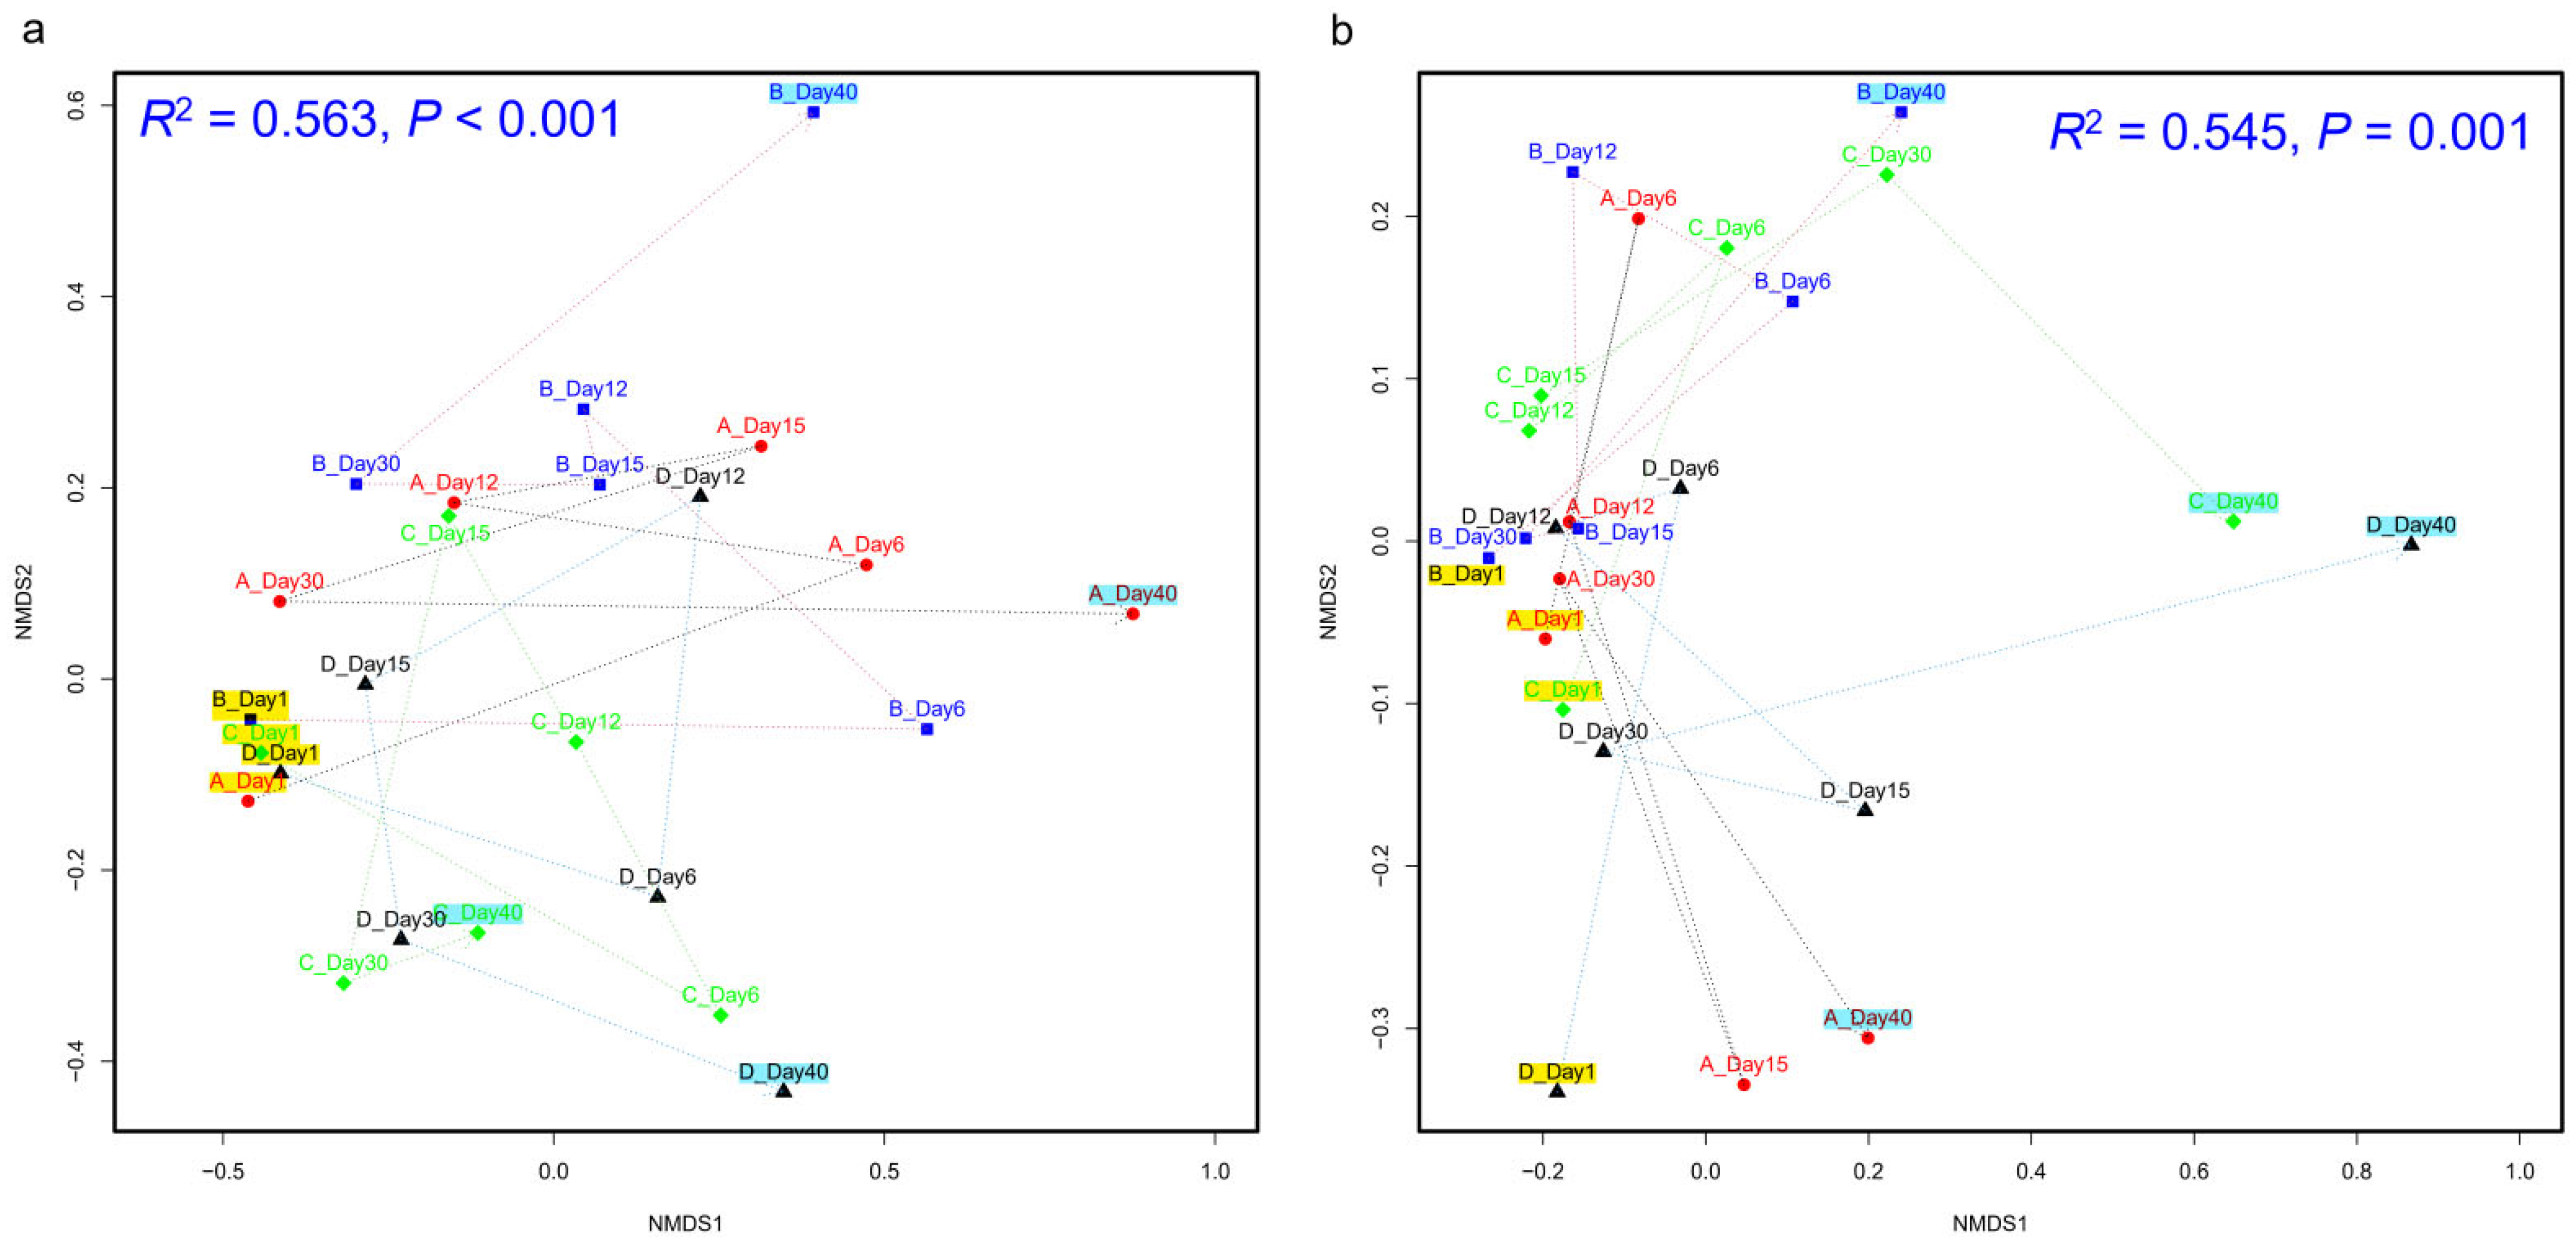
NMDS ordination confirmed distinct temporal succession trajectories (Figure 2a,b, Table 3). Bacterial communities initially overlapped at Day 1 (Adonis R2 = 0.369, p > 0.05) but diverged significantly by Day 6 (R2 = 0.627, p < 0.001), stabilizing in Day 30 while retaining differentiation through Day 40 (p < 0.01). The 30% tea group showed maximal divergence along NMDS2, indicating dose-dependent structural shifts. Fungal communities demonstrated delayed differentiation post-Day 6, with significant separation emerging exclusively by Day 30 (p < 0.01). Notably, the 30% tea group exhibited the largest NMDS1-axis deviation at Day 40, indicating sustained structural divergence in tea-treated communities. These patterns suggest rapid response of environmental change in bacterial communities, contrasting with slower fungal dynamics.
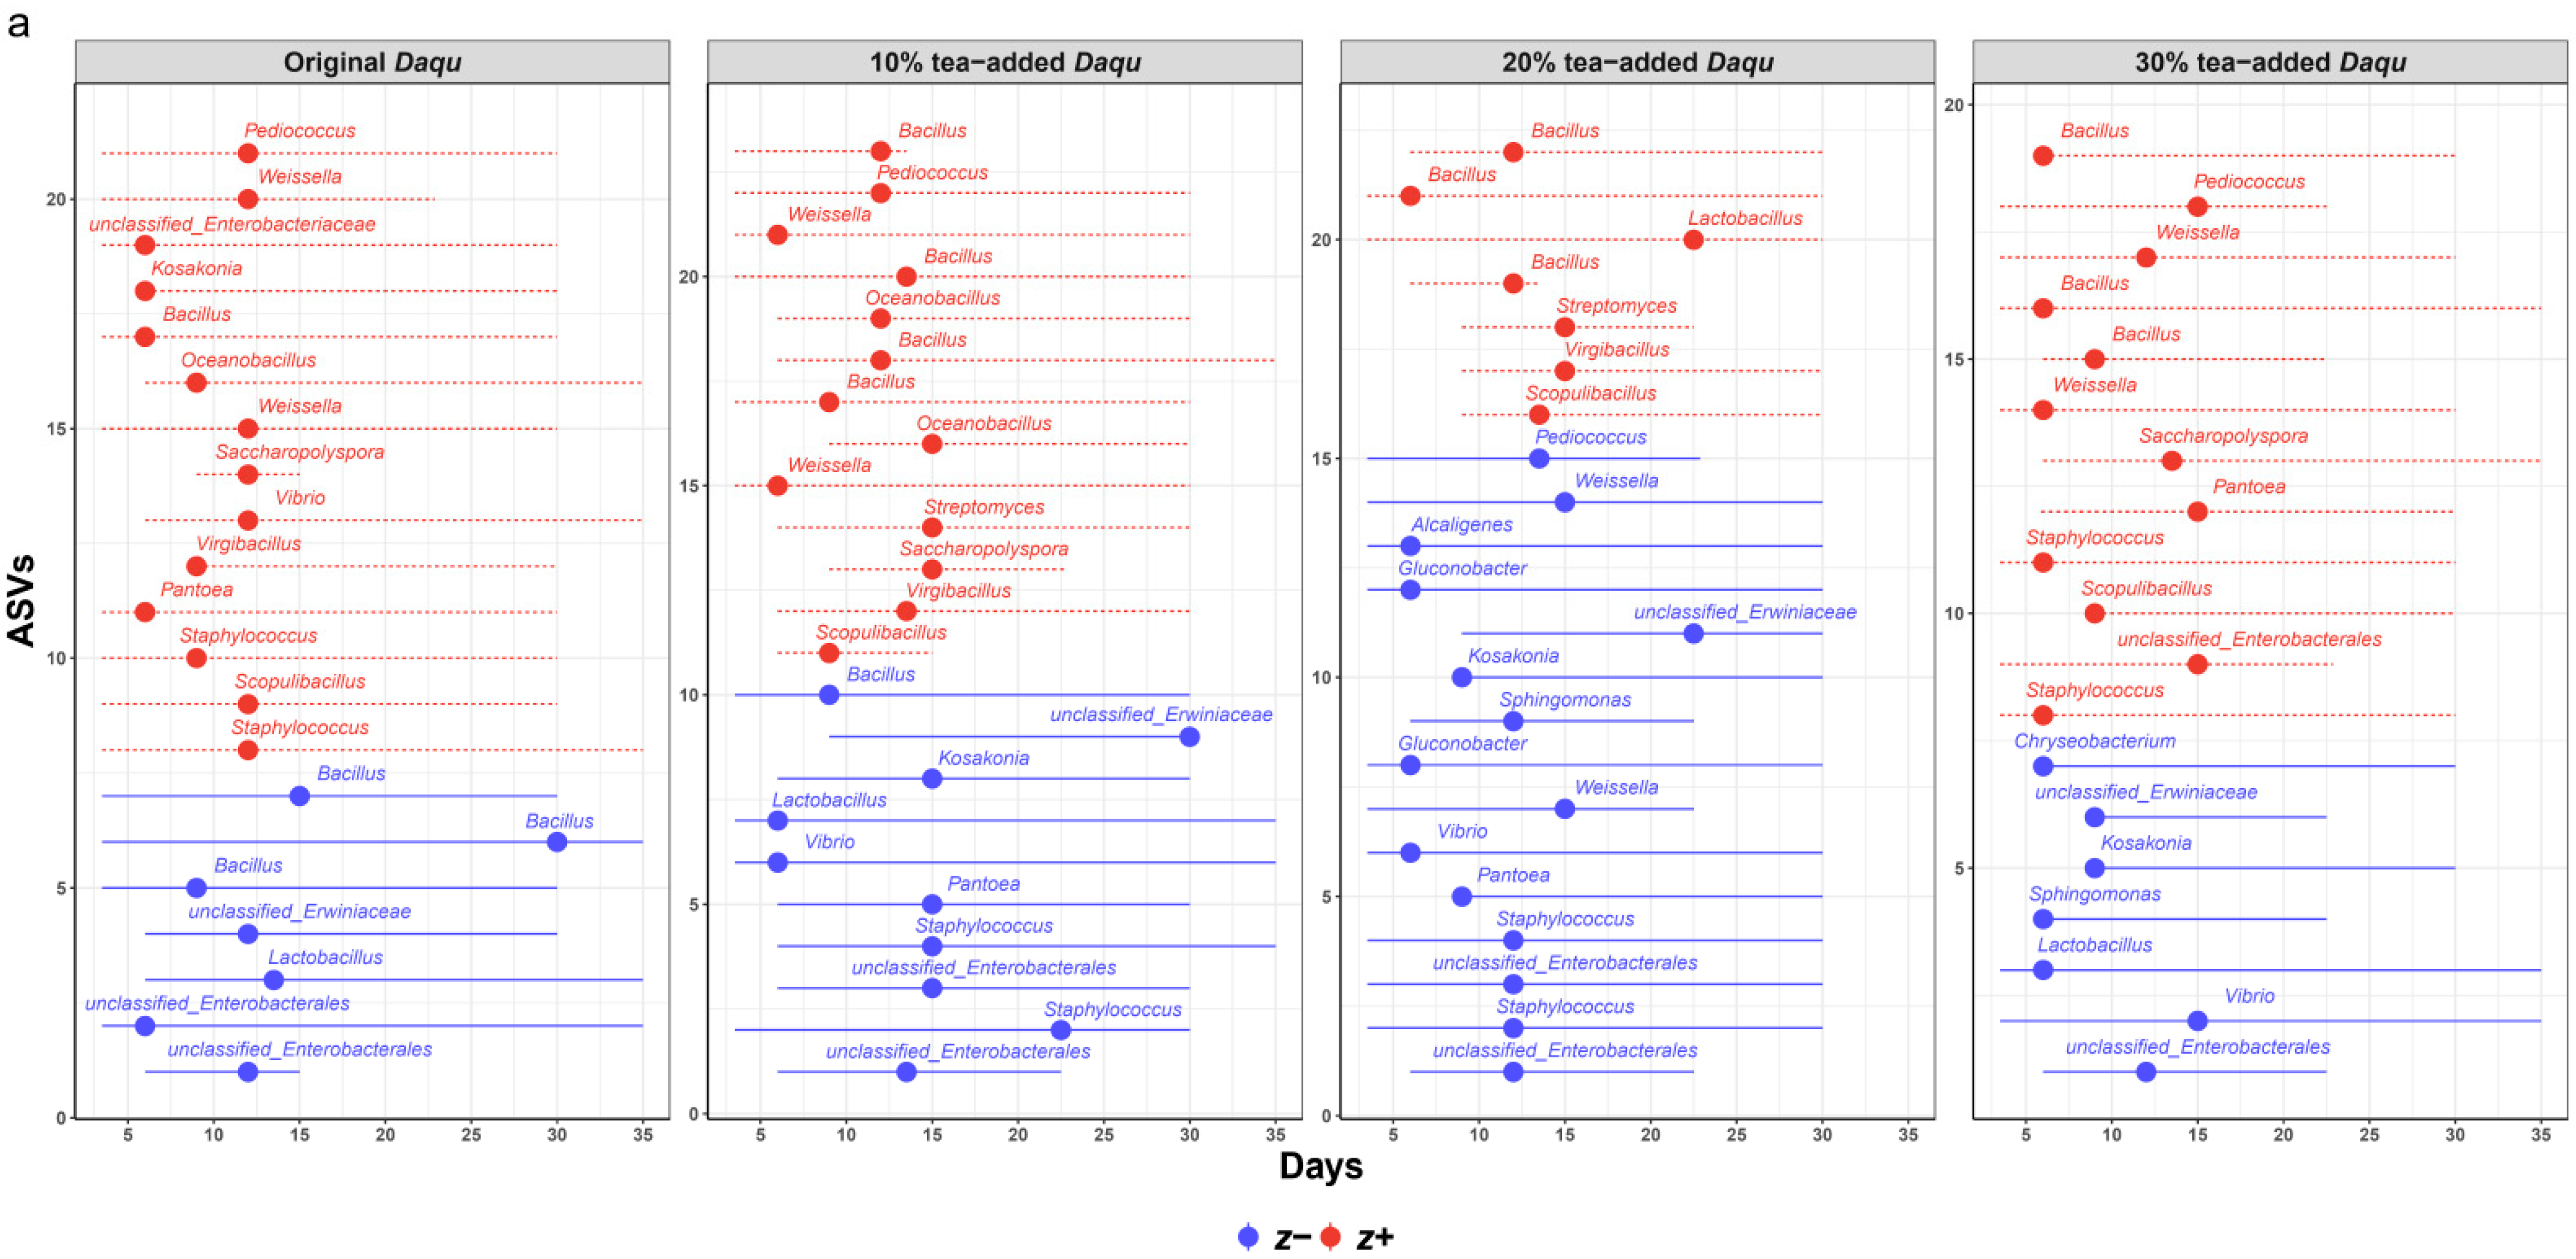
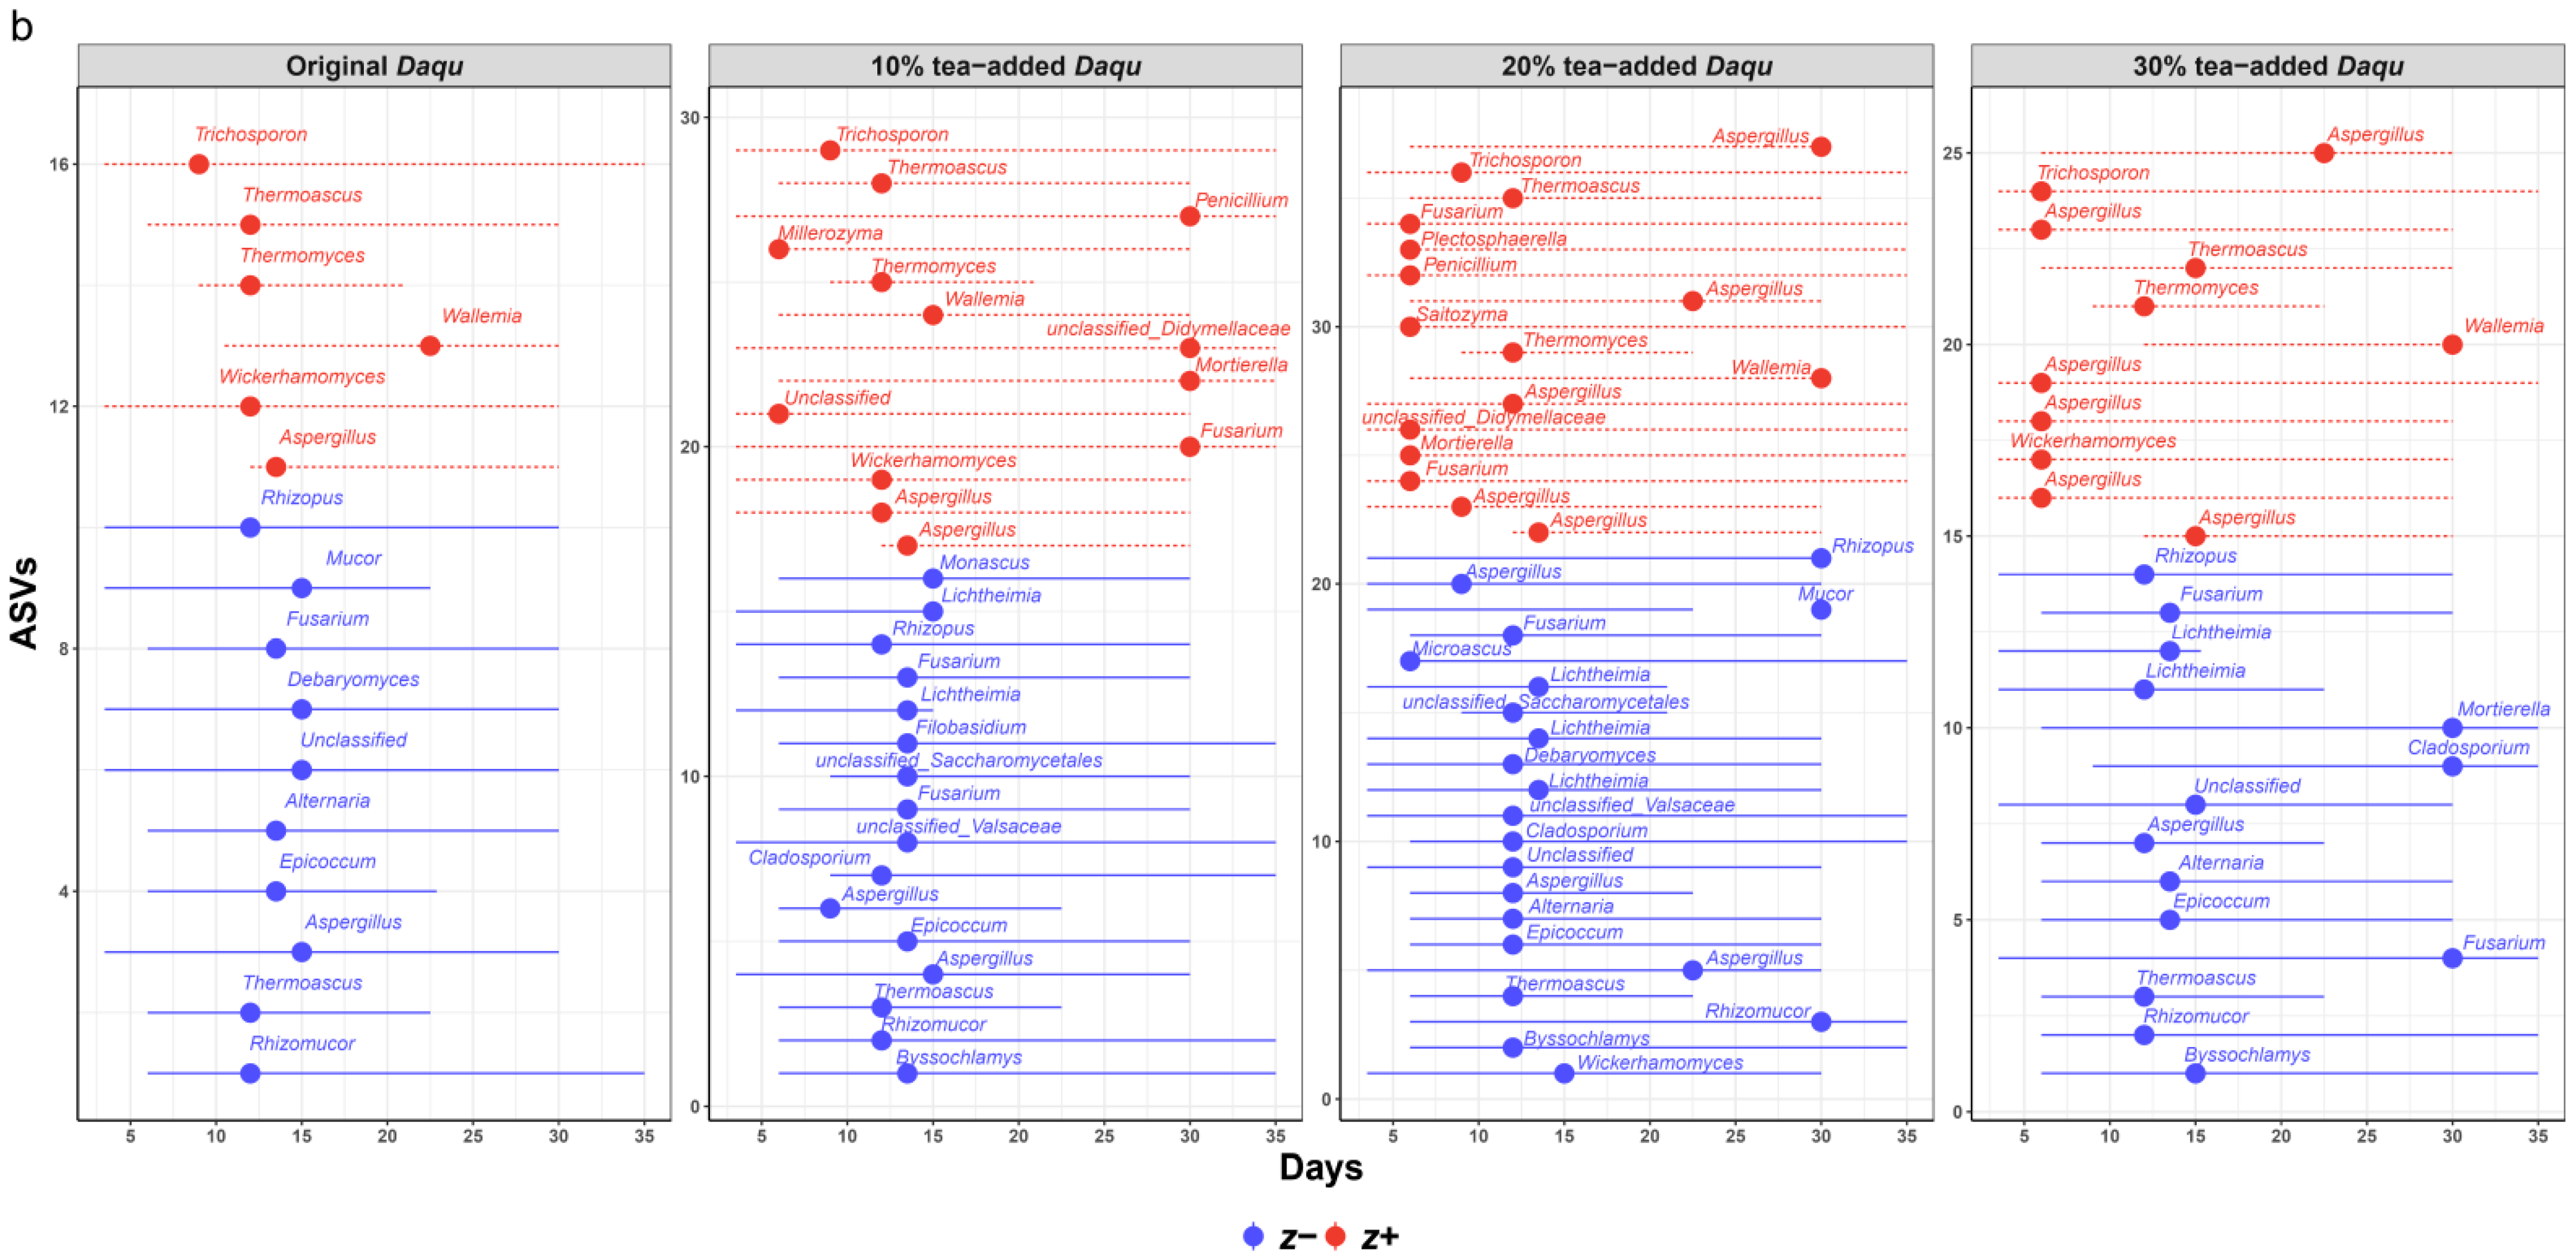
Response time thresholds exhibited tea content-dependent variation (Figure 3a,b). In original Daqu, bacterial dynamics showed early shifts: Lactobacillus and Bacillus declined (z–) by Day 6, while Weissella and Virgibacillus increased (z+) by Day 12. Tea addition altered these temporal patterns: 10% tea delayed key transitions to Days 9–15, whereas 30% tea accelerated Staphylococcus and Scopulibacillus proliferation (Day 6) with extended succession. Fungal responses demonstrated tea-mediated resilience. High-tea Daqu (30%) showed accelerated Aspergillus and Wallemia growth (Day 6), contrasting with delayed Rhizomucor and Thermoascus decline (Days 12–15). Original Daqu fungi exhibited mid-fermentation shifts (Days 12–15), while tea treatments showed dose-dependent response patterns: 10–20% tea delayed changes, and 30% tea sustained Aspergillus dominance throughout fermentation.

3.2. Community Assembly Process Mechanisms

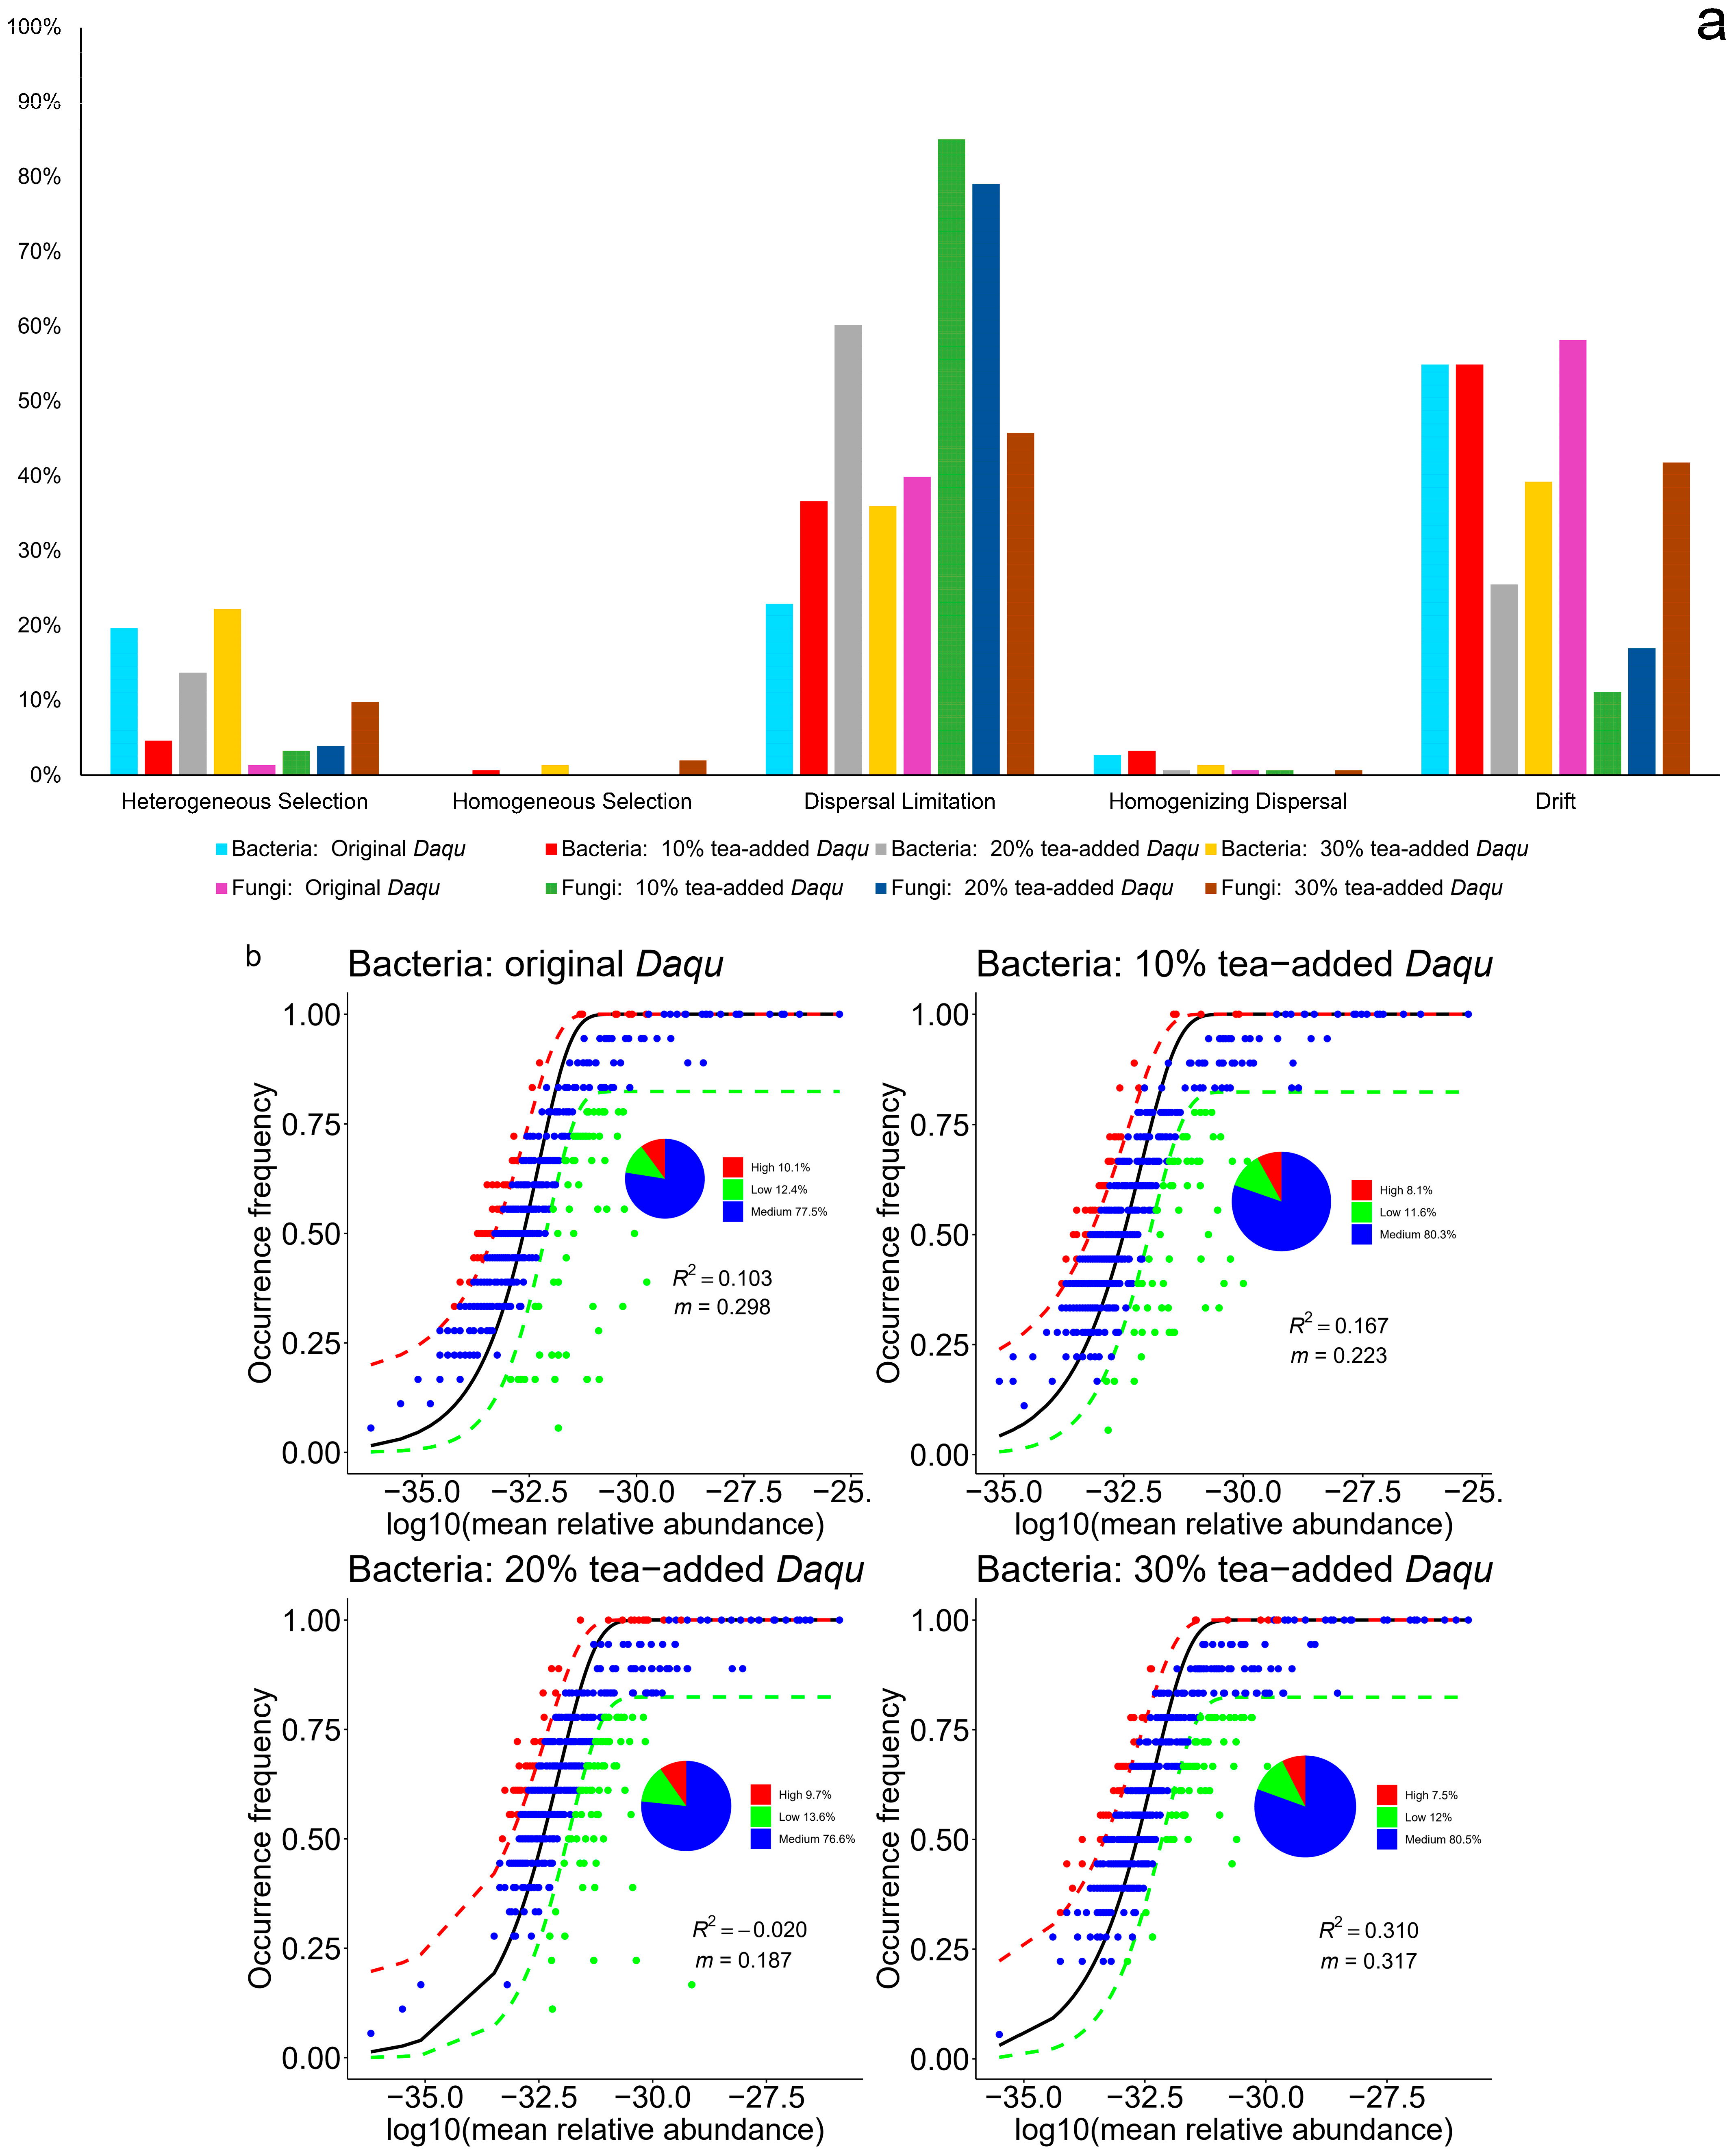
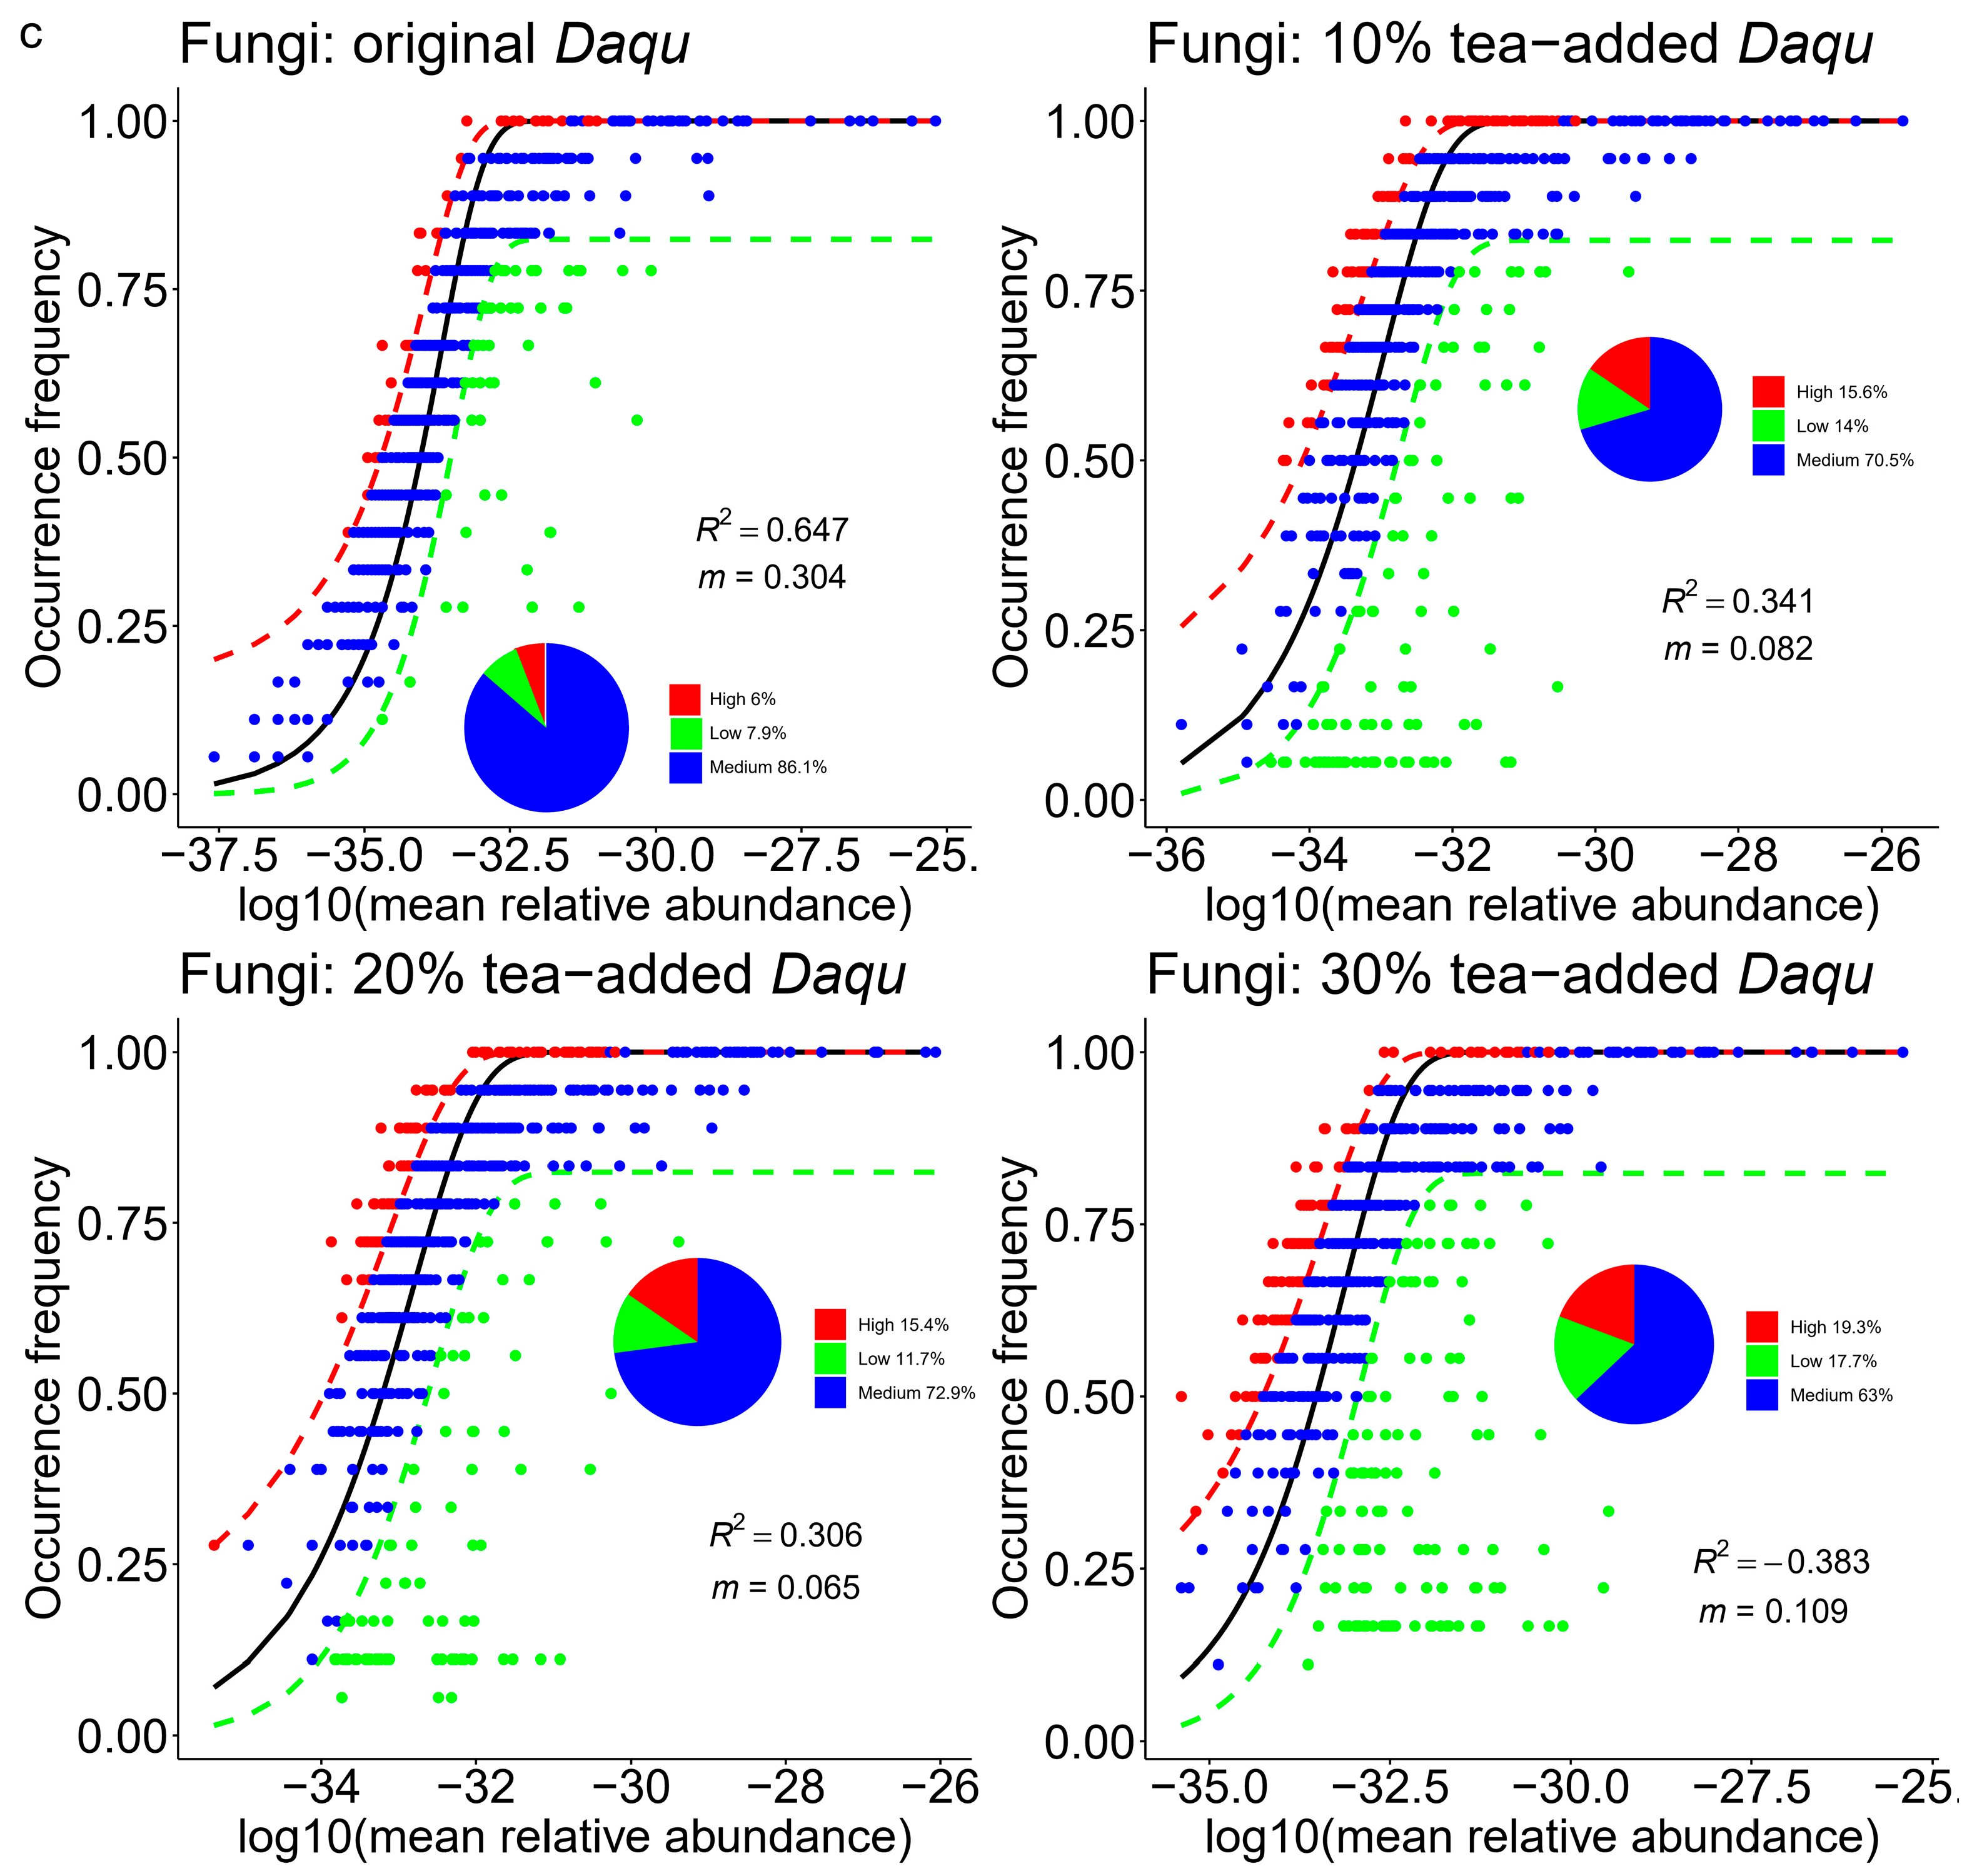
We examined the assembly mechanisms of microbial communities in original and tea-supplemented Daqu by combining null-model and Sloan neutral-community analyses (Figure 4). In bacteria, stochastic processes dominated every treatment (77–94%). Drift alone explained 55% of assembly in original Daqu (Figure 4a, Table S2). Tea progressively altered these dynamics. At 10% tea, dispersal limitation rose to 37% yet stochasticity remained 94%, indicating that resource constraints amplified random assembly. This trend intensified at 20% tea, with dispersal limitation reaching 60% while stochasticity stayed at 86%. By 30% tea, 23% of assembly was driven by heterogeneous selection, revealing emerging niche specialization under high tea concentrations. Fungi followed a similar trajectory, shifting from 99% stochasticity in original Daqu to 12% deterministic assembly (10% heterogeneous plus 2% homogeneous selection) at 30% tea, reflecting substrate-driven filtering of tea-tolerant taxa.
Sloan neutral modeling provided complementary insights. Bacterial communities showed increasingly good fit to the neutral model (R2 = 0.03 → 0.30) as tea content rose (Figure 4b), suggesting that tea-derived niches facilitated neutral assembly despite greater dispersal limitation. Fungi, in contrast, exhibited declining fit (R2 = 0.58 → –0.38) with tea addition (Figure 4c, Table S3), corroborating the deterministic signal detected by null-model analyses. Migration rate (m) patterns supported these findings: bacterial m remained stable (0.30 → 0.32), whereas fungal migration capacity dropped markedly, this might be correlated with resource-mediated competitive exclusion observed in null model analyses.

3.3. Microbial Phylogenetic Dynamics and Adaptation Conservatism

We used random-forest regression to quantify how changes in endogenous factors (Table S1) drive community β-diversity. Predictors were tested against βMNTD (phylogenetic turnover), Bray–Curtis (compositional turnover), and βNTI (assembly determinism).
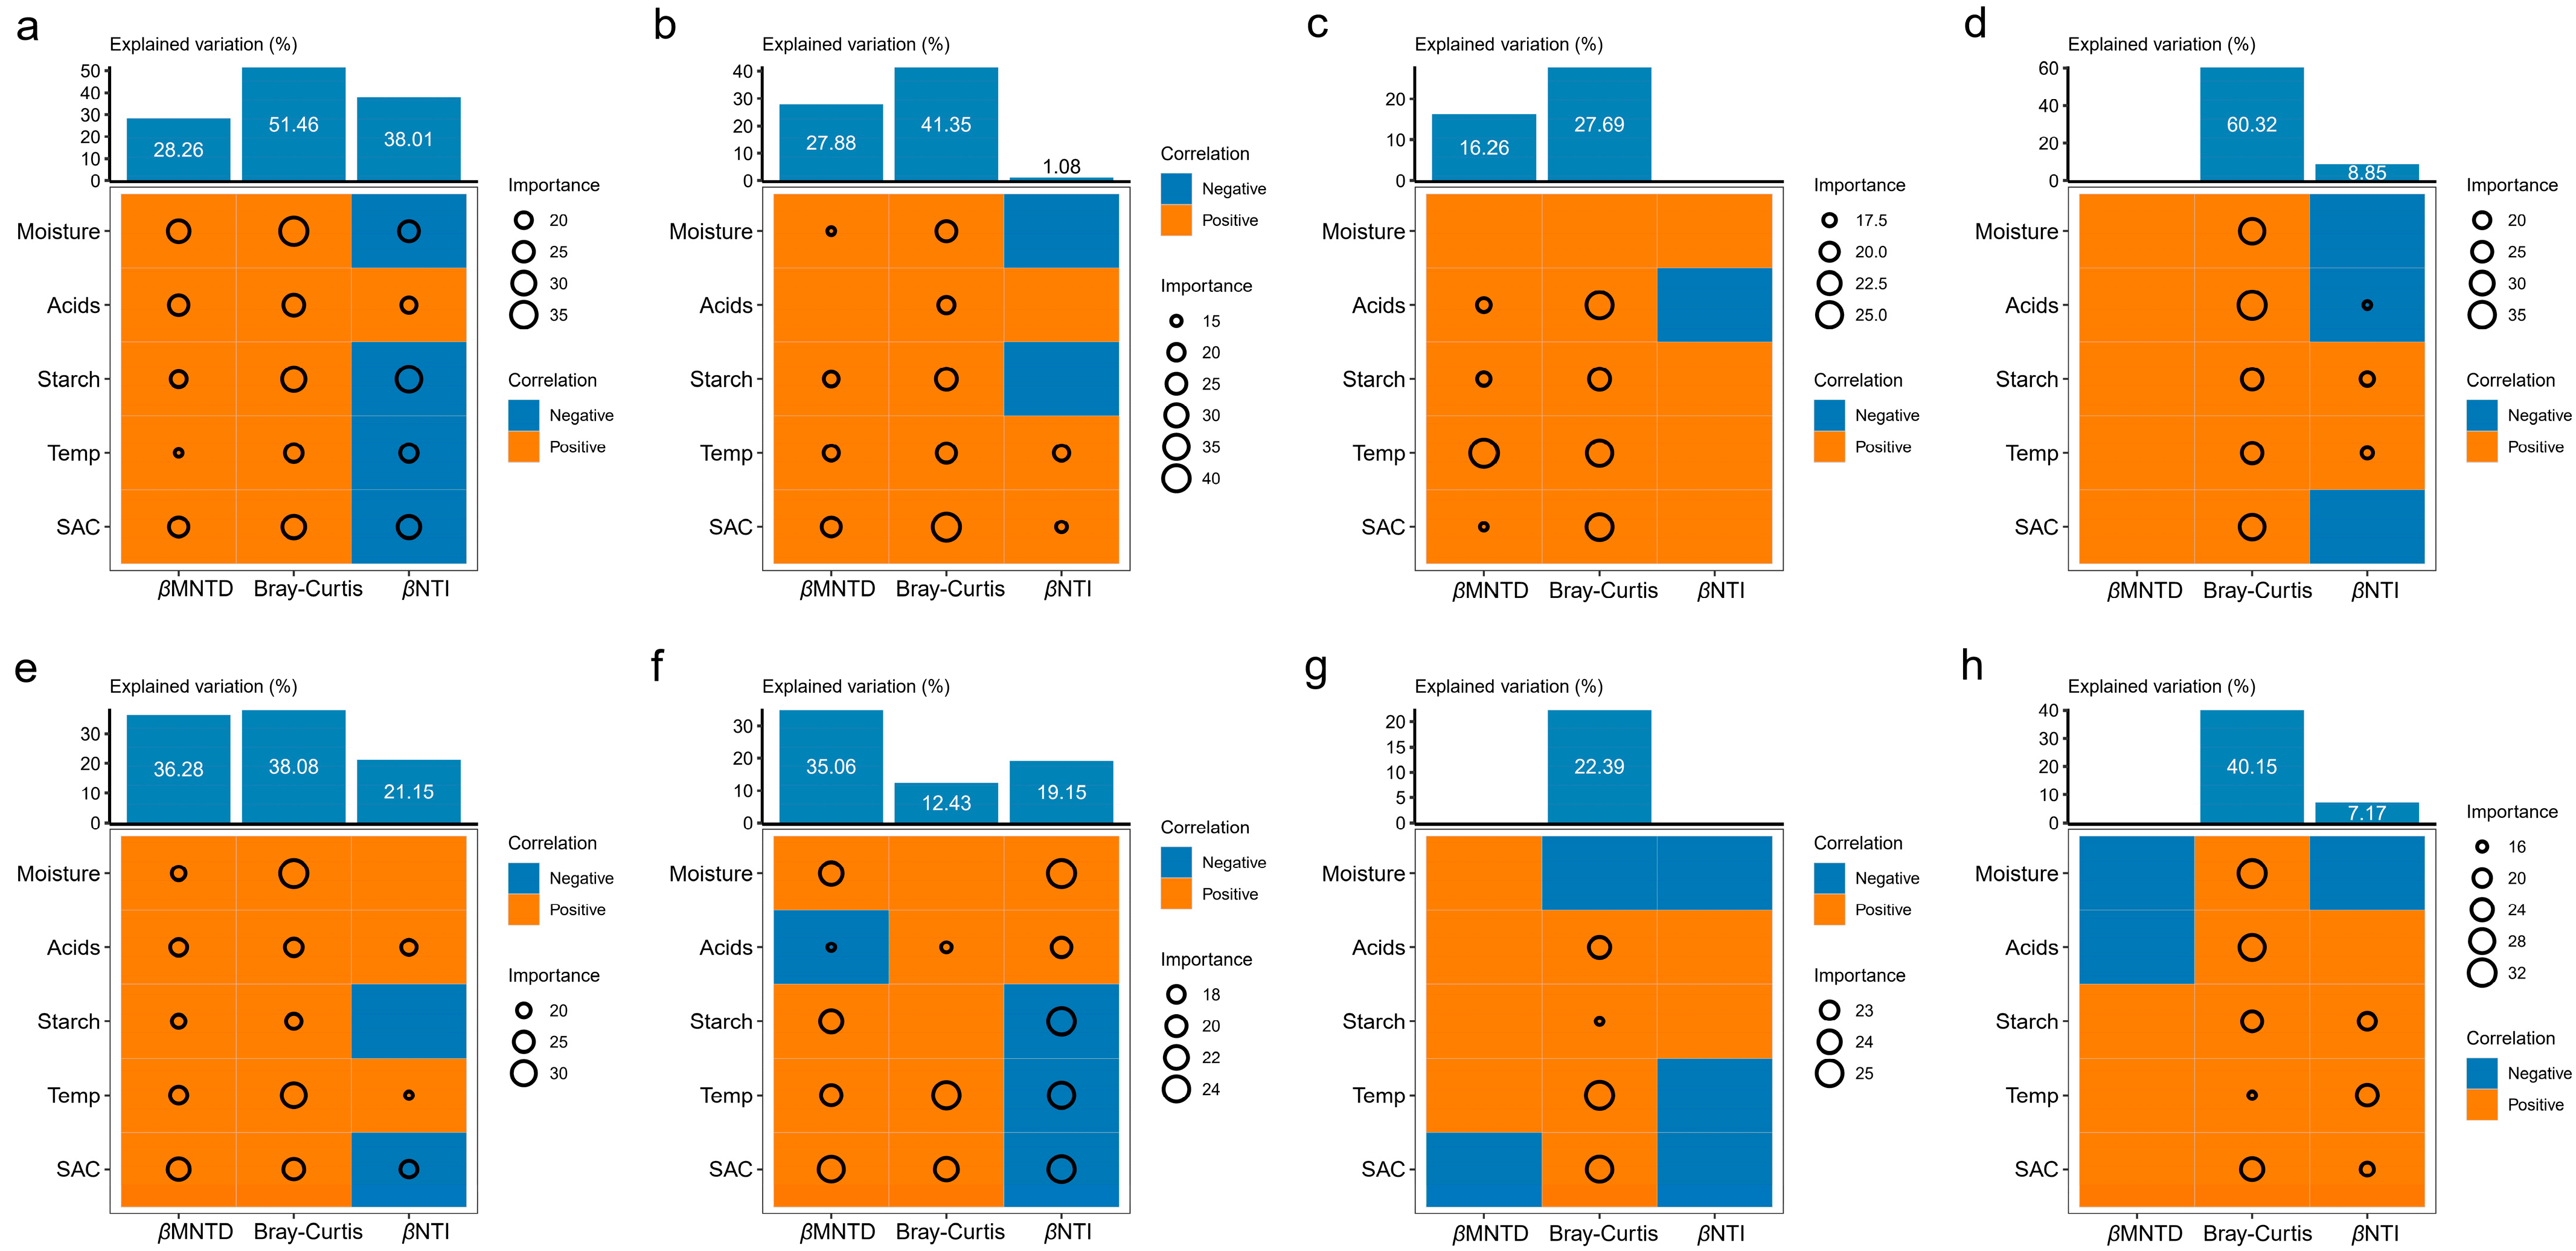
Tea reshaped both bacterial and fungal communities. For bacteria (Figure 5a–d), Moisture, Acids and SAC explained ~28% of βMNTD variance in original Daqu, but their contribution fell to zero at 30% tea, indicating suppressed phylogenetic turnover. Bray–Curtis showed the sharpest change in 30% tea Daqu (60.32%), reflecting a major compositional shift. βNTI corroborated this trend, as predictor contributions to assembly process declined with increasing tea and dropped to 1.08% at 10% tea, implying stronger stochasticity or alternative drivers.
For fungi (Figure 5e–h), SAC, temperature, moisture and starch strongly predicted βMNTD in original Daqu. Their influence declined at 20% and 30% tea, indicating that tea stabilized or constrained fungal phylogenetic turnover. Bray–Curtis analysis revealed a parallel shift. Particularly in 30% tea Daqu, moisture and acidity became the main drivers of compositional change, reflecting tea-induced alteration of the fungal niche. βNTI confirmed this trend: fungal communities grew less responsive to endogenous factors as tea levels rose, likely for reasons similar to those governing bacterial communities.
We assessed the phylogenetic conservatism of five endogenous factors using Fritz and Purvis’ D-test [35], Blomberg’s K [33], and Pagel’s λ [34]. These indices evaluate whether microbial traits are heritable across the Daqu gradients.
Table 4 showed that the three methods rarely agreed. Discrepancies arise because Blomberg’s K [33] and Pagel’s λ [34] are sensitive to tree topology [36], whereas the D-test requires binary data [35] while the others use continuous traits. Consequently, we integrated all three outputs and deemed a factor conservative only when at least one method reported statistical significance.
Original Daqu showed the strongest phylogenetic conservatism. Bacterial traits were conserved for all factors, whereas fungal traits were conserved for all except SAC. Tea steadily reduced this signal. At 10% tea, bacteria retained Acids and Temp, and fungi kept Starch and Moisture. By 20% tea, bacteria lost all factors except Temp, and fungi lost all factors. At 30% tea, only Starch remained conserved for both groups.

4. Discussion

STRs and TDRs have been widely employed to investigate plant and animal communities [38,39,40,41] and to analyze microbial succession in controlled microcosm systems [42]. The slope of an STRs reflects the rate at which novel taxa are detected in a community over time, with steeper slopes indicating a higher rate of new taxon introduction [38]. In our study (Figure 1a,b), STRs analysis revealed that both bacterial and fungal communities across all Daqu types exhibited significant temporal increases in species richness (p < 0.001). Given that Daqu fermentation occurs in open environments, newly detected taxa likely originated from low-abundance populations in the initial raw materials or were introduced externally during the process. Although the probability of external microbial acquisition was consistent across the four Daqu types under identical fermentation conditions, STRs slopes varied among them, suggesting that novel taxa primarily derived from low-abundance taxa in the starting materials. This aligns with previous findings that most taxa in ecosystems persist over time, with community composition changes driven by fluctuations in relative abundance rather than extinction or recolonization [43]. Fungal STRs slopes ranged from 9.89 to 21.92, while bacterial slopes were higher (20.39–24.84), indicating progressive detection of novel taxa as fermentation progressed. Notably, intercept values for both bacteria and fungi increased with tea addition, suggesting that tea promoted microbial accumulation and enhanced overall community richness. However, higher tea concentrations correlated with reduced STRs slopes, indicating a slower rate of novel taxon emergence. This may be attributed to two factors: the introduction of exogenous microbes via tea, which could alter competitive dynamics, and the reduced availability of starch (a key carbon source) as tea proportion increases, potentially leading to resource limitations or intensified microbial competition. For comparison, STRs slopes in natural habitats (e.g., air, seawater, soil, freshwater, flowers) range from 0.24 to 0.61 [42], while those in polluted environments range from 0.7 to 0.8 [44,45]. Notably, the rates of novel taxon detection observed in our Daqu fermentation system (fungal slopes: 9.89–21.92; bacterial slopes: 20.39–24.84) were substantially higher than these values, underscoring the unique microbial succession dynamics in this open, resource-rich fermentation environment.
TDRs provided insights into community succession dynamics, with temporal turnover slopes (w) estimating the rate of structural change over time. A slope of zero indicates no temporal change, while more negative slopes reflect faster community turnover [46]. In our study (Figure 1c,d), TDRs were statistically significant for microbial communities across all Daqu types. However, regardless of tea addition, the w values were notably lower than those reported in other studies [47,48,49], indicating a relatively slow rate of community turnover. Moreover, tea addition did not significantly accelerate community turnover. This suggests that while STRs revealed relatively high species turnover, the corresponding w values remained low, implying that community succession was primarily driven by shifts in the relative abundance of dominant taxa rather than the introduction of newly detected species. Additionally, TDRs (Figure 1c,d) showed substantial variation in constants across Daqu types, indicating that while tea addition did not drastically alter the overall community turnover rate, it did influence community structure. This led to increased temporal divergence among Daqu types, as illustrated by the NMDS plot (Figure 2a,b), which indicated that bacterial communities adapted rapidly to environmental changes, while fungal communities exhibited slower dynamics. A previous study [50] using TITAN2 effectively identified precise time thresholds, highlighting subtle shifts in microbial communities that are critical for ecosystem stability. The current study (Figure 3a,b) revealed nuanced timing in bacterial and fungal shifts. In the original Daqu, significant bacterial shifts occurred between Day 6 and Day 12, while fungal shifts emerged between Day 12 and Day 15. However, tea addition extended the bacterial shift response to Day 15 and advanced the fungal response to Day 6, prolonging it until Day 30. Moreover, a higher tea proportion increased the number of fungal taxa exhibiting shift responses beyond Day 15. These findings suggest that tea addition expanded the response window for microbial abundance changes, enabling a greater number of microorganisms to remain within a controlled range.
Taking the above, our first hypothesis that tea proportion modulates temporal microbial succession patterns during Daqu fermentation was supported, as tea addition enhanced microbial accumulation (increased STRs intercepts) while slowing novel taxon emergence (reduced STRs slopes), reshaped community structure, and expanded the temporal window for microbial abundance shifts through differential impacts on bacterial (rapid adaptation) and fungal (slower) dynamics.
To explore the drivers of community differentiation, we analyzed microbial assembly patterns across Daqu types using null model and Sloan neutral community model approaches (Figure 4). Understanding microbial community assembly is essential for targeted regulation of functional communities [51]. Null model analysis revealed that microbial community assembly in both original and tea-added Daqu was predominantly driven by stochastic processes (bacteria: 77–94%; fungi: 88–99%), aligning with previous studies [6,15]. While stochastic processes dominated, the three main mechanisms—heterogeneous selection, dispersal limitation, and ecological drift—contributed differently to community assembly. This variation led to community differentiation among Daqu types during fermentation, resulting in greater species diversity in tea-added Daqu compared to original Daqu, as evidenced by increased microbial richness (Figure 1a,b). The Sloan neutral model further corroborated these findings, particularly emphasizing differences in dispersal limitation across Daqu types. For bacteria, the lowest migration rate (m = 0.19) was observed in 20% tea-added Daqu, corresponding to its highest dispersal limitation (60% in null model), indicating restricted bacterial movement during fermentation. Notably, the null model showed that increasing tea content gradually intensified deterministic processes in fungi (rising from 1% to 12%) while reducing stochastic processes (declining from 99% to 88%). This trend was supported by the Sloan model, where fungal R2 values decreased (0.58 to −0.38), signaling a shift toward deterministic assembly. However, some discrepancies emerged between the models. For example, bacterial R2 values from the Sloan model were relatively low (−0.071 to 0.30), and similar patterns were observed for fungi, suggesting weak neutrality or non-neutrality (R2 < 0). This contrasts with the null model’s classification of communities as largely stochastic. Such inconsistencies, also reported in prior studies [52,53], likely stem from methodological differences: the null model assesses beta diversity deviations from null expectations, while the Sloan model focuses on abundance-based neutral deviations. Together, these approaches revealed tea’s dual role in Daqu ecosystems: it creates bacterial niches conducive to stochastic assembly while driving fungal communities toward deterministic selection. This dual mechanism enhances microbial diversity and functional potential, as demonstrated by increased richness and diverged community structure in tea-added Daqu (Figure 1 and Figure 2).
Our second hypothesis, regarding the mechanisms by which tea ratios modify microbial community assembly processes, was supported: tea addition modifies assembly processes by promoting stochastic niche-based assembly in bacteria and deterministic selection in fungi, thereby enhancing microbial diversity and functional potential through differential impacts on community assembly dynamics.
Random forest regression analysis demonstrated that tea addition significantly altered the influence of endogenous factors on community β-diversity, particularly for phylogeny-related metrics βMNTD and βNTI (Figure 5). Tea addition reduced the explanatory power of endogenous factors for βMNTD and βNTI, while having a robust effect on the composition-based Bray–Curtis metric. This suggests that tea modified microbial phylogenetic succession patterns in Daqu, reshaping phylogenetic relationships and altering responses to traditional endogenous environmental factors during fermentation. Further phylogenetic conservatism analysis (Table 4) supported these findings, revealing that tea addition reduced the number of factors exhibiting phylogenetic conservatism. For instance, in 30% tea-added Daqu, bacteria exhibited phylogenetic conservatism only toward starch, while fungi did so only toward SAC. This indicates that altered Daqu ingredients modified microbial genetic adaptability to endogenous factors, reducing reliance on traditional factors previously considered critical for Daqu fermentation. These findings enhance our understanding of how raw material changes, such as tea addition, reshaping microbial heritable environmental adaptability during fermentation.
Our third hypothesis, that green tea addition alters phylogenetic conservatism in microbial adaptation, was supported: tea addition reduced the number of factors exhibiting phylogenetic conservatism, indicating a reshaped microbial heritable adaptability to endogenous factors during fermentation.
This study systematically investigated the impact of tea supplementation on microbial community dynamics during Moutai-flavored Daqu fermentation. Building on prior work [14,54] that explored bacterial succession, physicochemical factors, and flavor compound richness—where dose-dependent shifts in dominant bacterial genera and 30% tea concentration as optimal for enhancing bacterial distribution, saccharification efficiency, and flavor complexity were identified—the current research expanded to incorporate fungal dynamics and ecological frameworks. Findings revealed tea addition significantly influenced microbial kinetics, community structure, and assembly mechanisms, with distinct temporal patterns: bacteria exhibited a delayed response (peaking at Day 15 via STRs/TDRs models) compared to accelerated fungal shifts (by Day 6). Null/Sloan models further showed tea restructured assembly mechanisms, driving bacterial stochasticity while enhancing fungal determinism. Phylogenetic conservatism analyses revealed that tea supplementation decoupled microbial traits from traditional environmental factors (moisture, acidity). This addition introduced a novel, dominant selective pressure that superseded historical co-evolutionary relationships and relaxed ancestral constraints, with starch-related traits serving as notable exceptions. By linking niche partitioning to functional outcomes, the study elucidated ecological principles underlying tea-modified fermentation, transcending descriptive profiling to uncover evolutionary and assembly dynamics. While this study establishes tea-induced microbial restructuring as a key driver of ecological dynamics in Daqu fermentation, the direct translation of these microbial shifts to baijiu quality metrics requires further validation. Future work should integrate multi-omics approaches to correlate microbial succession patterns with physicochemical parameters (e.g., quantitative analysis of pyrazines, lactones, and organic acids via HPLC-MS/MS) and sensory attributes. Specifically, small-scale fermentation trials using tea-modified Daqu could test whether observed fungal determinism enhances ester-producing capabilities (e.g., ethyl hexanoate) or whether bacterial stochasticity correlates with acidity regulation. Additionally, time-series metabolite profiling would clarify whether the delayed bacterial peak at Day 15 corresponds to delayed production of key flavor precursors. These experimental frameworks would transform the current ecological insights into actionable quality control strategies for tea-augmented Daqu production.
However, the experimental design may potentially conflate two mechanisms: direct modulation by tea-derived bioactives (e.g., antimicrobial polyphenols) and indirect effects from reduced wheat nutrients (e.g., fermentable carbohydrates). While increased microbial richness and altered succession patterns were observed, these outcomes could not distinguish between direct (e.g., inhibiting specific taxa) and indirect (e.g., limiting starch-dependent taxa) effects. Future studies should include a control where wheat is replaced with an inert, non-microbial substrate (e.g., cellulose powder) at equivalent percentages to isolate tea’s distinct impacts. Additionally, the laboratory-scale setup may not fully replicate commercial Daqu’s complex physicochemical conditions, limiting direct extrapolation. Nevertheless, the work provides foundational insights into tea-mediated microbial assembly, particularly through dose-dependent niche partitioning and phylogenetic trait shifts, offering actionable principles for microbial engineering. The methodology serves as a scalable framework for controlled tea supplementation testing, while mechanistic links between tea components and microbial dynamics generate testable hypotheses for industrial optimization. Though validation under large-scale production is needed, the study advances understanding of how bioactive plant additives reshape fermentation microbiomes, guiding the development of functional starter cultures and innovative specialty liquor strategies.
Collectively, this work established a novel framework for rationally engineering fermentation ecosystems by decoding evolutionary-ecological rules of microbial assembly. It demonstrated how plant-derived additives can strategically reprogram microbial succession, assembly mechanisms, and functional outcomes through niche modulation and phylogenetic trait constraints. Beyond dose-dependent effects, tea disrupted historical co-evolutionary ties and relaxed ancestral ecological constraints (except starch-related traits), enabling predictable microbiome manipulation. This marked a paradigm shift from observational profiling to mechanism-based ecosystem engineering, providing actionable principles for designing functional starter cultures and optimizing industrial fermentation via targeted ecological interventions.

5. Conclusions

This study elucidated the ecological impacts of tea addition on microbial community dynamics during Daqu fermentation, revealing six key insights: STRs analysis demonstrated time-dependent increases in bacterial and fungal species richness, with tea enhancing species accumulation while suppressing new taxa emergence at higher concentrations. TDRs indicated slower community turnover rates across all Daqus, driven by shifts in dominant taxa abundance rather than accelerated replacement. Tea expanded the temporal response window for microbial changes, extending bacterial shifts and advancing fungal shifts. Assembly mechanisms transitioned from stochastic to deterministic processes with increasing tea content, enriching diversity in tea-supplemented Daqu. The Sloan neutral model confirmed tea increased microbial dispersal limitation and intensified deterministic processes in fungi. Phylogenetic analyses (random forest, conservatism) revealed tea altered microbial relationships, reducing reliance on traditional endogenous factors.

Supplementary Materials

The following supporting information can be downloaded at: https://www.mdpi.com/article/10.3390/fermentation11090511/s1, Appendix S1: Preparation and sample collection of Daqu blocks; Figure S1: Flow chart of Daqu preparation process (A) and the production procedure (B); Table S1: Measurements of endogenous factors in distinct type of Daqu; Table S2: The relative importances (%) of the five assembly processes in communities of different Daqus generated from the null model; Table S3: Fit of the Sloan’s neutral model in microbial communities across different Daqus.

Author Contributions

Conceptualization, Data curation, Visualization, Writing—original draft, Writing—review and editing, L.Z.; Investigation and Resources, L.J. and Z.H.; Supervision, F.L., H.X., T.Z. and X.W. (Xiangyong Wang); Writing—review and editing, Y.Z.; Writing—review and editing, Supervision, Project administration, X.W. (Xinye Wang). All authors have read and agreed to the published version of the manuscript.

Funding

This research was funded by Special Project of the Liquor Industry Research Center of Moutai Institute (No. MTXYJCY001), Youth Guidance Project of Guizhou Province Basic Research Program (Natural Sciences) in 2024 (Qiankehe Jichu [2024] Qingnian 194), Guizhou Provincial Basic Research Program (Natural Science) (No. QianKeHe Jichu-ZK [2022]Yiban 543), Guizhou Province Technology Innovation Center for Jiangxiangxing Baijiu (No. Qiankehe Platform JSZX (2025) 002), and Research Foundation for Scientific Scholars of Moutai Institute (Nos. mygccrc [2022]004, mygccrc [2022]017, mygccrc [2022]023, and mygccrc [2022]028).

Data Availability Statement

The raw sequences associated with this study have been deposited in the NCBI SRA under accession: PRJNA1299319 and PRJNA1299095.

Conflicts of Interest

The authors declare no conflict of interest.

References

  1. Zhang, H.X.; Wang, L.; Tan, Y.W.; Wang, H.Y.; Yang, F.; Chen, L.Q.; Hao, F.; Lv, X.B.; Du, H.; Xu, Y. Effect of Pichia on shaping the fermentation microbial community of sauce-flavor Baijiu. Int. J. Food Microbiol. 2021, 336, 11. [Google Scholar] [CrossRef]
  2. Wang, X.S.; Du, H.; Zhang, Y.; Xu, Y. Environmental Microbiota Drives Microbial Succession and Metabolic Profiles during Chinese Liquor Fermentation. Appl. Environ. Microbiol. 2018, 84, 13. [Google Scholar] [CrossRef] [PubMed]
  3. Ma, S.Y.; Shang, Z.C.; Chen, J.; Shen, Y.J.; Li, Z.J.; Huang, D.; Luo, H.B. Differences in structure, volatile metabolites, and functions of microbial communities in Nongxiangxing daqu from different production areas. LWT-Food Sci. Technol. 2022, 166, 10. [Google Scholar] [CrossRef]
  4. Wang, X.S.; Du, H.; Xu, Y. Source tracking of prokaryotic communities in fermented grain of Chinese strong-flavor liquor. Int. J. Food Microbiol. 2017, 244, 27–35. [Google Scholar] [CrossRef]
  5. Sakandar, H.A.; Hussain, R.; Khan, Q.F.; Zhang, H.P. Functional microbiota in Chinese traditional Baijiu and Mijiu Qu (starters): A review. Food Res. Int. 2020, 138, 10. [Google Scholar] [CrossRef] [PubMed]
  6. Shi, W.; Chai, L.J.; Fang, G.Y.; Mei, J.L.; Lu, Z.M.; Zhang, X.J.; Xiao, C.; Wang, S.T.; Shen, C.H.; Shi, J.S.; et al. Spatial heterogeneity of the microbiome and metabolome profiles of high-temperature Daqu in the same workshop. Food Res. Int. 2022, 156, 13. [Google Scholar] [CrossRef]
  7. Wei, J.; Jie, W.; Baosheng, L.; Jianhui, D.; Xiaojun, W.; Zhihua, S.; Xinglin, H.; Pujie, H.; Chunguang, L.; Jianqin, H.; et al. Analysis of characteristic flavor compounds in single-grain chinese baijiu brewed from different raw materials. Food Sci. 2020, 41, 234–238, (In Chinese with English Abstract). [Google Scholar] [CrossRef]
  8. Huang, H.; Chen, Y.Y.; Hong, J.X.; Chen, H.; Zhao, D.R.; Wu, J.H.; Li, J.C.; Sun, J.Y.; Sun, X.T.; Huang, M.Q.; et al. Unraveling the chemosensory characteristics on different types of spirits based on sensory contours and quantitative targeted flavoromics analysis. Food Chem. X 2024, 23, 12. [Google Scholar] [CrossRef]
  9. Qiao, Z.; Shenghua, L.; Xiang, L.; Xin, H.; Yang, L.; Cheng, F.; Jie, D.; Tongling, D. Bioactive ingredients and microbial diversity of fuzhuan tea produced from different raw materials. Food Sci. 2020, 41, 69–77, (In Chinese with English Abstract). [Google Scholar] [CrossRef]
  10. Shang, A.; Li, J.H.; Zhou, D.D.; Gan, R.Y.; Li, H.B. Molecular mechanisms underlying health benefits of tea compounds. Free Radic. Biol. Med. 2021, 172, 181–200. [Google Scholar] [CrossRef]
  11. Ng, K.W.; Cao, Z.J.; Chen, H.B.; Zhao, Z.Z.; Zhu, L.; Yi, T. Oolong tea: A critical review of processing methods, chemical composition, health effects, and risk. Crit. Rev. Food Sci. Nutr. 2018, 58, 2957–2980. [Google Scholar] [CrossRef]
  12. Dai, Y.; Li, Z.; Tian, Z. Analysis of bacterial diversity in daqu and fermented grains for maotai-flavor liquor. Food Sci. 2019, 40, 152–159, (In Chinese with English Abstract). [Google Scholar] [CrossRef]
  13. Du, H.; Wang, X.S.; Zhang, Y.H.; Xu, Y. Exploring the impacts of raw materials and environments on the microbiota in Chinese Daqu starter. Int. J. Food Microbiol. 2019, 297, 32–40. [Google Scholar] [CrossRef]
  14. Zhao, L.; Wang, X.; Luo, Z.; Gan, G.; Wu, F.; Zhong, Y.; Wang, X. Optimization of the fermentation process of Moutai-flavored Daqu with the addition of green tea: Impacts on bacterial succession and endogenous factors. J. Food Sci. Technol. 2025; in press. [Google Scholar] [CrossRef]
  15. Tang, J.; Rao, J.; Zou, Y.; Liao, L.; Huang, D.; Luo, H. The community assembly patterns determined differences between the surface and the core microbial communities of Nongxiangxing Daqu. LWT-Food Sci. Technol. 2023, 183, 9. [Google Scholar] [CrossRef]
  16. Mondal, S.; Karande, M.; Srivastava, S.; Sharma, A.; Sharma, S.; Ghosh, A. Unravelling the microbiome perspective to variations in tea metabolome. Ind. Crop. Prod. 2025, 223, 14. [Google Scholar] [CrossRef]
  17. Bai, X. A Technical Study on the Tea-Flower Daqu Preparation. Ph.D. Thesis, Anhui Agricultural University, Hefei, China, 2016. (In Chinese with English Abstract). [Google Scholar]
  18. Ge, Y.H.; Wang, L.; Huang, Y.J.; Jia, L.Y.; Wang, J.H. Characteristic flavor compounds in Guizhou green tea and the environmental factors influencing their formation: Investigation using stable isotopes, electronic nose, and headspace-gas chromatography ion migration spectrometry. LWT-Food Sci. Technol. 2024, 196, 13. [Google Scholar] [CrossRef]
  19. Zuo, Q.; Huang, Y.; Guo, M. Evaluation of bacterial diversity during fermentation process: A comparison between handmade and machine-made high-temperature daqu of maotai-flavor liquor. Ann. Microbiol. 2020, 13, 14–23. [Google Scholar] [CrossRef]
  20. QB/T 4257-2011; General Methods of Analysis for Daqu. Ministry of Industry and Information Technology of the People’s Republic of China: Beijing, China, 2011; pp. 1–16. (In Chinese)
  21. Fadrosh, D.W.; Ma, B.; Gajer, P.; Sengamalay, N.; Ott, S.; Brotman, R.M.; Ravel, J. An improved dual-indexing approach for multiplexed 16S rRNA gene sequencing on the Illumina MiSeq platform. Microbiome 2014, 2, 7. [Google Scholar] [CrossRef]
  22. Lei, L.; Wu, T.; Wang, C. Effect of Gastrodia elata and Fagopyrum tataricum compound solution on synthesis of extracellular polysaccharide from Grifola frondosa and its fermentation kinetics. J. Food Sci. Technol. 2020, 38, 53–59, (In Chinese with English Abstract). [Google Scholar] [CrossRef]
  23. Bolyen, E.; Rideout, J.R.; Dillon, M.R.; Bokulich, N.; Abnet, C.C.; Al-Ghalith, G.A.; Alexander, H.; Alm, E.J.; Arumugam, M.; Asnicar, F.; et al. Reproducible, interactive, scalable and extensible microbiome data science using QIIME 2. Nat. Biotechnol. 2019, 37, 852–857. [Google Scholar] [CrossRef]
  24. White, E.P.; Adler, P.B.; Lauenroth, W.K.; Gill, R.A.; Greenberg, D.; Kaufman, D.M.; Rassweiler, A.; Rusak, J.A.; Smith, M.D.; Steinbeck, J.R.; et al. A comparison of the species-time relationship across ecosystems and taxonomic groups. Oikos 2006, 112, 185–195. [Google Scholar] [CrossRef]
  25. Dengler, J. Which function describes the species-area relationship best? A review and empirical evaluation. J. Biogeogr. 2009, 36, 728–744. [Google Scholar] [CrossRef]
  26. Liang, Z.; Zhuo, M.; Fuyong, W.; Lu, J.; Fangxiang, L.; Yanxia, Z.; Yang, Z.; Xinliang, M.; Hui, H.; Xinye, W. Roles of rare and abundant taxa in bacterial succession during pile fermentation in moutai-flavored baijiu making. Food Sci. 2022, 43, 168–175, (In Chinese with English abstract). [Google Scholar] [CrossRef]
  27. Baker, M.E.; King, R.S. A new method for detecting and interpreting biodiversity and ecological community thresholds. Methods Ecol. Evol. 2010, 1, 25–37. [Google Scholar] [CrossRef]
  28. Ning, D.L.; Yuan, M.T.; Wu, L.W.; Zhang, Y.; Guo, X.; Zhou, X.S.; Yang, Y.F.; Arkin, A.P.; Firestone, M.K.; Zhou, J.Z. A quantitative framework reveals ecological drivers of grassland microbial community assembly in response to warming. Nat. Commun. 2020, 11, 12. [Google Scholar] [CrossRef]
  29. Stegen, J.C.; Lin, X.J.; Fredrickson, J.K.; Konopka, A.E. Estimating and mapping ecological processes influencing microbial community assembly. Front. Microbiol. 2015, 6, 15. [Google Scholar] [CrossRef]
  30. Sloan, W.T.; Lunn, M.; Woodcock, S.; Head, I.M.; Nee, S.; Curtis, T.P. Quantifying the roles of immigration and chance in shaping prokaryote community structure. Environ. Microbiol. 2006, 8, 732–740. [Google Scholar] [CrossRef]
  31. Jiao, S.; Lu, Y. Abundant fungi adapt to broader environmental gradients than rare fungi in agricultural fields. Glob. Change Biol. 2020, 26, 4506–4520. [Google Scholar] [CrossRef]
  32. Zhao, L.; Luo, Z.; Hu, Z.; Zhang, Y.; Zhao, T.; Zhong, Y.; Wang, X. Linking phylogenetic niche conservatism in bacterial communities in sorghum root compartments revealed by the Hongyingzi cultivar. Plant Biol. 2025, 27, 134–145. [Google Scholar] [CrossRef]
  33. Blomberg, S.P.; Garland, T.; Ives, A.R. Testing for phylogenetic signal in comparative data: Behavioral traits are more labile. Evolution 2003, 57, 717–745. [Google Scholar] [CrossRef]
  34. Pagel, M. Inferring the historical patterns of biological evolution. Nature 1999, 401, 877–884. [Google Scholar] [CrossRef] [PubMed]
  35. Fritz, S.A.; Purvis, A. Selectivity in Mammalian Extinction Risk and Threat Types: A New Measure of Phylogenetic Signal Strength in Binary Traits. Conserv. Biol. 2010, 24, 1042–1051. [Google Scholar] [CrossRef] [PubMed]
  36. Boyle, E.E.; Adamowicz, S.J. Community Phylogenetics: Assessing Tree Reconstruction Methods and the Utility of DNA Barcodes. PLoS ONE 2015, 10, 18. [Google Scholar] [CrossRef]
  37. Goberna, M.; Verdú, M. Predicting microbial traits with phylogenies. ISME J. 2016, 10, 959–967. [Google Scholar] [CrossRef]
  38. Preston, F. Time and space and the variation of species. Ecology 1960, 41, 611–627. [Google Scholar] [CrossRef]
  39. McNaughton, S. Diversity and stability of ecological communities: A comment on the role of empiricism in ecology. Am. Nat. 1977, 111, 515–525. [Google Scholar] [CrossRef]
  40. Ives, A.R.; Dennis, B.; Cottingham, K.L.; Carpenter, S.R. Estimating community stability and ecological interactions from time-series data. Ecol. Monogr. 2003, 73, 301–330. [Google Scholar] [CrossRef]
  41. Ives, A.R.; Carpenter, S.R. Stability and diversity of ecosystems. Science 2007, 317, 58–62. [Google Scholar] [CrossRef]
  42. Shade, A.; Caporaso, J.G.; Handelsman, J.; Knight, R.; Fierer, N. A meta-analysis of changes in bacterial and archaeal communities with time. ISME J. 2013, 7, 1493–1506. [Google Scholar] [CrossRef]
  43. Caporaso, J.G.; Paszkiewicz, K.; Field, D.; Knight, R.; Gilbert, J.A. The Western English Channel contains a persistent microbial seed bank. ISME J. 2012, 6, 1089–1093. [Google Scholar] [CrossRef]
  44. Jiao, S.; Chen, W.M.; Wang, E.T.; Wang, J.M.; Liu, Z.S.; Li, Y.N.; Wei, G.H. Microbial succession in response to pollutants in batch-enrichment culture. Sci. Rep. 2016, 6, 11. [Google Scholar] [CrossRef]
  45. Jiao, S.; Zhang, Z.Q.; Yang, F.; Lin, Y.B.; Chen, W.M.; Wei, G.H. Temporal dynamics of microbial communities in microcosms in response to pollutants. Mol. Ecol. 2017, 26, 923–936. [Google Scholar] [CrossRef]
  46. Nekola, J.C.; White, P.S. The distance decay of similarity in biogeography and ecology. J. Biogeogr. 1999, 26, 867–878. [Google Scholar] [CrossRef]
  47. Oliver, A.; Lilley, A.; van der Gast, C. Species-Time Relationships for Bacteria; Horizon Scientific Press: Norwich, UK, 2012. [Google Scholar]
  48. Hatosy, S.M.; Martiny, J.B.H.; Sachdeva, R.; Steele, J.; Fuhrman, J.A.; Martiny, A.C. Beta diversity of marine bacteria depends on temporal scale. Ecology 2013, 94, 1898–1904. [Google Scholar] [CrossRef]
  49. Liang, Y.T.; Jiang, Y.J.; Wang, F.; Wen, C.Q.; Deng, Y.; Xue, K.; Qin, Y.J.; Yang, Y.F.; Wu, L.Y.; Zhou, J.Z.; et al. Long-term soil transplant simulating climate change with latitude significantly alters microbial temporal turnover. ISME J. 2015, 9, 2561–2572. [Google Scholar] [CrossRef] [PubMed]
  50. Gao, C.; Montoya, L.; Xu, L.; Madera, M.; Hollingsworth, J.; Purdom, E.; Singan, V.; Vogel, J.; Hutmacher, R.B.; Dahlberg, J.A.; et al. Fungal community assembly in drought-stressed sorghum shows stochasticity, selection, and universal ecological dynamics. Nat. Commun. 2020, 11, 14. [Google Scholar] [CrossRef] [PubMed]
  51. Huang, Y.; Li, D.; Mu, Y.; Zhu, Z.Y.; Wu, Y.Z.; Qi, Q.; Mu, Y.C.; Su, W. Exploring the heterogeneity of community and function and correspondence of “species-enzymes” among three types of Daqu with different fermentation peak-temperature via high-throughput sequencing and metagenomics. Food Res. Int. 2024, 176, 11. [Google Scholar] [CrossRef] [PubMed]
  52. Jiao, S.; Lu, Y. Soil pH and temperature regulate assembly processes of abundant and rare bacterial communities in agricultural ecosystems. Environ. Microbiol. 2020, 22, 1052–1065. [Google Scholar] [CrossRef]
  53. Jiao, S.; Yang, Y.F.; Xu, Y.Q.; Zhang, J.; Lu, Y.H. Balance between community assembly processes mediates species coexistence in agricultural soil microbiomes across eastern China. ISME J. 2020, 14, 202–216. [Google Scholar] [CrossRef]
  54. Liang, Z.; Xiangyong, W.; Zhenbiao, L.; Lu, J.; Fuyong, W.; Yanxia, Z.; Xinye, W. Effect of adding green tea on physicochemical characteristics and bacterial diversity of daqu during fermentation. Food Sci. 2024, 45, 59–68, (In Chinese with English Abstract). [Google Scholar] [CrossRef]
Figure 1. Temporal dynamics of microbial communities in four Daqu treatments. STRs of the bacterial (a) and fungal (b) communities; TDRs of the bacterial (c) and fungal (d) communities. Lines in panels (a,b) and (c,d) represent model-fitted curves for STRs and TDRs, respectively. Each curve corresponds to one of the four Daqu treatments.
Fermentation 11 00511 g001
Figure 2. NMDS ordination plots depicting the fermentation trajectories of (a) bacterial and (b) fungal communities across four Daqu types, based on Bray–Curtis dissimilarity metrics. Sample centroids, indicating significant separation among Daqu treatments, are marked in the plots. The four Daqu types are labeled as follows: A—(Original Daqu), B—(10% tea-added Daqu), C—(20% tea-added Daqu), and D—(30% tea-added Daqu). Temporal dynamics are highlighted by centroids with yellow-shaded backgrounds (Day 1, start of fermentation) and cyan-shaded backgrounds (Day 40, end of fermentation), illustrating shifts in microbial community structure over the fermentation period.
Fermentation 11 00511 g002
Figure 3. Temporal changes in the abundance of individual dominant ASVs are shown for (a) bacterial and (b) fungal communities using TITAN2. For each ASV, blue dots indicate a declining abundance (z−), and red dots indicate an increasing abundance (z+). Genus names for the ASVs are provided in the panels.
Fermentation 11 00511 g003aFermentation 11 00511 g003b
Figure 4. Analysis of community assembly processes in different Daqus. (a) Bar plot showing the relative importances (%) of heterogeneous selection, homogeneous selection, dispersal limitation, homogenizing dispersal and drift for bacterial and fungal communities. Fit of Sloan’s neutral model for (b) bacterial and (c) fungal communities. The continuous black line represents the best-fitting neutral model. The ASVs that occur more frequently than predicted by the model are shown in red points while those that occur less frequently than predicted are shown in green points. Dashed lines represent 95% confidence intervals around the model prediction. The ASVs within the confidence intervals (blue points) followed the neutral process. m indicates the estimated migration rate, and R2 indicates the fit to the neutral model. Pie chart displaying the occupancies of the ASVs shown in red, blue and green points.
Fermentation 11 00511 g004aFermentation 11 00511 g004b
Figure 5. Contributions of endogenous factors to each β-diversity metric for bacterial communities in (a) Original Daqu, (b) 10% tea-added Daqu, (c) 20% tea-added Daqu, and (d) 30% tea-added Daqu, and fungal communities in (e) Original Daqu, (f) 10% tea-added Daqu, (g) 20% tea-added Daqu, and (h) 30% tea-added Daqu, as determined by a random forest regression model. Circle size indicates variable importance (percent increase in mean squared error), while colors represent the direction (positive/negative) of the Spearman correlation. The bars display the total variation in β-diversity metrics explained by the endogenous factors across distinct Daqus.
Fermentation 11 00511 g005
Table 1. STRs Model Equations [(Richness = K + slope × ln(T)] for the Curves in Figure 1a,b.
Daqu TypesModels
Bacterial community
Original DaquRichness = 443.13 + 24.84ln(T)
10% tea-added DaquRichness = 453.56 + 22.56ln(T)
20% tea-added DaquRichness = 461.07 + 22.49ln(T)
30% tea-added DaquRichness = 466.58 + 20.39ln(T)
Fungal community
Original DaquRichness = 565.04 + 21.92ln(T)
10% tea-added DaquRichness = 634.71 + 9.89ln(T)
20% tea-added DaquRichness = 643.44 + 11.08ln(T)
30% tea-added DaquRichness = 648.27 + 13.01ln(T)
Note: All p values for parameters K and slope were statistically significant (p < 0.001).
Table 2. TDRs Model Equations (Ss = constantwT) for the Curves in Figure 1c,d.
Daqu TypesModelsR2
Bacterial community
Original DaquSs = 0.636 − 0.007T0.148
10% tea-added DaquSs = 0.566 − 0.010T0.171
20% tea-added DaquSs = 0.515 − 0.010T0.193
30% tea-added DaquSs = 0.595 − 0.007T0.135
Fungal community
Original DaquSs = 0.577 − 0.008T0.122
10% tea-added DaquSs = 0.523 − 0.009T0.164
20% tea-added DaquSs = 0.512 − 0.008T0.133
30% tea-added DaquSs = 0.599 − 0.008T0.163
Note: All p values for parameters constant, w and R2 were statistically significant (p < 0.001).
Table 3. Adonis and Anosim analysis of community structures among four Daqu types at each time point based on Bray–Curtis dissimilarity.
PeriodsAdonisAnosim
Bacterial community
Day1R2 = 0.369 n.s.R = 0.179 n.s.
Day6R2 = 0.627 ***R = 0.702 ***
Day12R2 = 0.606 ***R = 0.694 ***
Day15R2 = 0.402 *R = 0.287 *
Day30R2 = 0.333 n.s.R = 0.157 n.s.
Day40R2 = 0.549 **R = 0.528 **
Fungal community
Day1R2 = 0.374 n.s.R = 0.296 *
Day6R2 = 0.546 **R = 0.519 **
Day12R2 = 0.333 n.s.R = 0.077 n.s.
Day15R2 = 0.365 n.s.R = 0.176 n.s.
Day30R2 = 0.490 **R = 0.472 **
Day40R2 = 0.579 ***R = 0.630 **
Note: “n.s.” denotes no statistical significance (p > 0.05); asterisks indicate levels of significance: * p < 0.05; ** p < 0.01; *** p < 0.001.
Table 4. Exploration of the phylogenetic conservatism for the endogenous factors using the Fritz and Purvis D test [35], Blomberg’s K [33], and Pagel’s λ [34].
KindomDaqu TreatmentsPagel’s (1999) λ [34]Blomberg et al. (2003) K [33]Fritz & Purvis (2010) D Test [35]
AcidsStarchMoistureTempSACAcidsStarchMoistureTempSACAcidsStarchMoistureTempSAC
Bacteriaoriginal Daqu0.7040.0370.2370.999 ***0.1670.231 **0.1630.233 **1.225 *0.195 *0.783 *0.615 *0.927 ***−4.3390.530
10% tea-added Daqu0.475 **0.0000.0110.2320.0230.173 *0.1170.1200.1460.1400.250 *<0.0010.1130.468 *0.248
20% tea-added Daqu0.773 ***0.786 ***0.268 **0.2570.464 ***0.284 ***0.177 *0.0970.1360.192 **0.713 ***0.879 ***0.327 *0.080−0.013
30% tea-added Daqu0.0930.654 **0.2390.0000.1610.1980.2640.2110.1660.2100.0120.124−0.6750.2170.127
Fungioriginal Daqu0.861 ***0.696 *0.759 **0.824 ***0.4300.089 *0.0600.0150.070 **<0.0010.891 ***0.2530.391 *0.481 ***0.214
10% tea-added Daqu<0.0010.532 *0.813 ***0.2330.0200.3620.347 *0.571 ***0.1080.2710.1400.4810.819 **−0.1410.188
20% tea-added Daqu<0.001<0.001<0.001<0.001<0.0010.5100.8120.7710.5750.490−0.9750.958−1.256−0.791−1.279
30% tea-added Daqu<0.001<0.001<0.0010.0590.3140.2440.2460.1790.2180.2120.5210.869 *−0.041−0.3460.356
Note: The statistically significant values (p < 0.05) are displayed in bold. Significance levels are denoted as follows: p < 0.05: *, p < 0.01: **, p < 0.001: ***. To compare the D values [35] with the Blomberg’s K [33] and Pagel’s λ [34] statistics, we transformed the D values into −D + 1 according to Marta and Miguel (2016) [37]. Acids—Acidity, Starch—starch content, Temp—Temperature, SAC—saccharifying power, Moisture—moisture content.
Disclaimer/Publisher’s Note: The statements, opinions and data contained in all publications are solely those of the individual author(s) and contributor(s) and not of MDPI and/or the editor(s). MDPI and/or the editor(s) disclaim responsibility for any injury to people or property resulting from any ideas, methods, instructions or products referred to in the content.