Article

How Does Methanogenic Inhibition Affect Large-Scale Waste-to-Energy Anaerobic Digestion Processes? Part 1—Techno-Economic Analysis

by
Denisse Estefanía Díaz-Castro
1,
Ever Efraín García-Balandrán
2,
Alonso Albalate-Ramírez
2,
Carlos Escamilla-Alvarado
2,
Sugey Ramona Sinagawa-García
1,
Pasiano Rivas-García
2,* and
Luis Ramiro Miramontes-Martínez
1,*
1
Facultad de Agronomia, Universidad Autonoma de Nuevo Leon, Av. Francisco Villa S/N, Col. Ex Hacienda el Canada, General Escobedo 66050, Nuevo Leon, Mexico
2
Facultad de Ciencias Quimicas, Universidad Autonoma de Nuevo Leon, Av. Universidad S/N, Cd. Universitaria, San Nicolas de los Garza 64451, Nuevo Leon, Mexico
*
Authors to whom correspondence should be addressed.
Fermentation 2025, 11(9), 510; https://doi.org/10.3390/fermentation11090510 (registering DOI)
Submission received: 8 July 2025 / Revised: 21 August 2025 / Accepted: 28 August 2025 / Published: 31 August 2025

Abstract

This two-part study assesses the impact of biogas inhibition on large-scale waste-to-energy anaerobic digestion (WtE-AD) plants through techno-economic and life cycle assessment approaches. The first part addresses technical and economic aspects. An anaerobic co-digestion system using vegetable waste (FVW) and meat waste (MW) was operated at laboratory scale in a semi-continuous regime with daily feeding to establish a stable process and induce programmed failures causing methanogenic inhibition, achieved by removing MW from the reactor feed and drastically reducing the protein content. Experimental data, combined with bioprocess scale-up models and cost engineering methods, were then used to evaluate the effect of inhibition periods on the profitability of large-scale WtE-AD processes. In the experimental stage, the stable process achieved a yield of 521.5 ± 21 mL CH4 g−1 volatile solids (VS) and a biogas productivity of 0.965 ± 0.04 L L−1 d−1 (volume of biogas generated per reactor volume per day), with no failure risk detected, as indicated by the volatile fatty acids/total alkalinity ratio (VFA/TA, mg VFA L−1/mg L−1) and the VFA/productivity ratio (mg VFA L−1/L L−1 d−1), both recognized as effective early warning indicators. However, during the inhibition period, productivity decreased by 64.26 ± 11.81% due to VFA accumulation and gradual TA loss. With the progressive reintroduction of the FVW:MW management and the addition of fresh inoculum to the reaction medium, productivity recovered to 96.7 ± 1.70% of its pre-inhibition level. In WtE-AD plants processing 60 t d−1 of waste, inhibition events can reduce net present value (NPV) by up to 40.2% (from 0.98 M USD to 0.55 M USD) if occurring once per year. Increasing plant capacity (200 t d−1), combined with higher revenues from waste management fees (99.5 USD t−1) and favorable electricity markets allowing higher selling prices (up to 0.23 USD kWh−1), can enhance resilience and offset inhibition impacts without significantly compromising profitability. These findings provide policymakers and industry stakeholders with key insights into the economic drivers influencing the competitiveness and sustainability of WtE-AD systems.

1. Introduction

Globally, there are high levels of food loss and waste. In 2019, 13.3% of food produced was wasted during pre-consumption stages (processing, storage, and distribution), while 17% of food available to consumers ended up in the trash of households, restaurants, stores, and other food service providers [1]. In Mexico, the primary waste management strategy for these residues is through final disposal sites (FDS). Rueda-Avellaneda et al. [2] identified 2197 operational FDS, of which 92.6% were open dumps and only 7.4% were sanitary landfills (SL). In 2022, approximately 8.95 million tons of food were discarded in Mexico, mainly during the distribution and retail stages of the food supply chain, resulting in greenhouse gas emissions (GHG) from FDS of up to 0.22 million tons of CO2 eq [3].
The FDSs can also cause groundwater contamination, unpleasant odors, and the loss of materials with potential for recovery or recycling [4]. Waste-to-energy technologies, such as anaerobic digestion (hereinafter referred to as the WtE-AD process), offer a promising alternative to reduce the environmental impact associated with the current disposal system [5,6].
WtE-AD processes, in addition to organic waste management, enable the controlled production of biogas (60% CH4 and 40% CO2) and digestate. These by-products can be used for the generation of clean electricity and biofertilizers, respectively [7]. Tsydenova et al. [8] analyzed the management of the organic fraction of urban solid waste through WtE-AD processes and determined GHG emissions of 4.01 kg of CO2 eq t−1 of waste. Miramontes-Martínez et al. [9] evaluated the environmental and economic viability of managing fruit and vegetable waste (FVW) through WtE-AD processes in a Latin American context. The study estimated mitigation of 71.12 kg CO2 eq t−1, compared to the 867 kg CO2 eq t−1 emitted when disposing of these wastes in SL, highlighting the environmentally friendly potential of WtE-AD processes. However, the authors note that the economic viability of these processes is limited by the high initial investment, the low revenues derived from organic waste management, and government regulations that set the selling price of electricity.
Process instability due to substrate supply disturbances is a key factor that compromises the economics of WtE-AD. Alvarado-Reina et al. [10] evaluated biogas stability and biogas productivity (volume of biogas generated per reactor volume per day) in a laboratory-scale continuous stirred-tank reactor (CSTR) under controlled feed disturbance. The authors reported a productivity of 2.45 L L−1 d−1 when the feed composition remained constant. However, a 92.6% decrease in productivity was observed when the bromatological characteristics of the feed were perturbed. Nielsen et al. [11] analyzed various WtE-AD processes in Denmark and observed that methane production decreased by up to 70% over several months due to process instability. This instability was associated with multiple factors, including an increase in the concentration of inhibitory compounds caused by a lack of knowledge and improper substrate handling; insufficient understanding of the degradation characteristics of the organic waste; inadequate process monitoring, especially concerning volatile fatty acids; limited pre-storage capacity and poor waste mixing in pre-storage tanks; foam formation; and inefficient dosing of waste into the reactor.
The economic viability of large-scale WtE-AD processes and the influence of variability in the composition of organic waste substrates are still poorly addressed in the literature. Most studies assume a constant and homogeneous waste stream, which is rarely representative of real-world, large-scale operations. However, maintaining a stable composition of the feedstock in WtE-AD systems is challenging due to factors such as geographic location and collection source [12], seasonal variations, collection methods, and consumption patterns [13,14].
Although the literature on the direct economic impacts of inhibition events—such as methanogenic inhibition—on WtE-AD performance remains limited, numerous studies have documented broader structural and economic barriers that have historically compromised the financial feasibility of these technologies. Key challenges include inadequate subsidy design, restricted access to energy markets, volatile electricity prices, and high operation and maintenance (O&M) costs [15,16,17,18]. For instance, Zheng et al. [17] highlight how China’s AD sector suffers from weak long-term incentives and inadequate support for digestate valorization despite large-scale infrastructure investments. In Latin America, systemic limitations such as the absence of integrated policy frameworks, insufficient fiscal mechanisms, and a lack of sustainability indicators in waste management planning have been identified as critical barriers to advancing WtE-AD adoption.
This research aims to determine the impact of methanogenic inhibition on the technical, economic, and environmental viability of large-scale WtE-AD processes. In this first part, the effect of methanogenic inhibition on stability and specific methane production in laboratory-scale processes was quantified. The experimental results were subsequently integrated into mathematical models to scale up the WtE-AD process to determine the energy viability of different scenarios, both inhibited and uninhibited. Finally, a cost engineering analysis was conducted to evaluate the economic impact of inhibition events and to identify conditions that can counteract these phenomena, aiming to develop more resilient WtE-AD processes. This study identifies key factors and barriers influencing the viability of large-scale WtE-AD process treating real, complex organic waste. Furthermore, it proposes technical and economic solutions to ensure favorable economics. The findings offer policymakers and industry stakeholders clear guidance for informed decision-making, highlighting the economic drivers that determine their competitiveness and sustainability.

2. Materials and Methods

2.1. Experimental Development at Laboratory Scale

2.1.1. Selection and Characterization of Substrates and Inoculum

The sludge from a CSTR-type anaerobic digester, which manages wastewater from the brewing industry in the state of Nuevo León, Mexico, served as the source inoculum. (25°40′ 30.3″ N 100°19.108′ O). Experimental tests were conducted to quantify the specific methanogenic activity present in the inoculum through the biochemical methane potential (BMP). The BMP tests were carried out using a glucose concentration of 30 g L−1 and inoculum (with a 1:1 volume ratio), added to serological bottles with a total volume of 120 mL and operating volume of 60 mL, with an operating temperature of 35 °C, and manual shaking once a day. The measurement of methane production was conducted daily using a displacement column of NaOH. The BMP test ended when daily methane production for three consecutive days was less than 1% of the cumulative volume [19].
Fruit and vegetable waste (FVW) and meat waste (MW) were used as substrates. The FVW were collected from the Agronomy Faculty cafeteria, and the MW from the Food Industry Research and Development Center (CIDIA), both located at the Autonomous University of Nuevo Leon (UANL). Once collected, the substrates were transported in coolers to the laboratory, where they were ground separately in an industrial blender (TAPISA®, Monterrey, Mexico) until they were homogenized. Both substrates were subsequently sealed in polyethylene terephthalate (PET) bottles and stored at −18 °C until use.
Physicochemical characterization of the substrates followed Mexican standards, including solids profile following the standard NMX-AA-034-SCFI-2015 [20], volatile fatty acids (VFA), and alkalinity according to NMX-AA-036-SCFI-2001 [21]. Total solids, ash, and volatile solids were determined by drying at 105 °C and calcining at 450–550 °C. Alkalinity was measured by titration with HCl, and VFA by distilling the alkalinity sample and titrating the distillate with NaOH.

2.1.2. Reaction System

The laboratory-scale WtE-AD process was conducted for duplicates in two borosilicate glass Applikon® reactors (Applikon Biotechnology B.V., Delft, The Netherlands), reactor 1 (R1) with a volume of 4 L and reactor 2 (R2) with a volume of 7 L. As shown in Figure 1, each reactor had a stainless-steel flange at the top, sealed with a rubber gasket, which housed the feed ports, the liquid effluent outlet, and the gas outlet. To minimize moisture loss within the reactor, the gas outlet was equipped with a counterflow condenser cooled with water at 8 °C. The cooling water for the condenser was supplied by a temperature-controlled Scorpion® bath (NEOCITEC, S.A. de C.V, Mexico City, Mexico), fitted with a recirculation pump. The biogas flowed through a Prendo® volumetric flow sensor (EV-PRENDO, S.A. de C.V., Puebla, Mexico) connected to a Tedlar® bag (Dupont, New York, NY, USA). Volumetric flow rate was used to quantify biogas productivity (L L−1 d−1) and yield (L g VS−1). Biogas was collected in Tedlar gas sampling bags and replaced daily with empty bags. A flame test was performed on the collected biogas to verify combustibility. Both reactors operated in parallel and independently of each other, each with its own biogas collection and measurement system.
Each reactor was equipped with instrumentation for monitoring and controlling agitation, temperature, and pH (the latter was not controlled) via a graphical interface. Temperature was maintained at 35 °C using an Applikon® heating blanket (Applikon Biotechnology B.V., Delft, The Netherlands), while motorized stirring was provided from the top of the reactor using 60 mm diameter Rushton propellers.
The hydraulic retention time (HRT) and organic loading rate (OLR) for both reactors were set at 20 d and 2 g VS L−1 d−1, respectively. The selected HRT is suitable for effective methanation in laboratory-scale organic waste AD processes [22].

2.1.3. Feeding Scheme for the Scale-Laboratory WtE-AD Process

Initially, both reactors were loaded with inoculum up to 60% of their total volume, and substrate preparation feeding was performed weekly, with the concentration of VS adjusted to 30 g L−1. The feeding scheme consists of three stages, as shown in Figure 2. The stabilization stage consists of a semi-continuous feed, with a 1:1 FVW:MW ratio on a VS basis. These conditions were maintained constantly up to just over two HRT. After this period, methanogenic inhibition was induced by removing MW (primary protein source) and adding distilled water to keep a constant feed volume, while keeping FVW unchanged. The absence of MW reduced protein availability, limiting amino acid fermentation and NH3 release, which affected the NH4+/NH3 equilibrium in solution and decreased buffering capacity and process stability [22,23]. The OLR applied during this stage was 1 g VS L−1 d−1 (Figure 2).
In this work, no specific duration of the methanogenic inhibition stage was established. This stage ended when daily biogas production was considered insignificant, and the pH dropped to 6.4, a value considered critical in the literature, as it falls outside the optimal pH range for methanogenic archaea [24]. The recovery stage involved gradually reintroducing MW into the feed while continuing the addition of active inoculum (Figure 2). The fed inoculum had the same concentration as the substrates (30 g VS L−1). On day 89, following a pH drop below 6.4 and negligible biogas production, 20% of the reactor’s liquid phase was replaced with inoculum to supply active biomass and remove metabolites such as VFA and inactive microorganisms.
During all stages, the digestate was stored at 4 °C in sealed PET containers and characterized daily according to the standards shown in Section 2.1.1 (solids profile, VFA, and total alkalinity).
The stability of the laboratory-scale WtE-AD process was evaluated to determine the metabolic status of the reaction medium. The literature recommends early warning (EW) indicators based on physicochemical tests, which are inexpensive, and the technology is readily available [24]. Physicochemical EW measures the metabolic intermediates or end products of AD, which can often be determined using titration techniques. While fluctuations in physicochemical EW values can be considered the result, rather than the source, of instability, monitoring these indicators is sufficient to provide valuable information on the digester’s condition [10]. The stability indicators analyzed were pH, the VFA/TA ratio (mg VFA L−1/mg L−1), and the VFA/Productivity ratio (mg VFA L−1/L L−1 d−1), which are recommended in the literature for WtE-AD processes of FVW management [10,25].

2.2. Conceptualization and Design of the Large-Scale WtE-AD Process

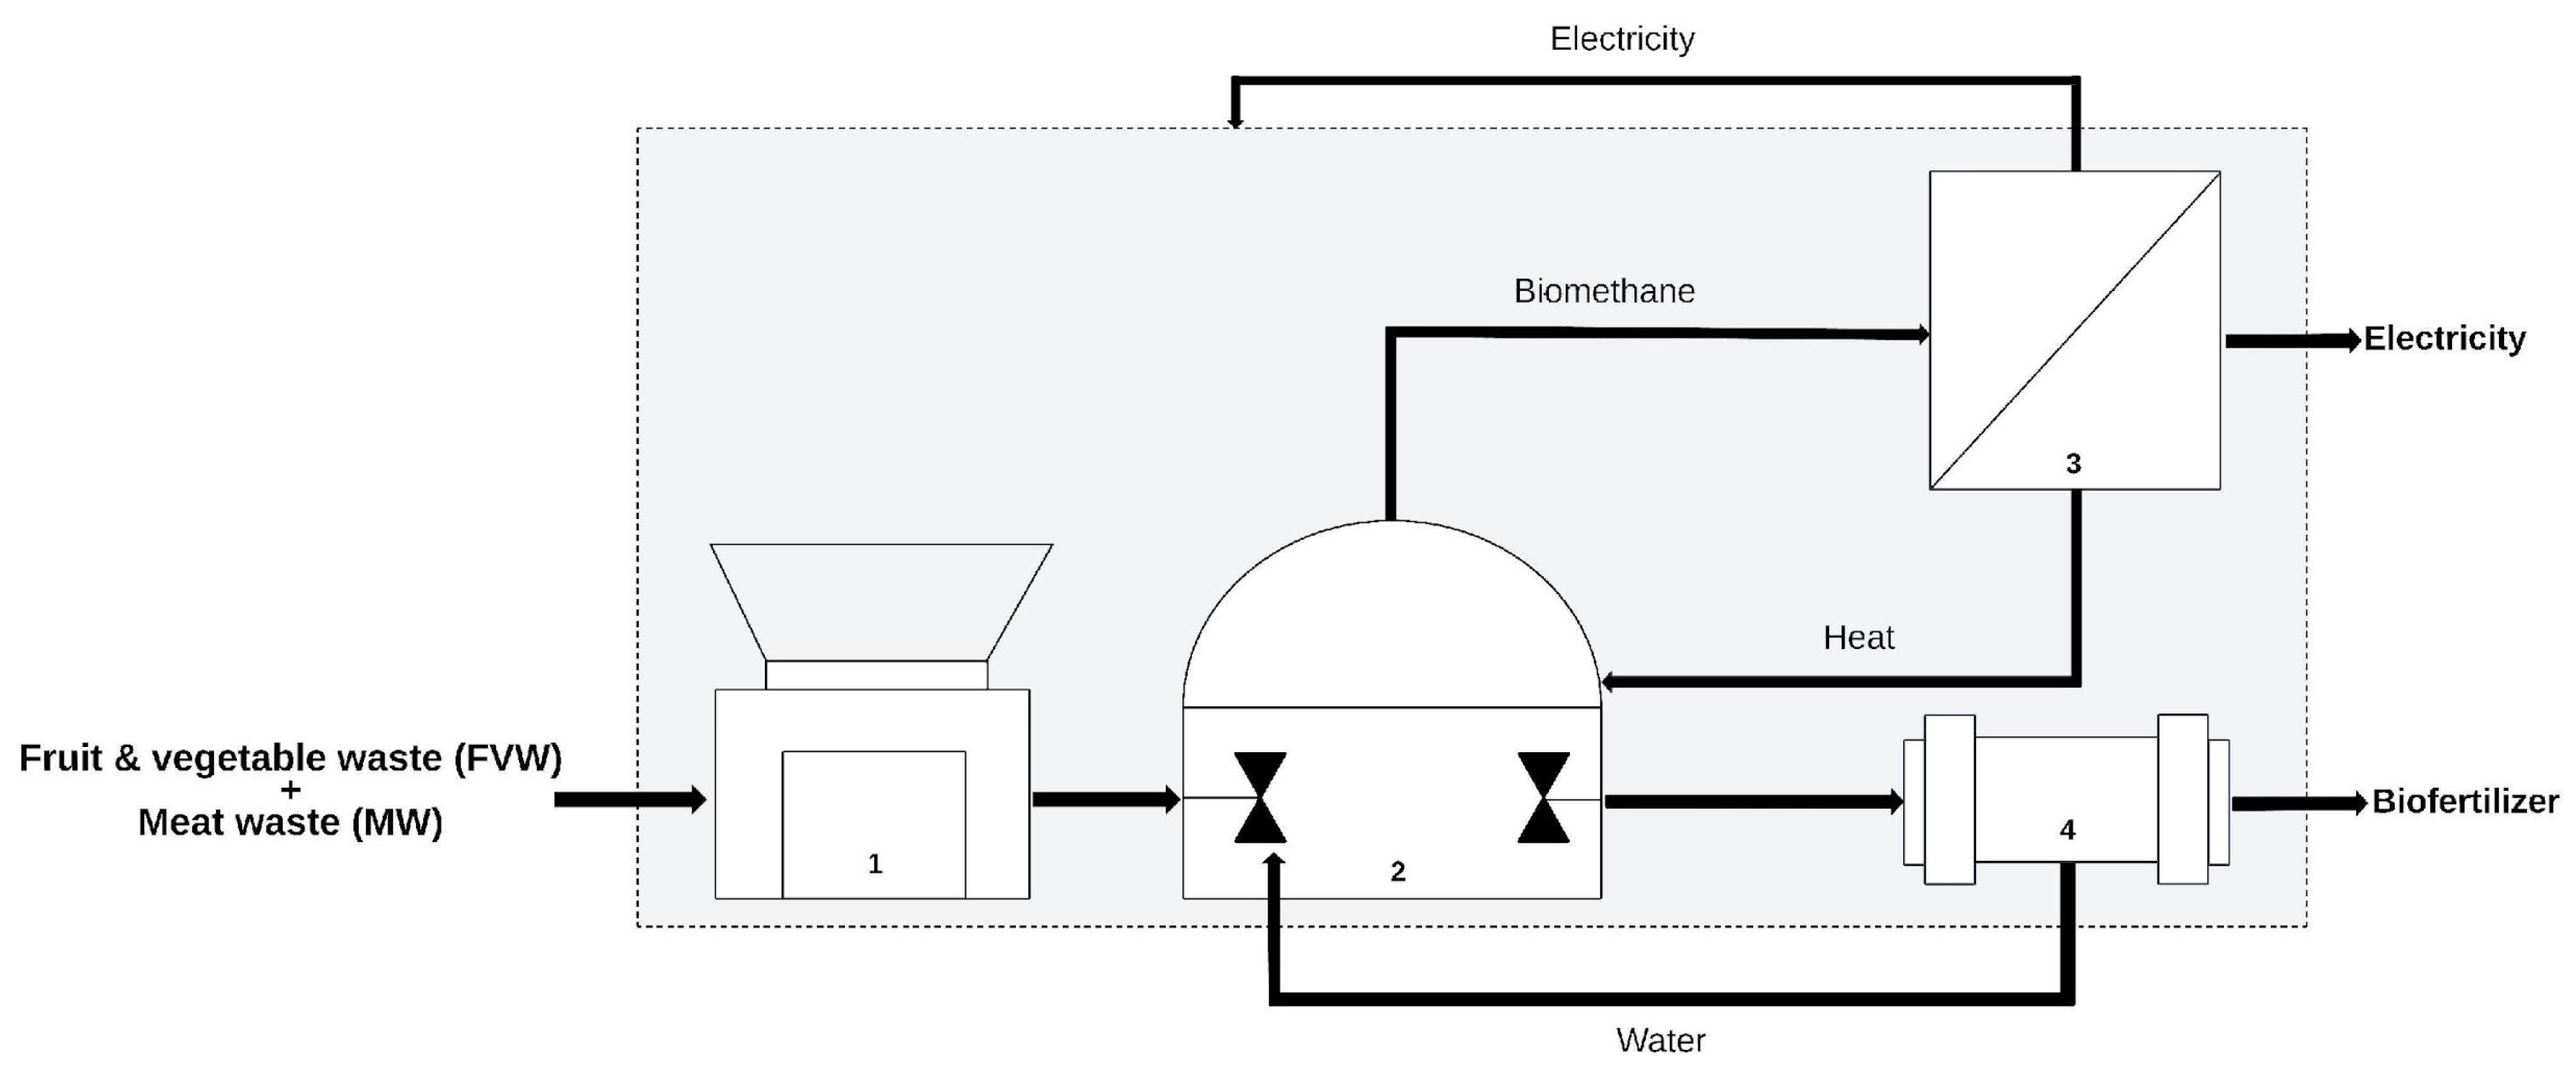
The WtE-AD process was designed based on four primary operations and unit processes, following the model proposed by Albalate-Ramírez et al. [12]: (1) a food waste shredder, (2) an anaerobic digester with heating and agitation, (3) a combined heat and power (CHP) unit for electricity and heat generation from methane, and (4) a rotary drum dryer for sludge dewatering. Each unit operation was modeled individually to estimate its energy demand and its role in the overall energy balance. The simulation of each operation (Figure 3) was carried out by modeling the energy consumption associated with shredding, anaerobic digestion, cogeneration, and drying, as well as the net energy production resulting from each scenario (Equations (1)–(5)).
The model considered variations in waste management capacity, ranging from 33 to 200 t d−1 (Section 2.4). The effect of methanogenic inhibition was evaluated by simulating the absence of MW in the feedstock, which resulted in a significant reduction in specific methane production (Section 2.5).
Equations (1) and (2) represent the energy consumption of the heating and stirring operations of the anaerobic digester in kWh [26], Eheat and Estirr, respectively. In Equation (1), Cp,mix and ρmix are the heat capacity and density of the input mix to the digester, ka/s represents the overall heat transfer coefficient, ηheat is the heat transfer efficiency, and A is the surface area of the digester available for heat exchange. The parameters (TrT0) and (TrTout) correspond to the differences between the digester operating temperature (Tr) and the starting temperature (T0) and between the digester operating temperature and surrounding temperatures (Tout), respectively.
In Equation (2), Np represents a dimensionless number that ensures turbulence conditions during agitation and was set to a value of 0.72 as recommended by Piccinno et al. [26]. N and d are the angular velocity and the diameter of the digester agitator, ηstirr is the efficiency of stirring, and t is the operating time. The values and units for the parameters used can be found in Tables S1 and S2 of the Supplementary Material Section of Albalate-Ramírez et al. [12].
E h e a t = C p , m i x   ρ m i x   T r   T 0 +   A   k a / s ( T r T o u t ) η h e a t
E s t i r r = N p   ρ m i x   N 3   d 5   t   η s t i r r
Equations (3) and (4) describe the energy consumption associated with organic waste shredding and digestate drying, denoted as Eshredder and Edryer, respectively. These unit operations were modeled using data collected from technical specifications of industrial equipment, including knife-type food shredders and rotary drum sludge dryers. Energy consumption values (kWh) were obtained as a function of treatment capacity (TC, in t d−1), and regression models were developed to represent the behavior of each unit. The corresponding regression curves are presented in Figures S1 and S2 of the Supplementary Material of Albalate-Ramírez et al. [12].
E s h r e d d e r = 150.01 l n T C + 57.46
E d r y e r = 38.52 ( T C ) 0.804
The net energy produced by the WtE-AD process was estimated using Equation (5), where Eout represents the daily energy output in kWh d−1. This value was calculated as the product of the volumetric methane production (m3 d−1), the lower heating value of methane (LHVCH4, kWh m−3), and the efficiency of the combined heat and power (CHP) unit (ηelectrical = 35% [27] and ηthermal = 48% [27]).
Methane production was estimated from the total mass flow of organic waste fed to the system (M, in t d−1), and the specific methane production (YCH4, in m3 CH4 t−1 of volatile solids) obtained from the stabilization stage and the methanogenic inhibition stage at laboratory scale.
E o u t = M   Y C H 4   L H V C H 4   η C H P
The model considers the effects of economies of scale through an economic revenue model that includes waste management fees, electricity, and biofertilizer sales, as well as variable capital and O&M costs, all based on organic waste management capacity. Furthermore, the interaction of external variables that affect economic performance, such as interest rates and tax systems, is also taken into consideration. These are detailed in the following section. Although the WtE-AD model can account for the economic impacts associated with waste transportation, these aspects were not considered in this study.

2.3. Economic Evaluation of the WtE-AD Process in a Latin American Context

2.3.1. Investment and O&M Costs

The investment (inv), operation, and maintenance (O&M) costs of the WtE-AD plant were estimated using regression models based on the treatment capacity of anaerobic digestion plants at an industrial scale, as reported by Miramontes-Martínez et al. [9]. The investment cost model, expressed in USD, is given by:
C i n v = 7.085 l n Q 53.036
where Q is the annual treatment capacity (t y−1). The O&M costs model, expressed in USD y−1, is given by:
C O & M = 0.5333 l n Q 4.1723
These functions were obtained from correlations between plant size and costs using industrial-scale AD data [28]. Investment cost includes land acquisition, civil works construction activities, and the equipment necessary for the process to function correctly. The O&M costs include regular maintenance of the CSTRs and auxiliary equipment, utilities, and other operating expenses required to ensure the continuous performance of the process.

2.3.2. Value-Added Products and Waste Management Fees

In this study, the economic income of the large-scale WtE-AD process is considered to be the sale of electricity (0.05 USD kWh−1 [29]) and biofertilizer (129 USD t−1 [30], adjusted for inflation), as well as an organic waste management fee of 33 USD t−1 [31]. Potential economic income from greenhouse gas emission allowances, preferential tariffs for clean electricity production, and heat sales were not considered in this study because there is no regulated market for their commercialization in Latin America.

2.3.3. Economic Analysis of the Large-Scale WtE-AD Process

Net present value (NPV) was implemented as a criterion to determine the economic viability of the large-scale process. The literature recommends a minimum acceptable rate of return of 8.4% and a 25-year project horizon. Additionally, an initial investment of 50% is made with equity capital, and the remaining 50% is financed through bank loans at an interest rate of 6.27% for a term of 10 years [9].
The economic analysis assumes that operating and maintenance costs increase pro-proportionally to the annual inflation rate. The depreciation corresponding to the WtE-AD plant was estimated at 100% after the first year of operation. This assumption is consistent with the Mexican income tax law, which allows full depreciation in the first year for equipment used in renewable energy generation projects, as an incentive to promote investment in clean energy technologies. Due to the significant economic benefits that WtE-AD plants can generate, an income tax rate of 35% was considered in the economic assessment [32]. Table 1 shows the economic information required for the NPV analysis of the process.

2.4. Sensitivity Analysis of Large-Scale WtE-AD Process Effects on Economic Performance

A sensitivity analysis was performed to determine the minimum organic waste management capacity required for financial viability (NPV > 0 USD) of the WtE-AD process in a Latin American context. Different waste management capacity scenarios were evaluated, ranging from 33 to 200 t d−1; the range reported for waste management of similar processes in the literature [9]. This analysis considered a stable and unaltered feed of FVW and MW over the process time horizon. Electricity production was estimated based on the specific methane production obtained in the laboratory-scale stabilization stage (Section 2.1.3).

2.5. Analysis of the Economic Impact of the Inhibition Events in a Large-Scale WtE-AD Process

To quantify the economic effects of inhibition events (IEs) in a large-scale WtE-AD process, a sensitivity analysis was performed using treatment capacities ranging from 33 to 200 t d−1 (Section 2.4). IEs are defined as the complete absence of MW in the feedstock, which leads to measurable reductions in both electricity generation and organic-waste management capacity. Electricity and biofertilizer outputs were estimated from the specific methane production obtained in the methanogenic inhibition stage.
Scenarios considered 0–10 IEs over a 25-year time horizon, and for each scenario, total revenue—expressed as NPV (million USD)—was calculated as the sum of clean-electricity sales, biofertilizer sales, and waste management fees.

2.6. Sensitivity Analysis of Waste Management Income and Electricity Price for the Large-Scale WtE-AD Process

To quantify the economic impact of waste management income and electricity price in large-scale WtE-AD processes, two sensitivity analyses were performed. The first evaluates the effect of waste management income within a range of 33 to 44 USD t−1, keeping electricity sales (0.05 USD kWh−1) and biofertilizer sales (129 USD t−1) constant. The second analysis evaluates different electricity price scenarios, holding waste management revenues (33 USD t−1) and biofertilizer sales (129 USD t−1) constant. Electricity prices considered were Mexico (0.05 and 0.1 USD kWh−1), New York, USA (0.088 USD kWh−1), Italy (0.125 USD kWh−1), and Germany (0.237 USD kWh−1). In both analyses, the management capacity of the WtE-AD process was the same as that obtained in the study described in Section 2.4.

3. Results and Discussion

3.1. Performance of Laboratory-Scale Digesters

This section presents the performance of the laboratory-scale WtE-AD process. Table 2 presents the results of characterizing the fresh substrates and inoculum. The inoculum meets the quality criteria proposed in the literature, except for total alkalinity; however, its origin and methanogenic activity (349 ± 24 mL CH4 g VS−1, obtained from the 25-day BMP test), higher than that of cattle manure (238 ± 19 mL CH4 g VS−1 [35], common as inoculum) indicates an active microorganism. The inoculum had considerable ash content, likely due to its origin (sedimented microorganisms from a large-scale CSTR) and the fact that a significant portion of the organic matter had been mineralized by microbial degradation [36]. The FVW and MW had VS and ash contents within the range reported in the literature. The same table shows that FVW has a high concentration of VFA, low alkalinity, and an acidic pH compared to MW. Li et al. [23] indicate that VFA and their accumulation in anaerobic reactors are the primary cause of low specific methane production and total or partial inhibition of the process due to acidification. The risk of acidification is aggravated when VFA is generated in the presence of low concentrations of alkaline compounds [37].
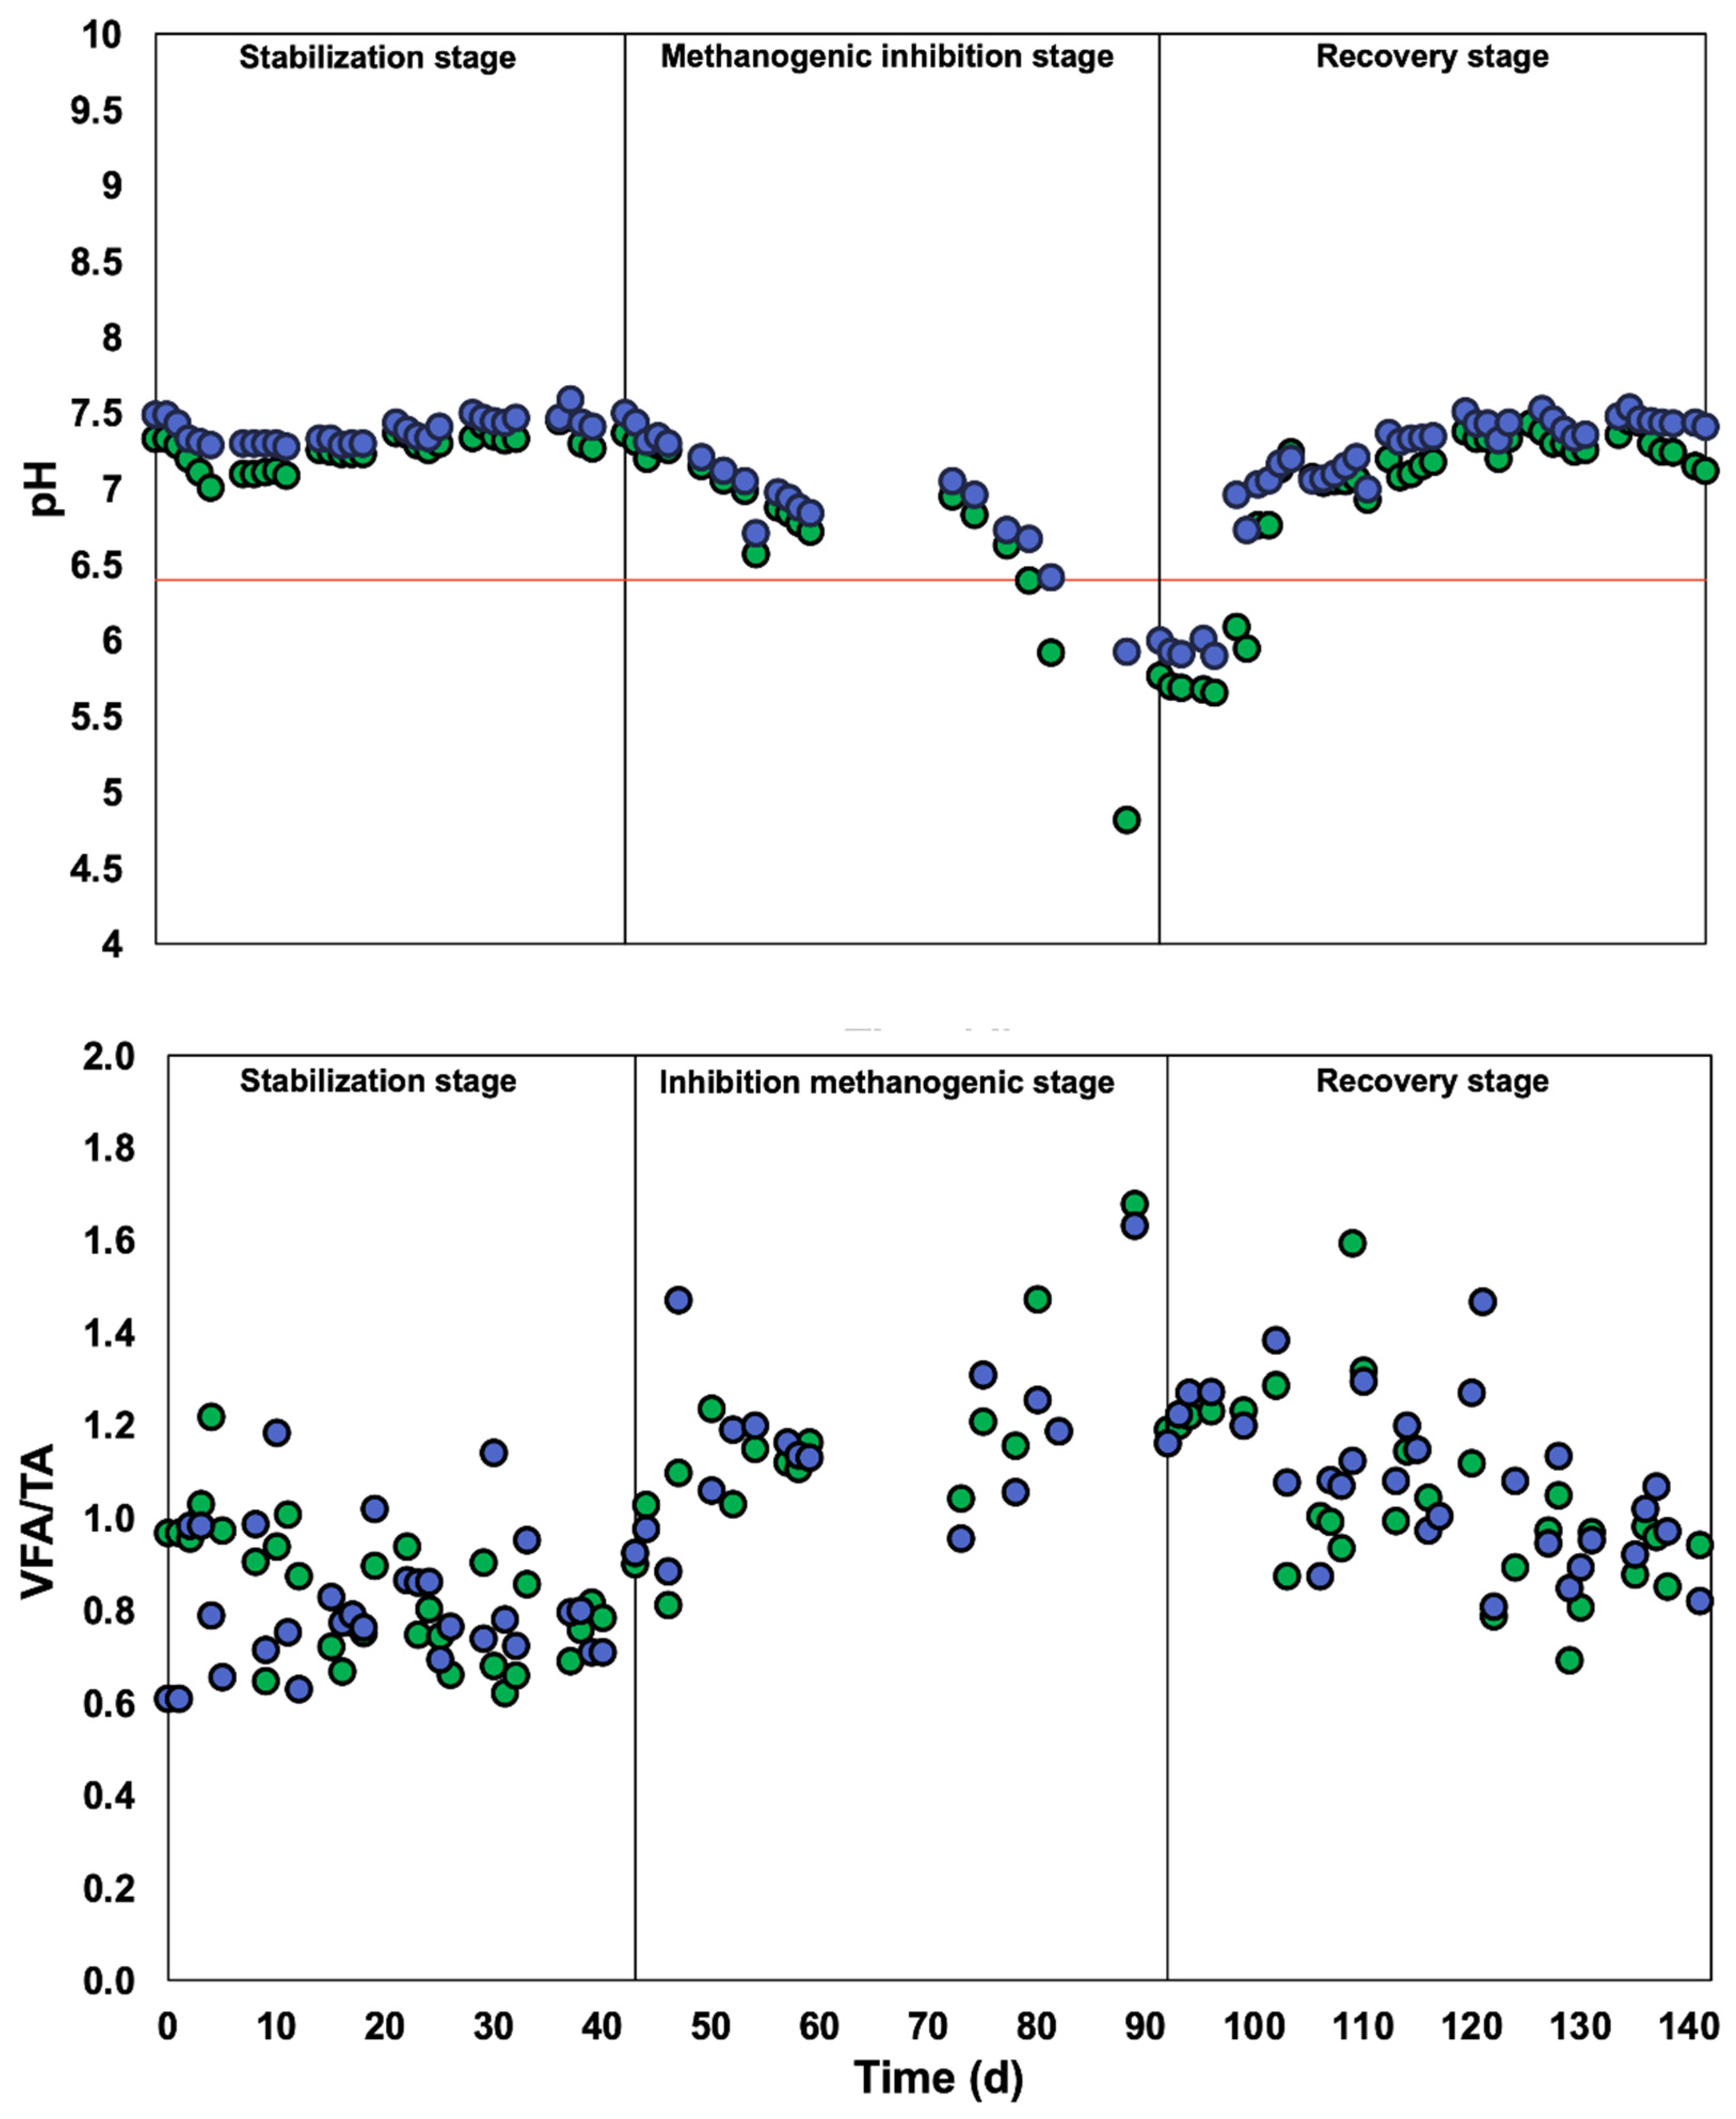
The pH and EW of the VFA/TA ratio are shown in Figure 4 (R1 green and R2 blue, for reactors 1 and 2, respectively). The pH remained stable during the stable phase (0 to 42 days), at 7.26 ± 0.12 (R1) and 7.39 ± 0.08 (R2), due to the adequate VFA/TA ratio observed during the same period. During the methanogenic inhibition stage (42 to 91 days), a slow decrease in pH and an increase in the VFA/TA ratio are observed. At this stage, MW was eliminated from the feed, and its absence resulted in a decrease in protein in the substrate. According to the literature, slaughterhouse waste (SHW), similar to MW, is composed of 49.04 ± 0.96% protein, 0.65 ± 1.12% carbohydrates, and 41.04 ± 0.72% lipids [22]. In contrast, FVW is composed of 7.12 ± 0.26% protein, 74.27 ± 0.36% carbohydrates, and 6.05 ± 0.41% lipids [22]. The absence of protein can limit amino acid fermentation and NH3 release, affecting the equilibrium between NH3 and the NH4+ ion and decreasing the buffering capacity of the reactive medium, thereby reducing its stability [39].
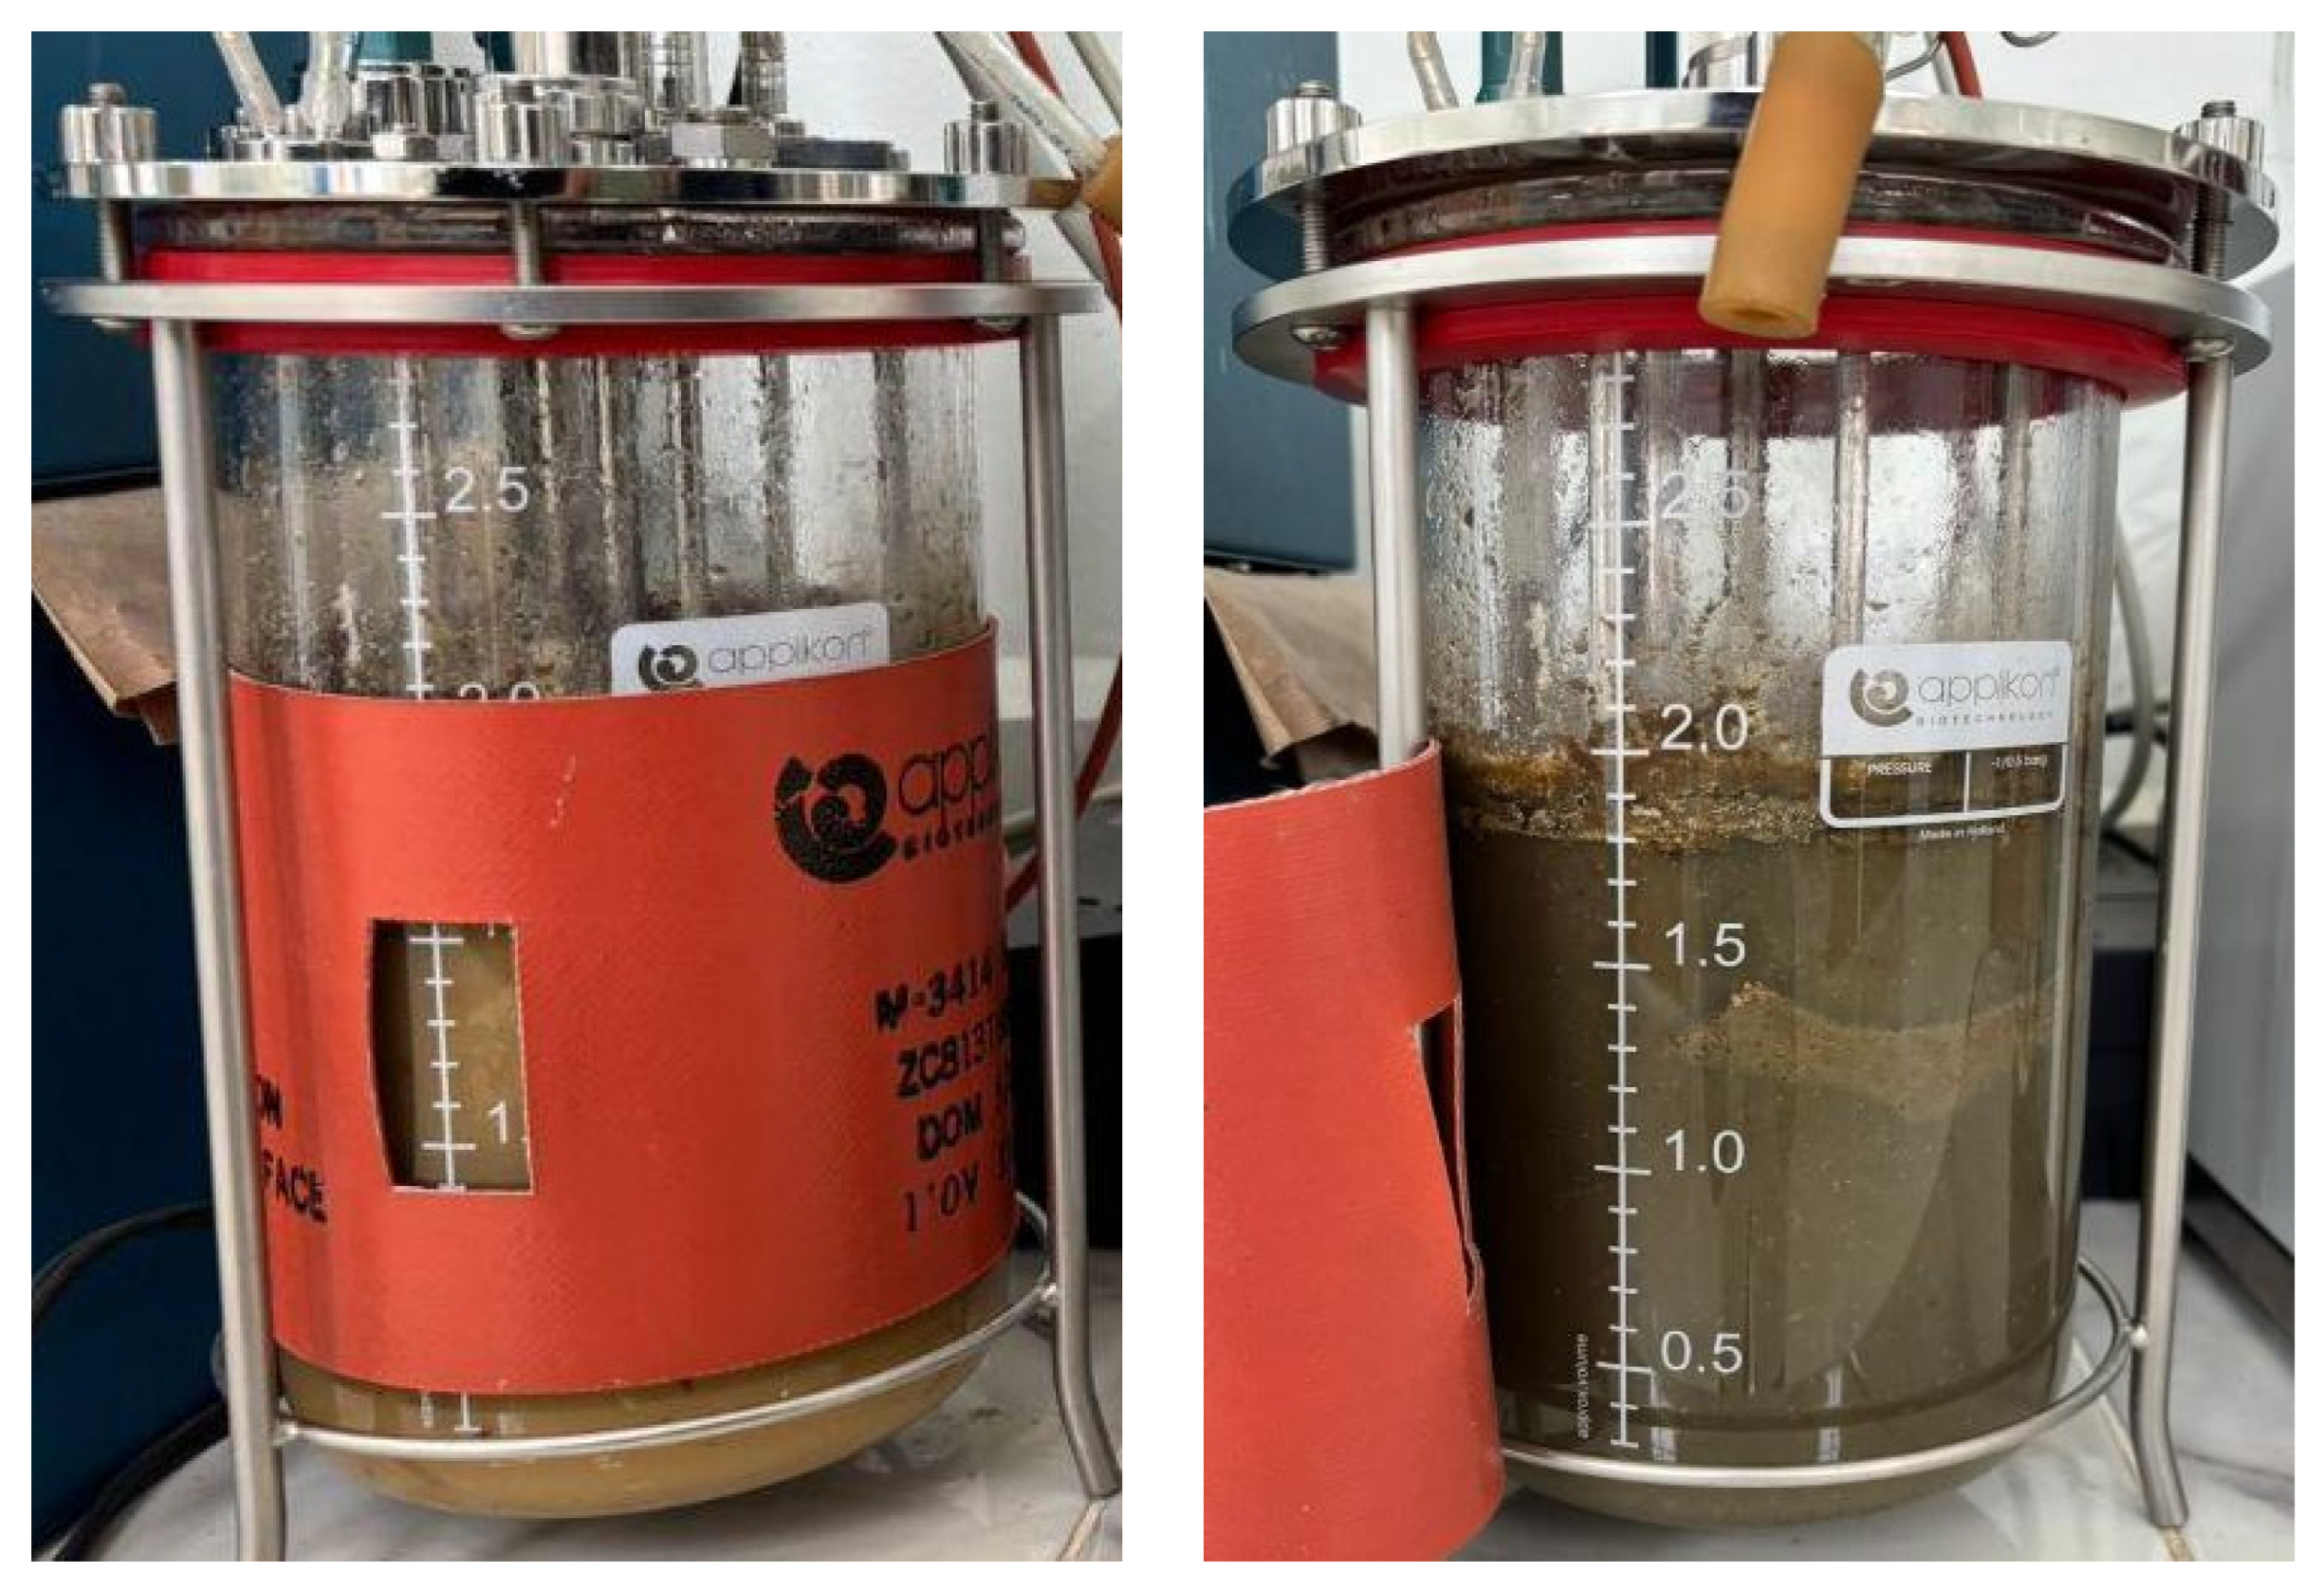
In Figure 5, the color difference between the stability stage and the methanogenic inhibition stage reflects a washout effect, where microbial metabolism in the reactor cannot compensate for the daily loss of microorganisms in the digestate. The capacity of the medium to regenerate microbial populations depends on process stability and an adequate nutrient balance in the feed, both of which are disrupted when protein is removed from the substrate (Figure 2).
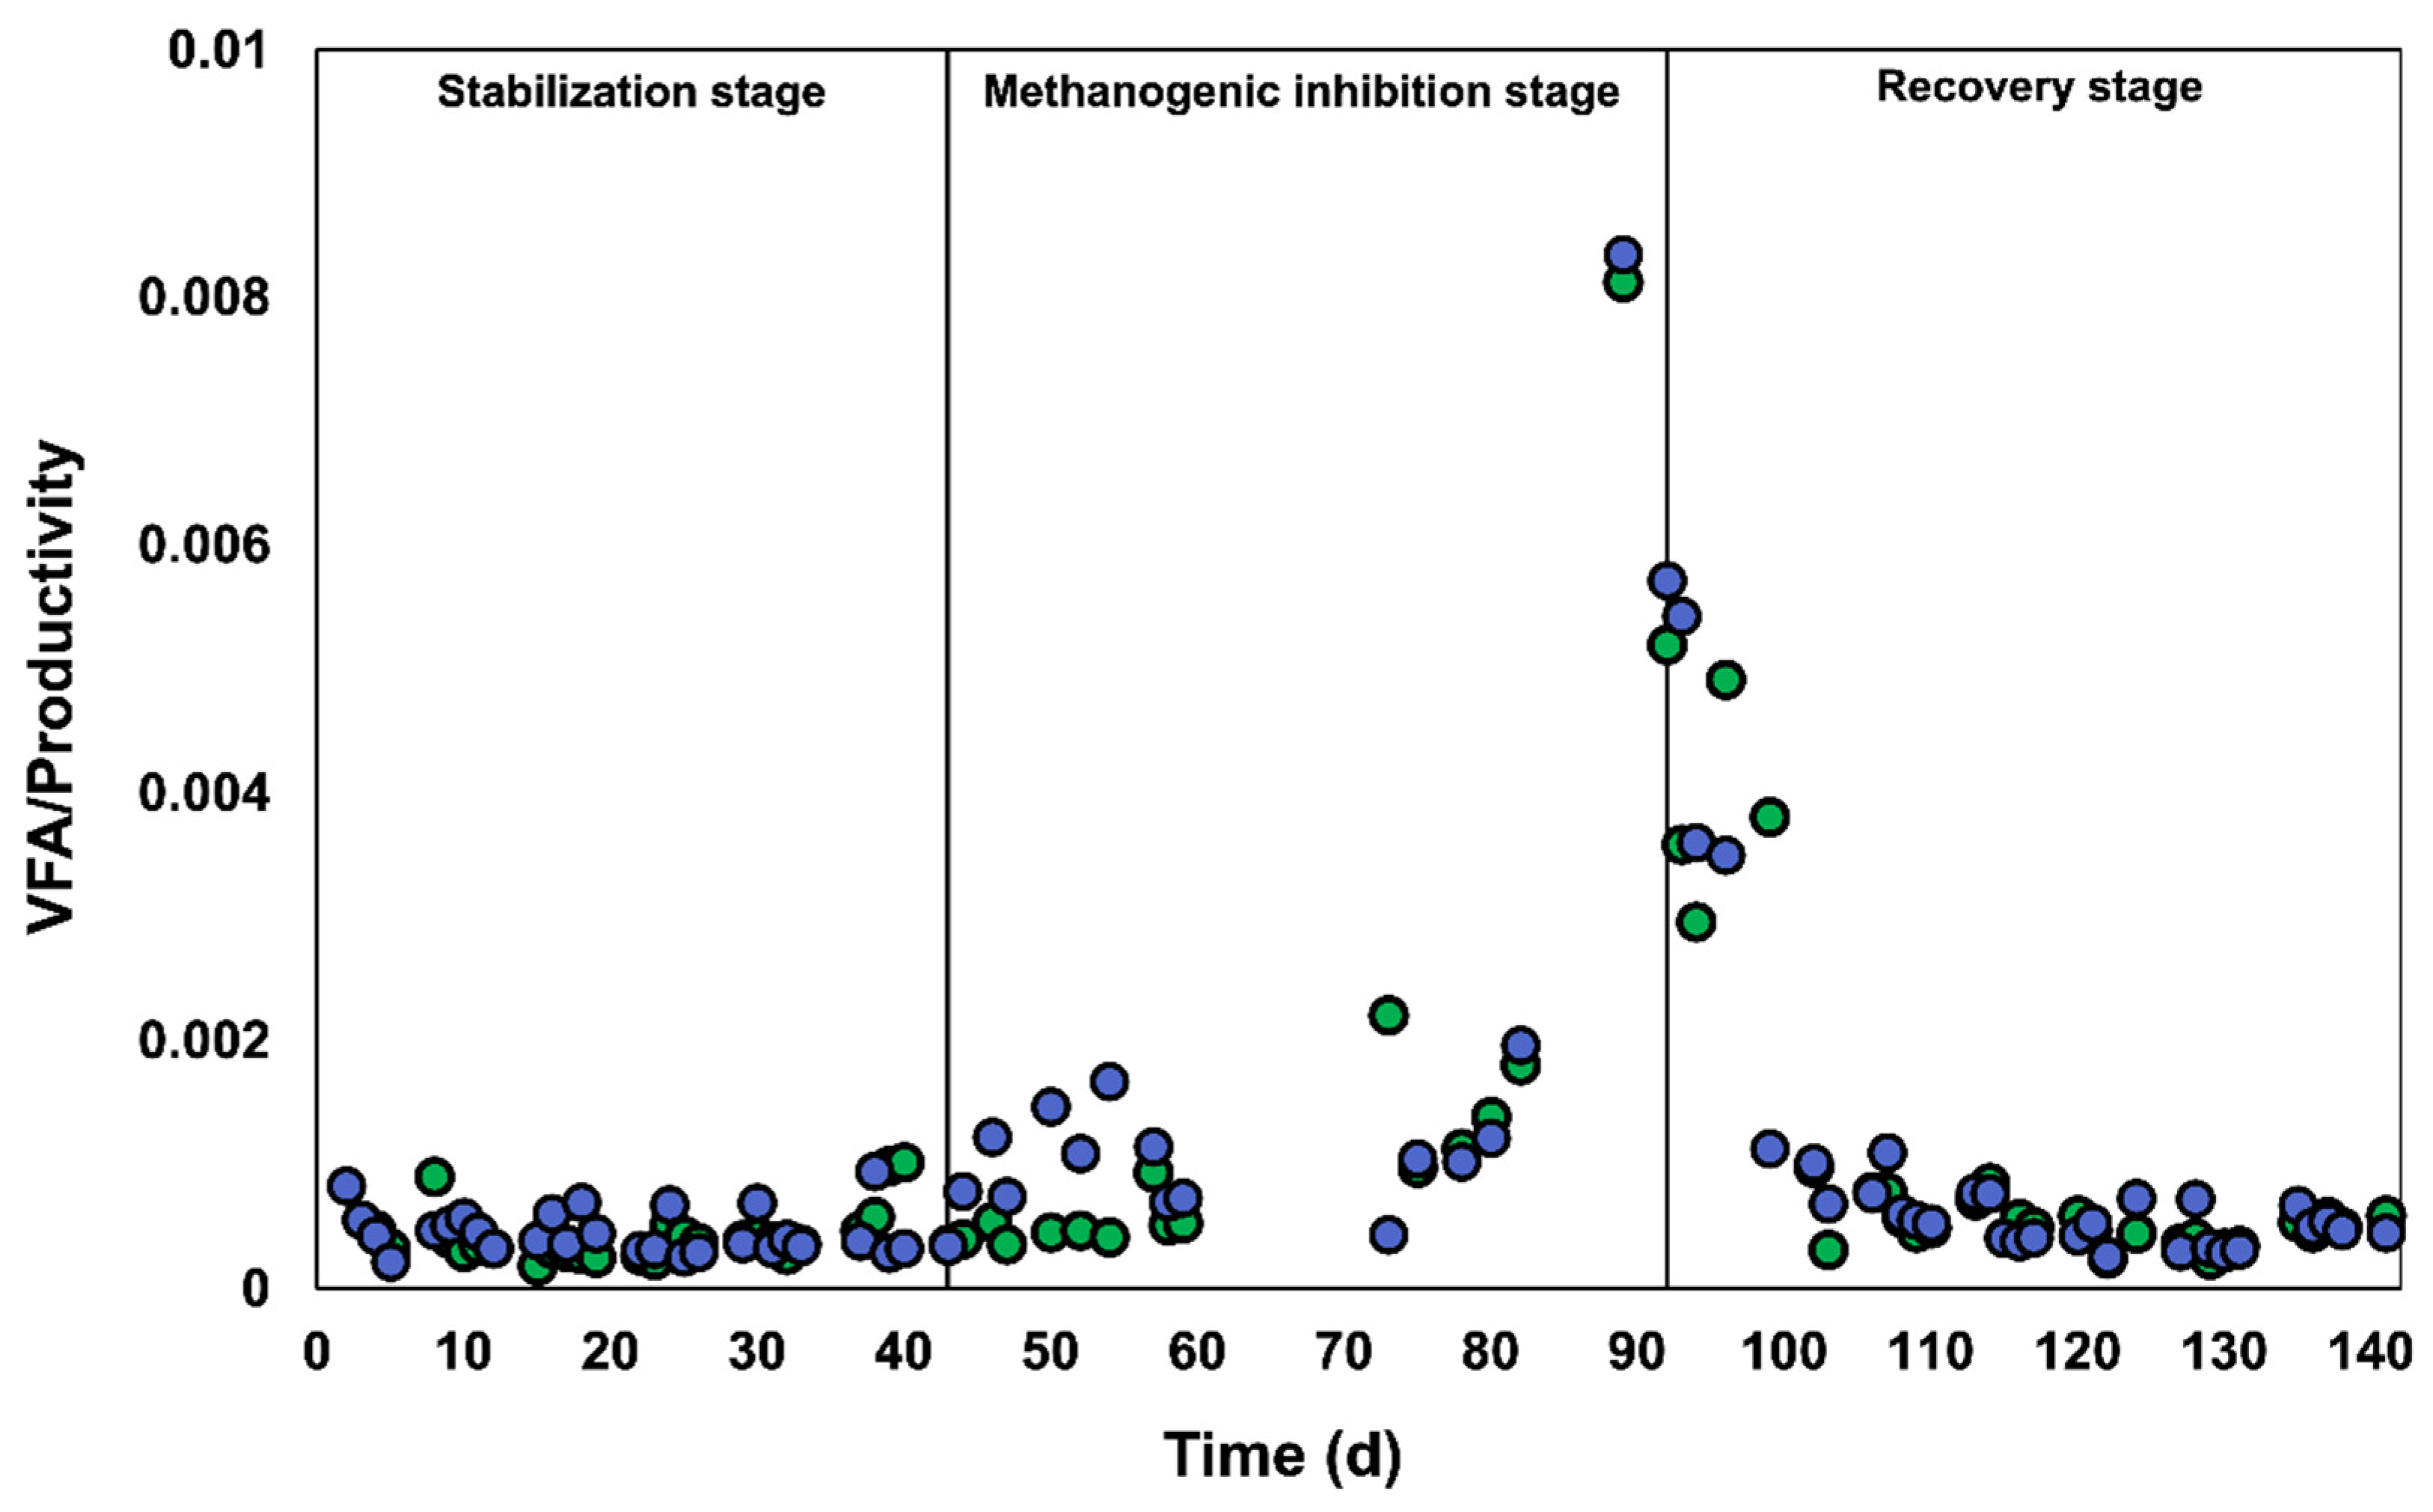
Figure 6 shows the VFA/Productivity ratio used as a stability criterion. When inoculum was added after the pH dropped below 6.4 (20% of the liquid volume on day 89), this indicator decreased by 35% in R1 and 31% in R2 within three days. During the recovery stage (days 91–130), VFA/Productivity values continued to decline as biomass and MW were reintroduced into the feed, reaching levels comparable to those in the stability stage. These results confirm the effectiveness of the recovery strategy and provide a reliable indicator of reactor health and stability.
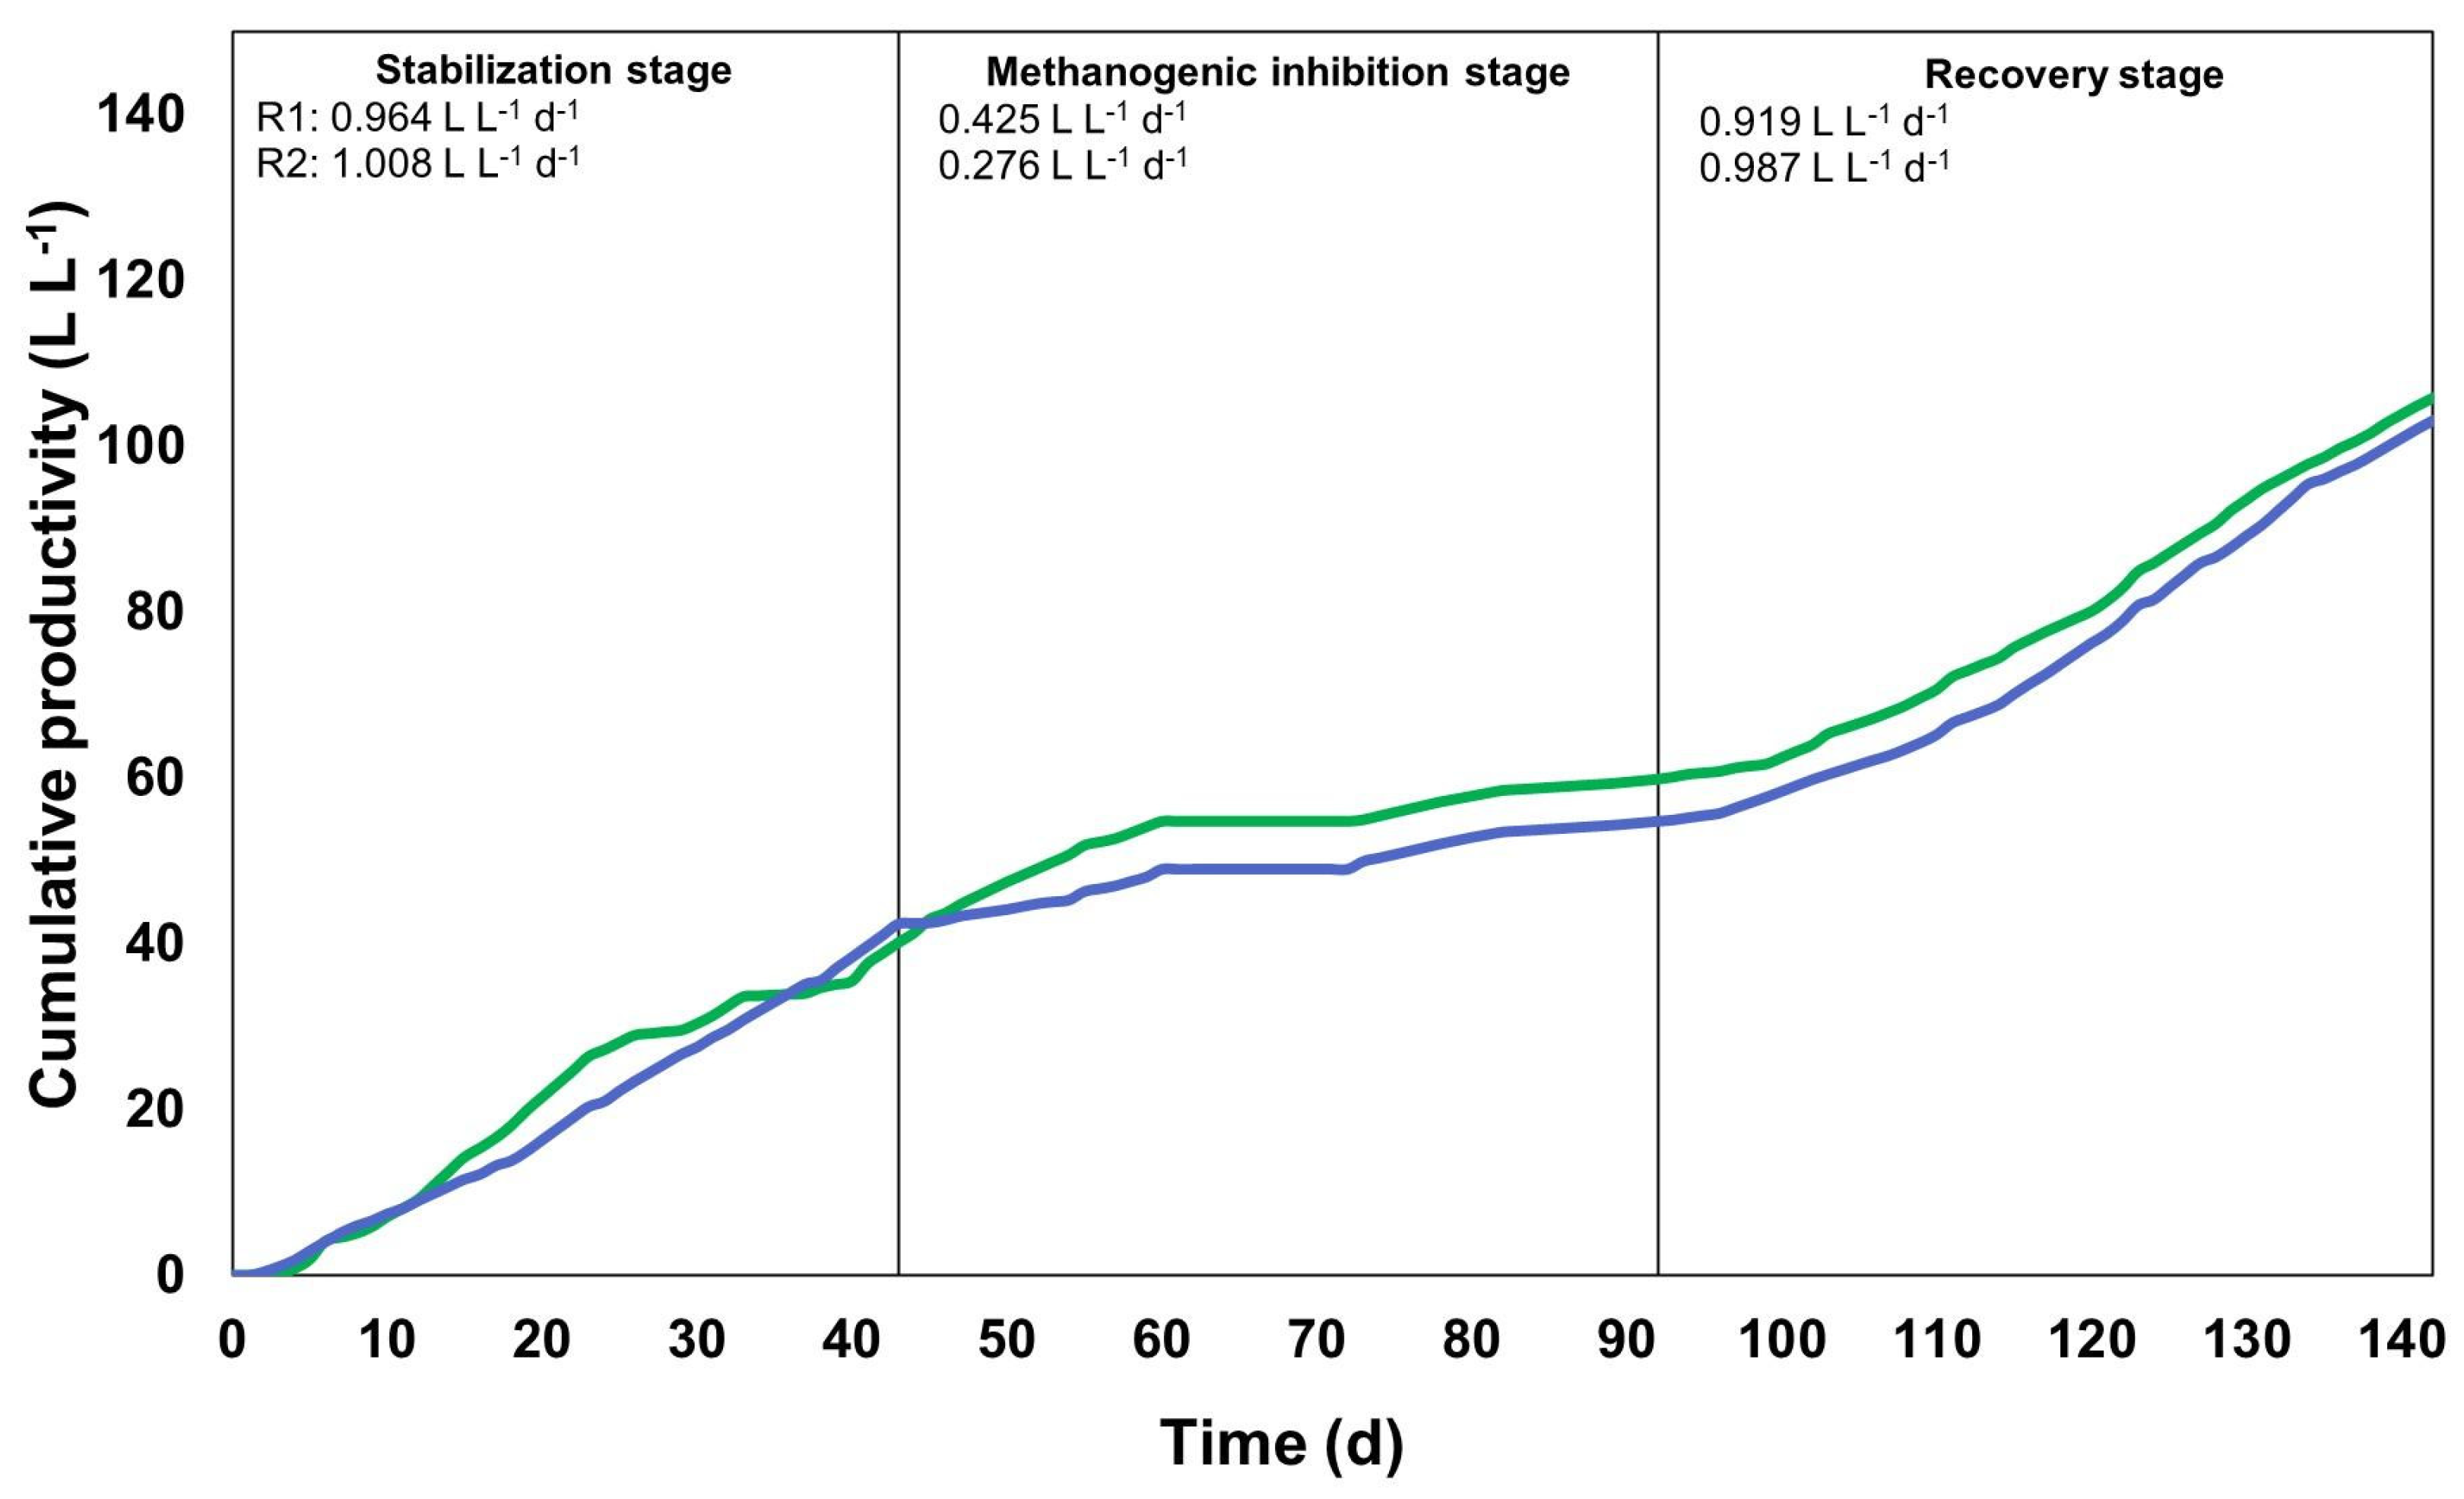
Figure 7 shows the cumulative biogas productivity of the reactors. During the stabilization stage, average productivities were 0.94 L L−1 d−1 (R1) and 0.99 L L−1 d−1 (R2), values consistent with those reported in the literature (Table 3) for large-scale processes with similar OLRs (Section 2.1.2 and Section 2.1.3). Table 3 also lists substrates commonly used at the industrial scale, where co-digestion is frequently applied to enhance productivity, including livestock manure, energy crops, the organic fraction of municipal solid waste, FW, and FVW [40]. Variability in the composition of substrates fed to a WtE-AD process can compromise stability and gas yield, as observed in the methanogenic inhibition stage, when average productivity declined to 0.58 L L−1 d−1 (R1) and 0.39 L L−1 d−1 (R2), with minimum values of 0.12 L L−1 d−1 (R1) and 0.11 L L−1 d−1 (R2) on day 89 after the pH dropped below 6.4 (Figure 4).
The slope of cumulative productivity was implemented as a measure of the recovery scheme’s success. The slopes of the recovery stage are 95.5% (R1) and 97.9% (R2), similar to those of the stabilization stage (Figure 7), indicating that the reactors have not yet fully recovered, possibly requiring longer operating times with the 1:1 FVW:MW feed scheme. Zou et al. [55] investigated a large-scale thermophilic WtE-AD process and concluded that it is challenging to recover the digester quickly when biogas production decreases due to critical failure. This may be due to the remnants of previous substrates and intermediate metabolites generated during inhibition events [23,56]. These metabolites, such as VFA, alter the microbiota of the reactive medium and significantly influence the recovery of these types of processes. According to heuristics, at least three HRT are required to remove a particle from the reaction medium through the digestate. In this study, the recovery stage lasts 2.55 HRT; more recovery time may be necessary to achieve productivity similar to that of the stability stage.
The experimental results from the laboratory-scale WtE-AD process were used to calculate the specific methane production required by the techno-economic model for the large-scale WtE-AD process. The yield obtained on the final day of each stage was selected, as shown in Table 4.

3.2. Economic Feasibility of the Large-Scale WtE-AD Process Based on Waste Management Capacity

The NPV of the large-scale WtE-AD process treating a mixture of FVW and MW, along with its relationship to organic waste management capacity, is presented in Table 5. This study assumes an average specific methane production of 521.1 mL g VS−1 (Table 4), corresponding to the stable stage of the laboratory-scale process.
The analysis reveals that the evaluated minimum management capacity of 33 t d−1 matches the waste output of the largest food distribution center in northeastern Mexico, while the upper bound of 200 t d−1 aligns with reported capacities of similar large-scale operations [9]. Strikingly, under the assessed conditions, a large-scale WtE-AD plant treating FVW and MW only reaches economic viability (NPV > 0, the break-even threshold) when managing at least 60 t d−1. Capital costs were found to be 14–18 times higher than annual O&M costs, highlighting the substantial investments required for such processes, which may limit their deployment. The NPV increased sharply with treatment capacity, indicating that WtE-AD systems are more efficient when processing larger waste volumes. This benchmark integrates the Latin American market context, considering revenues from electricity sales, biofertilizer production, and organic waste management fees (Section 2.3).

3.3. Impact of Inhibition Events on the Economic Performance of the Large-Scale WtE-AD Process

Methanogenic inhibition, triggered by the removal of MW from the WtE-AD feed, can significantly compromise the economic viability of large-scale operations. To quantify this effect, annual electricity production was calculated using experimental specific methane yields obtained during the stable stage and the methanogenic inhibition stage of the laboratory-scale WtE-AD process (Table 4). The occurrence of multiple IEs over the operational lifespan of a large-scale WtE-AD facility further amplifies these losses, as evidenced in Table 6, showing a progressive decline in cumulative energy output and waste processing efficiency. These results underscore the critical role of maintaining a balanced feed composition to safeguard process stability and economic performance.
Table 7 shows the effect of methanogenic inhibition on the economic viability of WtE-AD plants with a management capacity of 60 t d−1. Under these conditions, the system can withstand up to two inhibition events (IE), equivalent to operating 8% of its lifetime without MW in the feed, while still maintaining a positive NPV. Beyond this threshold, the NPV drops to negative values. In contrast, larger treatment capacities substantially improve economic resilience; for example, plants exceeding 100 t d−1 can operate up to 40% of their useful life without MW while remaining economically viable.
Organic waste management revenues are key to the economics of the WtE-AD process. Table 8 shows the management revenues reported in the literature for these processes. Vasco-Correa et al. [57] report an income of 67 USD t−1 in 2017 for FW, equivalent to 99.5 USD t−1 by 2025, which is three times more than the 33 USD t−1 considered in this work. Therefore, increasing this type of income could be an attractive option to ensure the economic viability of the process before IE.
Table 9 highlights the influence of organic waste management revenues on the economic viability of large-scale WtE-AD processes under different inhibition event (IE) scenarios. Revenues of 99.5 USD t−1, as reported by Vasco-Correa et al. [57], ensure economic viability in all evaluated IE conditions. However, in Latin America, WtE-AD systems face direct competition from sanitary landfills (SL) and open dumps, where reported management revenues are as low as 2.7 USD t−1 [60]. Unlike Europe—where environmental regulations and landfill taxes drive WtE-AD adoption [18]—the absence of such legislation in Latin America fosters landfill proliferation and limits revenue growth for large-scale WtE-AD projects.
Given this constraint, intermediate revenue scenarios ranging from 33 to 44 USD t−1 were evaluated. Results indicate that 44 USD t−1 guarantees economic viability across all IE scenarios analyzed. Nevertheless, achieving such revenue levels may be unrealistic under current waste management policies.
These findings underscore a critical challenge: without regulatory and economic incentives, WtE-AD projects in the region remain financially vulnerable. Nevertheless, they also reveal a clear opportunity; targeted policy reforms and landfill taxation could unlock the revenue potential needed to make these systems resilient and competitive. Nonetheless, it is essential to acknowledge the risk associated with implementing higher costs through landfill taxation, as in the absence of adequate monitoring and enforcement mechanisms, such measures could incentivize the proliferation of illegal dumping, thereby undermining the anticipated environmental and social benefits.
Increasing electricity sales revenue was evaluated as another pathway to achieve economic viability for the large-scale WtE-AD process. A hypothetical increase from 0.05 to 0.10 USD kWh−1 was considered, based on conventional electricity prices and guaranteed feed-in tariffs for WtE-AD reported in the literature (Table 10). For reference, Italy’s conventional electricity price is 0.125 USD kWh−1 —150% higher than the baseline in this study— while Germany offers the highest guaranteed tariff for clean electricity production at 0.237 USD kWh−1. As a comparative benchmark, the electricity price in New York, USA (0.088 USD kWh−1), was also assessed, representing a context with greater purchasing power and more diversified energy policies.
Table 11 summarizes the economic performance under these electricity price scenarios. All evaluated cases achieved positive NPV, with the German tariff yielding the highest values, ranging from 21.23 to 9.06 million USD depending on the number of inhibition events (IE). This performance is comparable to the scenario of increasing waste management revenues from 33 to 99.5 USD t−1 (Table 9), which produced NPVs from 16.32 to 10.60 million USD. Although German legislation requires a minimum of 80% cow manure in the feed—a criterion not met in this case study—its inclusion illustrates how robust legislation, and effective incentives can significantly enhance the viability of clean energy projects. This insight underscores the importance of designing supportive policy frameworks in Latin America to unlock the economic potential of WtE-AD technologies.
This work provides strategic insights for private initiatives seeking to maximize the economic performance of WtE-AD systems. As shown in Table 11, increasing electricity sales revenue from 0.05 to 0.088 USD kWh−1 (Table 10, NY, USA scenario) yields a higher NPV and greater resilience to inhibition events (IE) than the scenario of raising waste management revenues from 33 to 44 USD t−1 (Table 9). These results position electricity generation as the primary driver of economic performance in WtE-AD systems, with organic waste management revenues playing a strategic but secondary role to strengthen overall profitability and resilience. Nevertheless, it should be noted that higher electricity prices, while improving WtE-AD profitability, may also exert adverse effects on the country’s overall economy by increasing production costs and reducing competitiveness [67].

4. Conclusions

This study provides compelling evidence that methanogenic inhibition—caused by the absence of protein-rich substrates such as meat waste (MW)—can severely undermine the stability, biogas productivity, and overall profitability of large-scale waste-to-energy anaerobic digestion (WtE-AD) systems. Laboratory-scale findings revealed that inhibition events trigger sharp declines in gas yield and stability indicators, while demonstrating achievable recovery through the strategic reintroduction of MW and active inoculum. These results emphasize the importance of balanced substrate composition to ensure process resilience.
From a techno-economic perspective a clear operational threshold was identified: under current Latin American market conditions, WtE-AD plants treating fruit/vegetable and meat waste require a minimum capacity of 60 t d−1 to achieve economic viability (NPV > 0). Low waste management fees and electricity tariffs remain significant barriers; however, sensitivity analyses revealed that scaling up capacity, adjusting the economic income of waste disposal, and securing higher electricity prices could substantially improve economic performance. Larger facilities (>100 t d−1) have the capacity to withstand more extended inhibition periods without jeopardizing profitability—highlighting scale as a critical resilience factor.
This study identifies both a critical challenge and an opportunity. Without regulatory action, WtE-AD will continue to compete on unequal terms with open dumps and low-cost landfills, limiting market penetration. However, targeted policy instruments—such as differentiated waste management fees, renewable energy incentives, and guaranteed electricity tariffs—could catalyze a shift toward financially robust, environmentally beneficial biogas systems. By integrating robust technical operation strategies with supportive policy frameworks, WtE-AD plants can become cornerstone technologies for organic waste valorization, renewable energy generation, and circular economy models in emerging economies.

Author Contributions

Conceptualization, L.R.M.-M. and P.R.-G.; data curation, D.E.D.-C. and E.E.G.-B.; formal analysis, L.R.M.-M. and P.R.-G.; funding acquisition, P.R.-G., S.R.S.-G. and C.E.-A.; investigation, L.R.M.-M. and E.E.G.-B.; methodology, L.R.M.-M., D.E.D.-C. and E.E.G.-B.; project administration, P.R.-G. and L.R.M.-M.; resources, P.R.-G., S.R.S.-G. and C.E.-A.; software, E.E.G.-B. and A.A.-R.; supervision, P.R.-G. and L.R.M.-M.; validation, P.R.-G., L.R.M.-M., S.R.S.-G. and C.E.-A.; visualization, L.R.M.-M. and P.R.-G.; writing—original draft, D.E.D.-C. and E.E.G.-B.; writing—review and editing, A.A.-R., L.R.M.-M., P.R.-G., C.E.-A. and S.R.S.-G. All authors have read and agreed to the published version of the manuscript.

Funding

This work was supported by the Autonomous University of Nuevo León through a PAICYT grant 124-IDT-2024.

Institutional Review Board Statement

Not applicable.

Informed Consent Statement

Not applicable.

Data Availability Statement

The data that support the findings of this study are available from the corresponding author upon reasonable request.

Conflicts of Interest

The authors declare no conflicts of interest.

Abbreviations

The following abbreviations are used in this manuscript:
WtE-ADWaste-to-energy anaerobic digestion
CSTRContinuous stirred-tank reactor
FVWFruit and vegetable waste
MWMeat waste
CMCattle manure
FDSFinal disposal sites
FWFood waste
GHGGreenhouse gas
VSVolatile solids
VFAVolatile fatty acids
TSTotal solids
TATotal alkalinity
IAIntermediate alkalinity
PAPartial alkalinity
HRTHydraulic retention time
OLROrganic loading rate
ADAnaerobic digestion
CHPCombined heat and power
NPVNet present value
PMPig manure
SHWSlaughterhouse waste
SLSanitary landfills
MSWMunicipal solid waste
OBWOrganic biological waste
OFMSWOrganic fraction of municipal solid waste
IEInhibition event
EWEarly warning
VWVegetable waste
ECEnergy crops
SMSheep manure
WSWastewater sludge
PSPig slurry
EGElephant grass
OWOrganic waste
SSSewage sludge
GSGrass silage
MSMaize silage
CSMChicken solid manure
NAUnreported reactor operating regimen
WASActivated sludge

References

  1. UNEP (United Nations Environment Programme). Food Waste Index Report 2021. Nairobi. Available online: https://www.unep.org/resources/report/unep-food-waste-index-report-2021 (accessed on 20 January 2025).
  2. Rueda-Avellaneda, J.F.; Rivas-García, P.; Gomez-Gonzalez, R.; Benitez-Bravo, R.; Botello-Álvarez, J.E.; Tututi-Avila, S. Current and prospective situation of municipal solid waste final disposal in Mexico: A spatio-temporal evaluation. Renew. Sustain. Energy Transit. 2021, 1, 100007. [Google Scholar] [CrossRef]
  3. Albalate-Ramírez, A.; Rueda-Avellaneda, J.; López-Hernández, B.; Alcalá-Rodríguez, M.; García-Balandrán, E.; Evrard, D.; Rivas-García, P. Geographic life cycle assessment of food loss and waste management in Mexico: The reality of distribution and retail centers. Sustain. Prod. Consum. 2024, 48, 289–300. [Google Scholar] [CrossRef]
  4. Gómez-Puentes, F.J.; Reyes-López, J.A.; López, D.L.; Carreón-Diazconti, C.; Belmonte-Jiménez, S. Geochemical processes controlling the groundwater transport of contaminants released by a dump in an arid region of México. Environ. Earth Sci. 2014, 71, 609–621. [Google Scholar] [CrossRef]
  5. Capson-Tojo, G.; Rouez, M.; Crest, M.; Steyer, J.P.; Delgenès, J.P.; Escudié, R. Food waste valorization via anaerobic processes: A review. Rev. Environ. Sci. Biotechnol. 2016, 15, 499–547. [Google Scholar] [CrossRef]
  6. Achinas, S.; Euverink, G.J.W. Theoretical analysis of biogas potential prediction from agricultural waste. Resour. Technol. 2016, 2, 143–147. [Google Scholar] [CrossRef]
  7. Al Seadi, T.; Lukehurst, C. Quality Management of Digestate from Biogas Plants Used as Fertilizer. IEA Bioenergy Task 37. 2012. Available online: http://www.iea-biogas.net/files/daten-redaktion/download/publi-task37/digestate_quality_web_new.pdf (accessed on 27 May 2025).
  8. Tsydenova, N.; Morillas, A.V.; Hernández, A.M.; Soria, D.R.; Wilches, C.; Pehlken, A. Feasibility and barriers for anaerobic digestion in Mexico City. Sustainability 2019, 11, 4114. [Google Scholar] [CrossRef]
  9. Miramontes-Martínez, L.R.; Rivas-García, P.; Briones-Cristerna, R.A.; Abel-Seabra, J.E.; Padilla-Rivera, A.; Botello-Álvarez, J.E.; Alcalá-Rodríguez, M.M.; Levasseur, A. Potential of electricity generation by organic wastes in Latin America: A techno-economic-environmental analysis. Biomass Convers. Biorefinery 2022, 14, 27113–27124. [Google Scholar] [CrossRef]
  10. Alvarado-Reyna, P.; León, U.A.d.N.; Albalate-Ramírez, A.; García-Balandrán, E.; Escamilla-Alvarado, C.; Galván-Arzola, U.; Miramontes-Martínez, L.; Rivas-García, P. Evaluation of the reaction capacity of early warning indicators to failures in biogas production systems. Rev. Mex. De Ing. Quim. 2024, 23, Bio24313. [Google Scholar] [CrossRef]
  11. Nielsen, H.B.; Angelidaki, I. Congestion of manure and industrial organic waste at centralized biogas plants: Process imbalances and limitations. Water Sci. Technol. 2008, 58, 1521–1528. [Google Scholar] [CrossRef]
  12. Albalate-Ramírez, A.; Padilla-Rivera, A.; Rueda-Avellaneda, J.F.; López-Hernández, B.N.; Cano-Gómez, J.J.; Rivas-García, P. Mapping the Sustainability of Waste-to-Energy Processes for Food Loss and Waste in Mexico—Part 1: Energy Feasibility Study. Sustainability 2024, 16, 6111. [Google Scholar] [CrossRef]
  13. Alibardi, L.; Cossu, R. Composition variability of the organic fraction of municipal solid waste and effects on hydrogen and methane production potentials. Waste Manag. 2015, 36, 147–155. [Google Scholar] [CrossRef]
  14. Fisgativa, H.; Tremier, A.; Dabert, P. Characterizing the variability of food waste quality: A need for efficient valorization through anaerobic digestion. Waste Manag. 2016, 50, 264–274. [Google Scholar] [CrossRef]
  15. Xue, S.; Song, J.; Wang, X.; Shang, Z.; Sheng, C.; Li, C.; Zhu, Y.; Liu, J. A systematic comparison of biogas development and related policies between China and Europe and corresponding insights. Renew. Sustain. Energy Rev. 2020, 117, 109474. [Google Scholar] [CrossRef]
  16. Padilla-Rivera, A.; Paredes, M.G.; Güereca, L.P. A systematic review of the sustainability assessment of bioenergy: The case of gaseous biofuels. Biomass Bioenergy 2019, 125, 79–94. [Google Scholar] [CrossRef]
  17. Zheng, L.; Chen, J.; Zhao, M.; Cheng, S.; Wang, L.-P.; Mang, H.-P.; Li, Z. What could China give to and take from other countries in terms of the development of the biogas industry? Sustainability 2020, 12, 1490. [Google Scholar] [CrossRef]
  18. Yousuf, A.; Khan, M.R.; Pirozzi, D.; Ab Wahid, A. Financial sustainability of biogas technology: Barriers, opportunities, and solutions. Energy Sources 2016, 11, 841–848. [Google Scholar] [CrossRef]
  19. Holliger, C.; Alves, M.; Andrade, D.; Angelidaki, I.; Astals, S.; Baier, U.; Bougrier, C.; Buffière, P.; Carballa, M.; de Wilde, V.; et al. Towards a standardization of biomethane potential tests. Water Sci. Technol. 2016, 74, 2515–2522. [Google Scholar] [CrossRef]
  20. NMX-AA-034-SCFI-2015; Water Analysis—Determination of Solids and Dissolved Salts in Natural Waters, Wastewater, and Treated Wastewater—Test Method. Ministry of Economy: Mexico City, Mexico, 2015. Available online: https://www.gob.mx/cms/uploads/attachment/file/166146/nmx-aa-034-scfi-2015.pdf (accessed on 5 February 2025).
  21. NMX-AA-036-SCFI-2001; Water Analysis—Determination of Acidity and Alkalinity in Natural Waters, Wastewater, and Treated Wastewater—Test Method. Ministry of Economy: Mexico City, Mexico, 2001. Available online: https://www.gob.mx/cms/uploads/attachment/file/166776/NMX-AA-036-SCFI-2001.pdf (accessed on 5 February 2025).
  22. Miramontes-Martínez, L.R.; Rivas-García, P.; Albalate-Ramírez, A.; Botello-Álvarez, J.E.; Escamilla-Alvarado, C.; Gomez-Gonzalez, R.; Alcalá-Rodríguez, M.M.; Valencia-Vázquez, R.; Santos-López, I.A. Anaerobic co-digestion of fruit and vegetable waste: Synergy and process stability analysis. J. Air Waste Manag. Assoc. 2021, 71, 620–632. [Google Scholar] [CrossRef]
  23. Li, D.; Chen, L.; Liu, X.; Mei, Z.; Ren, H.; Cao, Q.; Yan, Z. Instability mechanisms and early warning indicators for mesophilic. Bioresour. Technol. 2017, 245, 90–97. [Google Scholar] [CrossRef]
  24. Liu, Y.; Whitman, W.B. Metabolic, phylogenetic, and ecological diversity of the methanogenic archaea. In Annals of the New York Academy of Sciences; Blackwell Publishing Inc.: Malden, MA, USA, 2008; pp. 171–189. [Google Scholar] [CrossRef]
  25. Korai, M.S.; Mahar, R.B.; Uqaili, M.A. The seasonal evolution of fruit, vegetable and yard wastes by mono, co and tri-digestion at Hyderabad, Sindh Pakistan. Waste Manag. 2018, 71, 461–473. [Google Scholar] [CrossRef]
  26. Piccinno, F.; Hischier, R.; Seeger, S.; Som, C. Predicting the environmental impact of a future nanocellulose production at industrial scale: Application of the life cycle assessment scale-up framework. J. Clean. Prod. 2018, 174, 283–295. [Google Scholar] [CrossRef]
  27. Scano, E.A.; Asquer, C.; Pistis, A.; Ortu, L.; Demontis, V.; Cocco, D. Biogas from anaerobic digestion of fruit and vegetable wastes: Experimental results on pilot-scale and preliminary performance evaluation of a full-scale power plant. Energy Convers. Manag. 2014, 77, 22–30. [Google Scholar] [CrossRef]
  28. Tsilemou, K.; Panagiotakopoulos, D. Approximate cost functions for solid waste treatment facilities. Waste Manag. Res. J. Sustain. Circ. Economy. 2006, 24, 310–322. [Google Scholar] [CrossRef]
  29. Comisión Federal de Electricidad (CFE). Industry-Tariffs: Current Tariff Scheme. Available online: https://app.cfe.mx/Aplicaciones/CCFE/Tarifas/TarifasCREIndustria/Industria.aspx (accessed on 25 May 2025).
  30. Morero, B.; Vicentin, R.; Campanella, E.A. Assessment of biogas production in Argentina from co-digestion of sludge and municipal solid waste. Waste Manag. 2017, 61, 195–205. [Google Scholar] [CrossRef]
  31. Doychinov, N.; Faircloth, P.; Lonkova, K. Municipal Solid Waste Cost Calculation Technical Guidelines for Low-and Middle-Income Countries. 2024. Available online: www.worldbank.org (accessed on 27 May 2025).
  32. Income Tax Law (Ley del Impuesto sobre la Renta); Last Amendment Published in the Official Gazette (DOF) on 01-04-2024; Chamber of Deputies of the H. Congress of the Union, Secretariat of Parliamentary Services: Mexico City, Mexico, 2013; Available online: https://www.diputados.gob.mx/LeyesBiblio/pdf/LISR.pdf (accessed on 26 May 2025).
  33. SAT. Ley de Impuesto al Valor Agregado. 2021. Available online: https://www.diputados.gob.mx/LeyesBiblio/pdf/LIVA.pdf (accessed on 23 May 2025).
  34. Banco de México. 2025. Available online: https://www.banxico.org.mx/SieInternet/consultarDirectorioInternetAction.do?sector=18&accion=consultarCuadro&idCuadro=CF111&locale=es (accessed on 20 May 2025).
  35. Ebner, J.H.; Labatut, R.A.; Lodge, J.S.; Williamson, A.A.; Trabold, T.A. Anaerobic co-digestion of commercial food waste and dairy manure: Characterizing biochemical parameters and synergistic effects. Waste Manag. 2016, 52, 286–294. [Google Scholar] [CrossRef] [PubMed]
  36. Miramontes-Martínez, L.R.; Gomez-Gonzalez, R.; Botello-Álvarez, J.E.; Escamilla-Alvarado, C.; Albalate-Ramírez, A.; Rivas-García, P. Semi-continuous anaerobic co-digestion of vegetable waste and cow manure: A study of process stabilization. Rev. Mex. De Ing. Quim. 2020, 19, 1117–1134. [Google Scholar] [CrossRef]
  37. Hagos, K.; Zong, J.; Li, D.; Liu, C.; Lu, X. Anaerobic co-digestion process for biogas production: Progress, challenges and perspectives. Renew. Sustain. Energy Rev. 2017, 76, 1485–1496. [Google Scholar] [CrossRef]
  38. Holliger, C.; Astals, S.; De Laclos, H.F.; Hafner, S.D.; Koch, K.; Weinrich, S. Towards a standardization of biomethane potential tests: A commentary. Water Sci. Technol. 2021, 83, 247–250. [Google Scholar] [CrossRef]
  39. Kumar, M.; Ou, Y.L.; Lin, J.G. Co-composting of green waste and food waste at low C/N ratio. Waste Manag. 2010, 30, 602–609. [Google Scholar] [CrossRef] [PubMed]
  40. Garcia, N.H.; Mattioli, A.; Gil, A.; Frison, N.; Battista, F.; Bolzonella, D. Evaluation of the methane potential of different agricultural and food processing substrates for improved biogas production in rural areas. Renew. Sustain. Energy Rev. 2019, 112, 1–10. [Google Scholar] [CrossRef]
  41. Lindorfer, H.; Corcoba, A.; Vasilieva, V.; Braun, R.; Kirchmayr, R. Doubling the organic loading rate in the co-digestion of energy crops and manure–A full scale case study. Bioresour. Technol. 2008, 99, 1148–1156. [Google Scholar] [CrossRef]
  42. Ek, A.E.W.; Hallin, S.; Vallin, L.; Schnurer, A.; Karlsson, M. Slaughterhouse Waste Co-Digestion—Experiences from 15 Years of Full-Scale Operation. Proc. World Renew. Energy Congr. 2011, 57, 64–71. [Google Scholar] [CrossRef]
  43. Akbulut, A. Techno-economic analysis of electricity and heat generation from farm-scale biogas plant: Çiçekdaĝi{dotless} case study. Energy 2012, 44, 381–390. [Google Scholar] [CrossRef]
  44. Passos, F.; Gutiérrez, R.; Brockmann, D.; Steyer, J.P.; García, J.; Ferrer, I. Microalgae production in wastewater treatment systems, anaerobic digestion and modelling using ADM1. Algal Res. 2015, 10, 55–63. [Google Scholar] [CrossRef]
  45. Hamawand, I. Anaerobic digestion process and bio-energy in meat industry: A review and a potential. Renew. Sustain. Energy Rev. 2015, 44, 37–51. [Google Scholar] [CrossRef]
  46. De Vrieze, J.; Saunders, A.M.; He, Y.; Fang, J.; Nielsen, P.H.; Verstraete, W.; Boon, N. Ammonia and temperature determine potential clustering in the anaerobic digestion microbiome. Water Res. 2015, 75, 312–323. [Google Scholar] [CrossRef] [PubMed]
  47. De Vrieze, J.; Raport, L.; Roume, H.; Vilchez-Vargas, R.; Jáuregui, R.; Pieper, D.H.; Boon, N. The full-scale anaerobic digestion microbiome is represented by specific marker populations. Water Res. 2016, 104, 101–110. [Google Scholar] [CrossRef]
  48. Gutierrez, E.C.; Xia, A.; Murphy, J.D. Can slurry biogas systems be cost effective without subsidy in Mexico? Renew. Energy 2016, 95, 22–30. [Google Scholar] [CrossRef]
  49. Ahlberg-Eliasson, K.; Nadeau, E.; Levén, L.; Schnürer, A. Production efficiency of Swedish farm-scale biogas plants. Biomass Bioenergy 2017, 97, 27–37. [Google Scholar] [CrossRef]
  50. Otuzalti, M.M.; Perendeci, N.A. Modeling of real scale waste activated sludge anaerobic digestion process by Anaerobic Digestion Model 1 (ADM1). Int. J. Green Energy 2018, 15, 454–464. [Google Scholar] [CrossRef]
  51. Cecchi, F.; Cavinato, C. Smart approaches to food waste final disposal. Int. J. Environ. Res. Public Health 2019, 16, 2860. [Google Scholar] [CrossRef]
  52. Michailos, S.; Walker, M.; Moody, A.; Poggio, D.; Pourkashanian, M. Biomethane production using an integrated anaerobic digestion, gasification and CO2 biomethanation process in a real waste water treatment plant: A techno-economic assessment. Energy Convers. Manag. 2020, 209, 112663. [Google Scholar] [CrossRef]
  53. Zhou, L.; Hülsemann, B.; Cui, Z.; Merkle, W.; Sponagel, C.; Zhou, Y.; Guo, J.; Dong, R.; Müller, J.; Oechsner, H. Operating performance of full-scale agricultural biogas plants in germany and china: Results of a year-round monitoring program. Appl. Sci. 2021, 11, 1271. [Google Scholar] [CrossRef]
  54. Biogas3 Proyect. Sustainable Small-Scale Biogas from Agri-Food Waste for Energy Self-Sufficiency Intelligent Energy Europe Programme. 2020. Available online: http://www.biogas3.eu/esp/index.html (accessed on 26 May 2025).
  55. Zou, J.; Nie, E.; Lü, F.; Peng, W.; Zhang, H.; He, P. Screening of early warning indicators for full-scale dry anaerobic digestion of household kitchen waste. Environ. Res. 2022, 214, 114136. [Google Scholar] [CrossRef]
  56. Wu, Y.; Kovalovszki, A.; Pan, J.; Lin, C.; Liu, H.; Duan, N.; Angelidaki, I. Early warning indicators for mesophilic anaerobic digestion of corn stalk: A combined experimental and simulation approach. Biotechnol. Biofuels 2019, 12, 106. [Google Scholar] [CrossRef] [PubMed]
  57. Vasco-Correa, J.; Khanal, S.; Manandhar, A.; Shah, A. Anaerobic digestion for bioenergy production: Global status, environmental and techno-economic implications, and government policies. Bioresour. Technol. 2017, 247, 1015–1026. [Google Scholar] [CrossRef]
  58. Gebrezgabher, S.A.; Meuwissen, M.P.M.; Prins, B.A.M.; Oude, A.G.J.M. Economic analysis of anaerobic digestion — A case of Green power biogas plant in The Netherlands. NJAS—Wageningen J. Life Sci. 2010, 57, 109–115. [Google Scholar] [CrossRef]
  59. Nghiem, L.D.; Wickham, R.; Ohandja, D.G. Enhanced biogas production and performance assessment of a full-scale anaerobic digester with acid phase digestion. Int. Biodeterior. Biodegrad. 2017, 124, 162–168. [Google Scholar] [CrossRef]
  60. SEMARNAT (Secretaría de Medio Ambiente y Recursos Naturales). Diagnóstico Básico para la Gestión Integral de los Residuos. 2020. Available online: www.gob.mx/semarnat (accessed on 27 May 2025).
  61. Sganzerla, W.G.; Buller, L.S.; Mussatto, S.I.; Forster-Carneiro, T. Techno-economic assessment of bioenergy and fertilizer production by anaerobic digestion of brewer’s spent grains in a biorefinery concept. J. Clean. Prod. 2021, 297, 126600. [Google Scholar] [CrossRef]
  62. Pablo-Romero, M.P.; Sánchez-Braza, A.; Salvador-Ponce, J. An overview of feed-in tariffs, premiums and tenders to promote electricity from biogas in the EU-28. Renew. Sustain. Energy Rev. 2017, 73, 1366–1379. [Google Scholar] [CrossRef]
  63. Lukehurst, C.; Bywater, A. Exploring the Viability of Small Scale Anaerobic Digesters in Livestock Farming. 2015. Available online: https://www.ieabioenergy.com/wp-content/uploads/2015/12/Small_Scale_RZ_web2.pdf (accessed on 20 May 2025).
  64. Tradings Economics. 2025. Available online: https://es.tradingeconomics.com/italy/indicators (accessed on 27 May 2025).
  65. Kassem, N.; Sills, D.; Posmanik, R.; Blair, C.; Tester, J.W. Combining anaerobic digestion and hydrothermal liquefaction in the conversion of dairy waste into energy: A techno economic model for New York state. Waste Manag. 2020, 103, 228–239. [Google Scholar] [CrossRef] [PubMed]
  66. New York State Energy Research and Development Authority (NYSERDA). 2024 New York Clean Energy Industry Report Overview; NYSERDA: Albany, NY, USA, 2024. Available online: https://nyserda.ny.gov/clean-energy-jobs (accessed on 30 May 2025).
  67. Xu, J.; Akhtar, M.; Haris, M.; Muhammad, S.; Abban, O.J.; Taghizadeh-Hesary, F. Energy crisis, firm profitability, and productivity: An emerging economy perspective. Energy Strategy Rev. 2022, 41, 100849. [Google Scholar] [CrossRef]
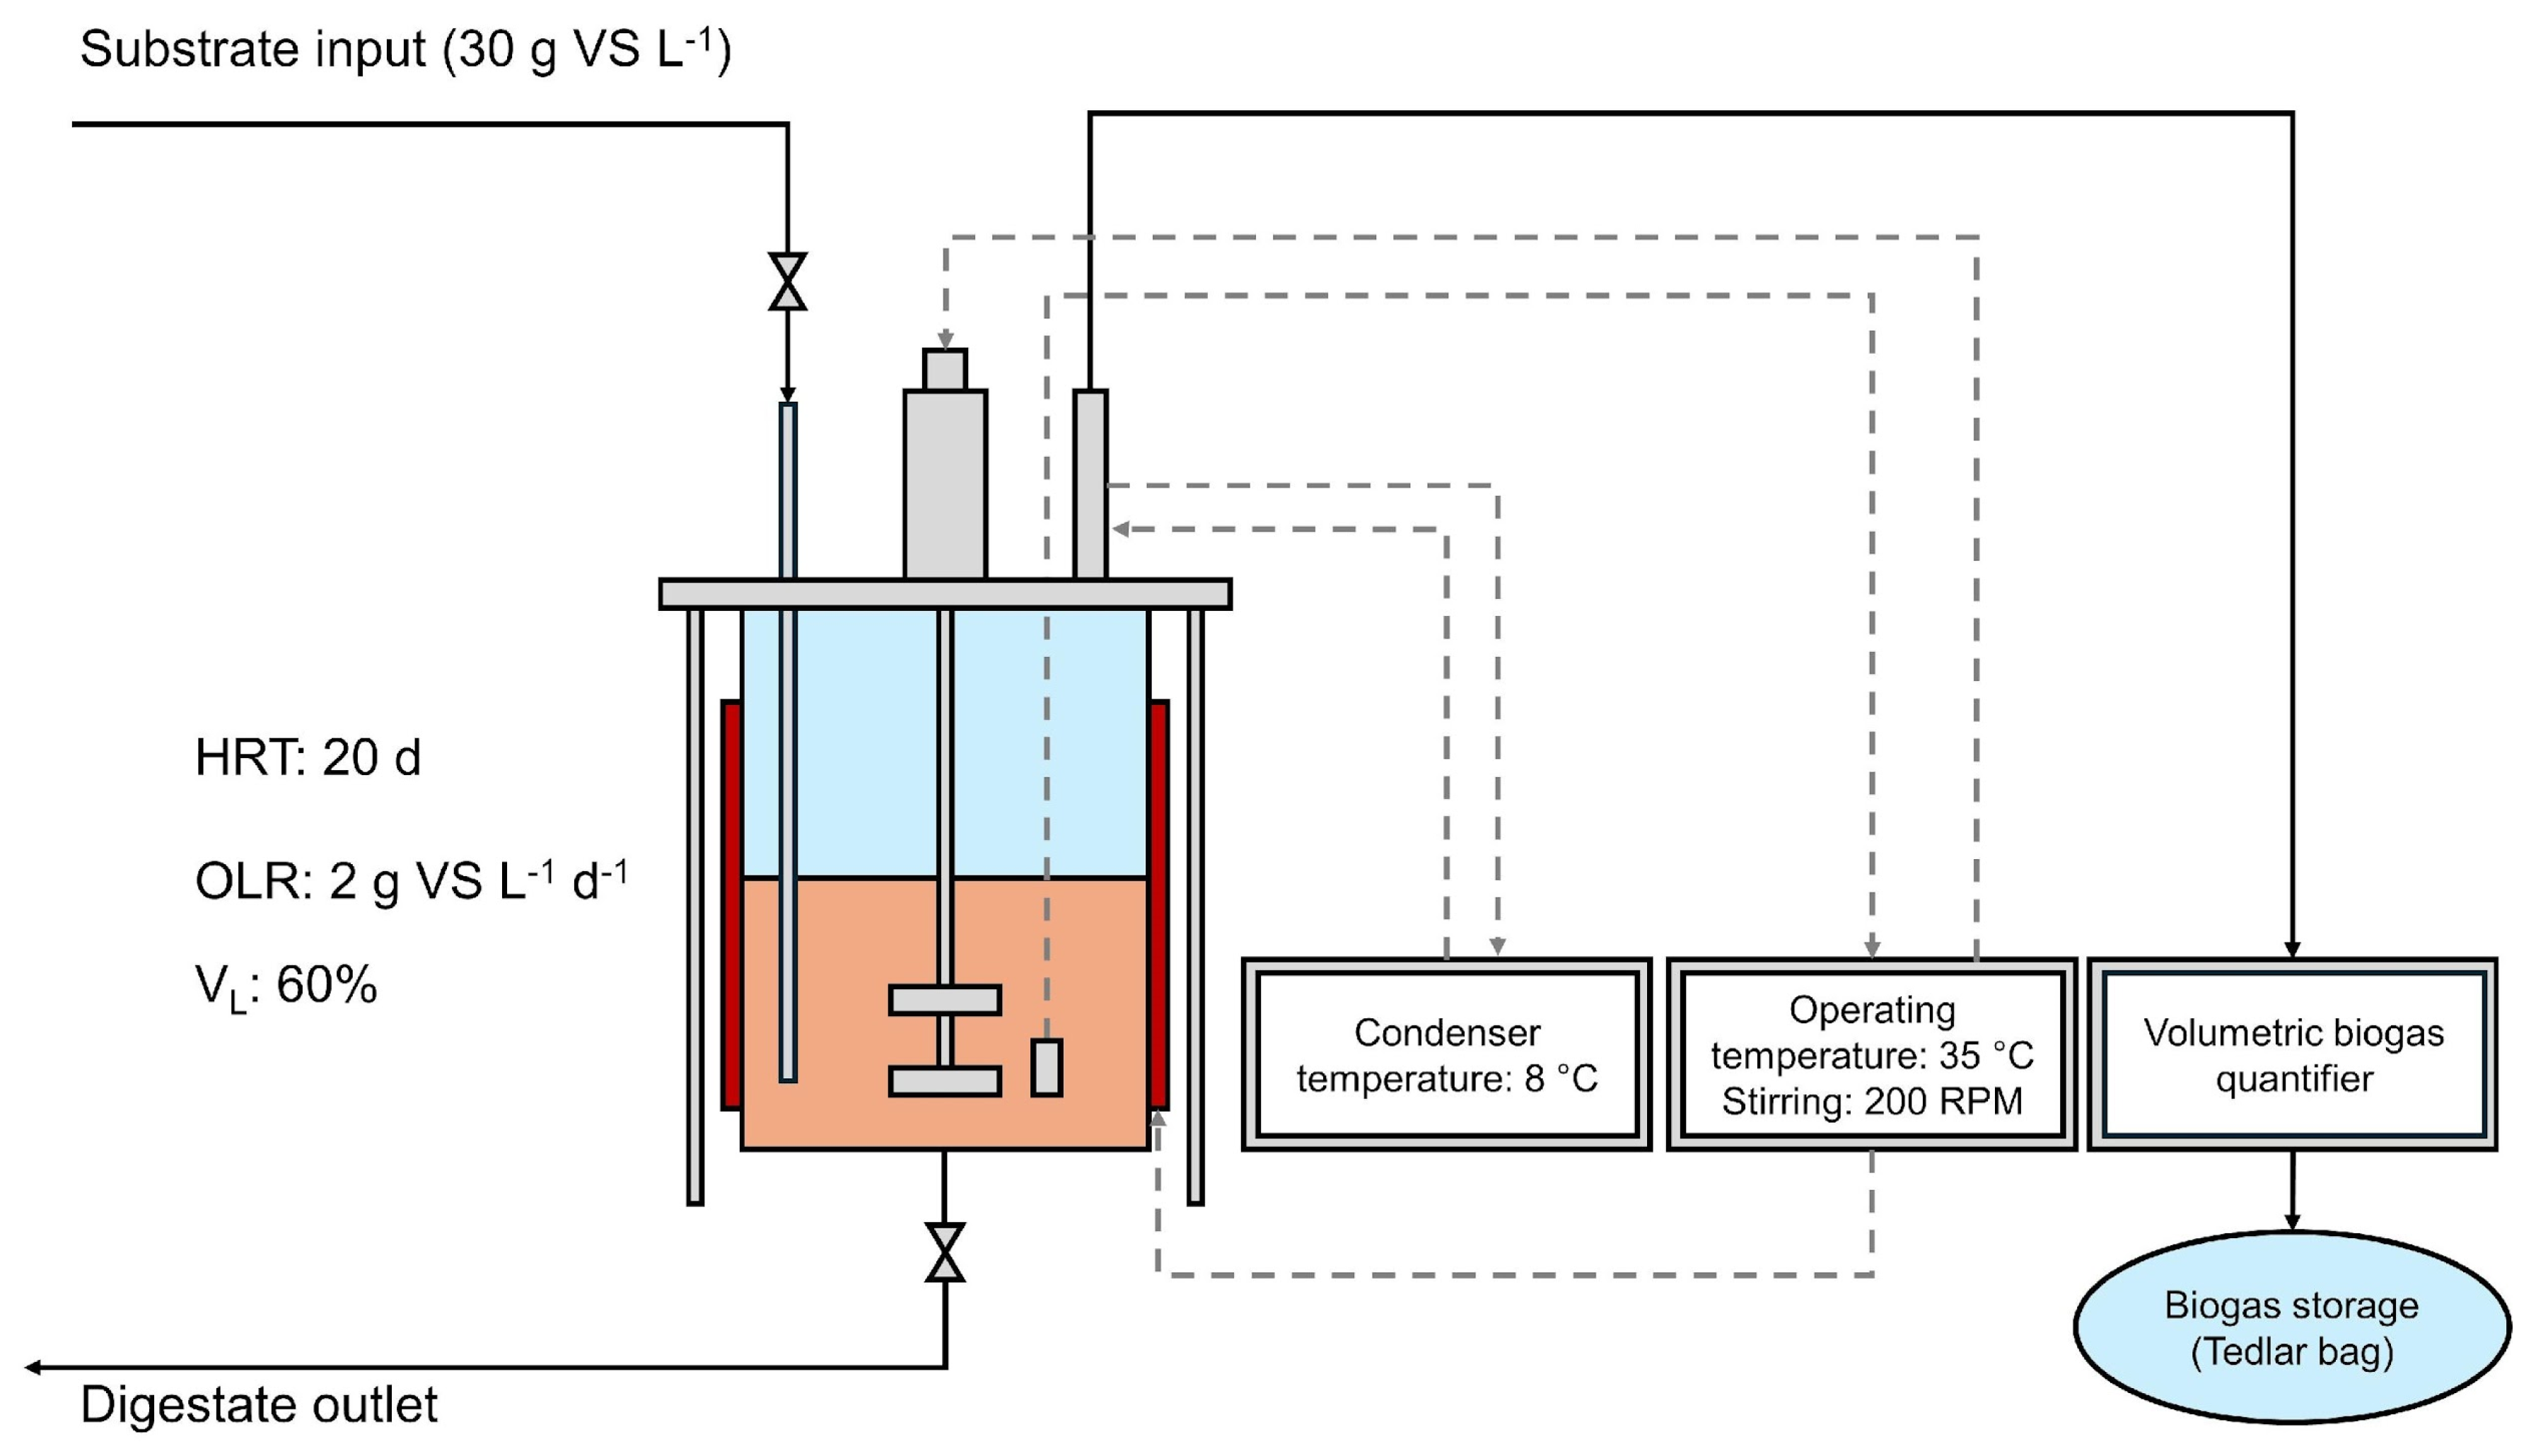
Figure 1. WtE-AD process implemented at laboratory scale. HRT: Hydraulic retention time. OLR: Organic loading rate. VL: Liquid phase volume.
Fermentation 11 00510 g001
Figure 2. Feeding scheme for the WtE-AD process at laboratory scale. The red line represents the replacement on day 89 of 20% of the reactor digestate content by inoculum. Day 89 corresponds to a pH drop below 6.4. The duration of the methanogenic inhibition stage (49 days) corresponds to a pH of the reaction medium reduction below 6.4 and negligible biogas production.
Fermentation 11 00510 g002
Figure 3. Schematic of the large-scale WtE-AD process. (1) Industrial waste shredder. (2) CSTR with heating systems. (3) Heat and power cogeneration system. (4) Rotary sludge dryer.
Fermentation 11 00510 g003
Figure 4. pH and VFA/TA ratio of the anaerobic digestion process (R1 green and R2 blue). The red line indicates a pH lower than 6.4.
Fermentation 11 00510 g004
Figure 5. (Left), reactor medium from reactor one corresponding to day 89 (programmed inhibition stage). (Right), reagent medium corresponding to day 130 (recovery stage).
Fermentation 11 00510 g005
Figure 6. VFA/Productivity (mg VFA L−1/L L−1 d−1) relationship in the anaerobic digestion process (R1 green and R2 blue).
Fermentation 11 00510 g006
Figure 7. Cumulative biogas productivity from the anaerobic digestion process (R1 shown in green and R2 shown in blue). The slope of productivity by stage is shown at the top.
Fermentation 11 00510 g007
Table 1. Parameters used in economic analysis.
ParameterValueUnitRef.
Reference year2025
WtE-AD process lifetime25y
Income tax35%[33]
Inflation 14.54% y−1[34]
Revenue generated from the sale of:
Organic waste management33USD t−1[31]
Electricity0.05USD kWh−1[29]
Biofertilizer 2129USD t−1[30]
1 Calculated with the averages from 2020 to 2025. 2 Price adjusted for inflation.
Table 2. Results of the inoculum and substrates characterization.
ParameterUnitFVWMWSHWInoculumQuality
Criteria 1
This StudyRef [22]This StudyRef [22]This StudyRef [36]
Methanogenic
activity
mL CH4 g VS−1 349 340 to 395
TS%11.37 ± 1.0410.8937.2311.8110.284.248
VS% of TS91.98 ± 3.8192.8790.8895.1462.6376.02
Ash% of TS8.02 ± 3.817.149.124.8637.3723.98
TAmg CaCO3 L−1673.33 ± 49.06 1610 380550>3000
IAmg CaCO3 L−1131.25 ± 53.60 300 43.3
PAmg CaCO3 L−1 950 53.3
IA/PA 0.316 0.813
VFAmg L−11445 ± 676.01 672 420 <1000
VFA/TA 2.16 ± 1.01 0.417 1.105
pH 4.63 ± 0.544.518.076.948.048.477.0 to 8.5
TS: Total solids. VS: Volatile solids. TA: Total alkalinity. IA: Intermediate alkalinity. PA: Partial alkalinity. VFA: Volatile fatty acids. SHW: Slaughterhouse Waste. VW: Vegetable waste. 1 Based on Holliger et al. [19] and Holliger et al. [38].
Table 3. Biogas productivity and operating parameters of large-scale WtE-AD processes reported in the literature.
Reactor Operating Regime
(Volume in m3)
Temperature
(°C)
SubstrateBiogas
Productivity
(L L−1 d−1)
OLR
(g VS L−1 d−1)
HRT
(d)
Ref.
CSTR (2000)39PM1.52.11 [41]
CSTR (2000)39PM and EC2.914.25
CSTR (7400)38SHW4.08 45 to 55[42]
Lagoon-type (2713) CM1.052.5133[43]
CSTR (2713)40CM and SM1.282.5133
CSTR (2000)37Microalgae and EC0.120.7020[44]
CSTR (2400) CM and EC1.99 [45]
CSTR (4000) MSW<2.5 [46]
CSTR (4000) MSW4 to 5.5
CSTR (1500) Maize and manure5.6
CSTR (1000) SHW7.5
CSTR (1000) SHW7.5
CSTR (2500) Maize and manure4.8
CSTR (3600) Manure, OBW, EC, and SHW1.5
CSTR (3600) Manure, OBW, EC, and SHW2
CSTR (3150) OFMSW5.5 to 7
CSTR (3150) OFMSW2.5 to 4
CSTR (3450) OFMSW2.5 to 4
CSTR (1200) Maize and manure10 to 12
CSTR (1200) Maize and manure<2.5
CSTR (1000) Maize, fats, and fruits5.7
CSTR (3255) Sludge and manure2.7
CSTR (4000) WS2
CSTR (4000) WS2
CSTR (4000) WS2
CSTR (1200) Maize and manure1.1
CSTR (1250) Manure4.1
CSTR (2000) Maize and manure7.4
CSTR (3000) Maize and manure5.7
CSTR (3200) Maize and manure2.1
CSTR (1500) OBW2.8
CSTR (1500) OBW2.8
CSTR (1500) OBW2.8
CSTR (1500) OBW6.4
CSTR (3000)37EC and OBW3.9 40[47]
CSTR (2500)37EC and OBW6.35 60
CSTR (3500)37Manure and OBW7.88 45
CSTR (3000)37EC, manure, and OBW9.2 40 to 50
Lagoon (1344) PS and EG1.722.2830[48]
Lagoon (2330) PS and EG1.412.6341
Lagoon (5450) PS and EG0.50.9441
NA (570)37CM0.562.3032[49]
NA (2100)38CM and OW0.742.2034
NA (600)38CM0.882.3034
NA (300)38CM0.611.9038
NA (261)37CM0.542.0033
NA (1780)38CM and OW0.912.3032
NA (610)37CM0.521.7045
NA (1206)37CM0.622.2034
NA (405)37CM0.371.3055
NA (680)38CM0.752.1035
NA (800)38CM and OW0.731.7029
NA (1000)38CM and OW1.122.5031
NA (1170)39CM and OW0.673.2023
NA (478)37CM and OW1.382.2060
NA (2700)36CM and OW0.571.5036
NA (550)37PM0.652.0025
NA (1500)36PM0.321.2032
NA (520)40PM0.611.8038
NA (2435)38PM and OW0.631.2047
NA (1000)38PM and OW0.621.4045
NA (2440)38PM and OW0.461.0046
NA (3240)55PM and OW0.911.2063
NA (1120)37PM and OW0.581.2055
NA (515)52PM and OW0.631.5029
NA (950)40PM and OW0.732.1039
NA (370)38PM and OW0.872.7023
NA (1680)38PM and OW0.912.6030
CSTR (36,000)35 to 37SS0.441.3522.5[50]
NA (2200)35.7Sludge and OFMSW0.350.8725 to 30[51]
NA (10,000)35 to 37Sludge and OFMSW0.721.3830 to 40
CSTR (16,000)39SS1.28 [52]
CSTR (1500) CM, manure, and GS0.8212.31 [53]
CSTR (1880) CM, manure, MS, and GS1.4114.05
CSTR (847) CSM, CM, manure, MS, and GS0.4912.10
USBR (1400) CSM0.1710.78
CSTR (1800) CSM and CM0.1810.91
CSTR (320) PM0.1711.55
NA (22) Agri-food waste1.292.1661[54]
NA (285) Agri-food waste1.162.1857
NA (2159) Agri-food waste1.052.1542
NA (699) Agri-food waste1.341.8051
NA (1261) Agri-food waste1.162.1752
NA (905) Agri-food waste1.722.1753
NA (149) Agri-food waste2.284.3755
NA (486) Agri-food waste1.522.1842
NA (478) Agri-food waste1.782.0420
NA (2993) Agri-food waste0.732.1835
NA (121) Agri-food waste0.732.1835
NA (549) Agri-food waste0.752.1020
NA (242) Agri-food waste0.802.1841
NA (102) Agri-food waste1.974.3738
NA (1568) Agri-food waste0.742.1847
NA (138) Agri-food waste1.772.1651
NA (84) Agri-food waste0.702.1750
NA (122) Agri-food waste2.212.1862
NA (1218) Agri-food waste1.982.1855
NA (1328) Agri-food waste0.922.1651
NA (241) Agri-food waste0.872.1847
CSTR: Continuous stirred-tank reactor. PM: Pig manure. SHW: Slaughterhouse waste. CM: Cattle manure. MSW: Municipal solid waste. OBW: Organic biologic waste. OFMSW: Organic fraction municipal solid waste. EC: Energy crops. SM: Sheep manure. WS: Wastewater sludge. PS: Pig slurry. EG: Elephant grass. OW: Organic waste. SS: Sewage sludge. GS: Grass silage. MS: Maize silage. CSM: Chicken solid manure. UASB: Upflow anaerobic sludge blanket. NA: Unreported reactor operating regimen. 1 Methane productivity (L of methane L−1 d−1).
Table 4. Experimental specific methane production of the laboratory-scale WtE-AD process.
Specific Methane Production
(mL CH4 g VS−1)
R1R2Average
Stable stage (day 42)506.4535.8521.1 ± 21
Methanogenic inhibition stage (day 92)71.463.667.5 ± 6
Recovery stage (day 142)371.4400.8386.1 ± 21
Table 5. Relationship between organic waste management capacity and NPV of the large-scale WtE-AD process.
Treatment Capacity
(t d−1)
Capital Costs
(Million USD)
O&M Costs
(Million USD y−1)
Total Revenue
(Million USD)
NPV
(Million USD)
338.670.63−0.57−1.87
409.980.711.62−1.27
5011.740.815.13−0.25
6013.410.908.960.92
7015.010.9913.052.19
8016.541.0717.263.52
9018.031.1421.544.87
10019.461.2225.896.23
12522.901.3937.009.67
15026.161.5448.5013.21
20032.261.8372.5220.72
Electricity sales price: 0.05 USD kWh−1. Biofertilizer sales price: 129 USD t−1. Organic waste management fee: 33 USD t−1. The colors provide visual support to assess the profitability level of the scenarios analyzed: values shaded toward green indicate higher profitability, whereas those shaded toward red indicate lower profitability.
Table 6. Impact of inhibition events on electricity production and waste management of the large-scale WtE-AD process with management of organic waste of 60 t d−1.
IE over the
25-Year Time Horizon
Electricity Production
(MWh y−1)
Amount of Organic
Waste Managed (t d−1)
Zero10,51660
One998359
Two946358
Three879856
Five781154
Seven689252
Ten549048
IE: Inhibition event.
Table 7. Effect of inhibition events and waste management capacity on the NPV in large-scale WtE-AD processes.
Treatment Capacity
(t d−1)
NPV (Million USD) of the Large-Scale WtE-AD Process Under Different IE
ZeroOneTwoThreeFiveSevenTen
600.920.550.20−0.25−0.92−1.53−2.44
702.191.781.250.86−0.02−0.82−1.87
803.522.942.511.940.970.07−1.22
904.874.273.673.212.020.92−0.51
1006.235.604.984.373.131.930.27
1259.678.998.187.516.024.572.39
20020.7219.4718.2517.0614.7312.559.43
Electricity sales price: 0.05 USD kWh−1. Biofertilizer sales price: 129 USD t−1. Organic waste management fee: 33 USD t−1. The colors provide visual support to assess the profitability level of the scenarios analyzed: values shaded toward green indicate higher profitability, whereas those shaded toward red indicate lower profitability.
Table 8. Economic income from organic waste management and purchase prices of substrates in large-scale WtE-AD processes.
FeeUnitSubstrateCountryRef.
65USD t−1CM [57]
67 FW
49 to 58 MSW
11.5 PMNetherlands[58]
14 Poultry manureNetherlands
86EUR t−1WAS y FWItaly[59]
75 OFMSW, WAS, and othersItaly
70 WAS and FWItaly
17 to 30 CM and dairy wasteGermany
30 FWGermany
33USD t−1FVW and MWMexicoThis study
CM: Cattle manure. FW: Food waste. MSW: Municipal solid waste. PM: Pig manure. WAS: Activated sludge. OFMSW: Organic fraction municipal solid waste. FVW: Fruit and vegetable waste. MW: Meat waste.
Table 9. Relationship of waste management revenues to the NPV in large-scale WtE-AD processes.
Waste Management Income
(USD t−1)
NPV (Million USD) of the Large-Scale WtE-AD Process Under Different IE
ZeroOneTwoThreeFiveSevenTen
330.920.550.20−0.25−0.92−1.53−2.44
341.200.830.470.01−0.66−1.28−2.22
361.761.391.020.54−0.15−0.79−1.76
382.321.941.561.070.35−0.3−1.31
402.862.482.111.590.860.19−0.86
423.383.012.632.111.370.60−0.41
443.893.513.142.621.881.170.04
99.5 116.3215.7815.2414.3813.3412.3510.60
Electricity sales price: 0.05 USD kWh−1. Biofertilizer sales price: 129 USD t−1. 1 Vasco-Correa et al. [57] (adjusted for inflation). The colors provide visual support to assess the profitability level of the scenarios analyzed: values shaded toward green indicate higher profitability, whereas those shaded toward red indicate lower profitability.
Table 10. Conventional electricity sales prices and guaranteed sales prices for large-scale WtE-AD processes are reported in the literature.
PriceUnitCountryElectrical Capacity of the WtE-AD Process (kW)Ref.
0.060 1USD kWh−1Brazil [61]
0.190 1EUR kWh−1Croatia300 to 400[62]
0.165 1 400 to 1000
0.160 1 1000 to 2000
0.150 1 2000 to 5000
0.097 1 France<150
0.081 1 >2000
0.097 1 Hungary<150
0.081 1 >2000
0.147 1 Luxembourg<150
0.137 1 150 to 300
0.127 1 300 to 500
0.117 1 500 to 2500
0.088 1 UK<250
0.082 1 250 to 500
0.084 1 <500
0.101 1GBP kWh−1UK<250[63]
0.195 1EUR kWh−1Austria<250
0.056 1 Denmark
0.118 to 0.211 1 France
0.237 1 Germany<75
0.150 1 Irland<500
0.280 1CHF kWh−1Switzerland<50
0.150 1EUR kWh−1Netherlands
0.084 2 UK [64]
0.089 2 Germany
0.067 2 France
0.080 2 Spain
0.125 2 Italy
0.060 2 NY, USA [65]
0.088 2 NY, USA [66]
0.050 2USD kWh−1Mexico [29]
1 Guaranteed price for electricity production in WtE-AD processes. 2 Price of conventional electricity.
Table 11. Relationship of electricity sales revenues to the NPV in large-scale WtE-AD processes.
Electricity ScenarioNPV (Million USD) of the Large-Scale WtE-AD Process Under Different IE
ZeroOneTwoThreeFiveSevenTen
Mexico0.920.550.2−0.25−0.92−1.53−2.44
New York, USA5.344.844.333.672.641.640.08
Mexico 17.136.565.995.264.163.061.27
Italy9.298.67.937.075.84.612.66
Germany21.2319.9418.6817.0614.6712.459.06
1 Hypothetical scenario with electricity sales price of 0.10 USD kWh−1. The colors provide visual support to assess the profitability level of the scenarios analyzed: values shaded toward green indicate higher profitability, whereas those shaded toward red indicate lower profitability.
Disclaimer/Publisher’s Note: The statements, opinions and data contained in all publications are solely those of the individual author(s) and contributor(s) and not of MDPI and/or the editor(s). MDPI and/or the editor(s) disclaim responsibility for any injury to people or property resulting from any ideas, methods, instructions or products referred to in the content.