Article

Optimization of Monascus purpureus Culture Conditions in Rice Bran for Enhanced Monascus Pigment Biosynthesis

College of Biological Engineering, Henan University of Technology, No.100, Lianhua Street, High-tech Industrial Development Area, Zhengzhou 450001, China
*
Author to whom correspondence should be addressed.
Fermentation 2025, 11(9), 505; https://doi.org/10.3390/fermentation11090505
Submission received: 25 July 2025 / Revised: 21 August 2025 / Accepted: 25 August 2025 / Published: 28 August 2025
(This article belongs to the Section Microbial Metabolism, Physiology & Genetics)

Abstract

Monascus pigments (MPs) are the most valuable secondary metabolites of Monascus. To improve the production of MPs is of great importance to food processing. Currently, studies using rice bran as the substrate to produce MPs are rare. In this study, rice bran with different carbon sources and cellulase hydrolysis conditions were explored in Monascus purpureus M9 in this study. Through single-factor experiments and Box–Behnken response surface optimization, we demonstrated that mannitol supplementation combined with cellulase treatment of substrate significantly enhanced the yields of MPs. The optimal conditions (4.00% mannitol, cellulase hydrolysis at 60 °C for 2 h) achieved a maximum color value of 3538 U/g. Furthermore, comparative evaluation under different culture conditions, including only rice bran (RB), cellulase hydrolysis of rice bran (Cel), rice bran supplemented with mannitol (Man), mannitol supplementation combined with cellulase pretreatment of substrate (Opti), and only rice (Rice), confirmed the effectiveness of the optimized treatment. The color value of the Opti group was 27.95 times more than that of the RB group and reached 80.96% of the counterpart of the Rice group. The Opti group also significantly enhanced the yields of two orange pigments (Monascorubrin and Rubropunctatin), induced more sexual spore formation, and exhibited the maximum biomass and colony diameter among different groups. The hyphae of the Man and Opti groups were full, intact, and tubular. The citrinin content in the Opti group was under the limit standard of China. The data provides a theoretical basis reference for improving the yields of MPs with RB as the substrate.

1. Introduction

Monascus spp. is a traditional medicinal and edible microorganism, which belongs to a type of small saprophytic filamentous fungi [1]. Monascus pigments (MPs), as safe, natural food colorants, are beneficial secondary metabolites produced by Monascus [2]. Characterized by strong stability, excellent colorization, and high production, MPs are widely used as coloring agents used for the food engineering, as well as cosmetic and textile industries [3,4]. Furthermore, several studies have demonstrated that MPs possess various biological activities such as anti-microbial, anti-diabetic, anti-hyperlipidemic, anti-inflammatory, anti-cancer, and anti-oxidant effects [5,6,7]. MPs are polyketide-structured mixed pigments, including three major categories: yellow, orange, and red pigments. To date, over 110 kinds of MPs have been identified, of which six kinds of classical pigments attracted widespread attention, and they are two yellow pigments (Ankaflavin and Monascin), two orange pigments (Rubropunctatin and Monascorubrin), and two red pigments (Rubropunctamine and Monascorubramine), respectively [8,9].
MPs are generally extracted from red mold rice. As is well known, red mold rice is fermented with rice as the substrate, resulting in a high cost for MP production and a waste of rice. Therefore, in recent times, many researchers have utilized low-cost agricultural by-products such as sugarcane bagasse, brewer’s spent grain, and orange peel as the substrates for submerged fermentation as alternative approaches [10,11,12]. Potato peel, a carbon source for Monascus SRZ112, revealed its superiority over other carbon sources for MP production [13]. In addition to potato peel, other low-cost substrates such as potato pomace, corn starch, rice straw hydrolysate, soybean meals, waste loquat kernels, and date waste substrates have been evaluated for MP synthesis in Monascus fermentation and shown potential in substitution for rice [14,15,16,17,18]. However, reports about rice bran used as a fermentation substrate for MP production are scarce.
Rice bran is the main by-product generated from rice processing, and it accounts for 5–8% of the rice composition [19]. The total production of rice bran could be up to 10 million tons annually in China. However, most rice bran provides the source for animal feed or fuel, giving rise to limited exploitation [20]. Rice bran is rich in dietary fiber, protein, fat, and a large number of minerals. Hence, the use of rice bran for microbial fermentation could be available [21]. The proportion of dietary fiber in rice bran is up to more than 30%. Cellulose, the predominate component of dietary fiber could be hydrolyzed by cellulase and converted into utilizable carbon source for Monascus fermentation [22]. Carbon sources played a vital role in MP biosynthesis in some fermentation studies [23,24]. Up to now, it has been unclear that rice bran could be hydrolyzed by cellulase to release the carbon source for fermentation.
In this study, in order to reduce the cost of MP production, rice bran was used as a fermentation substrate for Monascus purpureus. To improve yields of MPs, different carbon sources were added to rice bran to supplement the carbon source, and cellulase was used to hydrolyze rice bran for releasing the carbon source at the same time. The cooperative effects between the two were performed in this study at the first time. Furthermore, through controlled comparative experiments including only rice bran (RB), cellulase hydrolysis of rice bran (Cel), rice bran supplemented with mannitol (Man), mannitol supplementation combined with cellulase pretreatment of substrate (Opti), and only rice (Rice), we validated the effects of the optimal conditions on the yields and the constituents of MPs, as well as the growth and development of M9.

2. Materials and Methods

2.1. Strain and Culture Conditions

The RB from brown rice was purchased from Xinxiang, through surface removal using a Satake TM05C rice polisher. M. purpureus M9 (NO. CGMCC 3.19586) was conserved in the laboratory, and it was inoculated on malt extract agar slant medium with a sugar content of 10 °BX. Spores on slant medium were washed with 5 mL of sterile water and then transferred to 100 mL of the seed medium (peptone, 20 g/L; glucose, 60 g/L; MgSO4·7H2O, 5 g/L; NaNO3, 10 g/L; and KH2PO4, 10 g/L). Seed medium was fermented in a thermostatic QYC-200 shaker (CIMO, Shanghai, China) at 28 °C and 180 r/min for 36 h–48 h. The spore suspension was obtained by filtering the aforementioned inoculum with 8 layers of sterile gauze, and the concentration of spore suspension was adjusted to 106 spores/mL with sterile water. Spore number (106 spores/mL) was calculated with a hemacytometer. An amount of 3 mL of the spore suspension was inoculated into a 250 mL conical flask containing 50 mL of submerged fermentation medium. The fermentation was performed in 28 °C and 180 r/min for 5 days.
The five submerged fermentation media were composed as follows: (1) RB: rice bran, 50 g/L; (2) Cel: rice bran, 50 g/L and cellulase (10,000 U/g), 12.5 g/L, water bath at 60 °C for 2 h; (3) Man: rice bran, 50 g/L and mannitol, 40 g/L; (4) Opti: rice bran, 50 g/L and cellulase, 12.5 g/L, water bath at 60 °C for 2 h, then supplemented with mannitol, 40 g/L; and (5) Rice: rice powder, 50 g/L. For the corresponding solid medium, 25 g/L of agar powder was added. Cellulase (10,000 U/g) was purchased from Macklin Biochemical Technology Co., Ltd. (Shanghai, China).

2.2. Determination of Color Value and Biomass

The fermentation medium was centrifuged at 4000 rpm for 20 min on the 5th day, and the mycelia were collected. Then, the mycelia were dried at 60 °C for 4 h by an air-dry oven (DHG-9030A, Sapeen, Shanghai, China) and ground into powder. The dried mycelia were weighed on an AUY120 electronic analytical balance (Shimadzu, Kyoto, Japan) to determine biomass. Afterward, 0.5 g of the powder was extracted with 3 mL of 75% ethanol with ultrasound for 30 min followed by centrifugation at 4000 rpm for 10 min to collect the supernatant. The experiment was performed in triplicate. All supernatants were merged for the determination of intracellular pigmentation. The absorbance of intracellular pigmentation was determined by a Spark multimode microplate reader (Tecan, Männedorf, Switzerland) at a wavelength of 505 nm, with 75% ethanol as the blank. The color values were calculated according to the method of Qin et al. [25] with minor modifications. MP concentration was expressed as a color value, and the calculation formula was as follows:
c o l o r   v a l u e   ( U / g )   =   O D × d i l u t i o n   f a c t o r ×   p i g m e n t   e x t r a c t i o n   v o l u m e   ( m L ) t o t a l   b i o m a s s   ( g )
  • OD: optical density.

2.3. Single-Factor Experiment

The medium composition was optimized for improving yields of MPs in M9 in RB medium. Different carbon sources were screened by single-factor analysis including glucose, fructose, xylitol, xylose, galactose, and lactose (0%, 3%, 4%, 5%, 6%, and 7%), and maltose, mannitol, and sucrose (0%, 2%, 3%, 4%, 5%, and 6%), respectively.
Hydrolysis conditions, including cellulase additive amount (0.75%, 1.00%, 1.25%, 1.5%, and 1.75%), enzymatic hydrolysis time (1 h, 1.5 h, 2 h, 2.5 h, and 3 h), and temperature (40 °C, 50 °C, 60 °C, 70 °C, and 80 °C) were also selected by single-factor analysis to enhance MP production further with RB as the substrate.

2.4. Steepest Ascent Design

Steepest ascent method is a strategy for approaching the region of maximal production based on the results of a single-factor experiment [26]. Factor screening demonstrated that mannitol additive amount, enzymatic hydrolysis time, and temperature were the dominant variables controlling MP yields. Subsequently, the levels of these factors were systematically increased following the steepest ascent path to approach the response maximum, thereby identifying the optimal region. We selected the mannitol additive amount (2%, 3%, 4%, 5%, and 6%), enzymatic hydrolysis time (1 h, 1.5 h, 2 h, 2.5 h, and 3 h), and temperature (40 °C, 50 °C, 60 °C, 70 °C, and 80 °C) for the steepest ascent experimental design. Based on these parameters, five experimental groups were designed. The experimental group with the highest color value was selected as the central point for subsequent experiments.

2.5. Experimental Design for Response Surface Methodology (RSM)

To optimize the fermentation conditions for achieving the maximum MP yields, color value was selected as the response variable, with mannitol additive amount, enzymatic hydrolysis time, and temperature selected as the independent variables based on Box–Behnken design principles. Furthermore, to optimize the fermentation process, a three-factor, three-level Box–Behnken design was employed using Design-Expert 13 software (Stat-Ease, Inc., Minneapolis, MN, USA), followed by verification.

2.6. Determination of MP Constituents and Citrinin (CIT) Content

The abovementioned solution from pigment extraction was filtered through a 0.22 μm pore-size membrane for MP and CIT detection. The six classic MPs were analyzed quantitatively with an LC-1260 HPLC system (Agilent, Santa Clara, CA, USA). A C18 reverse-phase column (XDB, 4.6 × 250 mm, 5 μm, Agilent, Santa Clara, CA, USA) was used for the separation of MPs. The column temperature and injection volume were 25 °C and 20 μL, respectively. A diode array detector (DAD) was used for detection at the wavelength of 410 nm. Additionally, 0.1% formic acid in water (mobile phase A) and acetonitrile (mobile phase B) were chosen for gradient elution with a flow rate of 1.0 mL/min. The gradient elution was performed as follows: mobile phases B was maintained at 60% for 12 min, 60% to 90% for 13 min, 90% for 2 min, and 90% to 60% for 3 min.
The determination of CIT content was performed by an LC-1260 HPLC system (Agilent, Santa Clara, CA, USA) coupled with a fluorescence detector (FLD). CIT was separated by a C18 reverse-phase column (4.6 × 150 mm, 5 μm, Agilent, Santa Clara, CA, USA) with a flow rate of 0.7 mL/min, and the column temperature was 30 °C. The mobile phases and injection volume were the same as their MP counterparts. The detection wavelength was 331 nm (excitation wavelength) and 500 nm (emission wavelength). A CIT standard (Acmec, Shanghai, China) was used to construct a standard curve with six concentrations (0.0 ng/mL, 1.0 ng/mL, 2.0 ng/mL, 5.0 ng/mL, 10.0 ng/mL, and 20.0 ng/mL). A gradient elution was performed as follows: The mobile phases B was maintained at 40% for 1 min, 40% to 90% for 6 min, 90% for 2 min, 90% to 40% for 1 min, and 40% for 5 min.
The qualitatively analysis of intracellular pigmentation was performed by a Waters XEVO-TQD QCA1534 LC-MS system (Waters, Milford, MA, USA) coupled with an electrospray ionization (ESI) source in the positive and negative modes. The full wavelength scan range was m/z values 300 to 500. Pigments were separated by a C18 chromatographic column (3.0 × 150 mm, 2.6 μm, Phenomenex, Torrance, CA, USA) with a column temperature of 40 °C. The conditions of mass spectrometry analysis were as follows: drying gas flow, 10.0 mL/min; drying gas temperature, 350 °C; injection volume, 10 μL; capillary voltage, 3.5 kV; ion source temperature, 120 °C; nebulizer pressure, 35 psi; and cone voltage, 30 V. The mobile phases and elution program were the same as the HPLC analysis of MPs. The ion chromatogram of a single component was extracted and referenced with parent ion and daughter ion values as follows: Ankaflavin (parent ion: m/z 387.3; daughter ion: m/z 311.2, 261.1) and Monascin (359.3; 287.3, 215.1), Rubropunctatin (383.2; 339.2, 321.2) and Monascorubrin (355.2; 311.2, 293.1), and Rubropunctamine (382.2; 179.1, 160.1), and Monascorubramine (354.2; 310.1, 292.1).

2.7. Observation of Colony Morphology and Measurement of Colony Diameter

To observe the colony morphology and to measure the colony diameter, the five kinds of solid media inoculated with 10 μL of spore suspension (106 spores/mL) were incubated at 28 °C for 7 days. The changes in colony morphology were recorded with a WX350 camera (Sony, Tokyo, Japan). Meanwhile, the colony diameters were measured using a vernier caliper from 3 to 7 days.

2.8. Determination of Biomass and Spore Number

To facilitate the measurement of colony biomass, the surface of the solid medium was covered with sterile cellophane membranes. An amount of 10 μL of spore suspension (106 spores/mL) was inoculated in the center of solid medium, prior to the cultivation for 7 days at 28 °C. The weights of fresh colonies, which were uncovered from cellophane membranes, were determined with an AUY120 electronic analytical balance (Shimadzu, Kyoto, Japan) from 3 to 7 days.
Uncovered fresh colony was placed in a centrifuge tube containing 1 mL of sterile water and was vortexed using a MX-E shaker (DLAB, Beijing, China) to remove conidia and cleistothecia, which were calculated with a hemacytometer.

2.9. Observation of Spore Micromorphology

An amount of 100 μL of spore suspension (106 spores/mL) was spread evenly on the surface of solid medium. Then, the sterile coverslips were inserted at 45° into the solid medium and incubated at 28 °C for 7 days. The coverslips were removed from the medium, and the spore morphology was visualized through an BK5000 optical microscope (OPTEC, Chongqing, China).

2.10. Observation of Mycelia Morphology

M9 was inoculated on solid media of 5 categories and cultured at 28 °C for 5 days. Subsequently, the mycelia were collected and fixed in a 2.5% glutaraldehyde solution for 12 h. Afterwards, the fixative was removed by centrifugation, and the mycelia were rinsed with phosphate-buffered saline (PBS, pH 7.2) for 10 min, with three repeats. Dehydration was performed with different concentrations of ethanol (30%, 50%, 70%, 80%, 90%, 95%, and 100%), and the ethanol at each concentration was applied for 10 min. The supernatant was discarded each time through centrifugation at 4 °C with 8000 rpm for 10 min. The dehydrated mycelia were dried with FDU-2110 vacuum freeze-drying equipment (EYELA, Shanghai, China). The micromorphology of treated M9 mycelia was observed using a Quanta-200 scanning electron microscope (SEM) (FEI, Hillsboro, OR, USA) at magnifications of 2400 and 5000 times, respectively.

2.11. Data Analysis

Statistical analysis was performed using SPSS 27.0 software (IBM SPSS Inc., Chicago, IL, USA), Origin 2024 software (Origin Lab, Northampton, MA, USA) and Design-Expert 13 software (Stat-Ease Inc., Minneapolis, MN, USA). Three parallel replicates were set up for all experiments to ensure the accuracy of the data. The results were expressed as the mean ± standard deviation in this study. Statistical significance was determined by an analysis of variance (ANOVA) with significance set at p < 0.05 using Tukey’s tests.

3. Results

3.1. Single-Factor Experimental Analysis

3.1.1. Effect of Carbon Source on Biomass and Intracellular Pigments

The changes in biomass under different carbon sources showed increasing trends. Thus, all supplemented carbon sources could promote the growth of M9. The biomass of adding lactose, sucrose, mannitol, and maltose was higher than those of xylose, galactose, fructose, xylitol, and glucose. It showed the maximal biomass when adding lactose (2.73 g), followed by sucrose (2.67 g), mannitol (2.55 g), and maltose (2.39 g), which were 1.84 times, 1.80 times, 1.72 times, and 1.61 times those of than the RB group (1.48 g), respectively.
Color value was measured by OD505nm, which was on behalf of pigment concentration. The color values of mannitol, maltose, xylitol, and sucrose have similar trends (Figure 1). The maximal color values were 121.60 U/g, 531.00 U/g, 798.00 U/g and 1292.00 U/g when adding 5.00% sucrose, 4.00% xylitol, 2.00% maltose, and 4.00% mannitol, respectively. The color values of glucose, fructose, and xylose supplementation first rose and then downgraded. The maximal color value were 868.00 U/g, 865.30 U/g, and 740.00 U/g when adding 4.00% glucose, 5.00% fructose, and 4.00% xylose, respectively. With increasing additive amounts of galactose and lactose, the color value of intracellular pigments was lower than that of RB fermentation. The intracellular pigments of M9 were inhibited when adding galactose and lactose. In conclusion, the addition of 4.00% mannitol produced the highest color value of intracellular pigments, which was 10.99 times higher than that of the RB condition. According to these results, mannitol is the most suitable agent for supplemented carbon sources.

3.1.2. Effect of Cellulase on MP Production and Intracellular Pigments

As is shown in Figure 2, color value and biomass of M9 under different cellulase hydrolysis conditions showed increases in the low-value range of parameters and decreases in the high-value range. In this study, biomass and intracellular color value approached the peak values when cellulase additive amount, enzymatic hydrolysis time, and temperature reached 1.25%, 2 h, and 60 °C, respectively. The maximum color values under different cellulase hydrolysis conditions were all significantly higher than the values of the RB fermentation conditions. Enzymatic hydrolysis time and temperature had a greater effect on the color value of M9.

3.2. Steepest Ascent Experiment

According to the results of the single factor experiments, three factors of enzymatic hydrolysis temperature (A), mannitol additive amount (B) and enzymatic hydrolysis time (C) were selected for the test design of response surface optimization. To evaluate the optimal ranges of the three factors on MP production, a series of five experiments was performed using the steepest ascent design (Table 1). The final factor levels (4.00% mannitol, cellulase hydrolysis at 60 °C for 2 h) before the decline were recorded as the center point for subsequent response surface methodology optimization [27].

3.3. Response Surface Results and Analysis

3.3.1. Response Surface Experiments and Results

To determine the optimal combination of variables and response patterns, a Box–Behnken design encompassing three variables were employed. The levels of the three variables of enzymatic hydrolysis temperature (A), mannitol additive amount (B), enzymatic hydrolysis time (C) are presented in Table 2. Seventeen separate experiments were conducted to optimize MP yields.

3.3.2. Model Fitting

The regression model derived from Design-Expert 13 for mannitol additive amount (B) showed notably superior fitness compared to the model for enzymatic hydrolysis temperature (A) and enzymatic hydrolysis time (C). The corresponding linear regression equations are provided as follows:
Y   =   3542.00 68.75 A + 335.00 B 177.50 C 18.75 A B + 63.75 A C 206.25 B C 312.88 A 2 527.88 B 2 352.87 C 2
The ANOVA results of color value’s regression model obtained using Design-Expert 13 software are shown in Table 3. Yields of MPs were significantly influenced by factors A, B, C, A2, B2, and C2 (p < 0.01), whereas MP production was not significantly affected by interactions of AB and AC. The interaction between mannitol additive amount and enzymatic hydrolysis time (BC) was highly significant (p < 0.01). The R2 values (0.9905) and adjusted R2 (0.9784) were close to 1, along with a model of p-value < 0.01. This indicated reasonability of the model for predicting MP yields. The lack of fit of model was not significant (p = 0.0596 > 0.05), suggesting that the model was suitable for predicting MP yields.

3.3.3. Response Surface Analysis

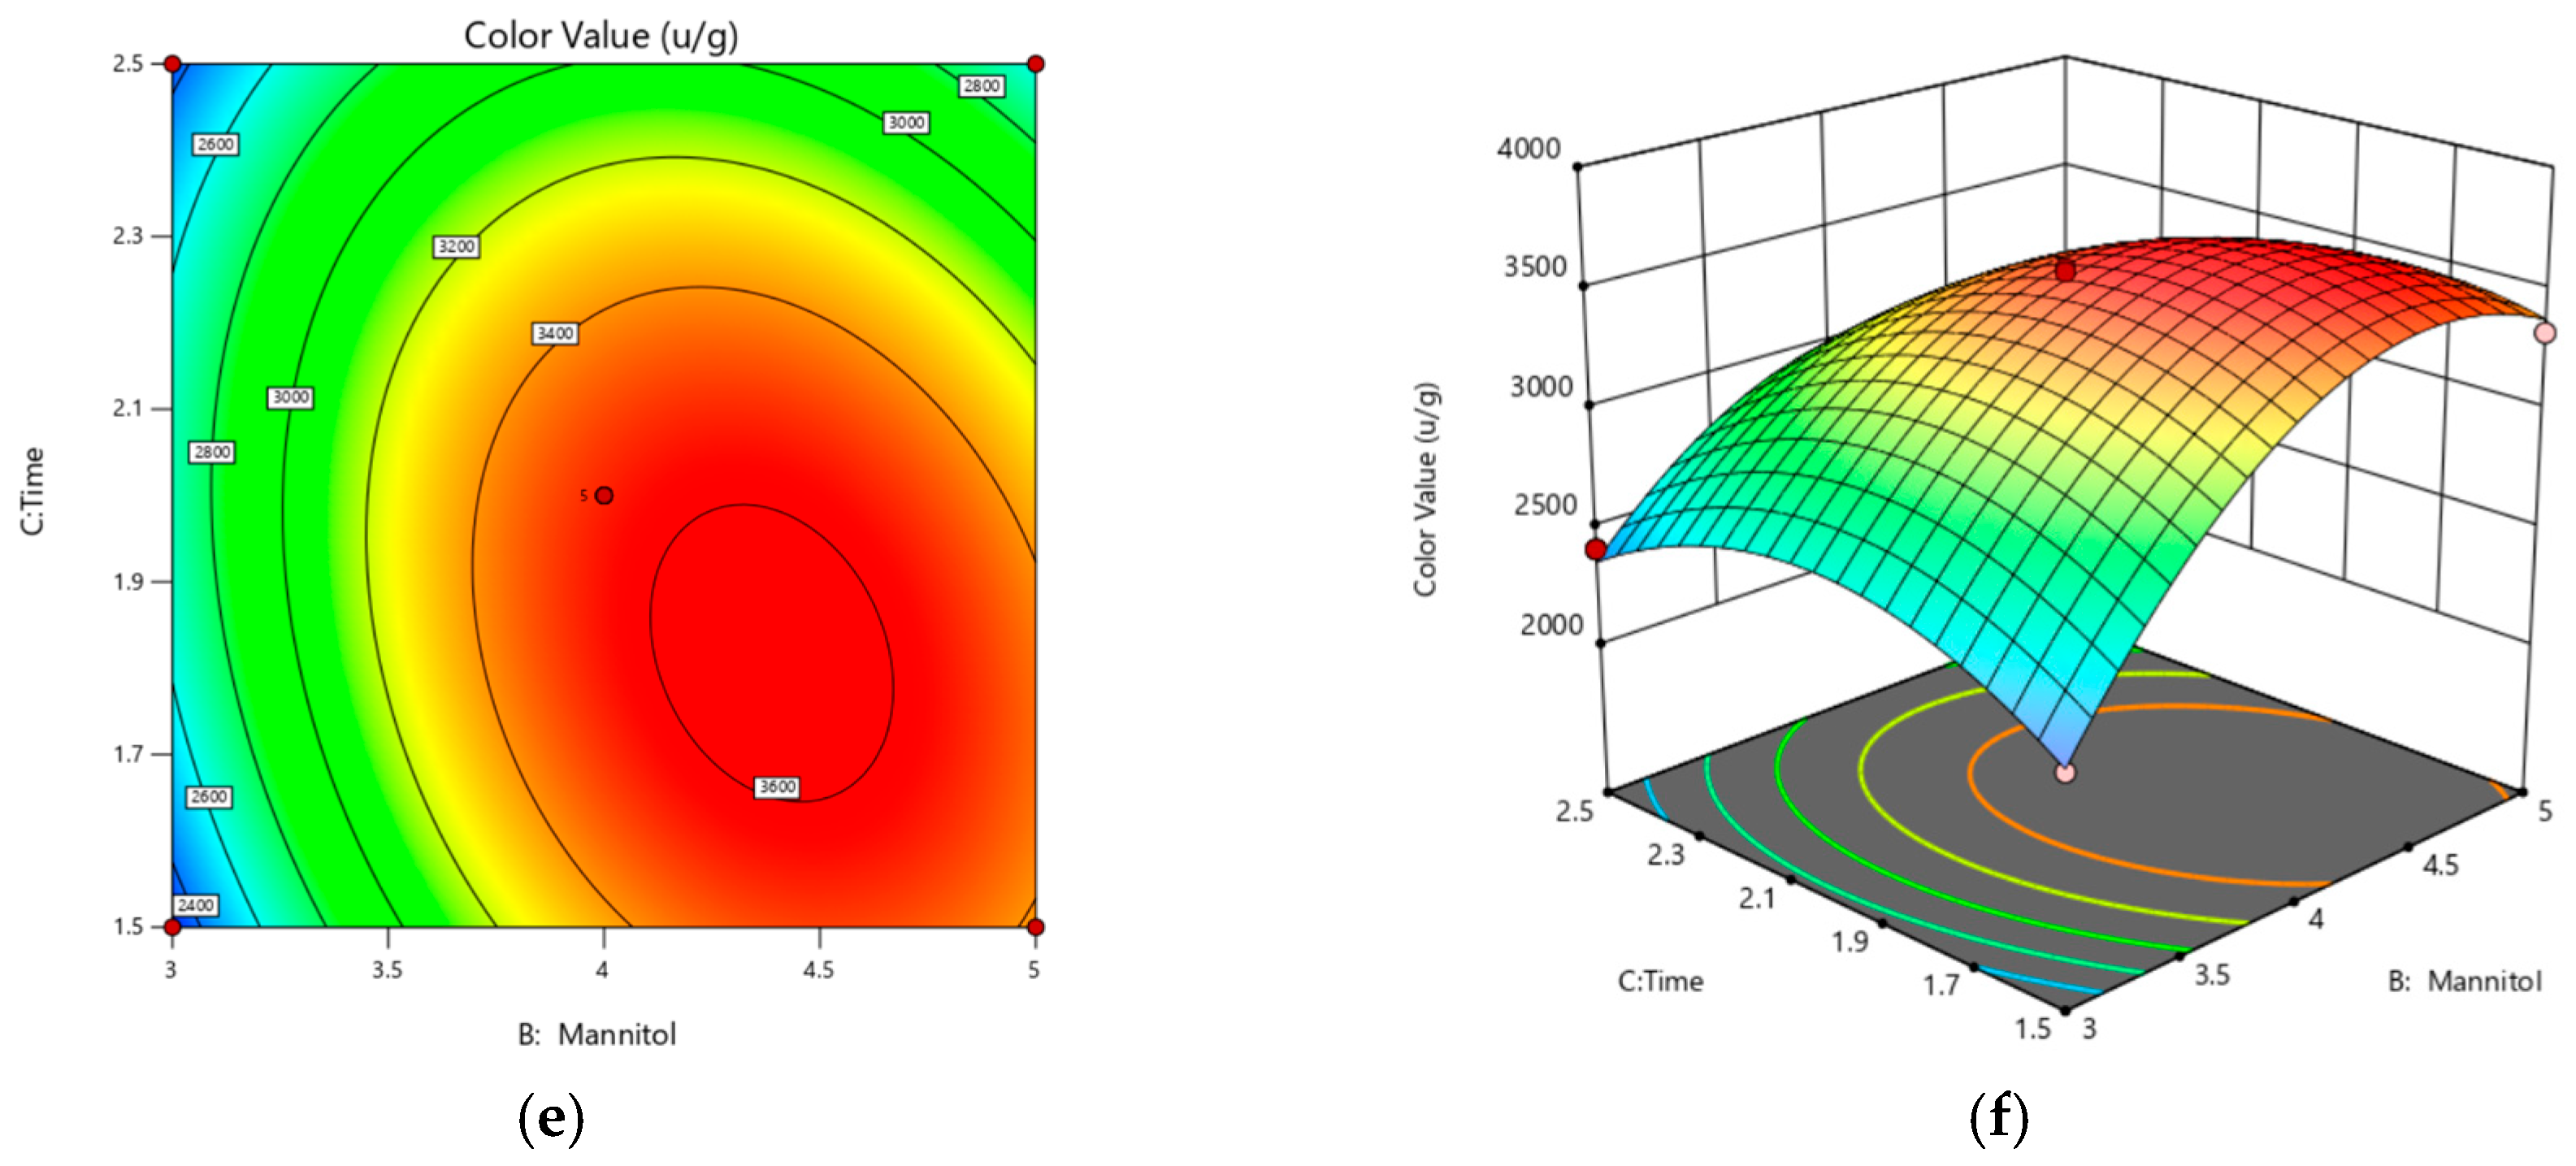
Data analysis and processing were conducted using Design-Expert 13 software, leading to the generation of contour plots and 3D contour curves (Figure 3). Based on the comprehensive analysis of the response surface plots (Figure 3), the order of effects of the three factors on color values was enzymatic hydrolysis temperature > mannitol additive amount > enzymatic hydrolysis time. The response surface model recommended enzymatic hydrolysis time, mannitol additive amount, and enzymatic hydrolysis temperature of 2.05 h, 3.98%, and 59.70 °C, respectively. The maximum predicted color value under these conditions was 3542 U/g, with a 95% confidence interval for the mean response ranging from 3466.74 U/g to 3617.26 U/g. Color value obtained from the experimental validation was 3538 U/g, which was very close to the predicted value from software, indicating that the regression model had a high degree of fit and was reliable and effective for optimizing culture conditions. These findings provide a technical reference for enhancing yields of MPs with RB as a substrate.

3.4. Effect of Optimization Culture Conditions on Monascus Pigment Production, and Growth and Development

3.4.1. Effect of Optimization Culture Conditions on Monascus Pigment Production

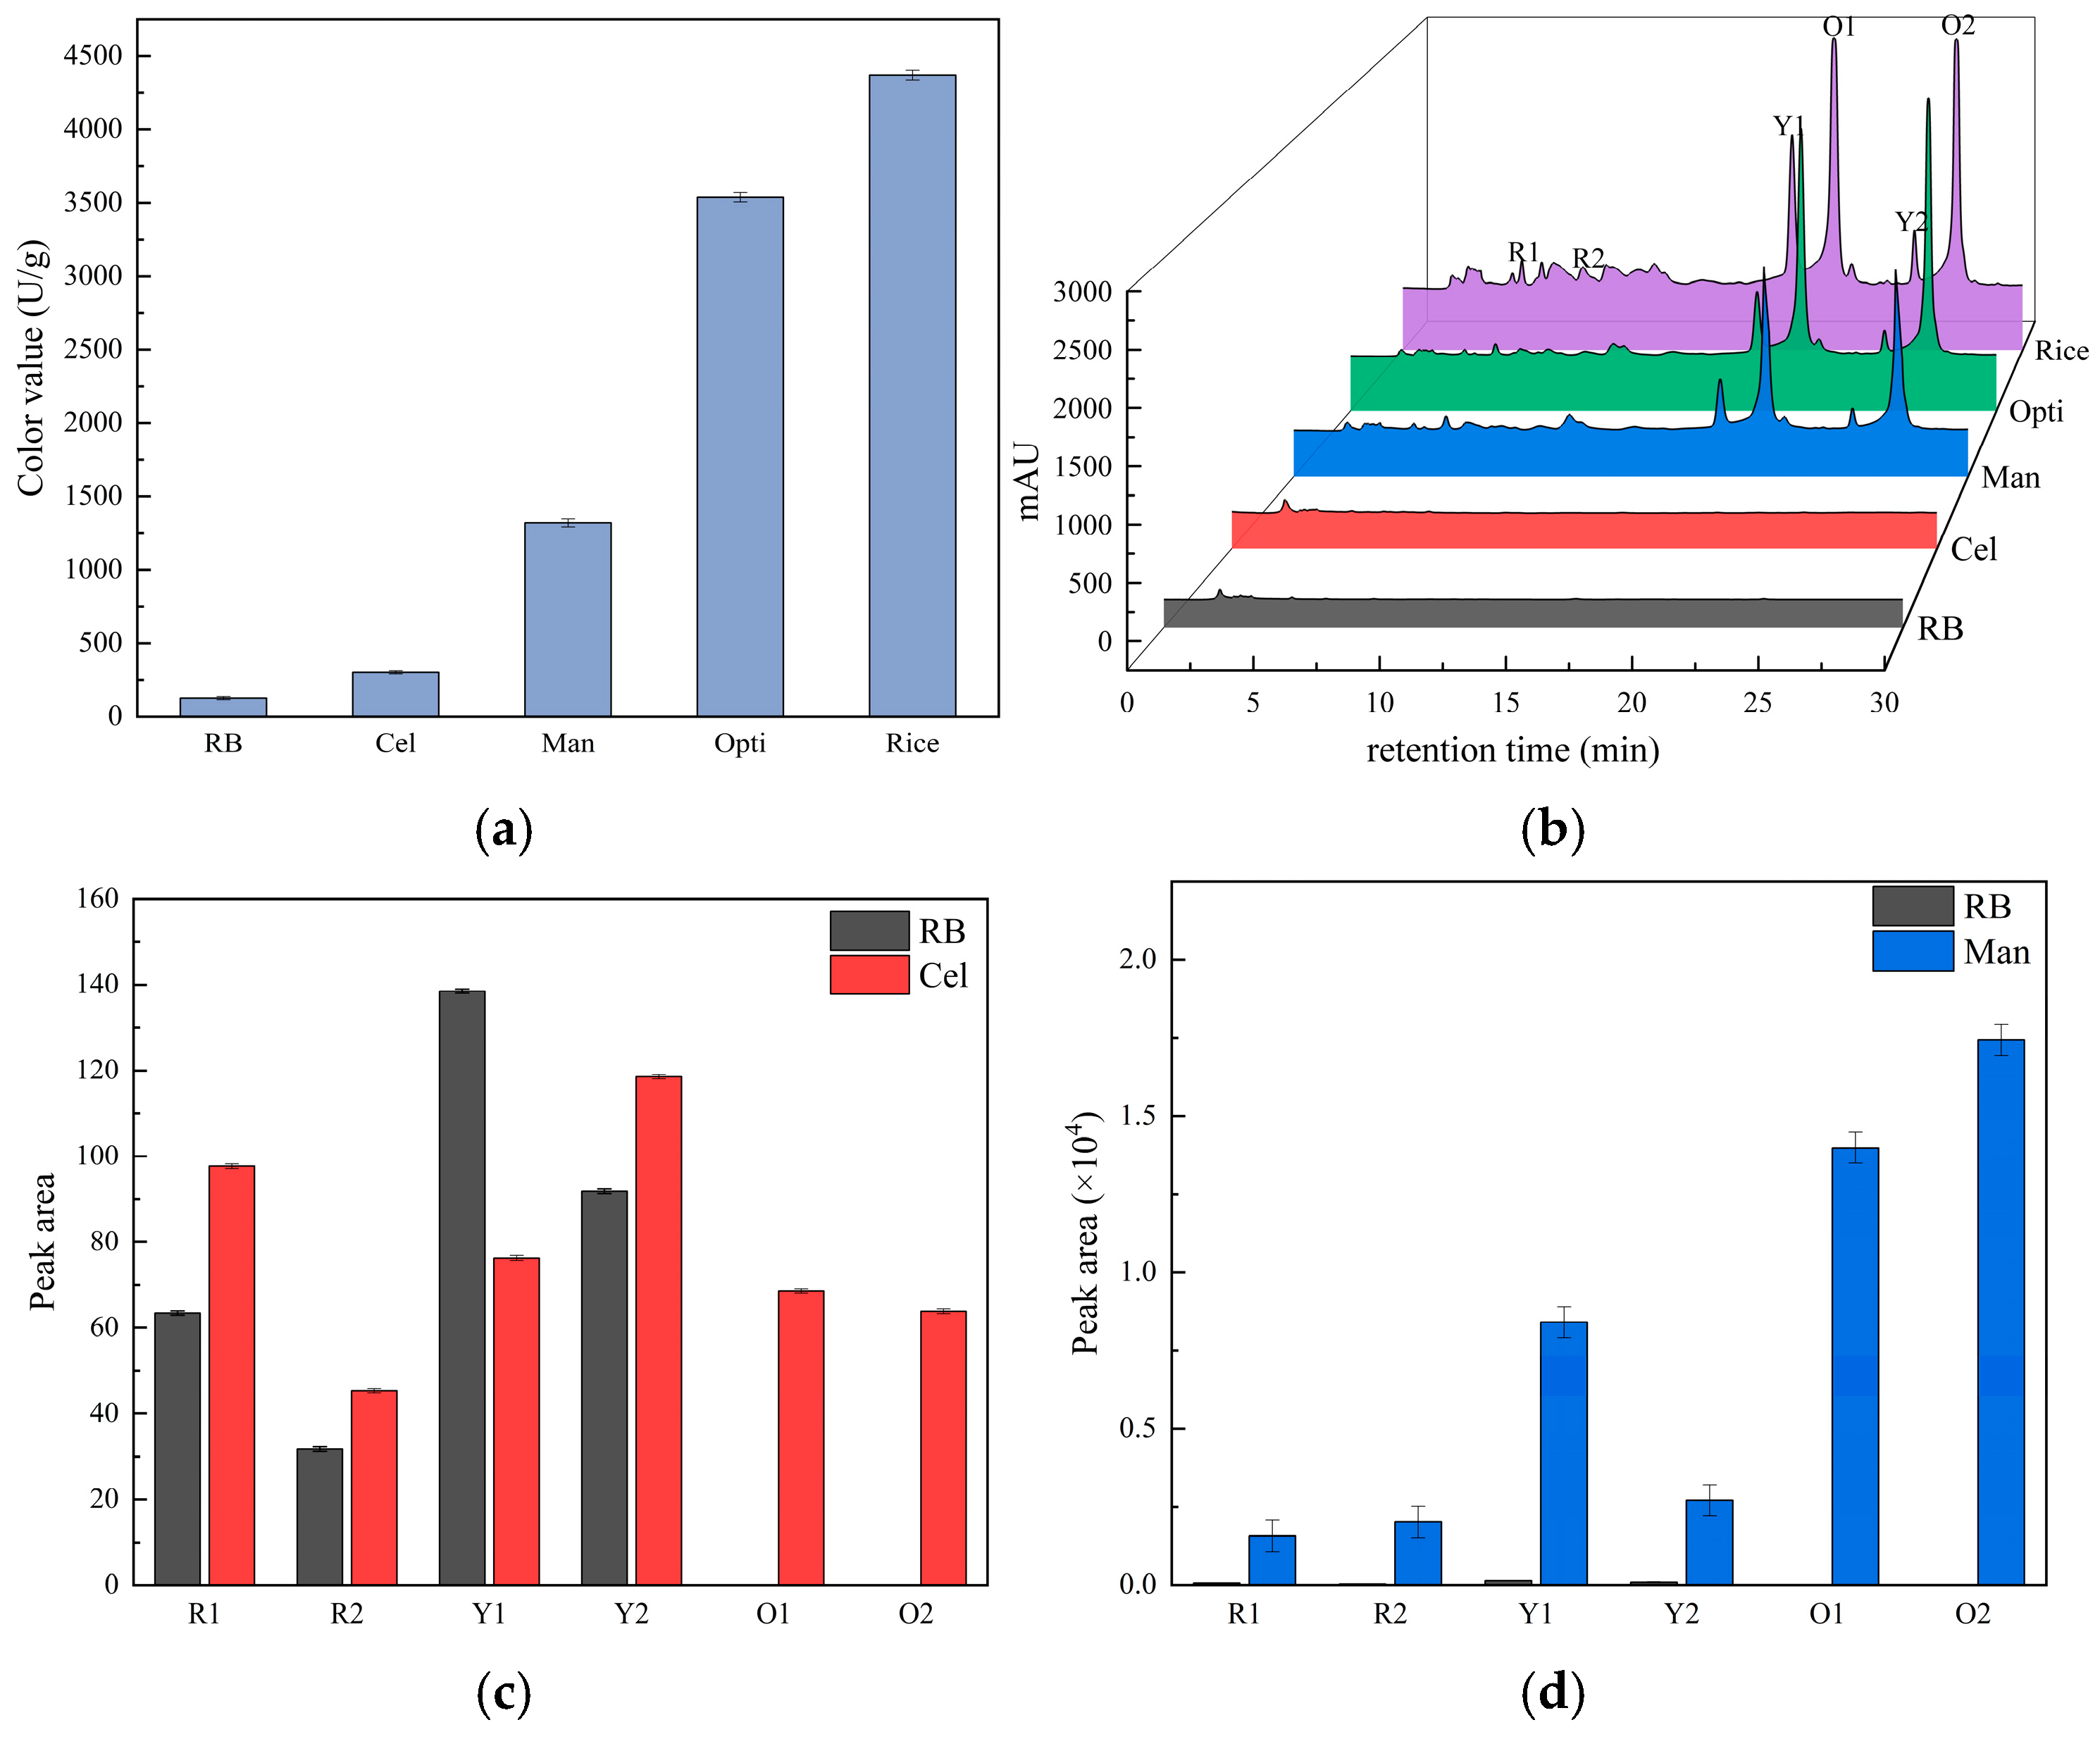
Color values of intracellular pigments were determined by different culture conditions, including the RB, Cel, Man, Opti, and Rice treatments. As is shown in Figure 4a, the color value of Cel was slightly higher than that of RB, and Man had a color value of 1292 U/g, which significantly improved the yields of MPs. The Color value of Opti, using cellulase to hydrolyze RB for releasing carbon source and adding mannitol for supplementing carbon source at the same time, was 3538 U/g, which was 27.95 times more than that of RB and reached up to 80.96% of the counterpart of the Rice group. The results showed that Opti treatment could effectively promote MP biosynthesis with RB as a substrate.

3.4.2. Effect of Optimization Culture Conditions on Pigment Compositions and Citrinin Content

The components of intracellular pigments from different culture conditions were analyzed by HPLC. The six major MPs were distinguished based on retention time (Figure 4b), spectrogram of DAD, and the m/z value provided by LC-MS (Supplementary Figure S1). In the Opti group, the retention times of the six classic MPs were 6.46 min (R1), 11.64 min (R2), 18.34 min (Y1), 24.45 min (Y2), 20.39 min (O1), and 26.41 min (O2), respectively. The spectrograms of R1 and R2, Y1 and Y2, as well as O1 and O2 were the same as the characteristics of red pigments, yellow pigments, and orange pigments, respectively [28]. Their m/z values were 354.20 and 382.30, 359.50 and 387.40, as well as 355.30 and 383.30, respectively, which were consistent with the m/z value of Monascorubramine and Rubropunctamine, Monascin and Ankaflavin, as well as Monascorubrin and Rubropunctatin. Thus, R1, R2, Y1, Y2, O1, and O2 were identified as Monascorubramine, Rubropunctamine, Monascin, Ankaflavin, Monascorubrin, and Rubropunctatin, respectively.
As is shown in Figure 4c–f, there was almost no pigments produced in the RB group. The yields of the six pigments in the Cel group were similar with RB treatment. The Man group generated six pigments (R1 and R2, Y1 and Y2, and O1 and O2), whose yields were significantly higher than those of the RB group. Six pigments also emerged in the Opti treatment, whose concentrations were higher than those of the Man group, and approached the yields of the Rice group, especially O1 and O2.
The effects of different culture conditions on the content of CIT are shown in Figure 4g. The content of CIT in the RB, Cel, Man, and Opti groups were 13.69 μg/kg, 25.68 μg/kg, 53.71 μg/kg, and 75.05 μg/kg, respectively, which were all under the CIT limit standard in China (80 μg/kg). However, the Rice group had the maximum CIT content of 136.39 μg/kg, which was 9.96 times more than that of the RB group.

3.4.3. Effect of Optimization Culture Conditions on the Morphology of Colonies and Spores

The colony morphology of M9 showed significant differences with different culture conditions (Figure 5). All of the colonies were cultured to the 7th day, but there were obviously differences in the colony size. The colony diameters of the Man and Opti groups were significantly higher than that of the others, while the RB group showed obviously the smallest one. The colonies in all culture conditions exhibited the blanket shape with longer mycelia. The mycelium of the RB and Rice groups were sparse, whereas the Cel, Man, and Opti groups had dense hyphae. Meanwhile, the color of these colonies was also obviously varied. The colonies of the RB and Cel groups presented as white, and the Man group exhibited a darker orangish. Orange-red colonies were observed in the Opti and Rice groups. The color of these colonies was consistent with intracellular pigment production.
The micro morphologies of spores in different culture conditions are shown in Figure 6. The conidia of different treatment groups were colorless, transparent, smooth, and inverted pear shape, whereas the cleistothecia were full, black, and spherical. Significant differences in conidia and cleistothecia formation were observed among different culture conditions. Compared to the other groups, the RB and Cel groups formed more conidia. It is well known that more conidia were easily produced under unfavorable growth conditions [29,30]. The results suggested that it is difficult to maintain M9 growth and development with the utilization of only RB or Cel treatment. In contrast, the number of cleistothecia in the Man and Opti groups was significantly higher than that of others, and the closed capsule shells morphology in the Opti group were very similar to that produced by the Rice group.

3.4.4. Effect of Optimization Culture Conditions on Monascus Growth and Development

The biomass of M9 was significantly affected by different culture conditions (Figure 7a). The biomass in five kinds of culture conditions were increased with longer incubation time and reached the maximum value on the 7th days of incubation. The biomass of the RB and Rice groups were lower than that of others, while the Opti group produced the highest biomass. The effects of different culture conditions on colony diameter are shown in Figure 7b. The changes in diameter of colonies showed the same trends with biomass. Colony diameter in the Opti group was larger than that of others. In summary, colony diameter and biomass exhibited the largest value in Opti treatment, indicating that mannitol combined with cellulase treatment was more favorable for the growth and development of M9.
The development process of Monascus involves asexual and sexual reproduction, which produced the conidia and cleistothecia, respectively [30]. The different culture conditions had a significant influence on the formation of conidia and cleistothecia. In Figure 7c, the number of conidia in all culture conditions showed an increased tendency at first, then decreased with culture time, and reached the maximum value on the 4th day of fermentation. The number of conidia in the Cel group was much higher than that of others, followed by the RB group. The closed capsule shells exhibited gradual increasing and then decreasing trends with fermentation time, and the greatest number of cleistothecia were observed on the 5th day of incubation (Figure 7d). The amount of cleistothecia could be sorted in descending order as follows: Man, Opti, Rice, RB, and Cel. Taken together, the Man and Opti groups were more beneficial to sexual reproduction, whereas the RB and Cel groups promoted asexual reproduction.

3.4.5. Effect of Optimization Culture Conditions on the Morphology of Mycelia

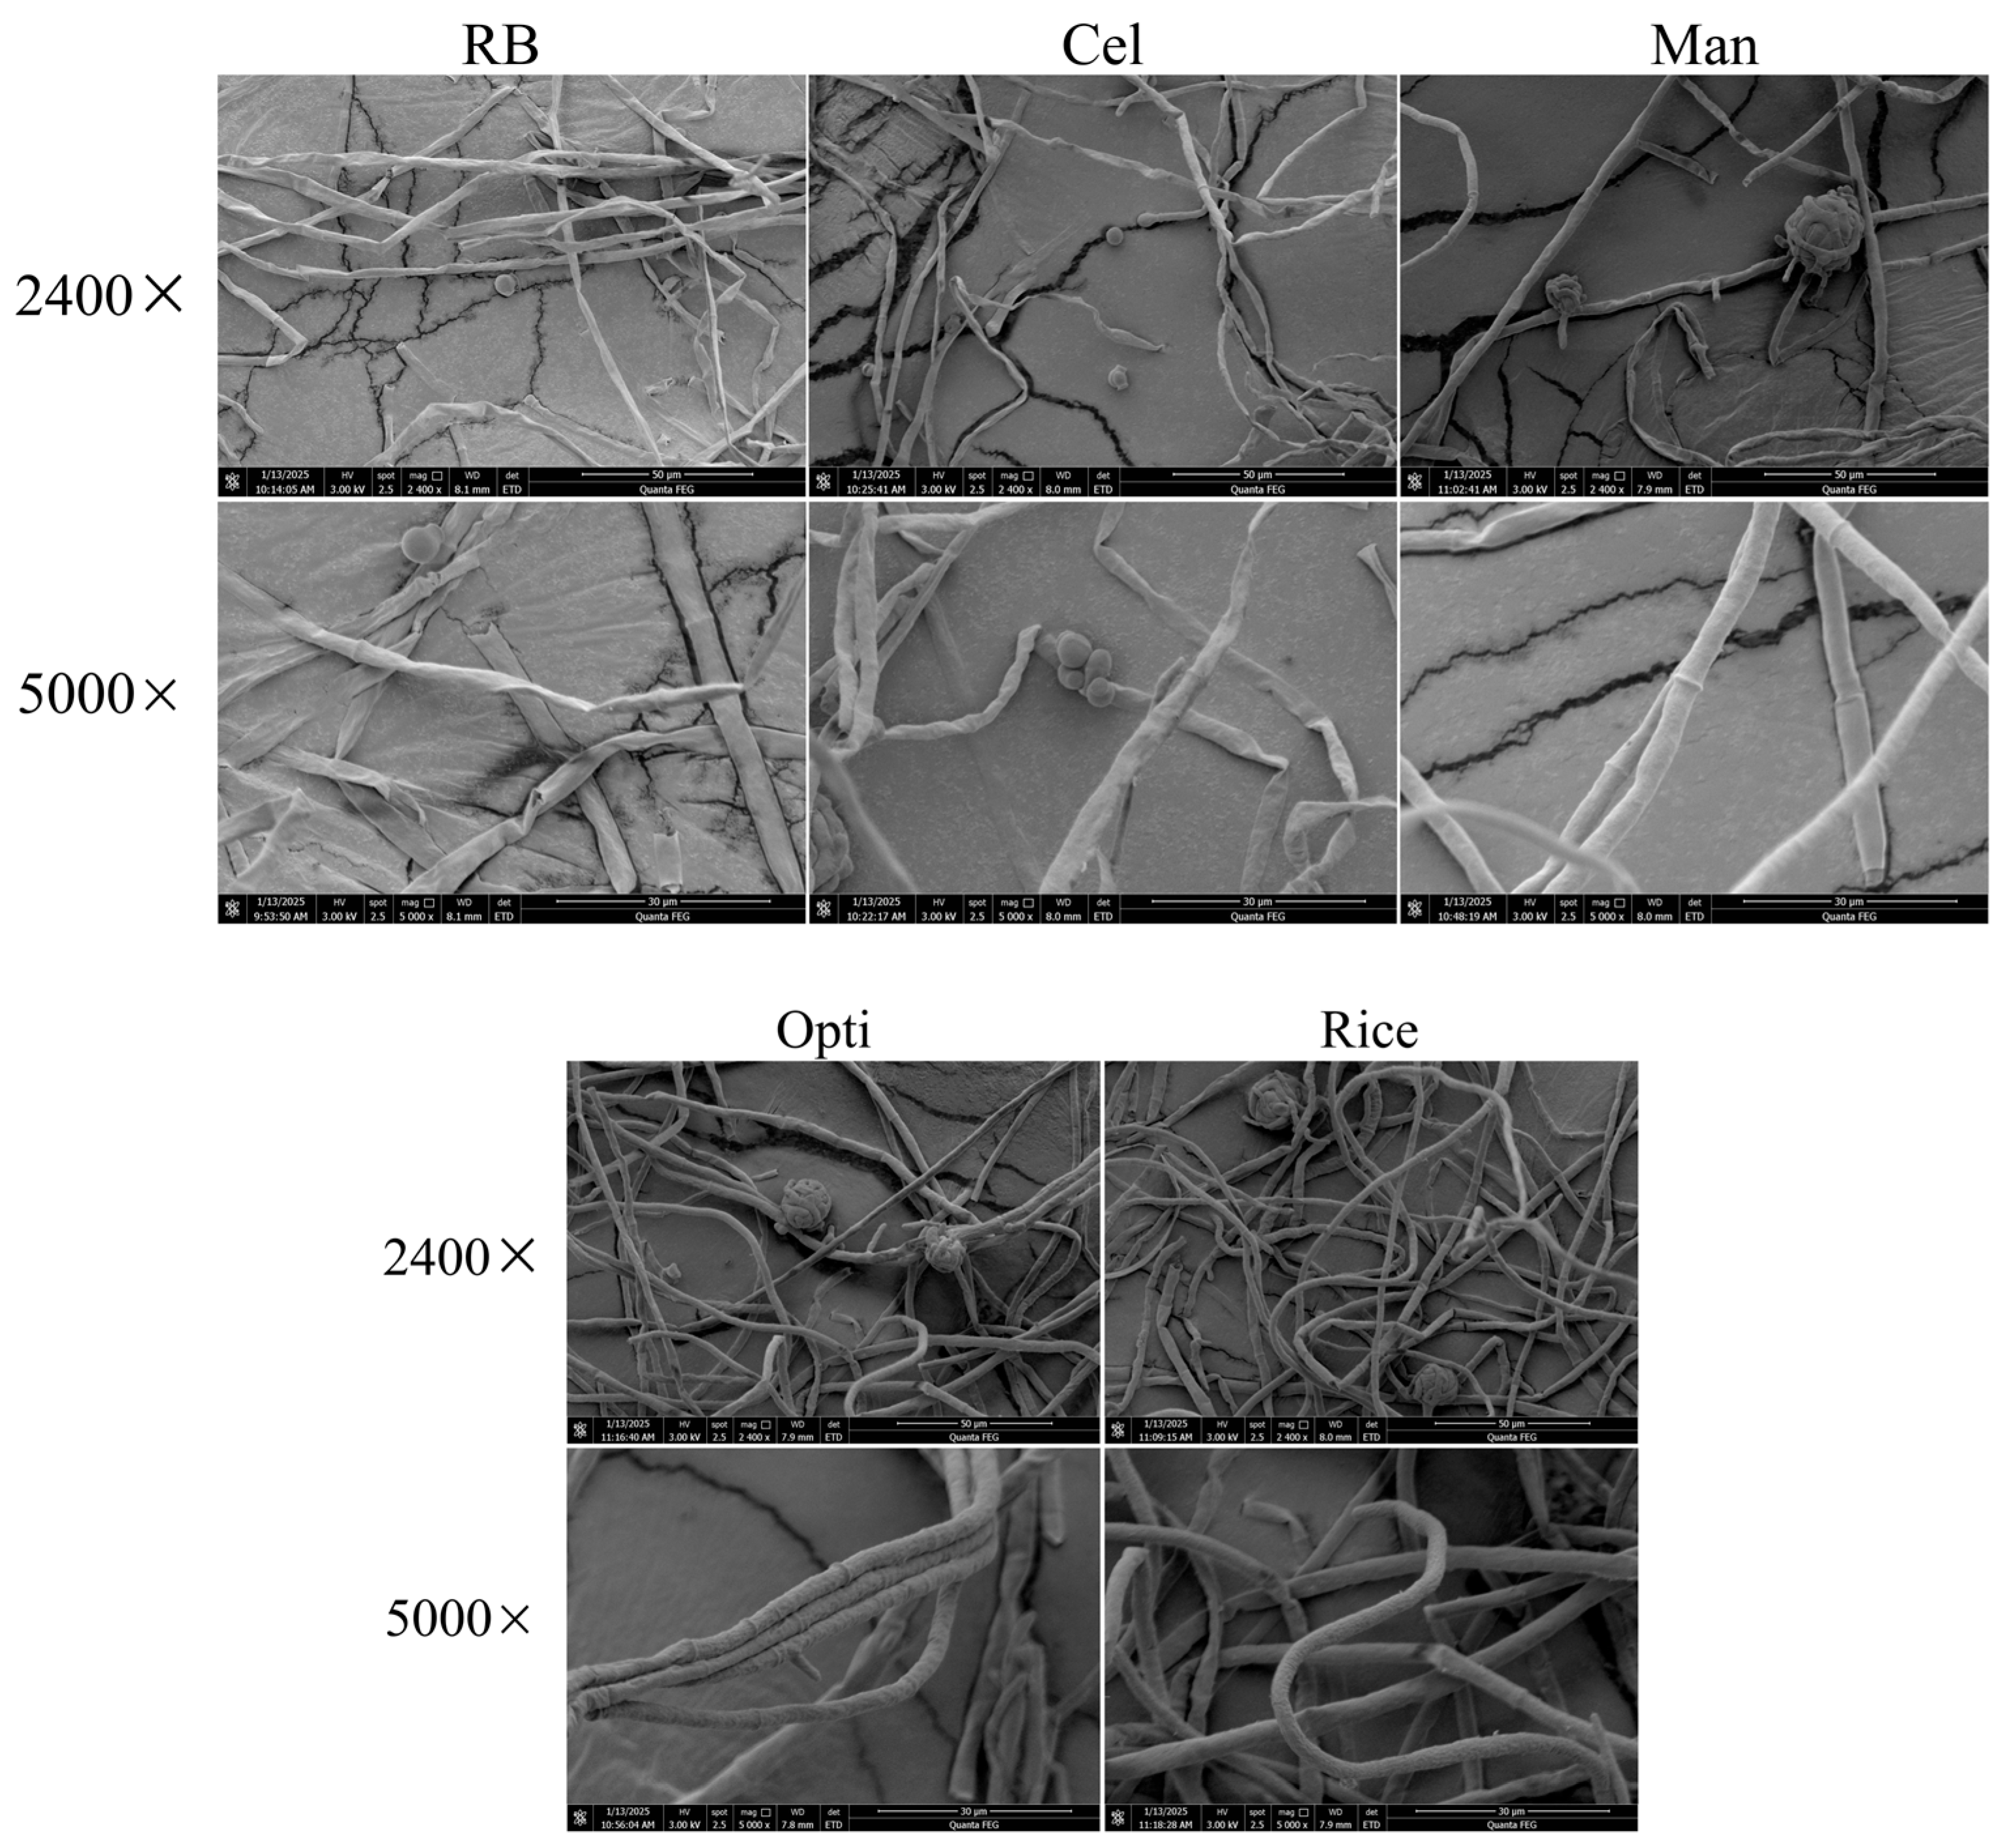
The mycelia morphology in different culture conditions were observed using SEM, as shown in Figure 8. The hyphae of the Man and Opti groups were full, intact, and tubular, which exhibited the similar morphology to that of the Rice group, whereas those in the RB and Cel groups became collapsed and flaky structures. The results indicated that both in terms of the addition of mannitol and mannitol combined with cellulase, pretreatment of a substrate produced a beneficial influence on the mycelium morphology of M9.

4. Discussion

To reduce the cost of MP production, rice was replaced by RB as the fermentation substrate for M9. In the present study, to increase yields of MPs, carbon sources were supplemented in RB and cellulase was used to hydrolyze RB. The results demonstrated that mannitol supplementation combined with cellulase pretreatment of substrate significantly enhanced MP biosynthesis. The selection of a proper carbon source is essential to Monascus growth and MP biosynthesis. Zeng et al. [31]. found that the carbon source glucose is able to significantly improve the MP production, of which the concentration can be 55.44 U/mL. Moussa et al. [32] found that maltose obviously enhances MP biosynthesis. In our single-factor experiments, nine carbon sources were examined, suggesting that all tested substrates except galactose and lactose stimulated intracellular pigments biosynthesis. Notably, mannitol exhibited greater ability than glucose, fructose, and maltose for MP production. The reason for the differences from the previous reports might be linked to the use of different strains [33].
Mannitol, as carbon source, could improve Monascus growth and MP biosynthesis according to reports [34]. Mannitol is phosphorylated to mannitol-1-phosphate and then transformed to fructose-6-phosphate by mannitol-1-phosphate 5-dehydrogenase. Alternatively, mannitol is oxidized to fructose by mannitol 2-dehydrogenase, followed by phosphorylation to fructose-6-phosphate. Fructose-6-phosphate, an important intermediate in the embden-meyerhof pathway (EMP), is converted to acetyl-CoA and malonyl-CoA. Notably, acetyl-CoA and malonyl-CoA are the precursors for MP biosynthesis. In addition, the synthesis of acetyl-CoA is regulated by fatty acid degradation (FAD), the pentose phosphate (PP) pathway, fatty acid biosynthesis (FAB), the tricarboxylic (TCA) cycle, and amino acid metabolism (AAM). Mannitol regulated the genes expressions of a series of enzymes involved in EMP, TCA, PP, FAD, FAB, and AAM. This regulation produced acetyl-CoA and malonyl-CoA for MP biosynthesis. Thus, mannitol exhibits significant potential to promote pigment production in Monascus.
The proportion of dietary fiber in RB is more than 30%. Cellulose, a linear polymer of glucose monomers linked by β-(1,4)-glycosidic bonds, is hydrolyzed by cellulase through cleavage of these β-glucosidic linkages, generating fermentable sugars (glucose and oligomers) for bioconversion [35,36]. In our study, cellulase was used to hydrolyze RB for releasing fermentable carbon sources. Through RSM optimization, Ruan et al. [37] determined the optimal cellulase hydrolysis conditions (18 FPU/g enzyme, 64 h, 1:30 solid-liquid ratio), achieving 443.52 mg/g reducing sugar from sugarcane bagasse. Dasilva et al. [38] observed that hydrolysis conditions (temperature, time, and pH) markedly influenced cellulose-to-sugar conversion. The yields of glucose increased by 17.71 g/L under enzymatic hydrolysis at pH 5.0 and 36 °C for 72 h. The hydrolysis efficiency of cellulase depends on various physicochemical factors, including temperature, time, pH, and enzyme/substrate ratio. Therefore, enzymatic hydrolysis temperature, enzymatic hydrolysis time, and cellulase additive amounts were investigated here. As a result, MP biosynthesis was enhanced obviously when cellulase additive amounts, enzymatic hydrolysis temperature, and enzymatic hydrolysis time were 1.25%, 60 °C, and 2 h, respectively.
Adding mannitol and cellulase hydrolysis could improve MP production, respectively. Up to now, their synergistic effects has not been clearly known. In the present study, the combined action was therefore analyzed. We found that the Opti group, namely the mannitol supplementation combined with cellulase pretreatment of the substrate significantly promoted MP production. The color value of Opti was up to 80.96% of that of the Rice group, which was 27.95 times more than that of the RB group. Except for RB, various agricultural wastes have been explored as substrates for MP production. Asghari et al. [14]. reported that pigment yields can be 5.10 U/g using date waste syrup. Zhang et al. [16]. revealed a maximum MP production of 39.48 U/mL from rice husk. Other studies have investigated waste loquat kernels and potato wastes as alternative substrates, achieving red pigment yields of 327 U/L and 29.86 U/mL, respectively [15,39]. Compared to the above recorded results, the Opti group exhibited a higher color value (3538 U/g) in this study. This is the first time mannitol and cellulase hydrolysis have been integrated to improve MP biosynthesis with the substrate RB.
HPLC analysis demonstrated that Opti treatment significantly enhanced the biosynthesis of six MPs, particularly two orange pigments (O1 and O2), whose yields approached that of the Rice group. In this study, CIT content was 75.05 g/kg of the Opti group, which was under the limit standard in China. Previous studies have shown that citrinin formation can be reduced or even eliminated through culture media and culture condition optimization, mutation breeding, and genetic manipulation [3,40]. Disruption of the citrinin biosynthesis gene (the polyketide synthase gene pks CT) in M. purpureus produced Monascus pigments, which was free of citrinin [40]. It is worth further studying that CIT production was reduced by Opti treatment in subsequent studies. Many studies have demonstrated that the yield of MPs is highly correlated with the morphology of Monascus spore and mycelium [3,41,42]. The effects of different culture conditions on the morphology as well as growth and reproduction of M9 were investigated by solid culture. The colony color in the Opti group was orange-red, which was similar with that of the Rice group. SEM observations revealed that the mycelium of the Man and Opti groups were full, intact, and tubular. The biomass and colony diameter of Opti treatment were the largest among all treatment groups. The number of conidia in the Cel and RB groups was significantly higher than that of others, while the amount of ascospore produced by the Man and Opti groups ranked the top two. The above result indicated that Opti treatment enhanced M9 growth and development.

5. Conclusions

The data in this study indicates that mannitol supplementation combined with cellulase pretreatment of a substrate can promote M. purpureus growth and improve MP biosynthesis with rice bran as the substrate. The intracellular color value was 3538 U/g when adding 4.00% mannitol, with the cellulase hydrolysis at 60 °C for 2 h, which was 27.95 times more than that of RB and reached up to 80.96% of the counterpart of the Rice group. The mannitol integrated with cellulase treatment significantly enhanced yields of two orange pigments (Monascorubrin and Rubropunctatin), exhibited the maximum biomass and colony diameter among different groups, and induced more sexual spore formation. The present study offers a theoretical basis and technical reference for improving the yields of MPs.

Supplementary Materials

The following supporting information can be downloaded at: https://www.mdpi.com/article/10.3390/fermentation11090505/s1, Figure S1. The mass spectra and spectrum of Rubropunctatamine (A) and Monascorubramine (B), Rubropunctatin (C) and Monascorubrin (D), Monascin (E) and Ankaflavin (F).

Author Contributions

Conceptualization, D.C.; methodology, D.C., Y.X. and H.L.; software, Y.X. and H.L.; validation, X.Z.; investigation, Y.X., H.L. and X.Z.; data curation, H.L.; writing—original draft preparation, Y.X. and H.L.; writing—review and editing, D.C.; visualization, X.Z.; supervision, D.C.; project administration, D.C. All authors have read and agreed to the published version of the manuscript.

Funding

This research was supported by the Science and technology research project pooled fund of Henan province (No. 242103810087) and the National Natural Science Foundation of China (No. 31801512).

Institutional Review Board Statement

This article does not contain any studies with human participants or animals performed by any of the authors.

Data Availability Statement

All data generated or analyzed during this study are included in this published article and its Supplementary Material Files.

Conflicts of Interest

The authors declare no competing financial interest.

References

  1. He, S.S.; Liu, X.; Wang, Y.L.; Xie, J.H.; Gao, H.; Li, X.J.; Huang, Z.B. Metabolomics analysis based on UHPLC-Q-TOF-MS/MS reveals effects of genistein on reducing mycotoxin citrinin production by Monascus aurantiacus Li AS3.4384. LWT-Food Sci. Technol. 2020, 130, 109613. [Google Scholar] [CrossRef]
  2. Feng, Y.L.; Shao, Y.C.; Zhou, Y.X.; Chen, W.P.; Chen, F.S. Monascus pigments. Appl. Microbiol. Biotechnol. 2012, 96, 1421–1440. [Google Scholar] [CrossRef] [PubMed]
  3. Shi, J.; Qin, X.L.; Zhao, Y.R.; Sun, X.X.; Yu, X.; Feng, Y.L. Strategies to enhance the production efficiency of Monascus pigments and control citrinin contamination. Process Biochem. 2022, 117, 19–29. [Google Scholar] [CrossRef]
  4. Koli, S.H.; Suryawanshi, R.K.; Mohite, B.V.; Patil, S.V. Prospective of Monascus pigments as an additive to commercial sunscreens. Nat. Prod. Commun. 2019, 14, 1–7. [Google Scholar] [CrossRef]
  5. Lee, C.L.; Wen, J.Y.; Hsu, Y.W.; Pan, T.M. The blood lipid regulation of Monascus-produced monascin and ankaflavin via the suppression of low-density lipoprotein cholesterol assembly and stimulation of apolipoprotein A1 expression in the liver. J. Microbiol. Immunol. Infect. 2018, 51, 27–37. [Google Scholar] [CrossRef]
  6. Akihisa, T.; Tokuda, H.; Ukiya, M.; Kiyota, A.; Yasukawa, K.; Sakamoto, N.; Kimura, Y.; Suzuki, T.; Takayasu, J.; Nishino, H. Anti-tumor-initiating effects of Monascin, an azaphilonoid pigment from the extract of Monascus pilosus fermented rice (red-mold rice). Chem. Biodivers. 2005, 2, 1305–1309. [Google Scholar] [CrossRef]
  7. Hsu, L.C.; Hsu, Y.W.; Liang, Y.H.; Liaw, C.C.; Kuo, Y.H.; Pan, T.M. Induction of apoptosis in human breast adenocarcinoma cells MCF-7 by Monapurpyridine A, a new azaphilone derivative from Monascus purpureus NTU 568. Molecules 2012, 17, 664–673. [Google Scholar] [CrossRef]
  8. Meinicke, R.M.; Vendruscolo, F.; Moritz, D.E.; Oliveira, D.D.; Schmidell, W.; Samohyl, R.W.; Ninow, J.L. Potential use of glycerol as substrate for the production of red pigments by Monascus ruber in submerged fermentation. Biocatal. Agric. Biotechnol. 2012, 1, 238–242. [Google Scholar] [CrossRef]
  9. Guo, X.Y.; Atehli, D.; Chen, M.H.; Chen, D.; Wang, Y.R. A Zn (II)(2) Cys (6) transcription factor MPsGeI suppresses pigment biosynthesis in Monascus. Int. J. Biol. Macromol. 2023, 233, 123504. [Google Scholar] [CrossRef]
  10. Terán Hilares, R.; De Souza, R.A.; Marcelino, P.F.; Da Silva, S.S.; Dragone, G.; Mussatto, S.I.; Santos, J.C. Sugarcane bagasse hydrolysate as a potential feedstock for red pigment production by Monascus ruber. Food Chem. 2018, 245, 786–791. [Google Scholar] [CrossRef]
  11. Silbir, S.; Goksungur, Y. Natural red pigment production by Monascus purpureus in submerged fermentation systems using a food industry waste: Brewer’s spent grain. Foods 2019, 8, 161. [Google Scholar] [CrossRef] [PubMed]
  12. Kantifedaki, A.; Kachrimanidou, V.; Mallouchos, A.; Papanikolaou, S.; Koutinas, A.A. Orange processing waste valorisation for the production of bio-based pigments using the fungal strains Monascus purpureus and Penicillium purpurogenum. J. Cleaner. Prod. 2018, 185, 882–890. [Google Scholar] [CrossRef]
  13. ElSayed, E.S.R.; Gach, J.; Olejniczak, T.; Boratyński, F. A new endophyte Monascus ruber SRZ112 as an efficient production platform of natural pigments using agro-industrial wastes. Sci. Rep. 2022, 12, 12611. [Google Scholar] [CrossRef] [PubMed]
  14. Asghari, M.; Jahadi, M.; Hesam, F.; GhasemiSepro, N. Optimization of Monascus pigment production on date waste substrates using solid state fermentation. Appl. Food Biotechnol. 2021, 8, 247–254. [Google Scholar]
  15. Arslan, N.P.; Yazici, A.; Komesli, S.; Esim, N.; Ortucu, S. Direct conversion of waste loquat kernels to pigments using Monascus purpureus ATCC16365 with proteolytic and amylolytic activity. Biomass Convers. Biorefin. 2021, 11, 2191–2199. [Google Scholar] [CrossRef]
  16. Zhang, S.; Zhao, W.; Nkechi, O.; Lu, P.X.; Bai, J.; Lin, Q.L.; Liu, J. Utilization of low-cost agricultural by product rice husk for Monascus pigments production via submerged batch-fermentation. J. Sci. Food Agric. 2022, 102, 2454–2463. [Google Scholar] [CrossRef]
  17. Liu, J.; Luo, Y.C.; Guo, T.; Tang, C.G.; Chai, X.Y.; Zhao, W.; Bai, J.; Lin, Q.L. Cost-effective pigment production by Monascus purpureus using rice straw hydrolysate as substrate in submerged fermentation. J. Biosci. Bioeng. 2020, 129, 229–236. [Google Scholar] [CrossRef]
  18. Chen, X.J.; Chen, M.M.; Wu, X.F.; Li, X.J. Cost-effective process for the production of Monascus pigments using potato pomace as carbon source by fed-batch submerged fermentation. Food Sci. Nutr. 2021, 9, 5415–5427. [Google Scholar] [CrossRef]
  19. Pourali, O.; Asghari, F.S.; Yoshida, H. Production of phenolic compounds from rice bran biomass under subcritical water conditions. Chem. Eng. J. 2010, 160, 259–266. [Google Scholar] [CrossRef]
  20. Sharif, M.K.; Butt, M.S.; Anjum, F.M.; Khan, S.H. Rice bran: A novel functional ingredient. Crit. Rev. Food Sci. Nutr. 2014, 54, 807–816. [Google Scholar] [CrossRef]
  21. Xu, Z.M.; Godber, J.S. Purification and identification of components of γ-oryzanol in rice bran oil. J. Agric. Food. Chem. 1999, 47, 2724–2728. [Google Scholar] [CrossRef]
  22. Cao, T.C.; Nguyen, T.P.; Nguyen, S.N.; Tran, T.T.T.; Ton, N.M.N.; Le, V.V.M. Cellulase-treated deoiled rice bran: Effects of treatment conditions on dietary fiber content and utilization for formulation of cookies. J. Food Meas. Charact. 2022, 16, 840–848. [Google Scholar] [CrossRef]
  23. Gong, P.F.; Shi, R.Y.; Liu, Y.T.; Luo, Q.Q.; Wang, C.G.; Chen, W. Recent advances in Monascus pigments produced by Monascus purpureus: Biosynthesis, fermentation, function, and application. Lwt-Food Sci. Technol. 2023, 185, 115162. [Google Scholar] [CrossRef]
  24. Li, L.; Zhu, L.; Liu, X.; Guo, H.; Huang, N.; Wang, Z.; Dai, L. Multiomics comparative analysis reveals the role of carbon metabolism in enhancing monascin and ankaflavin production in Monascus purpureus. Ind. Crop. Prod. 2025, 228, 120938. [Google Scholar] [CrossRef]
  25. Qin, X.; Han, H.; Zhang, J.; Xie, B.; Zhang, Y.; Liu, J.; Dong, W.; Hu, Y.; Yu, X.; Feng, Y. Transcriptomic and metabolomic analyses of soybean protein isolate on Monascus pigments and Monacolin K production. J. Fungi. 2024, 10, 500. [Google Scholar] [CrossRef] [PubMed]
  26. Joyce, A.P.; Leung, S.S. Use of response surface methods and path of steepest ascent to optimize ligand-binding assay sensitivity. J. Immunol. Methods. 2023, 392, 12–23. [Google Scholar] [CrossRef]
  27. Lee, D.; Kim, S.; Byun, J. A method of steepest ascent for multiresponse surface optimization using a desirability function method. Qual. Reliab. Eng. lnt. 2020, 36, 1931–1948. [Google Scholar] [CrossRef]
  28. Chen, D.; Li, H. Mannitol improves Monascus pigment biosynthesis with rice bran as a substrate in Monascus purpureus. Front. Microbiol. 2023, 14, 1300461. [Google Scholar] [CrossRef]
  29. Shi, R.; Luo, Q.; Liu, Y.; Chen, W.; Wang, C. Effect of γ-heptalactone on the morphology and production of Monascus pigments and Monacolin K in Monascus purpureus. J. Fungi. 2022, 8, 179. [Google Scholar] [CrossRef]
  30. Zhang, J.; Gao, J.; Li, M.; Shao, Y.; Chen, F. MrGcn5 is required for the mycotoxin production, sexual and asexual development in Monascus ruber. Food Biosci. 2021, 43, 101304. [Google Scholar] [CrossRef]
  31. Zeng, H.W.; Wang, C.T.; Qiao, J.; Zhang, B.J.; Zhao, B.; Dai, C.Y. Determining a suitable carbon source for the production of intracellular pigments from Monascus purpureus HBSD 08. Pigment. Resin. Technol. 2019, 48, 547–554. [Google Scholar]
  32. Moussa, S.; Abdou, D.; Mohamed, G.A.; Abo-El-Seoud, M.A.; Karam Eldin, A.Z.A.; El-mehalawy, A.A. Production of red pigment by Monascus purpureus Nrrl 1992 under submerged and solid-state fermentation. Egypt. J. Microbiol. 2018, 53, 83–94. [Google Scholar]
  33. Omamor, I.B.; Eziashi, E.I.; Adekunle, A.A. Carbon nutrition in relation to growth of three Monascus species isolated from decaying date fruits. Afr. J. Microbiol. Res. 2008, 2, 153–155. [Google Scholar]
  34. Lima, A.G.; Dantas, L.A.; Egea, M.B. Mannitol-based media and static pH are efficient conditions for red pigment production from Monascus purpureus ATCC 36928 in submerged culture. Processes 2023, 11, 633. [Google Scholar] [CrossRef]
  35. Da Silva, M.F.; Flaibam, B.; De Mélo, A.H.F.; Sampaio, U.; Clerici, M.T.P.S.; Goldbeck, R. Optimization of enzymatic hydrolysis of cellulose extracted from bamboo culm for bioethanol production by Saccharomyces cerevisiae modified via CRISPR/Cas9. Food Res. Int. 2024, 192, 114768. [Google Scholar] [CrossRef] [PubMed]
  36. Chavan, S.; Gaikwad, A. Optimization of enzymatic hydrolysis of bamboo biomass for enhanced saccharification of cellulose through taguchi orthogonal design. J. Environ. Chem. Eng. 2021, 9, 104807. [Google Scholar] [CrossRef]
  37. Ruan, L.G.; Wu, H.F.; Wu, S.Y.; Zhou, L.F.; Wu, S.X.; Shang, C.H. Optimizing the conditions of pretreatment and enzymatic hydrolysis of sugarcane bagasse for bioethanol production. ACS Omega 2024, 9, 29566–29575. [Google Scholar] [CrossRef]
  38. Dashtban, M.; Maki, M.; Leung, K.T.; Mao, C.; Qin, W. Cellulase activities in biomass conversion: Measurement methods and comparison. Crit. Rev. Biotechnol. 2010, 30, 302–309. [Google Scholar] [CrossRef]
  39. Abdel-Raheam, H.E.F.; Alrumman, S.A.; Gadow, S.I.; El-Sayed, M.H.; Hikal, D.M.; Hesham, A.E.L.; Ali, M.M.A. Optimization of Monascus purpureus for natural food pigments production on potato wastes and their application in ice lolly. Front. Microbiol. 2022, 13, 862080. [Google Scholar] [CrossRef]
  40. Chen, D.; Xue, Y.; Chen, M.H.; Li, Z.J.; Wang, C.L. Optimization of submerged fermentation medium for citrinin-free monascin production by Monascus. Prep. Biochem. Biotechnol. 2016, 46, 772–779. [Google Scholar] [CrossRef]
  41. Yang, S.Z.; Huang, Z.F.; Liu, H.Q.; Hu, X.; Wu, Z.Q. Improving mycelial morphology and adherent growth as well as metabolism of Monascus yellow pigments using nitrate resources. Appl. Microbiol. Biotechnol. 2020, 104, 9607–9617. [Google Scholar] [CrossRef]
  42. Li, T.; Zhao, W.Q.; Wang, C.T.; Shi, K.; Chen, G. Regulated synthesis and metabolism of Monascus pigments in a unique environment. World J. Microbiol. Biotechnol. 2023, 39, 16129. [Google Scholar] [CrossRef]
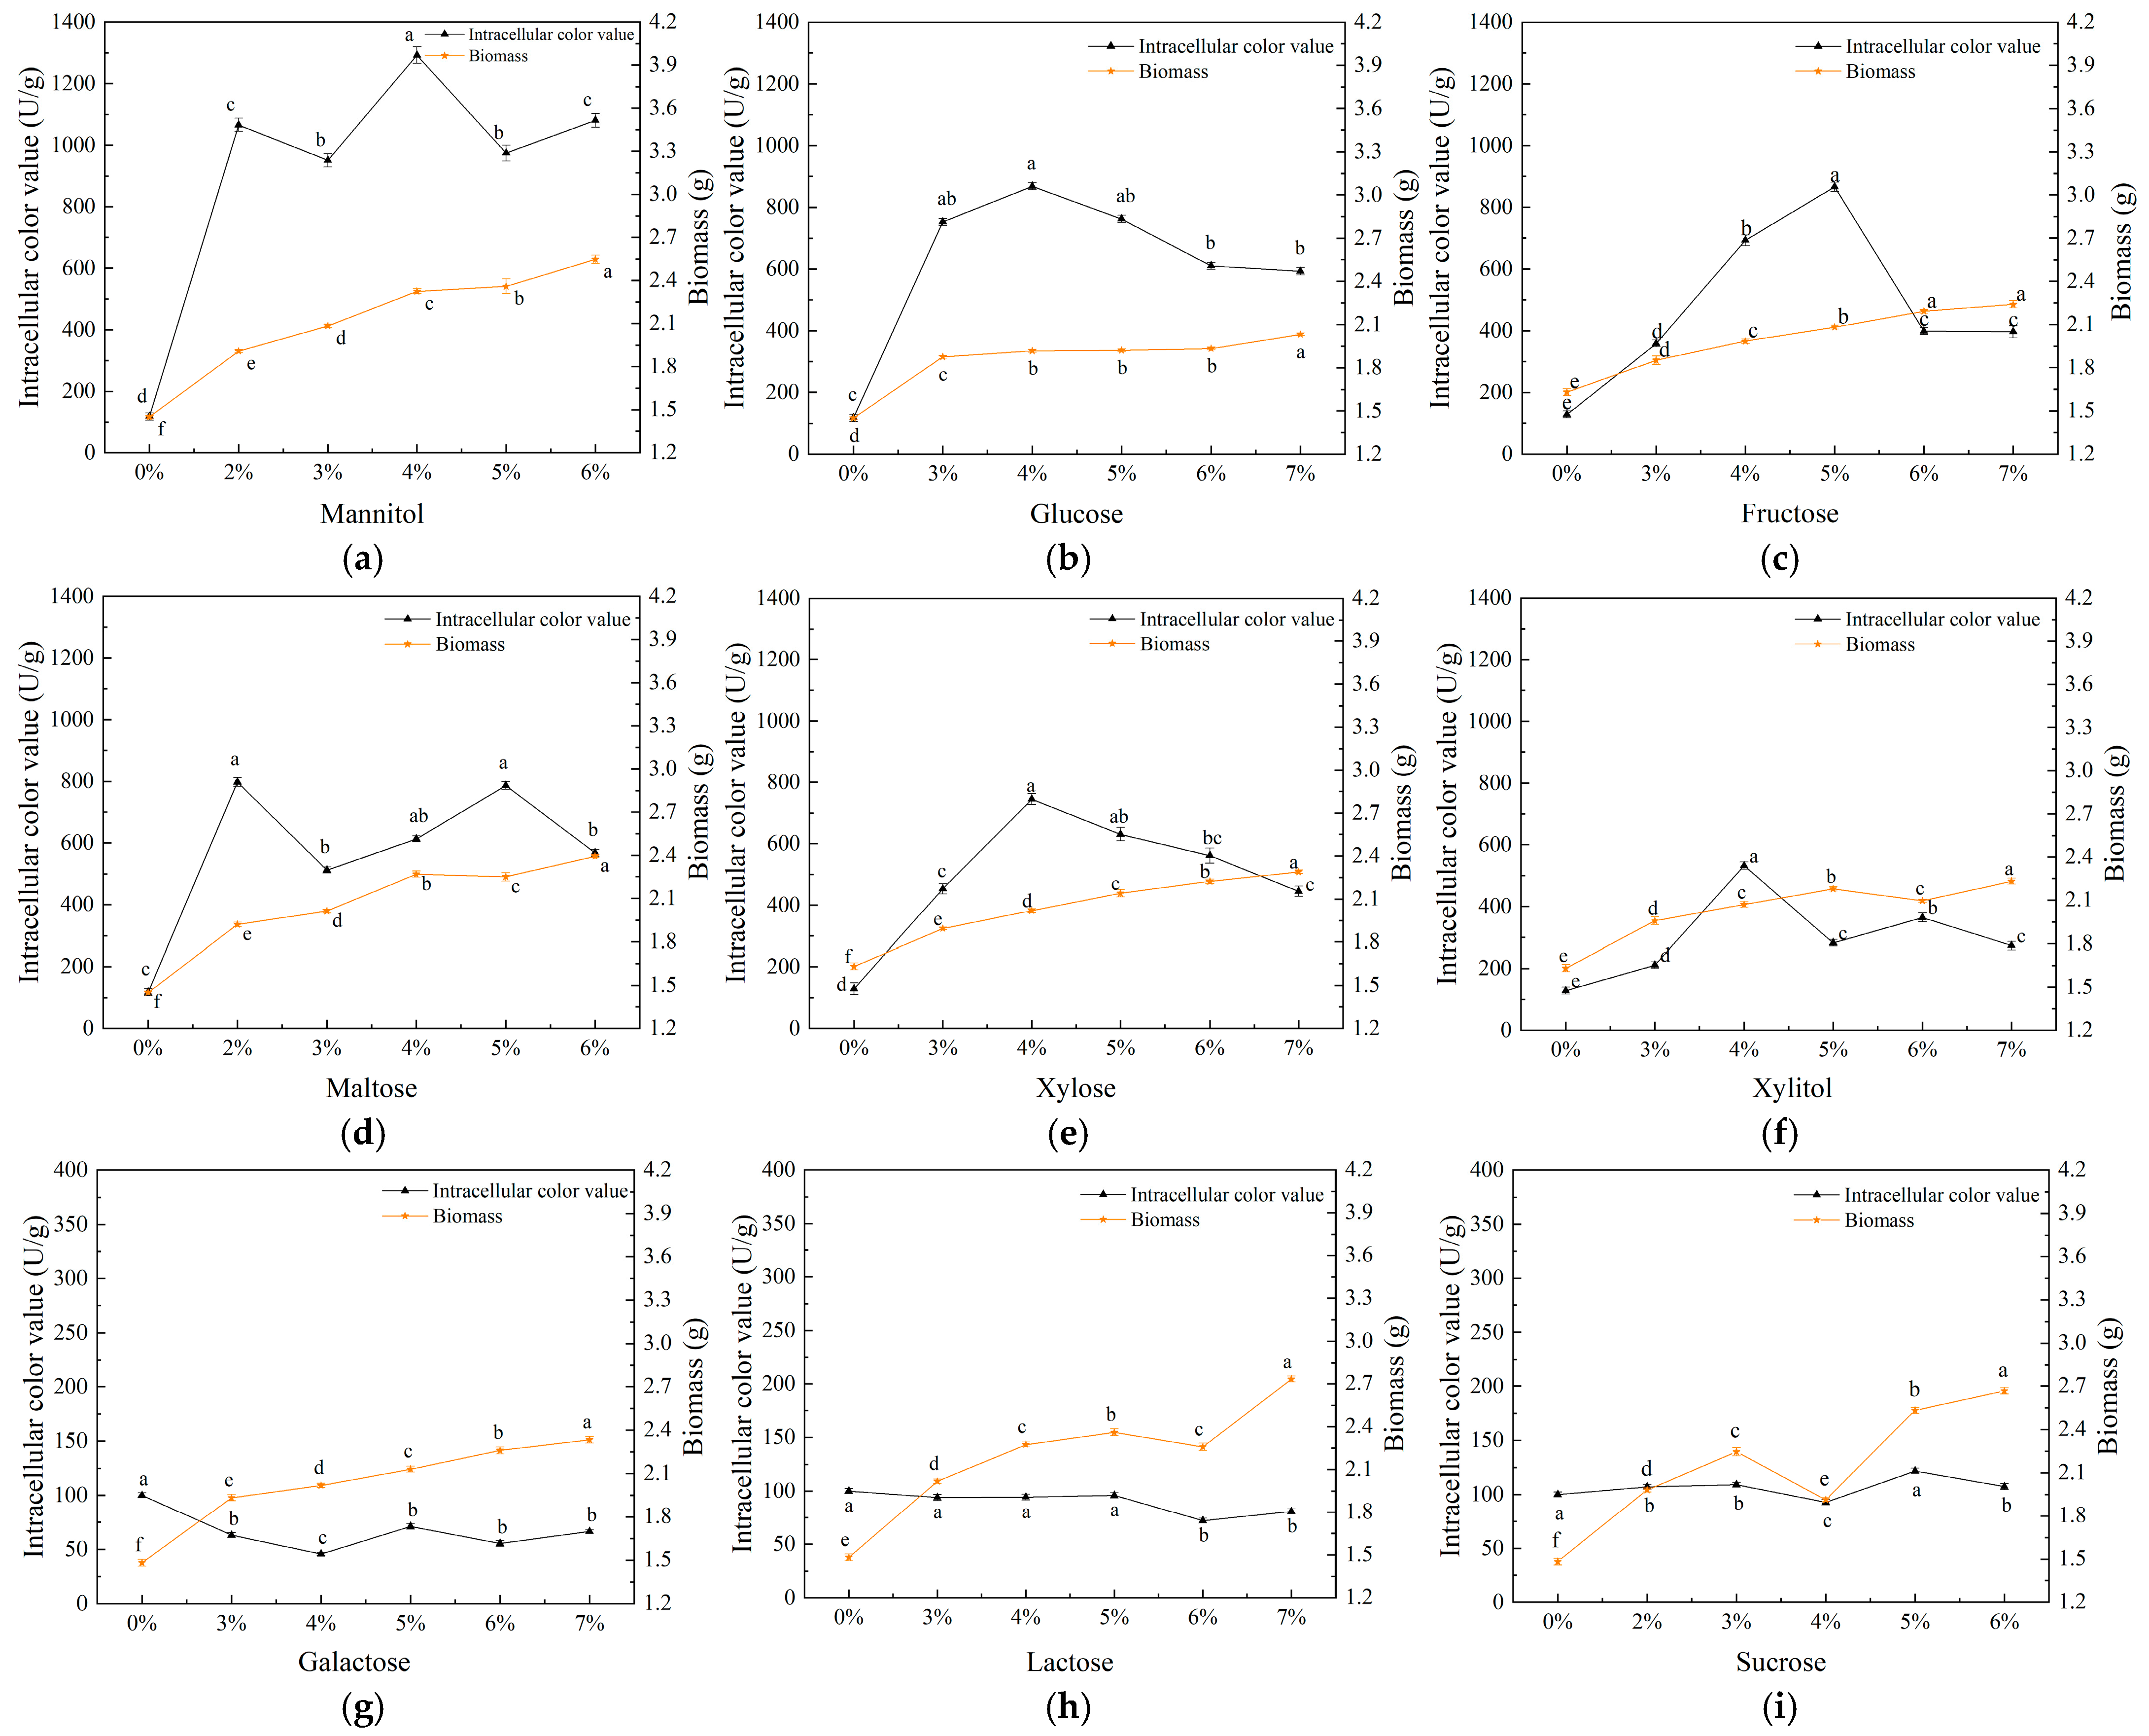
Figure 1. Effect of mannitol (a), glucose (b), fructose (c), maltose (d), xylose (e), xylitol (f), galactose (g), lactose (h), and sucrose (i) on the biomass and intracellular color value of Monascus purpureus M9. Different lowercase letters (a, b, c, d, e, and f) in the figure indicate a statistically significant difference (p < 0.05).
Fermentation 11 00505 g001
Figure 2. Effect of cellulase additive amount (a), enzymatic hydrolysis time (b), and enzymatic hydrolysis temperature (c) on the biomass and intracellular color value of Monascus purpureus M9. Different lowercase letters (a, b, c, d, e, and f) in the figure indicate a statistically significant difference (p < 0.05).
Fermentation 11 00505 g002
Figure 3. Response surface plots showing the effects of mannitol additive amount, enzymatic hydrolysis temperature, and enzymatic hydrolysis time on color value. Effect of the interaction between mannitol additive amount and enzymatic hydrolysis temperature (a,b). Effect of the interaction between enzymatic hydrolysis temperature and enzymatic hydrolysis time (c,d). Effect of the interaction between mannitoladditive amount and enzymatic hydrolysis time (e,f).
Fermentation 11 00505 g003aFermentation 11 00505 g003b
Figure 4. Effects of different culture conditions on the concentration and constituent of MPs and the content of citrinin (CIT) in M. purpureus M9. Color values of MPs in different culture conditions (a). HPLC analysis of intracellular pigments under different culture conditions (b). The yields of the six classical MPs (R1: Monascorubramine; R2: Rubropunctamine; Y1: Monascin; Y2: Ankaflavin; O1: Monascorubrin; and O2: Rubropunctatin) were assessed by relative peak areas provided by HPLC under cellulase hydrolyzed rice bran (Cel) (c), rice bran supplemented with mannitol (Man) (d), mannitol supplementation combined with cellulase pretreatment of the substrate (Opti) (e), and only rice (Rice) (f) culture conditions compared with the only rice bran condition (RB). The yields of CIT in different culture conditions (g).
Fermentation 11 00505 g004aFermentation 11 00505 g004b
Figure 5. Colony phenotype of M. purpureus M9 grown with different culture conditions at 28 °C on the 7th day.
Fermentation 11 00505 g005
Figure 6. The spore morphology including asexual (a) and sexual (b) reproduction of M. purpureus M9 grown with different culture conditions at 28 °C on the 4th day.
Fermentation 11 00505 g006
Figure 7. Effects of different culture conditions on growth and development in M. purpureus M9. Strains were grown on different culture conditions at 28 °C from 3 days to 7 days. Biomass was weighed from 3 days to 7 days (a). The colony diameter was measured using a vernier caliper from 3 days to 7 days (b). The number of conidia (c) and cleistothecia (d) were determined by a hemacytometer.
Fermentation 11 00505 g007
Figure 8. SEM images of mycelial morphologies of M. purpureus M9 incubated for 7 days in different culture conditions were obtained at 2400- and 5000-times magnification.
Fermentation 11 00505 g008
Table 1. Steepest ascent experiment design and results.
CountEnzymatic Hydrolysis TemperatureMannitol Additive AmountEnzymatic Hydrolysis TimeColor Value (U/g)
140 °C2%1.0 h1398
250 °C3%1.5 h2475
360 °C4%2.0 h3575
470 °C5%2.5 h3000
580 °C6%3.0 h2705
Table 2. Response surface design and results.
RunA:
Enzymatic Hydrolysis Temperature (°C)
B:
Mannitol Additive Amount (%)
C:
Enzymatic Hydrolysis Time (hour)
Color Value
(U/g)
16042.03575
25041.53175
36051.53325
46042.03540
56042.03505
66052.52625
76031.52285
87032.02250
96042.03590
107042.52705
115052.03190
126032.52410
135042.52625
147041.53000
156042.03500
167052.02925
175032.02440
Table 3. ANOVA results of color value’ regression model.
SourceSum of SquaresDfMean SquareF-Valuep-ValueSignificant
Model3,715,000.009412,800.0081.50<0.0001**
A37,812.50137,812.507.470.0009**
B897,800.001897,800.00177.26<0.0001**
C252,100.001252,100.0049.760.0002**
AB1406.2511406.250.280.6145N
AC16,256.25116,256.253.210.1163N
BC170,200.001170,200.0033.590.0007**
AA412,200.001412,200.0081.38<0.0001**
BB1,173,000.0011,173,000.00231.64<0.0001**
CC524,300.001524,300.00103.51<0.0001**
Residual35,455.0075065.00
Lack of Fit28,925.0039641.675.910.0596N
Pure Error6530.0041632.50
Cor Total3,750,000.0016
Note: ** highly significant effect (p < 0.01); N: “non-significant” (p > 0.05). A: Enzymatic hydrolysis temperature; B: Mannitol additive amount; C: Enzymatic hydrolysis time. Df: Degrees of freedom.
Disclaimer/Publisher’s Note: The statements, opinions and data contained in all publications are solely those of the individual author(s) and contributor(s) and not of MDPI and/or the editor(s). MDPI and/or the editor(s) disclaim responsibility for any injury to people or property resulting from any ideas, methods, instructions or products referred to in the content.