Article

Metabolomic Profiling Reveals Dynamic Changes in Organic Acids During Zaolajiao Fermentation: Correlation with Physicochemical Properties and CAZymes

1
Chili Pepper Research Institute, Guizhou Academy of Agricultural Sciences, Guiyang 550006, China
2
State Key Laboratory of Discovery and Utilization of Functional Components in Traditional Chinese Medicine, Natural Products Research Center of Guizhou Province, Guizhou Medical University, Guiyang 550014, China
*
Authors to whom correspondence should be addressed.
Fermentation 2025, 11(8), 479; https://doi.org/10.3390/fermentation11080479
Submission received: 28 July 2025 / Revised: 14 August 2025 / Accepted: 18 August 2025 / Published: 20 August 2025
(This article belongs to the Section Fermentation for Food and Beverages)

Abstract

Zaolajiao (ZLJ) is a traditional national specialty fermented condiment in Guizhou, and organic acid is one of its main flavor substances. In the study, we used metabolomics and multivariate analysis to identify differential organic acids (DOAs) during ZLJ fermentation and explored their correlations with physicochemical indices and CAZymes. Eight DOAs were detected, with citric acid prominent early and lactic acid dominant late in fermentation. Citric acid exhibited a highly significant negative correlation (p < 0.01, |r| > 0.955) with AA3, GT4, and CE1, while showing significant positive correlation (p < 0.05) with GH1, soluble sugars, and total acids. Lactic acid exhibited a highly significant positive correlation with total acid, AA3, and GT4 (p < 0.05, |r| > 0.955). Conversely, it showed a significant negative correlation with soluble sugar (p < 0.05) and a highly significant negative correlation with GH1 (p < 0.05, |r| > 0.955). The most significant metabolic pathway for DOAs enrichment was the citrate cycle (TCA cycle).

1. Introduction

Chili pepper (Capsicum annuum L.), as a nutritious crop in the Solanaceae family, is rich in a variety of bioactive components [1]. Guizhou Province, being a core production and consumption area for chili peppers in China [2], has its traditional fermented product, Zaolajiao (ZLJ), occupying an important position in the condiment market. The fermentation process not only extends the shelf life of the product but also endows it with physiological functions such as lowering blood lipid levels and inhibiting fat accumulation [3]. Organic acids, as key components of flavor, play a decisive role in the quality of ZLJ by regulating acidity, inhibiting harmful bacteria, and prolonging shelf life [4]. Therefore, elucidating the variation patterns of organic acids during ZLJ fermentation and their correlation with process conditions is of great theoretical and practical significance for optimizing production and developing new products.
As a pivotal determinant of consumer acceptance, flavor primarily originates from the microbial metabolism of macromolecules such as proteins and carbohydrates [5]. During this process, microbial metabolic activities generate key flavor compounds, including organic acids, amino acids, and esters [6]. Recent studies have further unveiled the unique roles of specific microorganisms in flavor formation. For instance, Pichia spp. significantly enhance the production of characteristic flavor acids such as L-glutamic acid, γ-aminobutyric acid (GABA), and succinic acid by activating genes associated with amino acid metabolism [7,8]. The synthesis of organic acids mainly relies on the tricarboxylic acid cycle (TCA) and amino acid transformation, such as the decarboxylation of glutamic acid to produce GABA. This process not only endows the product with a unique flavor but also confers health benefits [9]. Moreover, the interaction between microorganisms also significantly impacts flavor. The interaction between lactic acid bacteria and yeast promotes the synthesis of lactic acid and citric acid and optimizes the texture of the product [8].
Present studies have predominantly centered on the bacterial community dynamics in fermented chili peppers [10], the correlation between microorganisms and aroma [11,12,13], and the influence of raw material factors on product quality [14,15]. However, a comprehensive elucidation of the temporal patterns of organic acids throughout the fermentation process, the identification of differential organic acids (DOAs), and the correlation mechanisms between these acids and physicochemical parameters, as well as carbohydrate-active enzymes (CAZymes), remains elusive. This knowledge gap hampers the precise modulation of fermentation flavor and the optimization of the fermentation process.
To address this, the current study takes Guizhou Zaolajiao (a type of fermented chili pepper) as the research subject. By integrating multi-omics approaches, we employed an electronic nose to analyze the dynamics of volatile compounds, monitored the physicochemical parameters during fermentation, and quantified 26 organic acids using high-performance liquid chromatography–mass spectrometry (HPLC-MS). Through multivariate statistical analysis, we identified DOAs at each fermentation stage and elucidated the correlation networks between these acids and physicochemical parameters as well as CAZymes. The overarching goal is to elucidate the molecular mechanisms underlying organic acid metabolism in ZLJ, thereby providing a theoretical foundation for targeted fermentation process control and product quality enhancement.

2. Materials and Methods

2.1. Sample Collection

The raw materials for ZLJ production were mature, red, mold-free line peppers from Guizhou Province. After cleaning, drying, and chopping into (0.6–1) cm × (0.6–1) cm pieces, traditional ZLJ production began with 10% edible salt, 2% ginger, and 2% garlic. The mixture was packed into an earthenware jar up to 3/4 full, covered, and sealed with water for fermentation at room temperature. Samples (150 g) were taken on days 0, 15, 45, 90, and 180 using a multi-point method from three jars, named ZLJ0d to ZLJ180d. Stored in sterile bags, volatile compounds were analyzed by an electronic nose. The remaining samples were kept at −80 °C for physicochemical and organic acid analyses.

2.2. E-Nose Analysis

The aroma profile of ZLJ was analyzed using a PEN3 E-nose (WinMuster Airsense Analytics Inc., Schwerin, Germany) with 10 metal oxide gas sensors (Table 1). The methodology reported previously [16,17] was used in this study with minor adjustments. A total of 5.00 g of ZLJ was accurately weighed and sealed in a 20 mL headspace vial and allowed to stand at 30 °C for 30 min, after which the headspace volatiles were pumped into the sensor chamber at a rate of 400 mL/min for detection. The data acquisition interval of the electronic nose was 1 s, auto-zeroing time 10 s, measurement time 210 s, and cleaning time 120 s.

2.3. Total Acid and Amino Acid Nitrogen Assays

The pretreatment method was as follows: Exactly 10.0 g of the sample was homogenized with 90.0 mL of deionized water and extracted at 80 °C for 1 h. After cooling to below 30 °C, the extract was centrifuged at 10,000 rpm for 10 min to obtain a clear supernatant. For total acidity analysis, 10 mL of filtrate was diluted with 60 mL of distilled water in a 250 mL beaker and potentiometrically titrated with 0.05 M NaOH (Guangzhou He Wei Medical Technology Co., Ltd., Guangzhou, China) to pH 8.2. Amino acid nitrogen content was determined by adding 10 mL formaldehyde to the titrated solution, followed by continuation of titration to pH 9.2. The difference in NaOH consumption between the two titration endpoints was used for calculation [18].

2.4. Soluble Sugar and CAZymes Assay

In this investigation, soluble sugar content was determined by anthrone colorimetry, following the method in “Guidelines for Postharvest Physiology and Biochemistry Experiments on Fruits and Vegetables” with minor modifications. Briefly, 0.2 g of crushed sample was weighed, mixed with 8 mL of distilled water, and boiled for 30 min. After cooling, the volume was adjusted to 10 mL, centrifuged at 6000 rpm for 10 min, and 200 μL of supernatant was transferred to a 25 mL test tube. In total, 1.8 mL of distilled water, 0.5 mL of ethyl anthrone acetate reagent, and 5 mL of concentrated sulfuric acid were added, mixed well, and heated in boiling water for 1 min. The absorbance was measured at 630 nm using a spectrophotometer (Evolution 201, Thermo Fisher Scientific Inc., Waltham, MA, USA), and the soluble sugar content was calculated using a sucrose standard curve.
The gene set was obtained via metagenomic sequencing. Subsequently, the gene set was aligned against the CAZy database for comparative analysis, thereby acquiring the annotation information of CAZymes. The abundance of CAZymes was then calculated based on the abundance of the gene set.

2.5. Targeted Quantification of Organic Acids (OAs)

2.5.1. Sample Handling

Adopting a slightly modified method from previous studies [19], 0.1 g ZLJ was extracted with 1 mL methanol/chloroform (7:3, v/v), incubated on ice for 30 min, and centrifuged at 12,000 rpm for 10 min at 4 °C after adding 0.6 mL water. The supernatant was collected, combined from two extractions, and diluted. A total of 40 μL was reacted with 10 μL each of 0.1 M 1-(3-dimethylaminopropyl)-3-ethylcarbodiimide hydrochloride and 3-nitrophenylhydrazine (AR, Solarbio, Beijing, China), incubated at 40 °C for 30 min, and filtered through a 0.22 μm membrane. The filtrate was analyzed by UPLC (Vanquish, Thermo Fisher Scientific Inc., Waltham, MA, USA) and HRMS (Q Exactive, Thermo Fisher Scientific Inc., Waltham, MA, USA) on a Waters BEH C18 column (50 × 2.1 mm, 1.8 μm) using external standards (quinic, lactic, propionic, isobutyric, butyric, malic acids, and 20 other standards; Sigma-Aldrich, St. Louis, MO, USA) for quantification.

2.5.2. Organic Acid Detection

Liquid Phase Conditions: Mobile phase A—0.1% formic acid in water; B—0.1% formic acid in acetonitrile. Flow rate—0.35 mL/min. Column temperature—40 °C. Injection volume—2 μL. Elution—0–2 min, 90:10 (A:B); 12–14 min, 10:90; and 14.1–16 min, 90:10. Analysis at 4 °C. Samples randomized to avoid signal fluctuations. QC samples monitored system stability.
Mass Spectrometry Parameters: Q Exactive HRMS with ESI source. Settings—40 arb sheath gas, 10 arb auxiliary gas, −2800 V ion spray voltage, 350 °C temperature, and 320 °C ion transfer tube temperature. Scan mode—Fullms-ddMS2, negative ionization. Scan range—120–1500 m/z.

2.5.3. The Calculation of Taste Activity Value (TAV)

The taste activity value (TAV) of an organic acid was calculated as follows: TAV = organic acid concentration/taste threshold. An organic acid was considered to contribute significantly to flavor when TAV ≥ 1 and was thus identified as a key flavor-contributing organic acid. Moreover, a higher TAV indicates a more pronounced contribution to taste perception [12].

2.6. Statistical Analysis

To ensure reliability and accuracy, all the experiments were replicated three times. Principal component analysis (PCA), orthogonal partial least squares-discriminant analysis (OPLS-DA), and volcano plots were generated using SIMCA 14.1 software. For targeted metabolomics, DOA screening criteria were VIP ≥ 1, p < 0.05, and FC ≤ 0.5 or ≥ 2 based on previous studies [20]. Statistical analysis and ANOVA were performed using SPSS (v19.0), with the results expressed as mean ± SD. Plots were generated using ChiPlot (https://www.chiplot.online/, accessed on 27 July 2025) and OriginPro (v21). The CCA plot was generated using the Canoco 5 software. Cytoscape (3.6.0) was used for network visualization, and differential metabolite enrichment analysis was conducted on MetaboAnalyst 3.5.

3. Results and Discussion

3.1. Analysis of E-Nose

Principal component analysis (PCA) is an unsupervised method for explaining sample differences and extracting key variable information [21]. Figure 1A shows that the first two principal components of the E-nose PCA had a cumulative variance contribution of 98.59% (>85%), indicating reliable results for analyzing the volatile information of the ZLJ samples. ZLJ0d was highly separated from the other groups, especially from the late fermentation samples, suggesting that pre-fermentation ZLJ (0–45 d) have similar flavor profiles, with differences increasing as fermentation progresses.
The E-nose sensors are highly sensitive to sample odors, with minor changes in volatile compounds leading to distinct sensor responses [16,17]. In Figure 1B, the responses of the 10 sensors to the ZLJ samples with varying fermentation times are shown, with W1S and W2S sensors exhibiting higher responses. Notably, W2S showed significant differences among the samples (p < 0.05) (Figure 1C), indicating substantial changes in alcohols, aldehydes, and ketones during fermentation, which likely contribute more to the odor changes in ZLJ than other compounds. ZLJ90d had the highest W1S response, suggesting high alkane content, while its high W1W response indicated significant organic sulfides, possibly due to their low odor threshold [22]. W1S response did not significantly change in ZLJ0d and ZLJ45d but varied significantly (p < 0.05) among other fermentation stages (45–180 d), indicating substantial alkane changes in mid-to-late fermentation stages. ZLJ180d had the highest W1S response, implying rich alkane compounds. W1C response values were significantly different (p < 0.05) across all the samples, indicating significant variations in benzene aromatic substances.

3.2. Physical and Chemical Properties Profiling of the Samples

Total acids, organic acids, and sugars are key indicators of ZLJ quality during fermentation and are closely interrelated [23]. As shown in Figure 2A, total acid content increased with fermentation time, likely due to microbial metabolites [21]. Acidity formation is mainly from microbial metabolism of carbohydrates, proteins, and starches, leading to continuous accumulation of acids. Soluble sugars decreased over fermentation time (Figure 2A), consistent with previous studies [24], attributed to increased microbial consumption of substrates [25]. Amino acid nitrogen, a flavor indicator, increased during the first 90 days of fermentation and then decreased (Figure 2B). This is related to protease-promoted proteolysis [26,27]. Microorganisms like lactic acid bacteria and fungi hydrolyze proteins into bioactive peptides and amino acids, significantly increasing amino acid nitrogen content, especially for glutamic acid, lysine, and proline [28]. Key microorganisms such as Rhizopus oligosporus, Mucor, Saccharomyces cerevisiae, and Lactobacillus bulgaricus produce proteases and other enzymes, promoting soluble protein and amino acid nitrogen formation [29,30]. Bacillus subtilis was found to efficiently synthesize citrulline during fermentation, significantly increasing amino acid nitrogen content, highlighting microbial metabolism’s role in its accumulation [31].

3.3. Analysis of Changes in Organic Acids During Fermentation of Zaolajiao

Organic acids, primarily produced by homogeneous and heterogeneous fermentation, are crucial indicators in vegetable fermentation. They inhibit pathogenic microbes, ensuring product safety, and influence flavor [32]. These acids also offer health benefits like antioxidant properties and gut flora regulation [33]. In ZLJ fermentation, we analyzed 26 organic acids (Table S1). Citric acid dominated at 0 d, 15 d, and 45 d (Figure 3A), comprising 67.72%, 65.89%, and 49.32% of the total acids, respectively. Its low threshold and high taste activity values (TAVs) (59.74, 57.66, 52.39) highlight its significant contribution to ZLJ flavor at these stages [12]. Citric acid, a primary carbon source for microbes like lactic acid bacteria and yeasts, decreases with fermentation time, being 333.59 times higher at 0 d than at 180 d. Lactic acid became the main acid in later stages (90–180 d), accounting for 77.85% and 80.30% of the total acids at ZLJ90d and ZLJ180d, respectively. Its TAVs (154, 156) indicate its role as a key flavor compound in these stages [12]. Lactic acid levels increased 2481.94 times from 0 d to 180 d, aligning with previous reports [34], likely due to increased lactic acid bacteria activity [35]. Other acids like succinic, malonic, and DL-isocitrate were detected at lower levels in the final stages, possibly via glycolysis and the tricarboxylic acid cycles [34]. The total content of the 26 acids peaked at 45 d (Figure 3B), showing a significant 20.42% increase compared to 0 d (p < 0.05), with significant differences at other stages (p < 0.05).
Based on the PCA of ZLJ at different fermentation stages using 26 organic acids (Figure 3C), we found that the separation between the ZLJ samples at each fermentation stage was very good, indicating significant differences in overall organic acids between different fermentation processes. Notably, the 0 d samples were far from the 90 d and 180 d samples, highlighting substantial differences in organic acids at the beginning versus later stages of fermentation. This suggests that the sourness of unfermented chili pepper is distinct from that of fermented chili pepper. Additionally, the 15 d and 45 d samples were also distant from each other, likely due to significant changes in organic acid content during this period.

3.4. Analysis of DOAs in the Fermentation Process of Zaolajiao

PCA assesses sample distribution and group dispersion, while OPLS-DA identifies the overall metabolic profile differences. To further analyze ZLJ fermentation differences, OPLS-DA was employed. OPLS-DA, a PLS-DA derivative, integrates orthogonal signal correction (OSC) and PLS-DA, decomposing X matrix information into Y-related and Y-uncorrelated components. This removes irrelevant differences, focusing on relevant information in the first predictive component to better distinguish subgroups and enhance model validity. Figure 4A shows improved sample dispersion at each fermentation stage after removing irrelevant differences, with ZLJ0d and ZLJ15d closer due to shorter fermentation times, and ZLJ90d and ZLJ180d closer due to fermentation stabilization. Model reliability was confirmed via permutation test analysis (Figure 4B), with the blue regression line intersecting below zero, indicating a reliable model.
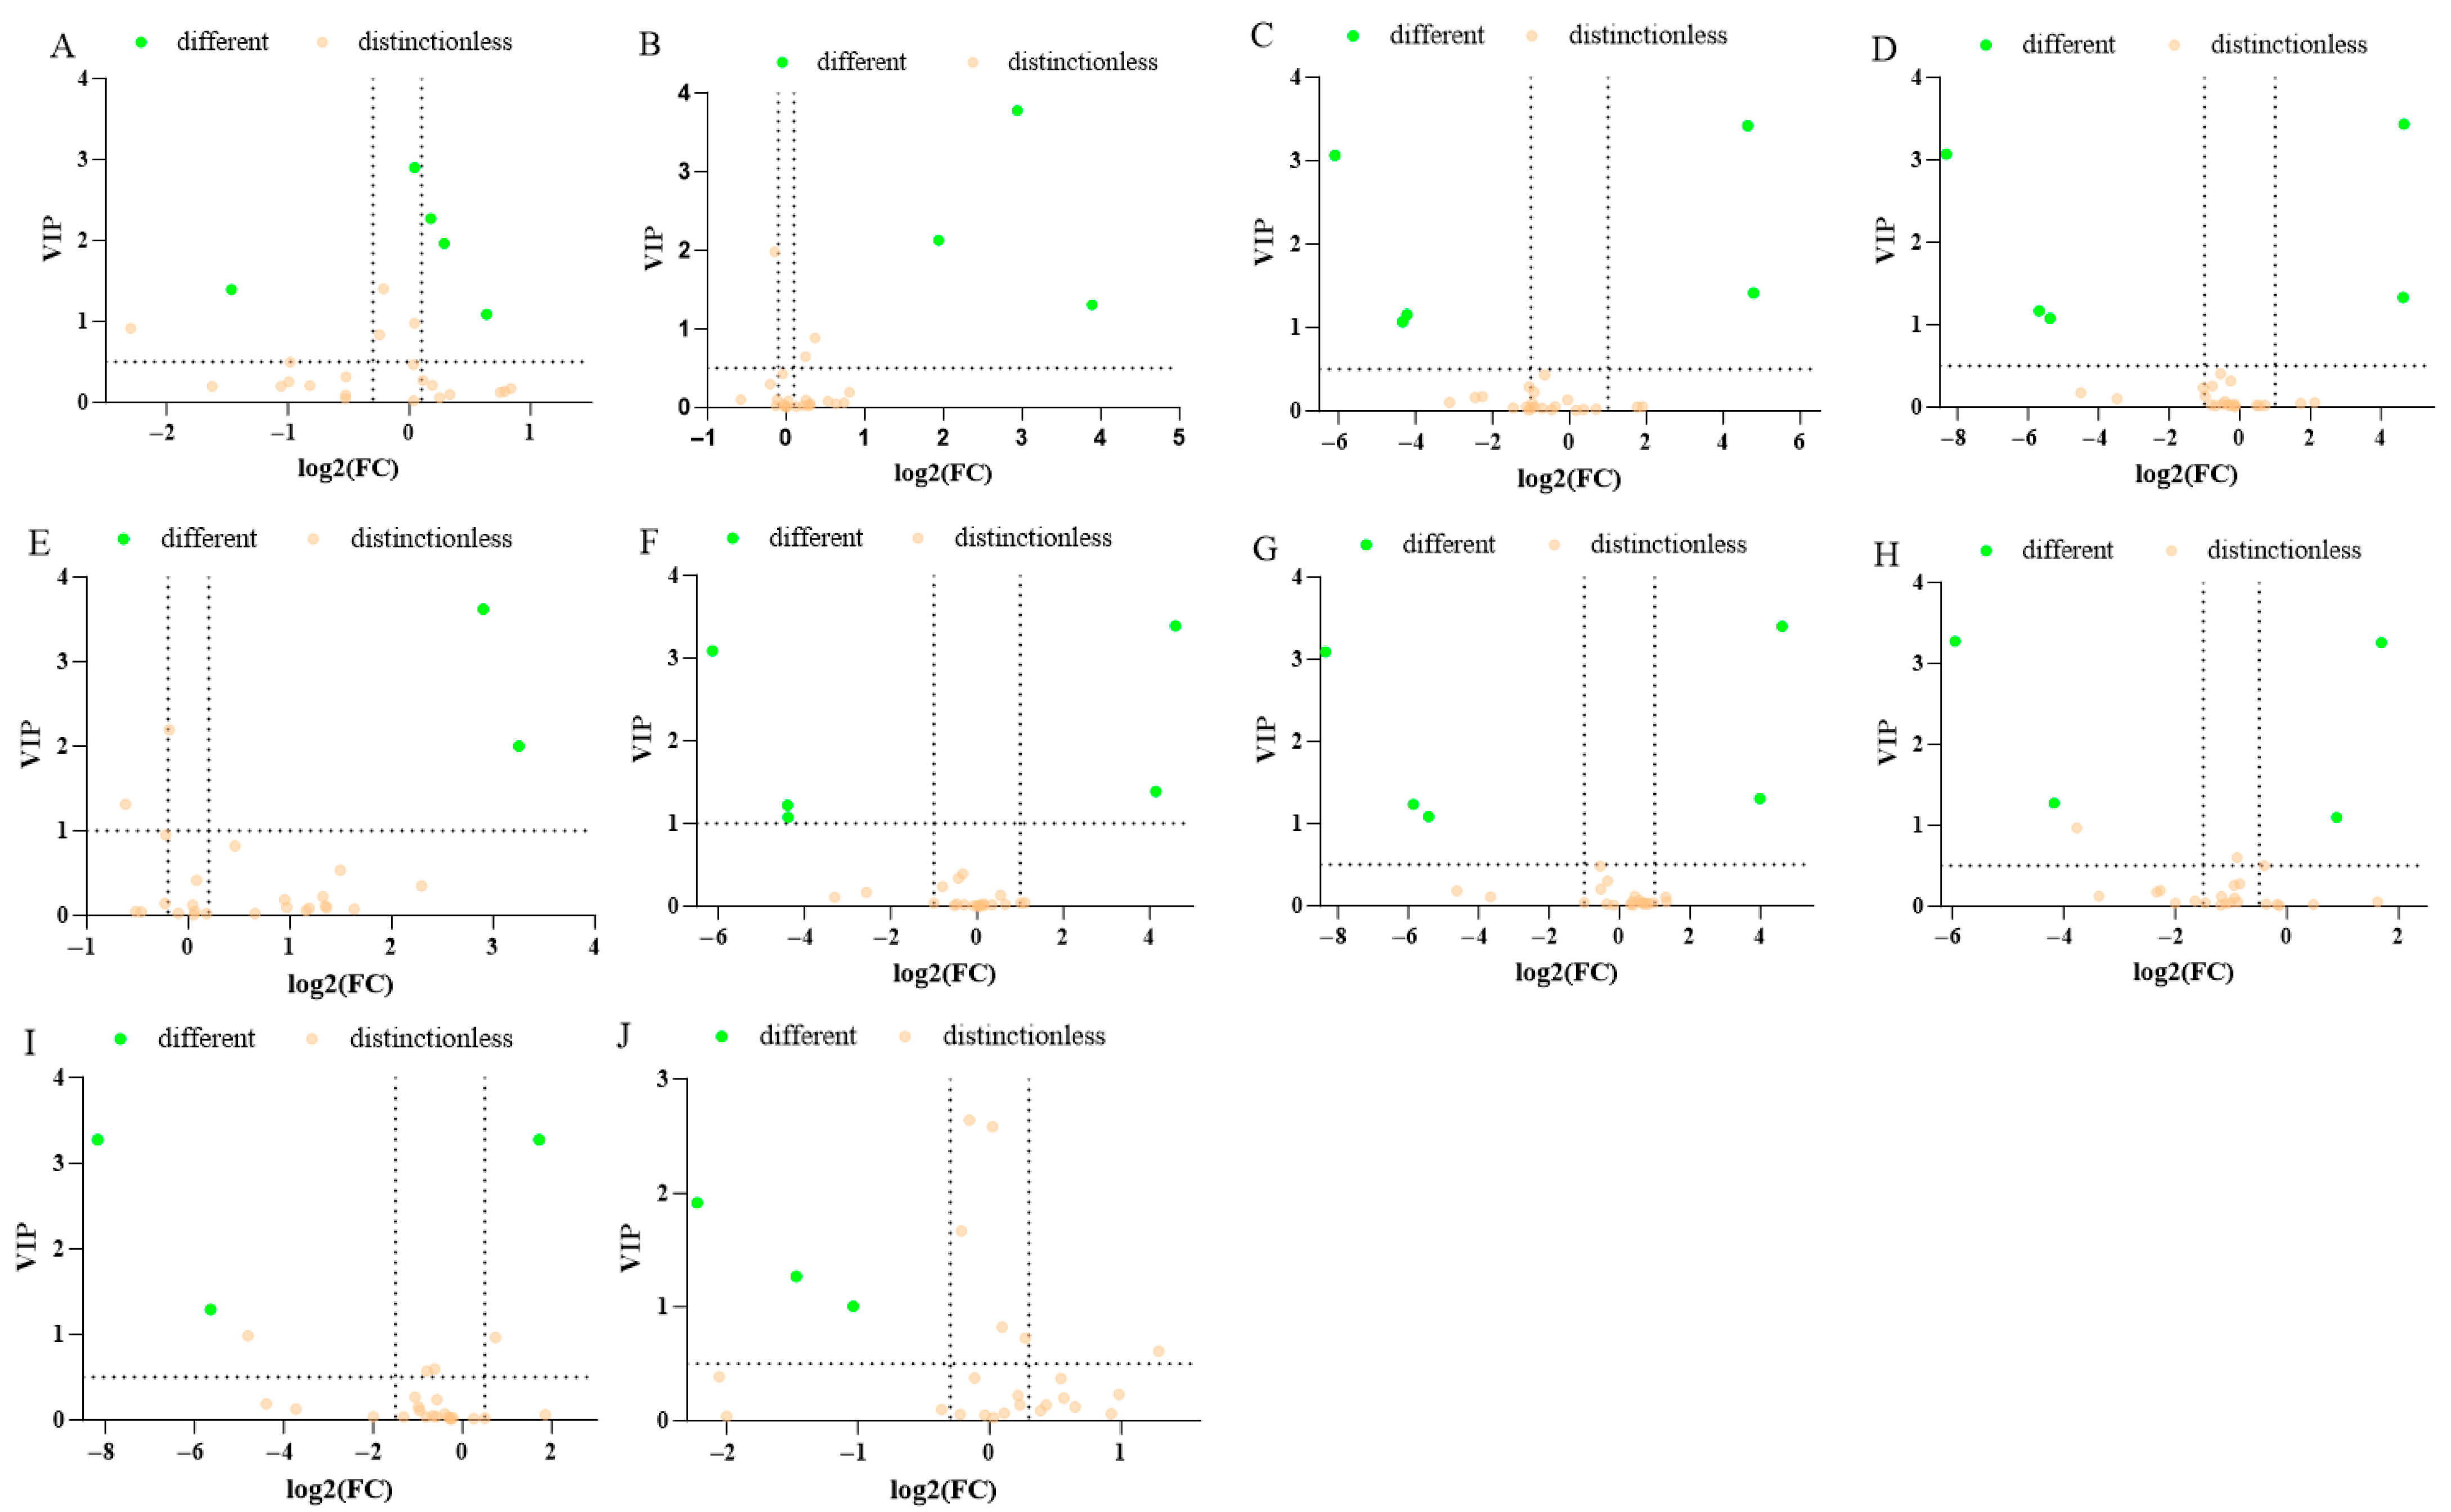
The detected organic acids were evaluated using three parameters: variable importance of projection (VIP), fold change (FC), and probability value (p-value). VIP indicates the contribution of each metabolite to the variance in the OPLS-DA model, with VIP > 1 denoting significant variables. FC represents the ratio of mean metabolite levels between groups, and p-value assesses statistical significance via t-tests (p < 0.05). In ZLJ fermentation, DOAs were identified across various stages. Between ZLJ0d and ZLJ15d (Figure 5A), five DOAs were found: benzoic acid, citric acid, succinic acid, malonic acid, and quinic acid. Between ZLJ0d and ZLJ45d (Figure 5B), three DOAs were identified: lactic acid, isobutyric acid, and succinic acid. For ZLJ0d vs. ZLJ90d, ZLJ0d vs. ZLJ180d, ZLJ15d vs. ZLJ90d, and ZLJ15d vs. ZLJ180d (Figure 5C,D,F,G), the DOAs included succinic acid, lactic acid, quinic acid, malic acid, and citric acid. Between ZLJ15d and ZLJ45d (Figure 5E), two DOAs were present: succinic acid and lactic acid. Between ZLJ45d and ZLJ90d (Figure 5H), four DOAs were identified: lactic acid, succinic acid, quinic acid, and citric acid. For ZLJ45d vs. ZLJ180d and ZLJ90d vs. ZLJ180d (Figure 5I,J), the DOAs were lactic acid, quinic acid, citric acid, and malic acid. In summary, key DOAs in the ZLJ fermentation process included benzoic acid, citric acid, succinic acid, malonic acid, quinic acid, lactic acid, isobutyric acid, and malic acid.
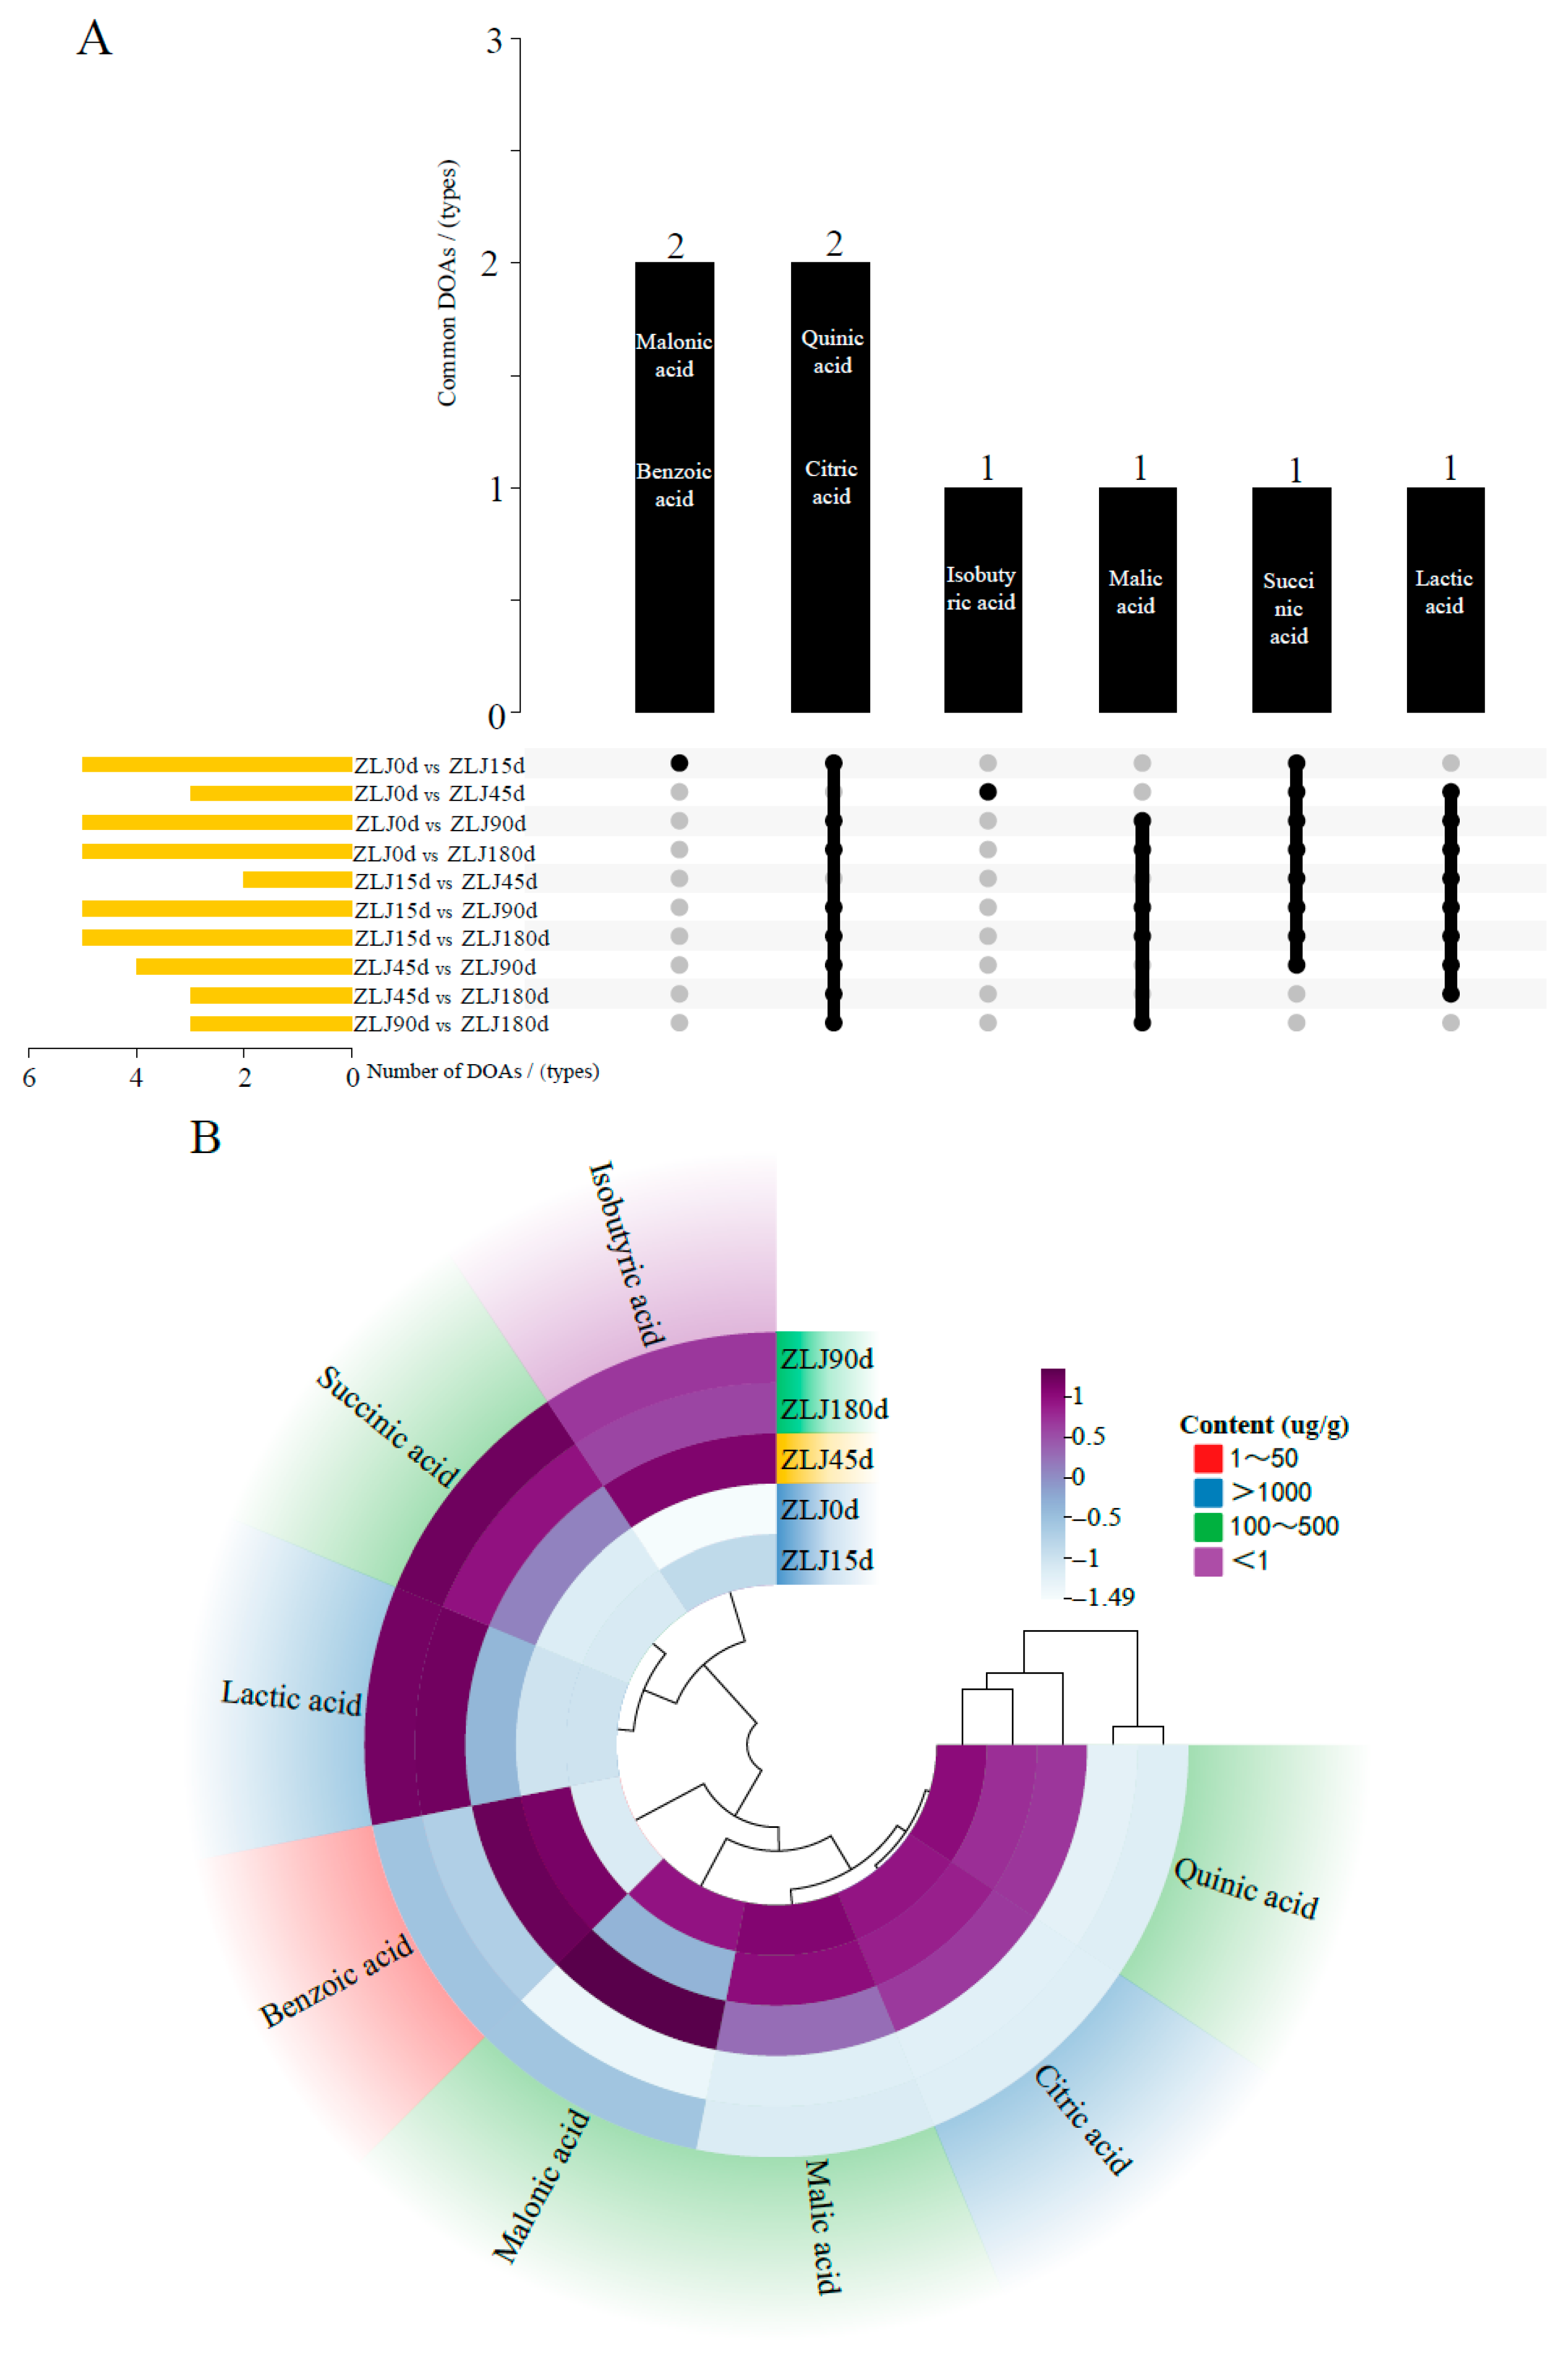
As shown in Figure 6A, benzoic acid and malonic acid are DOAs specific to ZLJ0d vs. ZLJ15d. The concentration of benzoic acid exhibited a trend of initial decrease followed by an increase with fermentation time, whereas that of malonic acid showed the opposite trend, with an initial increase followed by a decrease (Figure 6B). Citric acid and quinic acid were identified as DOAs in all groups except ZLJ0d vs. ZLJ45d and ZLJ15d vs. ZLJ45d (Figure 6A). Citric acid demonstrated progressive depletion throughout fermentation, whereas quinic acid exhibited biphasic kinetics with initial accumulation (0–15 d) followed by degradation (15–180 d) (Figure 6B). Succinic acid is a DOA between all the samples except ZLJ45d vs. ZLJ180d and ZLJ90d vs. ZLJ180d, with an increasing trend (0–90 d) and then a decreasing trend (90–180 d). Lactic acid is a DOA between all the samples except ZLJ0d vs. ZLJ15d and ZLJ90d vs. ZLJ180d. Isobutyric acid is specific to ZLJ0d vs. ZLJ45d, with an increasing trend (0–45 d) followed by a decreasing trend (45–180 d). Malic acid is a DOA for ZLJ0d vs. ZLJ90d, ZLJ0d vs. ZLJ180d, ZLJ15d vs. ZLJ90d, ZLJ15d vs. ZLJ180d, and ZLJ90d vs. ZLJ180d (Figure 6A).

3.5. Analysis of the Relationship Between Physical and Chemical Indicators and DOAs

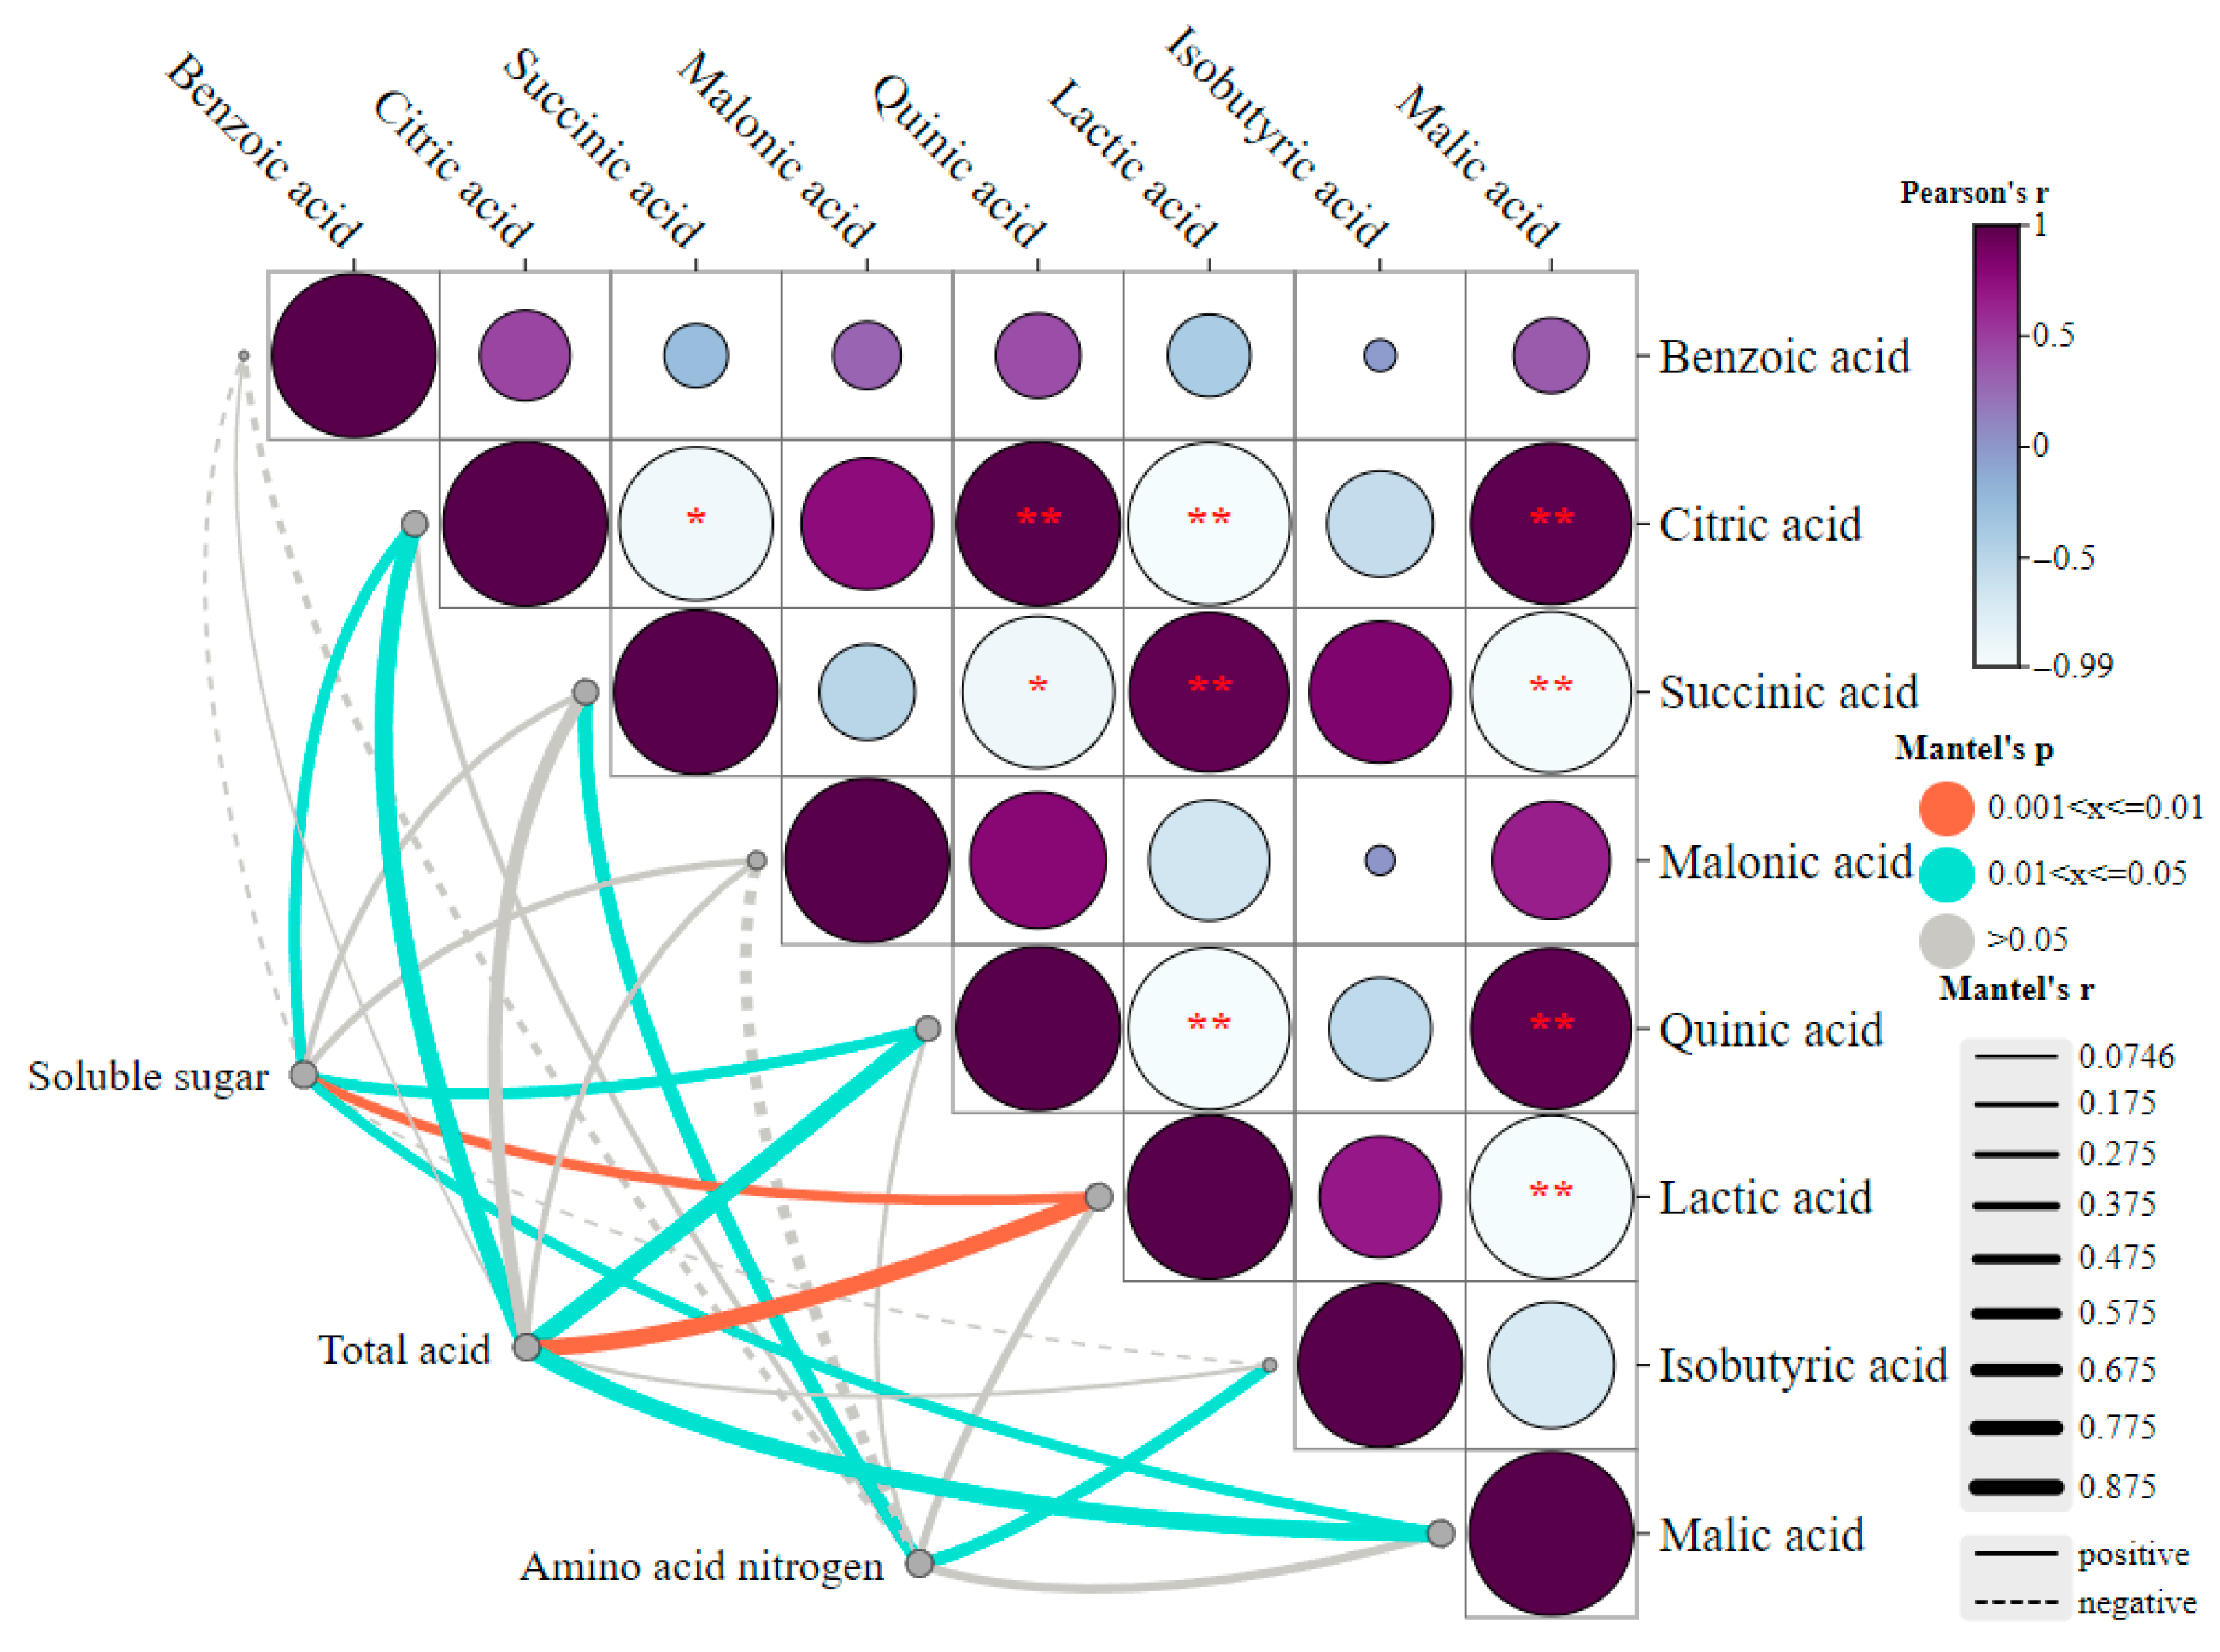
Interactive correlation analysis between DOAs and physicochemical indicators (soluble sugars, total acids, and amino acid nitrogen) was conducted using Pearson’s method (Figure 7). As shown in Figure 7, soluble sugars and total acids exhibited significant positive correlations (p < 0.05) with quinic acid, citric acid, and malic acid, and highly significant positive correlations (p < 0.05, |r| > 0.955) with lactic acid. Amino acid nitrogen showed significant positive correlations (p < 0.05) with isobutyric acid and succinic acid. Among DOAs, highly significant positive correlations (p < 0.01, |r| > 0.955) were observed between quinic acid and citric acid, malic acid and citric acid, lactic acid and succinic acid, and quinic acid and malic acid. Conversely, malic acid and succinic acid, and lactic acid with citric acid, quinic acid, and malic acid, displayed highly significant negative correlations (p < 0.01, |r| > 0.955). Additionally, succinic acid and citric acid, and quinic acid showed significant negative correlations (p < 0.05).

3.6. Analysis of the Relationship Between CAZymes, DOAs, and Physicochemical Indicators During Fermentation of Zaolajiao

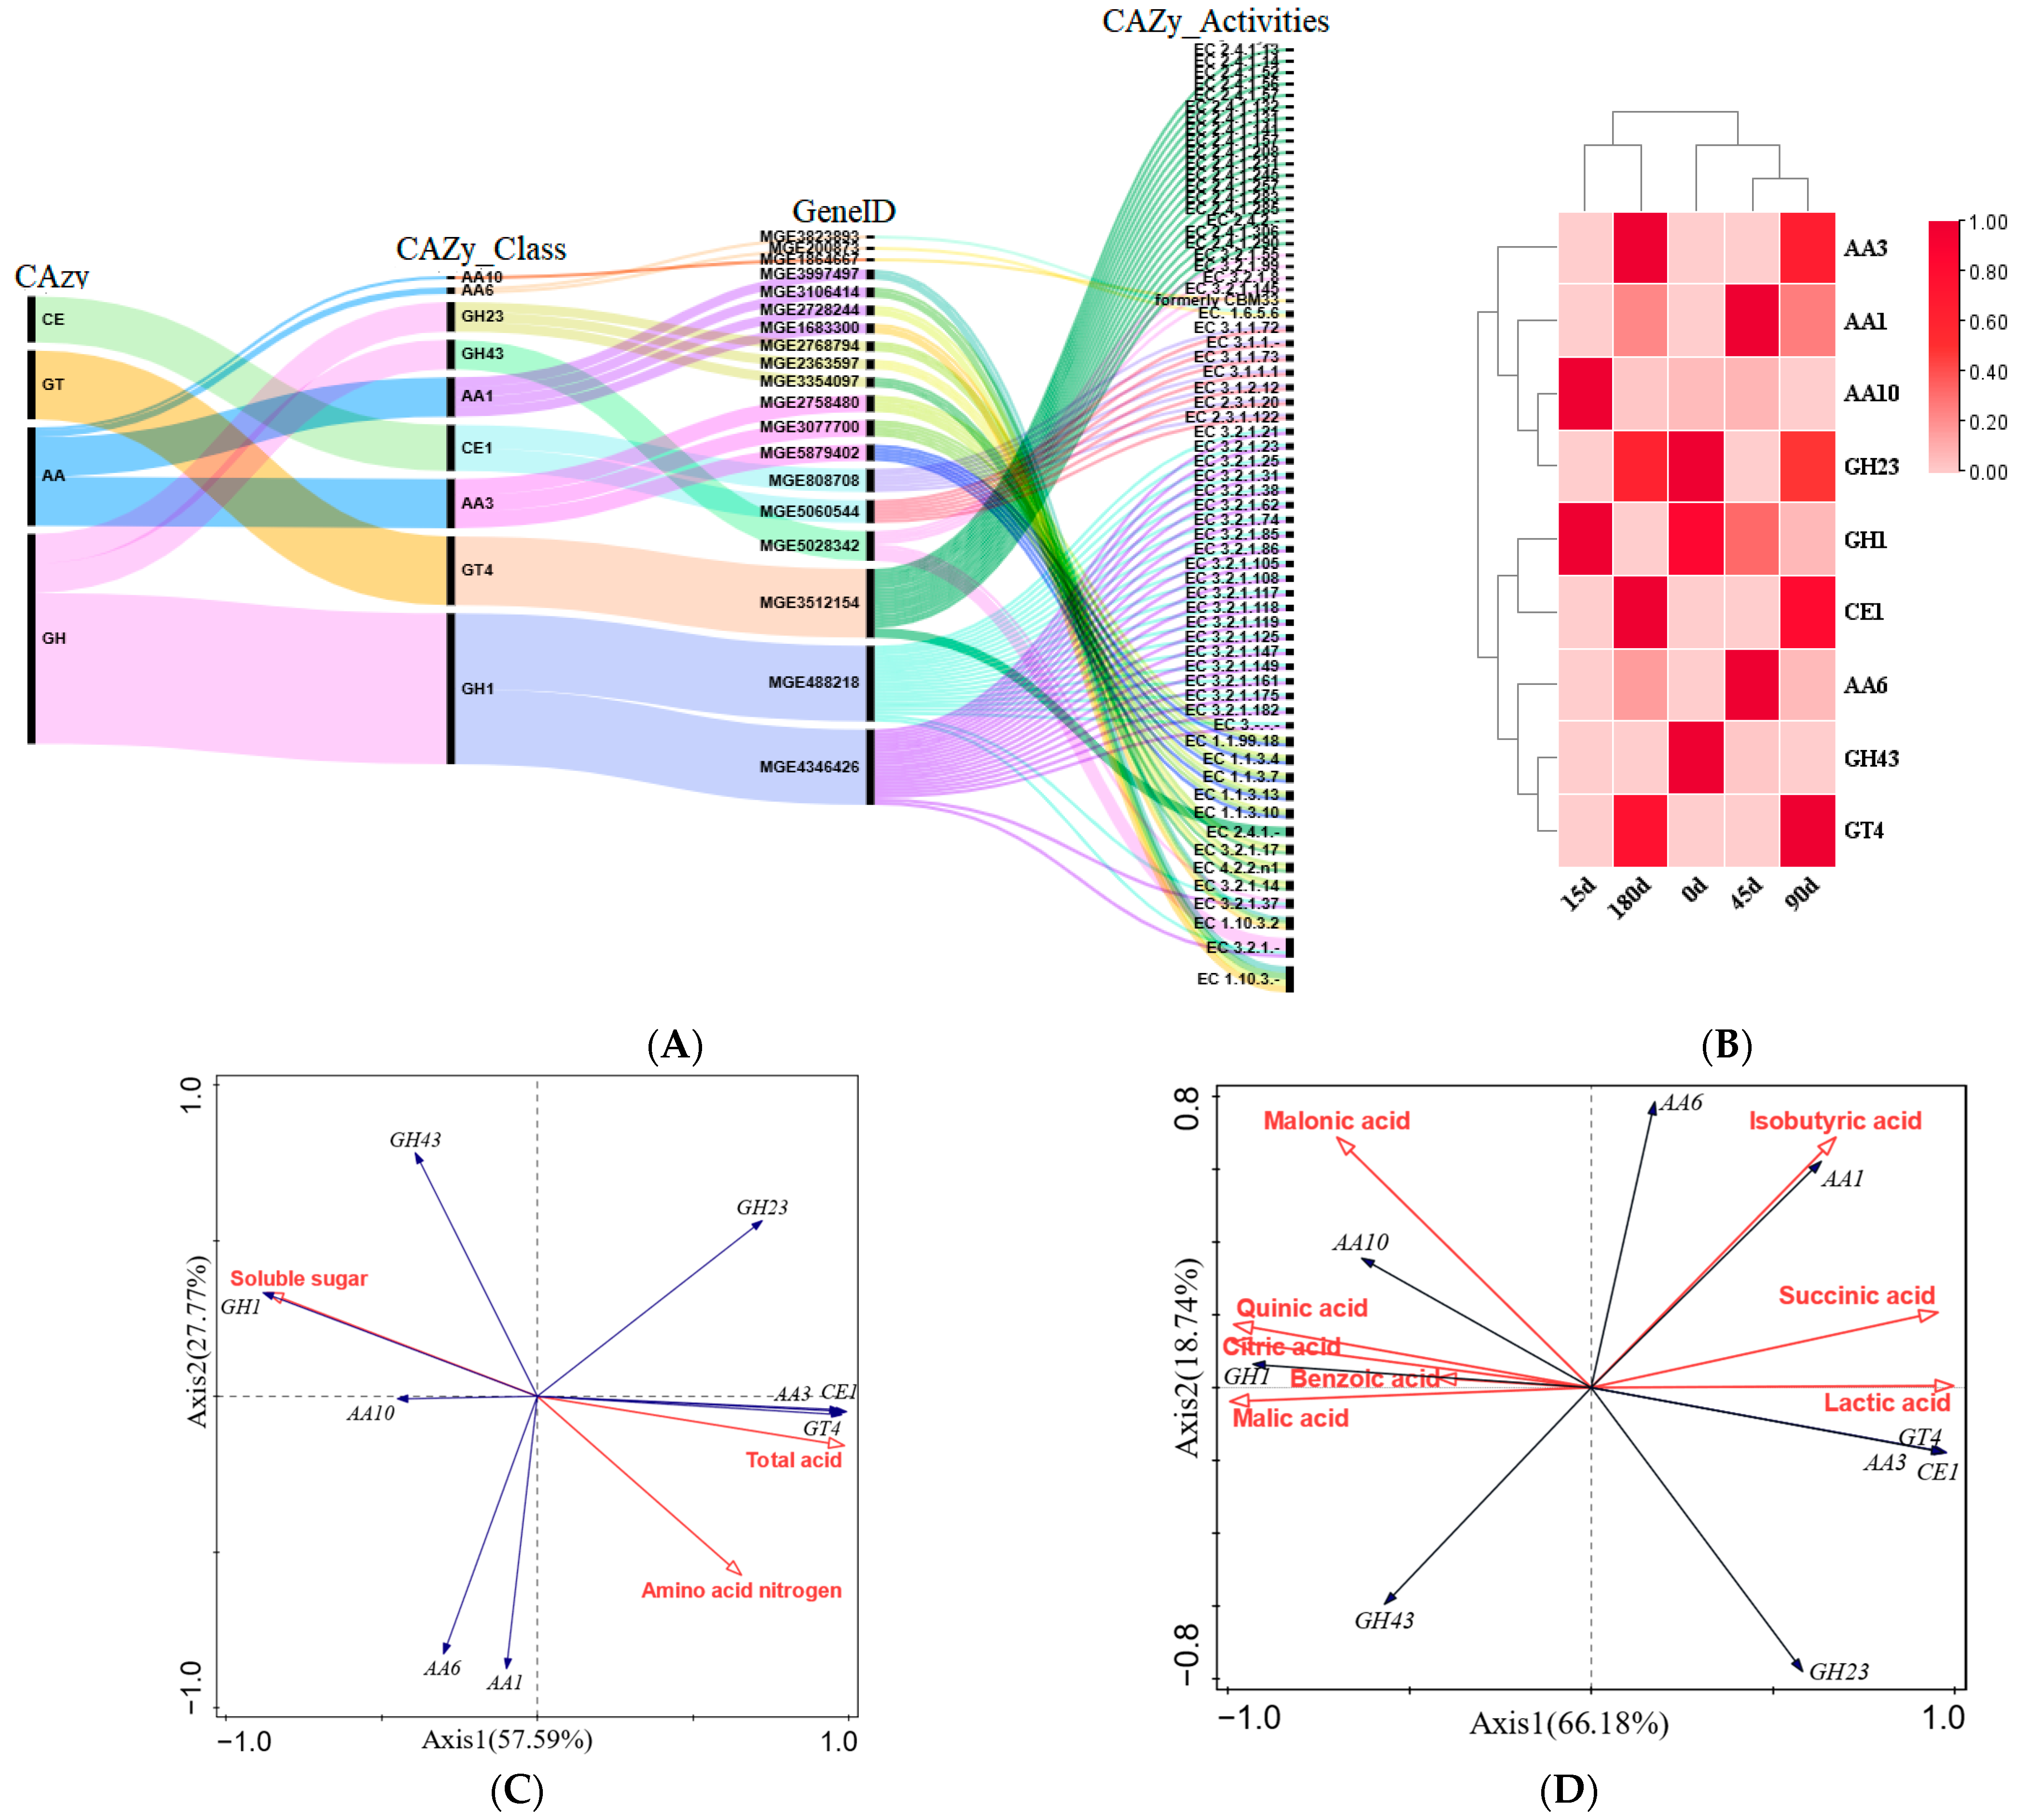
Carbohydrate metabolism represents a fundamental biological process governing carbohydrate synthesis and degradation [36]. This pathway is mediated by carbohydrate-active enzymes (CAZymes), comprising six functional classes: glycoside hydrolases (GHs), glycosyl transferases (GTs), polysaccharide lyases (PLs), carbohydrate esterases (CEs), auxiliary activities (AAs), and carbohydrate-binding modules (CBMs) [37,38]. Metagenomic analysis of ZLJ fermentation revealed dynamic CAZyme profiles (Figure 8A). Four major classes (GHs, AAs, GTs, CEs) and nine minor classes were identified. Notably, AA1 and AA6 emerged at 45d, with AA1 peaking at 45 d before declining, whereas AA6 exhibited an initial decrease followed by an increase from 45d to 180d (Figure 8B). AA10 persisted throughout fermentation, peaking at 15 d (50%). GHs dominated early stages (0–15 d), with GH43 and GH23 most abundant at 0d. GH-mediated glycosidic bond cleavage drives carbohydrate catabolism [39], liberating monosaccharides that fuel microbial metabolism and flavor synthesis. For instance, a thermostable GH-family β-glucosidase from B. subtilis exhibits remarkable hydrolytic capacity [40], demonstrating how GH abundance accelerates carbohydrate breakdown and fermentation efficiency. GT4 emerged at 90 d and reached its peak (21.04%) before declining, reflecting its role in polysaccharide synthesis dependent on UDP-glucose. This pattern correlates with substrate depletion and metabolic feedback inhibition. Conversely, AA3 and CE1 increased steadily after 90 d (Figure 8B), consistent with their oxidative [41] and esterase functions [42]. Sixty-four specific enzymes were annotated (Figure 8A), including key oxidoreductases (EC 1.1.3.7, EC 1.1.3.10, and EC 1.1.3.13). These temporal CAZyme patterns elucidate the enzymatic basis of ZLJ fermentation dynamics.
Canonical correspondence analysis (CCA) revealed significant associations between CAZymes, physicochemical properties, and DOAs during ZLJ fermentation (Figure 8C,D). Soluble sugars showed strong positive correlations with GH1 (complete overlap), GH43, and AA10 (rAA10 > rGH43), while negatively correlating with GH23, AA3, CE1, and GT4. Total acid exhibited positive correlations with GH23, AA3, CE1, and GT4 (rGT4 ≈ rAA3 ≈ rCE1 > rGH23), but negative correlations with AA1, AA10, AA6, GH1, and GH43 (rGH1 > rGH43 > rAA10 > rAA6 > rAA1). Amino acid nitrogen positively correlated with GH23, AA3, CE1, GT4, AA1, and AA6 (rGT4≈rAA3≈rCE1 > rAA1 > rAA6 > rGH23), while negatively associating with GH1, GH43, and AA10 (rGH1 > rGH43 > rAA10). Notably, AA10, GH1, and GH43 showed positive correlations with malic, quinic, citric, benzoic, and malonic acids (rmalonic > rquinic > rcitric > rmalic > rbenzoic), but negative correlations with isobutyric, lactic, and succinic acids (Figure 8D). Conversely, AA3, CE1, GT4, AA1, GH23, and AA6 demonstrated opposite correlation patterns. In the correlation analysis between GH43 and DOAs, GH43 showed the strongest positive correlation with malic acid (Figure 8D) and the strongest negative correlation with isobutyric acid (Figure 8D). These patterns suggest fermentation-stage-dependent enzyme activities directly influence organic acid profiles [43], particularly through microbial sugar-to-lactic acid conversion pathways [44].

3.7. Metabolic Pathway Enrichment Analysis of Differential Organic Acids

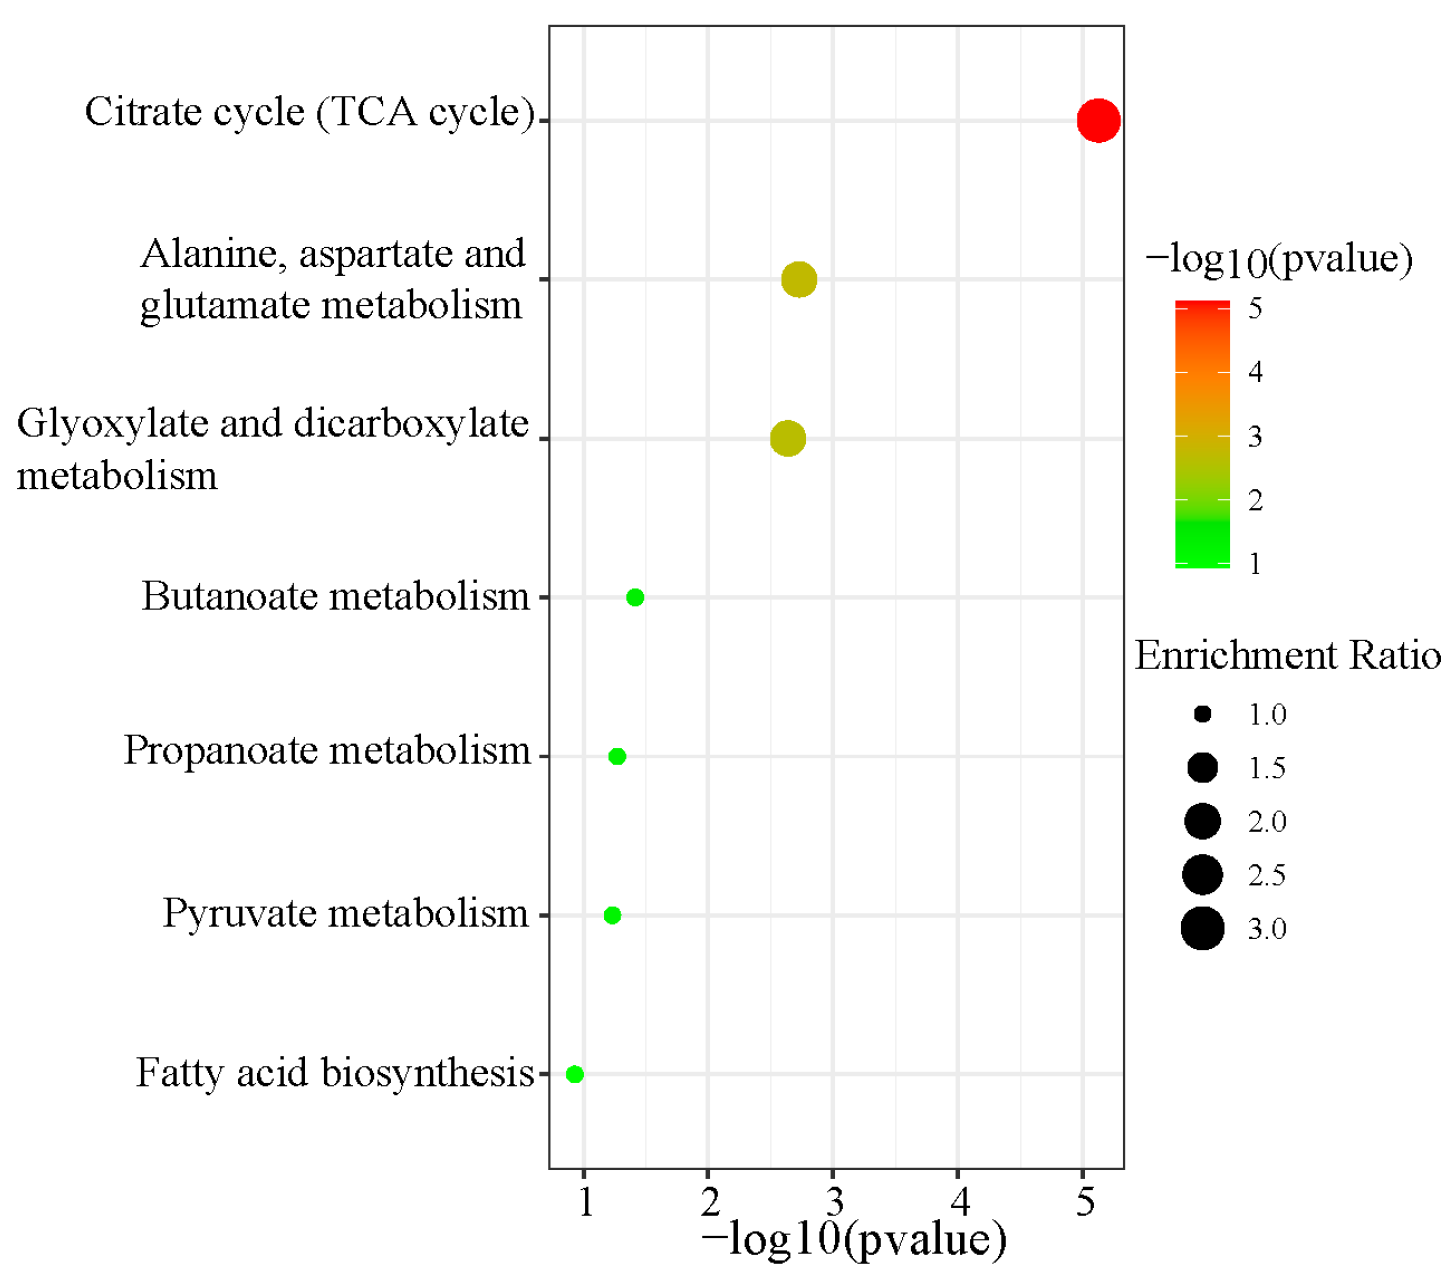
Metabolic pathway analysis of DOAs revealed seven annotated pathways (Table S2), with seven showing significant enrichment (Figure 9). The citrate cycle (TCA cycle) was most prominently enriched (p = 7.46 × 10⁻⁶, False Discovery Rate (FDR) = 5.97 × 10⁻⁴), involving succinic, malic, and citric acids. As the central hub of cellular metabolism, the TCA cycle oxidizes glucose, fatty acids, and amino acids to generate reducing equivalents for ATP production [45]. Citric acid serves dual roles as both a metabolic intermediate and regulator—while providing acetyl-CoA for lipid synthesis, it also modulates glycolysis via phosphofructokinase-1 feedback inhibition [46]. Three additional pathways showed significant enrichment: alanine/aspartate/glutamate metabolism (p = 0.00187), glyoxylate/dicarboxylate metabolism (p = 0.0023), and butanoate metabolism (p = 0.0385), with shared metabolites (citric, malic, and succinic acids) indicating functional crosstalk. Notably, the TCA cycle interfaces with both glycolysis (via pyruvate conversion to acetyl-CoA) and amino acid synthesis (through α-ketoglutarate) [47], forming an integrated metabolic network that coordinates energy production with flavor precursor synthesis in ZLJ fermentation. These interconnected pathways collectively contribute to the characteristic flavor profile development.

4. Conclusions

This study systematically analyzed the volatile compounds, organic acids, and their correlations with physicochemical indices and CAZymes during the fermentation of ZLJ. The results showed that alcohols, aldehydes, and ketones varied significantly (p < 0.05) and peaked in the middle and late stages (90–180 d). Total acid content increased with fermentation time, while soluble sugars decreased and amino acid nitrogen peaked at 90 days. The total content of 26 organic acids initially increased and then decreased. Citric acid dominated the early stage, showing a highly significant negative correlation (p < 0.01, |r| > 0.955) with AA3, GT4, and CE1, and a significant positive correlation (p < 0.05) with GH1, soluble sugars, and total acids. Lactic acid was predominant in the late stage, accounting for 77.85% and 80.30% of the total acids at 90 and 180 days, respectively, and showed highly positive significant correlations with total acids, AA3, GT4, and soluble sugars. Other notable acids including quinic, malic, isobutyric, and succinic acids exhibited distinct temporal patterns and specific correlations with key parameters. The CAZyme profiling identified nine enzyme families with stage-specific expression patterns: AA1 peaked at 45 d, while the peak of AA10 occurred at 15 d. AA6 showed progressive increase, GH1 was early-phase predominant (0–15 d), while GT4 reached maximum activity at 90 d. The metabolic pathway analysis indicated the TCA cycle as the primary route for differential organic acid production. These findings provide mechanistic insights into fermentation biochemistry, suggesting practical strategies for process optimization.

Supplementary Materials

The following supporting information can be downloaded at https://www.mdpi.com/article/10.3390/fermentation11080479/s1. Table S1: 26 types of organic acids during fermentation of Zao chilies (ug/g); Table S2: Metabolic pathways annotated to DOAs in KEGG.

Author Contributions

Visualization, methodology, data curation, software, writing—original draft, and funding acquisition, J.C.; methodology, investigation, software, and funding acquisition, X.W.; data curation, W.L.; conceptualization and supervision, J.H.; resources, Y.Y.; resources, M.L.; data curation, formal analysis, writing—review and editing, and funding acquisition, Y.H. All authors have read and agreed to the published version of the manuscript.

Funding

This work was supported by the Science and Technology Program of Guizhou Province: Qiankehe Basic Research-ZK [2024] General 535, Qiankehe Basic Research MS [2025]124, and Qiankehe Achievement-LC [2024]010; Project of Youth Fund of Guizhou Academy of Agricultural Sciences (Youth Science and Technology Fund of Guizhou Academy of Agricultural Sciences [2023] No. 18); the Key Technology Research Project for the Pepper Industry in Guizhou Province; and Guizhou Academy of Agricultural Sciences “Key Core Technology” Project: Qian nong ke GJHX [2025] No. 06.

Data Availability Statement

The original contributions presented in this study are included in the article/Supplementary Materials. Further inquiries can be directed to the corresponding authors.

Conflicts of Interest

The authors declare no conflict of interest.

References

  1. Subhash, K.; Longvah, T. Capsaicinoids, amino acid and fatty acid profiles in different fruit components of the world hottest Naga king chilli (Capsicum chinense Jacq). Food Chem. 2018, 238, 51–57. [Google Scholar] [CrossRef]
  2. Chen, Z.; Geng, Y.; Wang, M.; Lv, D.; Huang, S.; Guan, Y.; Hu, Y. Relationship between microbial community and flavor profile during the fermentation of chopped red chili (Capsicum annuum L.). Food Biosci. 2022, 50, 102071. [Google Scholar] [CrossRef]
  3. Xu, X.; Wu, B.; Zhao, W.; Lao, F.; Chen, F.; Liao, X.; Wu, J. Shifts in autochthonous microbial diversity and volatile metabolites during the fermentation of chili pepper (Capsicum frutescens L.). Food Chem. 2021, 335, 127512. [Google Scholar] [CrossRef]
  4. Xiong, S.; Xu, X.; Du, T.; Liu, Q.; Huang, T.; Ren, H.; Xiong, T.; Xie, M. Organic acids drove the microbiota succession and consequently altered the flavor quality of Laotan Suancai across fermentation rounds: Insights from the microbiome and metabolome. Food Chem. 2024, 450, 139335. [Google Scholar] [CrossRef] [PubMed]
  5. Xia, Y.; Yu, J.; Liu, H.; Feng, C.; Shuang, Q. Novel insight into physicochemical and flavor formation in koumiss based on microbial metabolic network. Food Res. Int. 2021, 149, 110659. [Google Scholar] [CrossRef] [PubMed]
  6. Hu, Y.; Zhang, L.; Zhang, H.; Wang, Y.; Chen, Q.; Kong, B. Physicochemical properties and flavour profile of fermented dry sausages with a reduction of sodium chloride. LWT 2020, 124, 109061. [Google Scholar] [CrossRef]
  7. Bian, M.; Huang, E.; Xia, S.; He, C.; Ye, G. Bioturbation analysis of microbial community and organic acid metabolism in the enriched liquid of pit mud by Daqu, HuangShui, and ZaoPei. Food Sci. Biotechnol. 2025, 34, 1981–1994. [Google Scholar] [CrossRef]
  8. He, Y.-X.; Shi, W.; Huang, T.-C.; Mei, J.-L.; Lu, Z.-M.; Zhang, X.-J.; Yang, B.; Chen, X.-Y.; Wang, S.-T.; Shen, C.-H.; et al. Overproduction of organic acids affects the microbial community succession and flavor metabolism during Baijiu fermentation. LWT 2024, 213, 117093. [Google Scholar] [CrossRef]
  9. Liu, A.; Wu, J.; Li, J.; Li, Q.; Zhao, N.; Hu, K.; Liu, S.; Blaiotta, G.; Zhou, J. Uncovering the microbial community dynamics and metabolic pathways of primary organic acids in Sichuan Baoning vinegar through metagenomics. World J. Microbiol. Biotechnol. 2025, 41, 91. [Google Scholar] [CrossRef]
  10. Niu, C.; Xue, Y.; Jia, Y.; Xu, T.; Liu, C.; Zheng, F.; Wang, J.; Li, Q. Analysis of bacterial community dynamics in the manufacture process of lajiaojiang (red chili paste). LWT 2020, 122, 108976. [Google Scholar] [CrossRef]
  11. Xu, X.; Wu, B.; Zhao, W.; Pang, X.; Wu, J. Correlation between autochthonous microbial communities and key odorants during the fermentation of red pepper (Capsicum annuum L.). Food Microbiol. 2020, 91, 103510. [Google Scholar] [CrossRef] [PubMed]
  12. Chen, J.; Huang, Y.; Wang, X.; He, J.; Li, W.; Lu, M.; Sun, X.; Yin, Y. Revealing core functional microorganisms in the fermentation process of Qicaipaojiao (Capsicum annuum L.) based on microbial metabolic network. Food Res. Int. 2024, 187, 114315. [Google Scholar] [CrossRef]
  13. Li, M.; Xu, X.; Bi, S.; Pan, X.; Lao, F.; Wu, J. Identification and validation of core microbes associated with key aroma formation in fermented pepper paste (Capsicum annuum L.). Food Res. Int. 2023, 163, 112194. [Google Scholar] [CrossRef] [PubMed]
  14. Ye, Z.; Shang, Z.; Li, M.; Zhang, X.; Ren, H.; Hu, X.; Yi, J. Effect of ripening and variety on the physiochemical quality and flavor of fermented Chinese chili pepper (Paojiao). Food Chem. 2022, 368, 130797. [Google Scholar] [CrossRef]
  15. Wang, J.; Wang, R.; Xiao, Q.; Liu, C.; Deng, F.; Zhou, H. SPME/GC-MS characterization of volatile compounds of Chinese traditional-chopped pepper during fermentation. Int. J. Food Prop. 2019, 22, 1863–1872. [Google Scholar] [CrossRef]
  16. Wang, D.; Zhang, J.; Zhu, Z.; Lei, Y.; Huang, S.; Huang, M. Effect of ageing time on the flavour compounds in Nanjing water-boiled salted duck detected by HS-GC-IMS. LWT 2022, 155, 112870. [Google Scholar] [CrossRef]
  17. Chen, X.; Yan, F.; Qu, D.; Wan, T.; Xi, L.; Hu, C.Y. Aroma characterization of Sichuan and Cantonese sausages using electronic nose, gas chromatography–mass spectrometry, gas chromatography-olfactometry, odor activity values and metagenomic. Food Chem. X 2024, 24, 101924. [Google Scholar] [CrossRef]
  18. Wu, Y.; Xia, M.; Zhao, N.; Tu, L.; Xue, D.; Zhang, X.; Zhao, C.; Cheng, Y.; Zheng, Y.; Wang, M. Metabolic profile of main organic acids and its regulatory mechanism in solid-state fermentation of Chinese cereal vinegar. Food Res. Int. 2021, 145, 110400. [Google Scholar] [CrossRef]
  19. Jiang, J.; Xie, Y.; Cui, M.; Ma, X.; Yin, R.; Chen, Y.; Li, Y.; Hu, Y.; Cheng, W.; Gao, F. Characterization of differences in physicochemical properties, volatile organic compounds and non-volatile metabolites of prune wine by inoculation of different lactic acid bacteria during malolactic fermentation. Food Chem. 2024, 452, 139616. [Google Scholar] [CrossRef]
  20. Guo, J.; Pan, Y.; Chen, J.; Jin, P.; Tang, S.; Wang, H.; Su, H.; Wang, Q.; Chen, C.; Xiong, F.; et al. Serum metabolite signatures in normal individuals and patients with colorectal adenoma or colorectal cancer using UPLC-MS/MS method. J. Proteomics 2023, 270, 104741. [Google Scholar] [CrossRef]
  21. Fan, G.; Sun, B.; Fu, Z.; Xia, Y.; Li, X. Analysis of Physicochemical Indices, Volatile Flavor Components, and Microbial Community of a Light-Flavor Daqu. J. Am. Soc. Brew. Chem. 2018, 76, 209–218. [Google Scholar] [CrossRef]
  22. Liu, D.; Bai, L.; Feng, X.; Chen, Y.P.; Liu, Y. Characterization of Jinhua ham aroma profiles in specific to aging time by gas chromatography-ion mobility spectrometry (GC-IMS). Meat Sci. 2020, 168, 108178. [Google Scholar] [CrossRef]
  23. Zhang, J.G.; Wang, J.J.; Zhang, W.W.; Guan, Z.J.; Thakur, K.; Hu, F.; Khan, M.R.; Wei, Z.J. Metabolomics and HS-SPME-GC-MS-based analysis of quality succession patterns and flavor characteristics changes during the fermentation of Lycium barbarum and Polygonatum cyrtonema compound wine. Food Res. Int. 2024, 184, 114270. [Google Scholar] [CrossRef] [PubMed]
  24. Bandić, L.M.; Žulj, M.M.; Fruk, G.; Skendrovic, M.; Jeromel, A. The profile of organic acids and polyphenols in apple wines fermented with different yeast strains. J. Food Sci. Technol. 2019, 56, 599–606. [Google Scholar] [CrossRef] [PubMed]
  25. Jiang, J.; Yin, R.; Xie, Y.; Ma, X.; Cui, M.; Chen, Y.; Li, Y.; Hu, Y.; Niu, J.; Cheng, W. Effects of cofermentation of Saccharomyces cerevisiae and different lactic acid bacteria on the organic acid content, soluble sugar content, biogenic amines, phenol content, antioxidant activity and aroma of prune wine. Food Chem. X 2024, 22, 101502. [Google Scholar] [CrossRef] [PubMed]
  26. Xie, Y.; Guo, C.; Devahastin, S.; Jiang, L.; Du, M.; Yi, J. Non-destructive determination of volatile compounds and prediction of amino acid nitrogen during sufu fermentation via electronic nose in combination with machine learning approaches. LWT-Food Sci. Technol. 2024, 207, 116648. [Google Scholar] [CrossRef]
  27. Zhang, Q.; Ma, Y.; Wan, F.; Cai, Z.; Zeng, R.; Tang, J.; Nie, X.; Jiang, X.; Zhu, C.; Laghi, L. Comprehensive comparison of flavor and metabolomic profiles in kiwi wine fermented by kiwifruit flesh with different colors. LWT 2024, 208, 116719. [Google Scholar] [CrossRef]
  28. Peres Fabbri, L.; Cavallero, A.; Vidotto, F.; Gabriele, M. Bioactive Peptides from Fermented Foods: Production Approaches, Sources, and Potential Health Benefits. Foods 2024, 13, 3369. [Google Scholar] [CrossRef] [PubMed]
  29. Cai, H.; Dumba, T.; Sheng, Y.; Li, J.; Lu, Q.; Liu, C.; Cai, C.; Feng, F.; Zhao, M. Microbial diversity and chemical property analyses of sufu products with different producing regions and dressing flavors. LWT 2021, 144, 111245. [Google Scholar] [CrossRef]
  30. Chen, Z.; Zhang, C.; Du, H.; Chen, C.; Xue, Q.; Hu, Y. Effect of starter cultures on dynamics succession of microbial communities, physicochemical parameters, enzyme activities, tastes and volatile flavor compounds during sufu fermentation. Food Chem. Adv. 2022, 1, 100057. [Google Scholar] [CrossRef]
  31. Mansour, M.A.K.; Ali, S.G.; Hassan, M.A.M.; Gabra, F.A.; Mawad, A.M.M. Optimization of citrulline production from a Bacillus subtilis BH-01 isolated from raw buffalo milk. BMC Microbiol. 2025, 25, 71. [Google Scholar] [CrossRef] [PubMed]
  32. Yang, Y.; Fan, Y.; Li, T.; Yang, Y.; Zeng, F.; Wang, H.; Suo, H.; Song, J.; Zhang, Y. Microbial composition and correlation between microbiota and quality-related physiochemical characteristics in chongqing radish paocai. Food Chem. 2022, 369, 130897. [Google Scholar] [CrossRef] [PubMed]
  33. Okoye, C.O.; Dong, K.; Wang, Y.; Gao, L.; Li, X.; Wu, Y.; Jiang, J. Comparative genomics reveals the organic acid biosynthesis metabolic pathways among five lactic acid bacterial species isolated from fermented vegetables. New Biotechnol. 2022, 70, 73–83. [Google Scholar] [CrossRef] [PubMed]
  34. Zheng, Z.; Zhou, Q.; Li, D.; Wu, Y.; Zhong, K.; Gao, H. Effects of enhanced fermentation with Lactiplantibacillus plantarum WWPC on physicochemical characteristics and flavor profiles of radish paocai and dried-fermented radish. Food Biosci. 2024, 59, 103941. [Google Scholar] [CrossRef]
  35. Xiao, M.; Peng, Z.; Hardie, W.J.; Huang, T.; Xiong, T. Exploring the typical flavours formation by combined with metatranscriptomics and metabolomics during Chinese Sichuan paocai fermentation. LWT 2021, 153, 112474. [Google Scholar] [CrossRef]
  36. Ping, Q.; Zheng, M.; Dai, X.; Li, Y. Metagenomic characterization of the enhanced performance of anaerobic fermentation of waste activated sludge with CaO2 addition at ambient temperature: Fatty acid biosynthesis metabolic pathway and CAZymes. Water Res. 2020, 170, 115309. [Google Scholar] [CrossRef]
  37. Saini, S.; Kumar, A.; Singhal, B.; Kuhad, R.C.; Sharma, K.K. Fungal oxidoreductases and CAZymes effectively degrade lignocellulosic component of switchgrass for bioethanol production. Fuel 2022, 328, 125341. [Google Scholar] [CrossRef]
  38. Garron, M.-L.; Henrissat, B. The continuing expansion of CAZymes and their families. Curr. Opin. Chem. Biol. 2019, 53, 82–87. [Google Scholar] [CrossRef]
  39. Wardman, J.F.; Bains, R.K.; Rahfeld, P.; Withers, S.G. Carbohydrate-active enzymes (CAZymes) in the gut microbiome. Nat. Rev. Microbiol. 2022, 20, 542–556. [Google Scholar] [CrossRef]
  40. Tiwari, R.; Singh, P.K.; Singh, S.; Nain, P.K.S.; Nain, L.; Shukla, P. Bioprospecting of novel thermostable beta-glucosidase from Bacillus subtilis RA10 and its application in biomass hydrolysis. Biotechnol. Biofuels 2017, 10, 246. [Google Scholar] [CrossRef]
  41. Zhao, L.; Ma, Z.; Yin, J.; Shi, G.; Ding, Z. Biological strategies for oligo/polysaccharide synthesis: Biocatalyst and microbial cell factory. Carbohydr. Polym. 2021, 258, 117695. [Google Scholar] [CrossRef]
  42. Nakamura, A.M.; Nascimento, A.S.; Polikarpov, I. Structural diversity of carbohydrate esterases. Biotechnol. Res. Innov. 2017, 1, 35–51. [Google Scholar] [CrossRef]
  43. Ritter, S.W.; Thiel, Q.P.; Gastl, M.I.; Becker, T.M. Optimizing the fermentation parameters in the Lactic Acid Fermentation of Legume-based Beverages- a statistically based fermentation. Microb. Cell Fact. 2024, 23, 253. [Google Scholar] [CrossRef] [PubMed]
  44. Wu, R.; Yang, J.; Jiang, Y.; Xin, F. Advances and prospects for lactic acid production from lignocellulose. Enzyme Microb. Technol. 2025, 182, 110542. [Google Scholar] [CrossRef]
  45. Britannica, E. Tricarboxylic acid cycle. In Encyclopedia Britannica; Encyclopædia Britannica, Inc.: Chicago, IL, USA, 2025. [Google Scholar]
  46. Yang, Y.; Cui, B.-B.; Li, J.; Shan, J.-J.; Xu, J.; Zhang, C.-Y.; Wei, X.-T.; Zhu, R.-R.; Wang, J.-Y. Tricarboxylic acid cycle metabolites: New players in macrophage. Inflamm. Res. 2024, 73, 531–539. [Google Scholar] [CrossRef] [PubMed]
  47. Zhang, H.; Ji, N.; Su, S.; Zhao, M.; Du, H.; Sahoo, L.K.; Wu, Y.; Feng, Y.; Gupta, N.; Xiao, L.; et al. Metabolic crosstalk between the mitochondrion and the nucleus is essential for Toxoplasma gondii infection. Commun. Biol. 2025, 8, 384. [Google Scholar] [CrossRef] [PubMed]
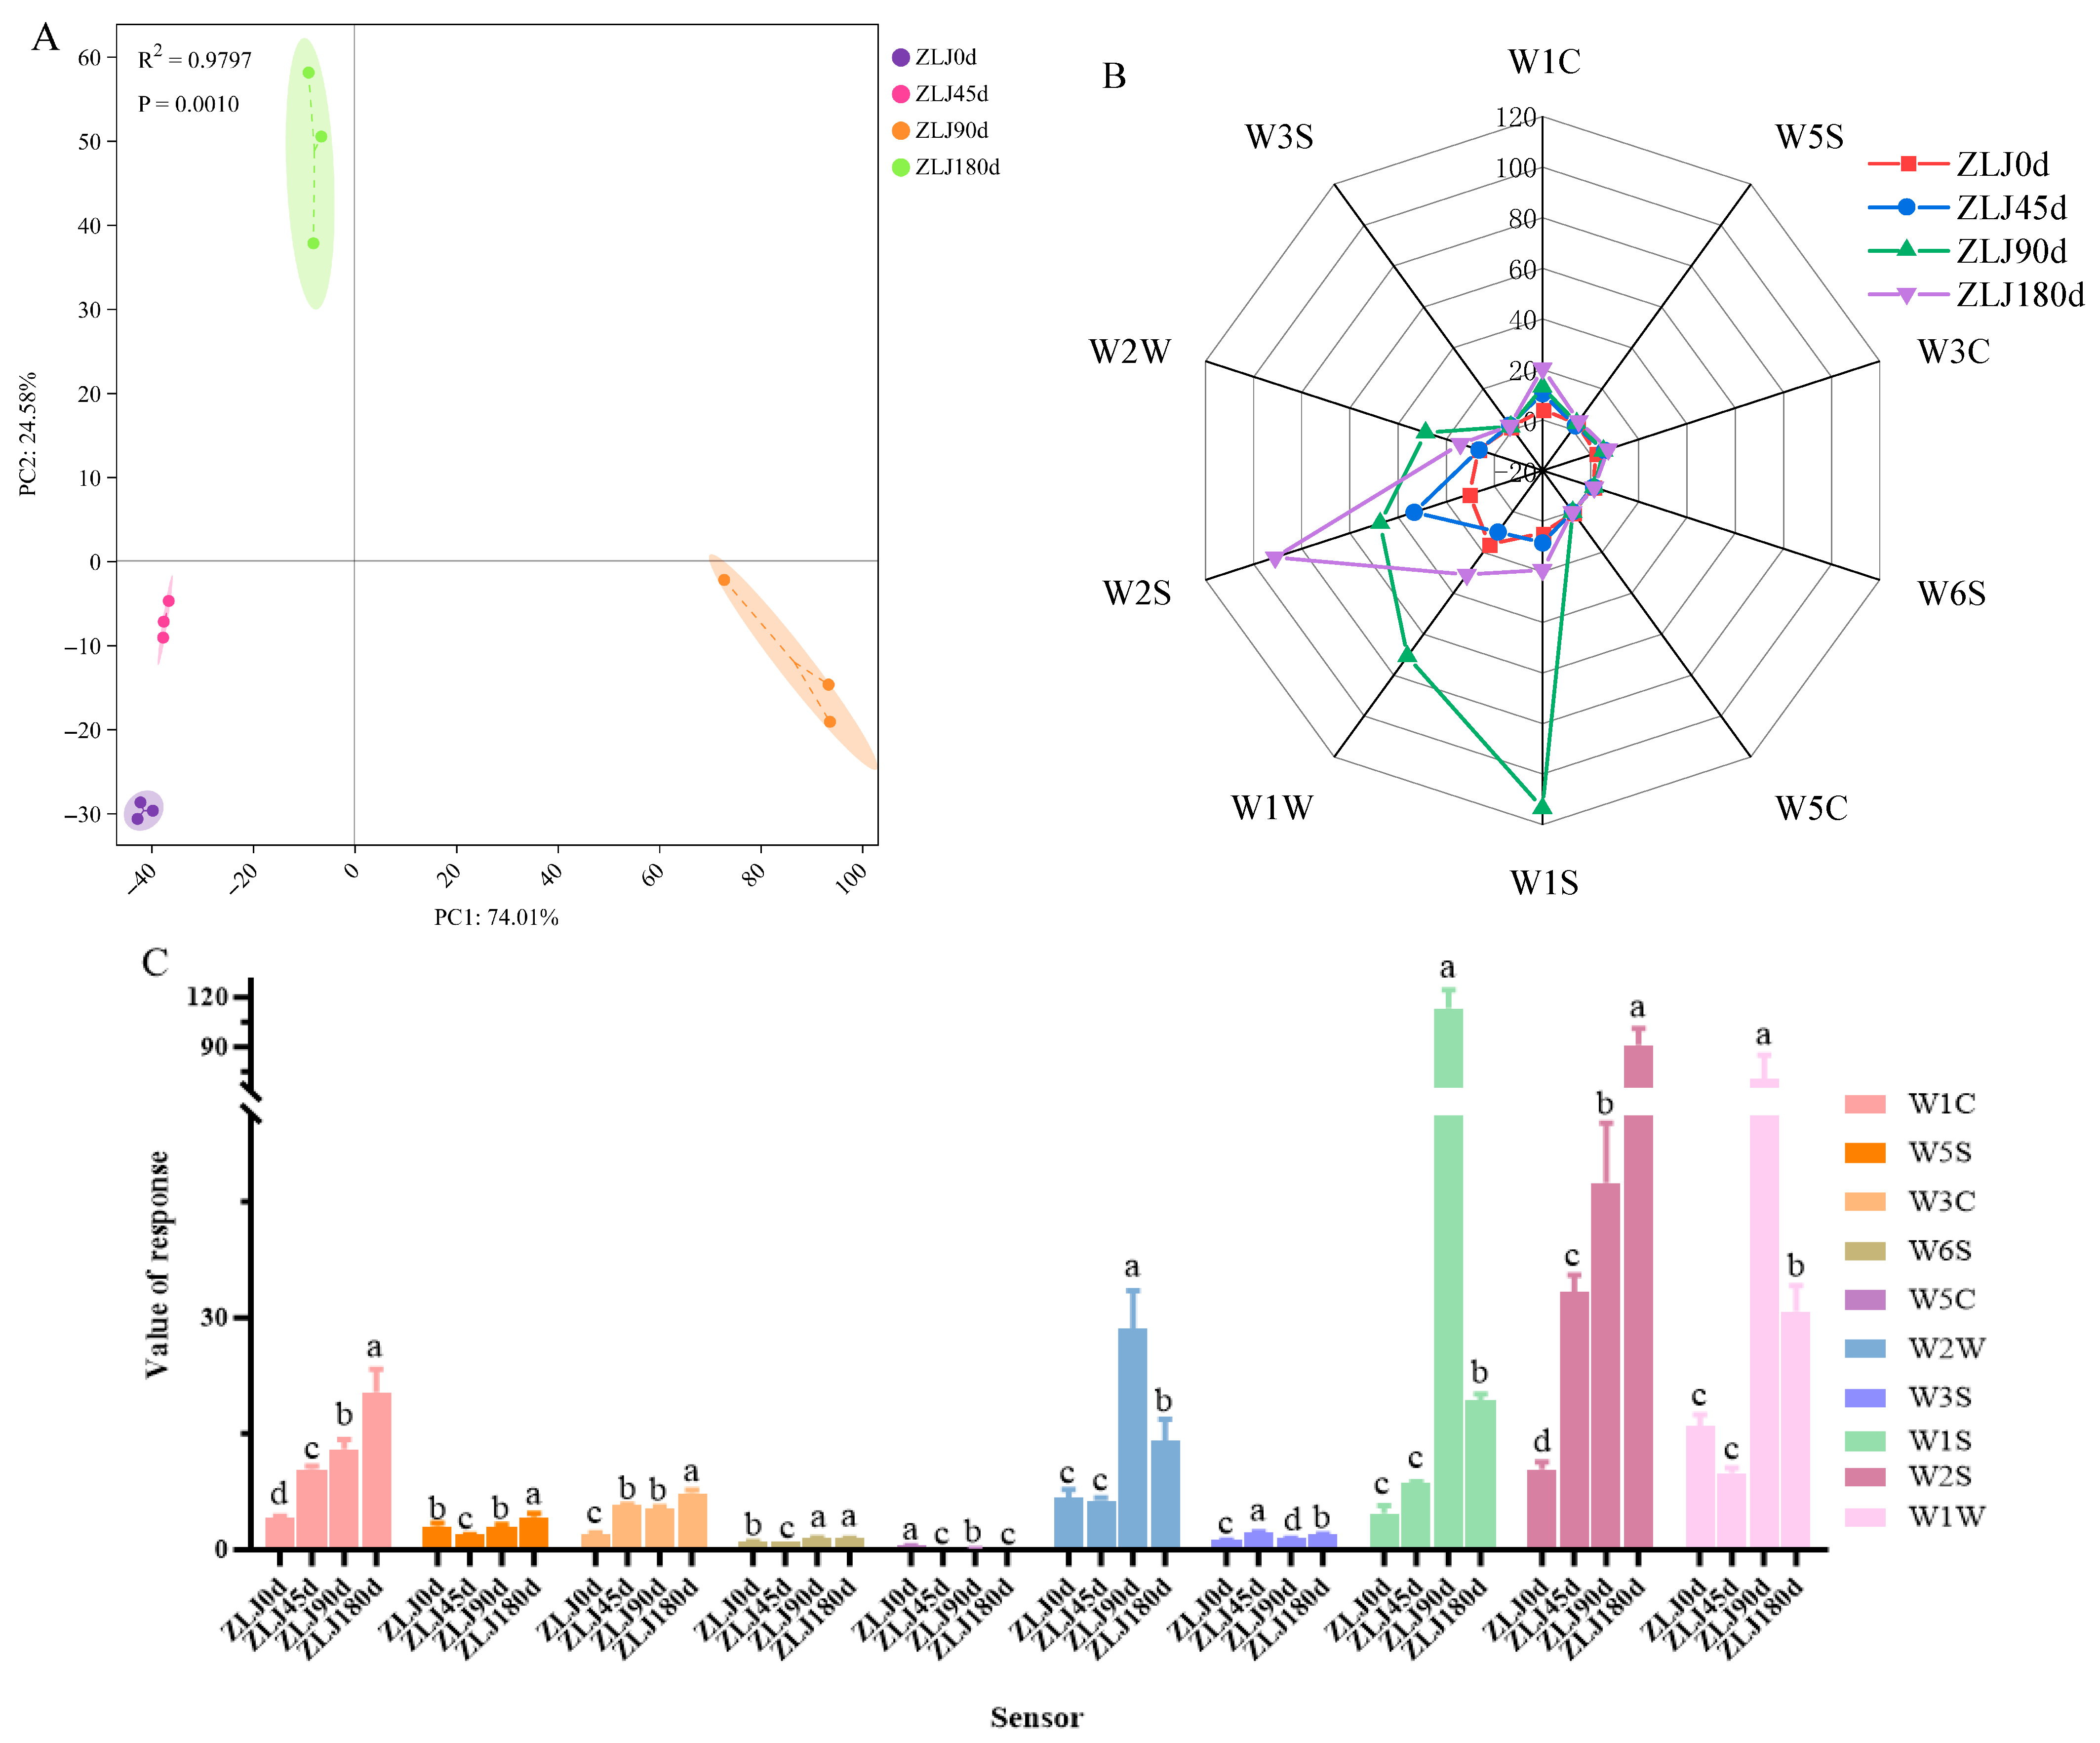
Figure 1. E-nose response data for different fermentation times: (A) principal component analysis score plot; (B) response value; (C) significance analysis. Letters (a–d) denote significant intergroup differences (a > b > c > d).
Fermentation 11 00479 g001
Figure 2. Changes in Physical and chemical properties during fermentation of ZLJ: (A) total acid and soluble sugar; (B) amino acid nitrogen. Letters (a–d) denote significant intergroup differences (a > b > c > d).
Fermentation 11 00479 g002
Figure 3. Organic acids during fermentation of ZLJ: (A) variation in each organic acid; (B) total organic acids, * indicates (p < 0.05), ** indicates (p < 0.01); (C) PCA.
Fermentation 11 00479 g003
Figure 4. OPLS-DA analysis and model validation: (A) OPLS-DA; (B) model validation (Note: the blue regression line at point Q 2 intersects the vertical axis (left side) at or below zero, indicating a reliable model).
Fermentation 11 00479 g004
Figure 5. DOAs between fermentation stages at ZLJ: (A) ZLJ0d vs. ZLJ15d; (B) ZLJ0d vs. ZLJ45d; (C) ZLJ0d vs. ZLJ90d; (D) ZLJ0d vs. ZLJ180d; (E) ZLJ15d vs. ZLJ45d; (F) ZLJ15d vs. ZLJ90d; (G) ZLJ15d vs. ZLJ180d; (H) ZLJ45d vs. ZLJ90d; (I) ZLJ45d vs. ZLJ180d; (J) ZLJ90d vs. ZLJ180d.
Fermentation 11 00479 g005
Figure 6. DOAs common to and unique to ZLJ between fermentation stages: (A) common and unique DOAs. Node color: indicates whether a sample participates in a specific intersection (gray: no; black: yes); Node connection: represents the samples sharing that intersection (B) changes in DOAs with fermentation time.
Fermentation 11 00479 g006
Figure 7. Correlation between physical and chemical indicators and DOAs. Note: * indicates significant correlation (p < 0.05); ** indicates highly significant correlation (p < 0.01).
Fermentation 11 00479 g007
Figure 8. Relationship between CAZymes, differential organic acids, and physicochemical indicators in the fermentation process of ZLJ: (A) Levels of CAZymes in ZLJ. (B) CAZymes Heatmap. The color scale indicates relative CAZymes abundance, with red denoting higher levels. (C) CCA plots of CAZymes and physicochemical indicators. (D) CCA plots of CAZymes and differential organic acids.
Fermentation 11 00479 g008
Figure 9. KEGG pathway enrichment of differential organic acids. Enrichment bubble plot. Bubble color shades indicate significant levels of enrichment, and size represents the number of differentially expressed substances in the pathway.
Fermentation 11 00479 g009
Table 1. E-nose sensors and their main application in PEN3.
Sensor NamePerformance DescriptionRepresentative Material Species
W1CSensitive to aromatic constituents, benzeneAromatic
W5SSensitive to nitrogen oxidesBroad range
W3CSensitive to aroma, ammoniaAromatic compounds
W6SMainly selective for hydridesHydrogen
W5CShort-chain alkane aromatic componentsArom-aliph
W1SBroad-methaneBroad-methane
W1WSensitive to sulfidesSulfur-organic
W2SSensitive to alcohols, aldehydes, and ketonesBroad -alcohol
W2WSensitive to aromatic ingredients and organic sulfidesSulph-chlor
W3SSensitive to long-chain alkanesMethane-aliph
Disclaimer/Publisher’s Note: The statements, opinions and data contained in all publications are solely those of the individual author(s) and contributor(s) and not of MDPI and/or the editor(s). MDPI and/or the editor(s) disclaim responsibility for any injury to people or property resulting from any ideas, methods, instructions or products referred to in the content.