Article

Anti-Obesity and Hepatoprotective Effects of Probiotic Goat Milk in Mice: Insights from Hepatic Proteomics

1
Centro de Referencia para Lactobacilos (CERELA-FML-FECIC-CONICET), San Miguel de Tucumán T4000, Argentina
2
Facultad de Ciencias de la Salud, Universidad del Norte Santo Tomás de Aquino (UNSTA), San Miguel de Tucumán T4000, Argentina
3
Facultad de Agronomía y Zootecnia, Universidad Nacional de Tucumán, San Miguel de Tucumán T4000, Argentina
*
Author to whom correspondence should be addressed.
Fermentation 2025, 11(7), 419; https://doi.org/10.3390/fermentation11070419
Submission received: 6 June 2025 / Revised: 16 July 2025 / Accepted: 17 July 2025 / Published: 20 July 2025

Abstract

Dietary administration of fermented goat milk (FGM) with the starter strain Lactobacillus delbrueckii subsp. indicus CRL1447 and supplemented with different functional cultures (FCs) of lactobacilli strains (FC1: Limosilactobacillus fermentum CRL1446 + Lactiplantibacillus paraplantarum CRL1449 + Lactiplantibacillus paraplantarum CRL1472; FC2: CRL1446 + CRL1449; FC3: CRL1446 + CRL1472; and FC4: CRL1449 + CRL1472) was investigated in mice fed a high-fat diet (HFD). FGM supplemented with different FCs, referred to as Probiotic Goat Milk (PGM), demonstrated significant anti-obesity activity by reducing body weight and improving blood lipid profiles in obese mice. The animals that received the PGM showed less fat infiltration in the hepatocytes compared to the obese mice fed FGM. Hepatic proteomics data show that HFD generally upregulates proteins involved in fatty acid oxidation and downregulates proteins implicated in lipid synthesis, whereas the administration of FGM supplemented with FC3 (PGM3) improves the proteomic profile. These results suggest that PGM exerts systemic metabolic effects through modulation of the gut–liver axis, highlighting its potential as a dietary strategy against obesity-related disorders.

1. Introduction

Obesity, characterized by excessive adipose tissue accumulation, is a multifactorial and chronic metabolic disease that has reached epidemic proportions worldwide [1]. Obesity is closely associated with insulin resistance, systemic inflammation, and a range of comorbidities, including metabolic-associated fatty liver disease (MAFLD) [2]. The liver plays a pivotal role in maintaining metabolic homeostasis, regulating lipid and glucose metabolism, detoxification, and protein synthesis. This organ is particularly affected by diet-induced obesity (DIO), undergoing profound molecular and functional changes [3,4].
In recent years, there has been growing interest in elucidating the molecular mechanisms linking obesity to liver dysfunction, with the goal of identifying early biomarkers and novel therapeutic targets [5]. While traditional biochemical and gene expression analyses have provided valuable insights, they are limited in their ability to capture the full complexity of protein dynamics. Proteomics, the large-scale study of proteins, provides a more comprehensive understanding of cellular processes by enabling the analysis of protein abundance, structure, post-translational modifications, and interactions [5]. Applying proteomic approaches in liver tissue allows us to investigate the molecular changes at a systems level that are induced by obesity and evaluate the effects of potential interventions [6].
Animal models, particularly mice, are essential tools in obesity research due to their genetic similarity to humans, well-characterized metabolic pathways, and controlled environmental conditions [7]. Diet-induced obesity (DIO) in mice mimics key features of human obesity, including insulin resistance, hepatic steatosis, and low-grade inflammation, making it a widely accepted model for studying metabolic disease [8]. Within this framework, proteomic analyses of liver tissue can reveal critical alterations in metabolic enzymes, stress response proteins, and signaling pathways that underlie disease progression [4].
A promising intervention for metabolic disorders is using probiotics and functional foods, such as fermented dairy products. These have been shown to influence gut microbiota composition, improve intestinal barrier function, and modulate systemic inflammation [9]. Emerging evidence suggests that their effects extend beyond the gut, impacting distant organs such as the liver through the gut–liver axis [10]. However, the precise molecular mechanisms by which probiotics exert protective effects on hepatic function, especially at the proteomic level, remain largely unexplored [11].
In this study, we evaluate the effect of a high-fat diet (HFD) and the administration of different formulations of PGM in metabolic parameters and hepatic proteomics in diet-induced obese mice. By linking proteomic data with metabolic and histological outcomes, this research aims to elucidate the potential role of functional fermented foods in modulating hepatic function and improving metabolic health, offering a molecular framework for the development of more effective dietary strategies for the management of obesity and its related comorbidities.

2. Materials and Methods

2.1. Bacterial Strains, Culture Conditions, and Formulation of Fermented Goat Milk (FGM)

This study utilized four lactobacilli strains obtained from the Culture Collection of the Centro de Referencia para Lactobacilos (CERELA-FML-FECIC-CONICET, Tucumán, Argentina): Lactobacillus delbrueckii subsp. indicus CRL1447 (CRL1447), Limosilactobacillus fermentum CRL1446 (CRL1446), and Lactiplantibacillus paraplantarum strains CRL1449 and CRL1472. These strains had been previously characterized for their probiotic and technological capabilities and were selected for in vivo evaluation using a mouse model of diet-induced obesity.
All strains were cultivated in de Man–Rogosa–Sharpe (MRS) broth at 37 °C under aerobic conditions for 18 h except for CRL1447, which was incubated at 42 °C due to its specific growth requirements. The following combinations were used to formulate four functional cultures (FCs): FC1 (CRL1446, CRL1449, CRL1472), FC2 (CRL1446 and CRL1449), FC3 (CRL1446 and CRL1472), and FC4 (CRL1449 and CRL1472). Each formulation was standardized to a final bacterial concentration of 1 × 10⁸ CFU/mL.
Fermented goat milk (FGM) was produced as described by Marquez et al. [12], with modifications. Commercial powdered goat milk (La Primera, Córdoba, Argentina) was reconstituted at 10% (w/v) in sterile distilled water, pasteurized in a water bath at 90 °C for 15 min, and subsequently cooled to 45 °C. The CRL1447 strain served as the starter culture. Cells harvested after 18 h of incubation in MRS were pelleted by centrifugation at 10,000 g for 10 min at 4 °C and added to the pasteurized milk at a 4% (v/v) inoculum level. Fermentation was carried out at 42 °C for 8–10 h. Following this step, each of the four FC formulations (FC1–FC4) was added to separate portions of the FGM, generating four probiotic variants referred to as PGM1-PGM4. The FGM without added FC served as a non-probiotic control.

2.2. Animals, Diets, and Experimental Design

Thirty-six adult male C57BL/6 mice were obtained from a closed, randomly bred colony maintained at CERELA. After a one-week acclimatization period, the animals were randomly divided into six experimental groups (n = 6 per group) and subjected to different dietary interventions for a duration of ten weeks. The first two experimental groups were distributed as follows: (a) Control + FGM: animals received a standard diet (SD) along with FGM; and (b) Obese + FGM: animals were fed a high-fat diet (HFD) and FGM. In addition, four experimental groups were administered the HFD together with FGM containing one of the FCs: (c) Obese + PGM1: supplemented with FC1; (d) Obese + PGM2: supplemented with FC2; (e) Obese + PGM3: supplemented with FC3; and (f) Obese + PGM4: supplemented with FC4.
The energy content of the diets was 5.154 kcal/g for the HFD and 3.10 kcal/g for the SD. FGM (control) and PGM formulations (PGM1–PGM4) were administered twice daily, at 12-h intervals. The solid diet was refreshed twice a week throughout the experimental period.

2.3. Body Weight Monitoring and Sample Collection

Mice body weight (BW) was recorded on a weekly basis throughout this study. Body weight gain (BWG) was calculated as the difference between final and initial body weights (BWG = final BW − initial BW). At the conclusion of the experiment, animals underwent a 12-h fasting period, after which they were anesthetized by intraperitoneal injection of xylazine hydrochloride (5 mg/kg) and ketamine hydrochloride (150 mg/kg) (Richmond División Veterinaria SA, Buenos Aires, Argentina). Blood was obtained by cardiac puncture, transferred into collection tubes, and centrifuged to obtain plasma, which was subsequently stored at −20 °C for further analysis. In addition, the spleen and liver were dissected and collected. The relative liver weight was calculated as (liver weight [g]/body weight [g]) × 100 [13].

2.4. Metabolic and Histological Aznalyses

Plasma concentrations of total cholesterol (TC), high-density lipoprotein cholesterol (HDL-c), low-density lipoprotein cholesterol (LDL-c), triglycerides (TG), glucose, alanine aminotransferase (ALT), and aspartate aminotransferase (AST) were determined using enzymatic colorimetric methods with commercial diagnostic kits (Wiener Lab, Rosario, Argentina). The triglyceride–glucose (TyG) index was calculated following the equation Ln [TG (mg/dL) × glucose (mg/dL)/2], as described by Low et al. [14]. To assess atherogenic risk, the following markers were calculated: LDL-c/HDL-c ratio, atherogenic coefficient (AC = (TC − HDL-c)/HDL-c), and plasma atherogenic index (PAI = log[TG/HDL-c]), according to Sasikala & Goswami [15]. Liver tissues were fixed in 10% (v/v) neutral buffered formalin, dehydrated through graded ethanol and xylene, and embedded in paraffin. Sections of 3–5 μm thickness were placed on glass slides, stained with hematoxylin and eosin, and examined microscopically using a Carl Zeiss Axio Scope.A1 light microscope.

2.5. Proteomic Analysis

2.5.1. Protein Extraction and Sample Preparation

Total protein was extracted from liver tissue following the methodology described by Yang et al. [16], with slight modifications. Briefly, 200 mg of frozen liver tissue were incubated on ice for 30 min in 800 μL of lysis buffer (20 mM Tris-HCl, pH 7.6; 10 mM NaCl; 0.5 mM SDS; 1 mM PMSF), supplemented with a protease inhibitor cocktail. During incubation, samples were vortexed every 10 min. Samples were sonicated using a Branson SLPt sonicator with 6 pulses of 10 s each at power setting 5 to reduce viscosity. Tissue debris was removed by centrifugation at 12,000 rpm for 20 min. Protein extractions were performed in triplicate for each biological sample to ensure technical reproducibility. All extractions were performed in triplicate per biological sample. Protein content was quantified using a bicinchoninic acid (BCA) assay (Pierce™ BCA Protein Assay Kit, Thermo Scientific, Rockford, IL, USA).

2.5.2. Protein Identification and Mass Spectrometry Data Analysis

A total of 50 µg of each protein extract was treated with 20 mM dithiothreitol for reduction and subsequently alkylated with 50 mM iodoacetamide. Proteins were digested overnight with sequencing-grade modified trypsin (Promega, V5111,Madison, WI, USA), and peptides were purified using C18 Zip-Tip columns (Merck Millipore). Peptides were analyzed using a nano high-performance liquid chromatography system (EASY-nLC 1000, Thermo Scientific, Bremen, Germany) coupled to a Q-Exactive mass spectrometer equipped with an Orbitrap analyzer and high-energy collision-induced dissociation (HCD) cell (Thermo Scientific, Bremen, Germany), following the protocol by La Greca et al. [17].
Mass spectrometry data were processed using Proteome Discoverer v2.2 (Thermo Scientific, Bremen, Germany). Protein identification and area-based quantification were performed against the Mus musculus (C57BL/6J strain) database from UniProt (UP000000589). The area under the curve of the three most intense peptides was used to estimate protein abundance. Perseus software (v1.6.6.0) was employed for statistical comparison of normalized area values. Proteins with log2 fold change > |1| and p-value < 0.05 were considered significantly differentially abundant [17]. The dataset was deposited in ProteomeXchange under the identifier PXD050536.

2.5.3. Bioinformatics Analysis

Functional classification of the identified proteins was performed using UniProt (https://www.uniprot.org/accessed on 9 May 2022), while orthologous group assignment and functional annotation were carried out using the EggNOG-mapper v2 tool (http://eggnog-mapper.embl.de/ accessed on 16 May 2022), which utilizes the EggNOG database to identify Clusters of Orthologous Groups (COGs), Gene Ontology (GO) terms, and KEGG pathways based on evolutionary relationships. Protein–protein interaction networks were constructed using the STRING database, with all prediction sources enabled and a minimum confidence score threshold set at 0.4 [18].

2.6. Statistical Analysis

All statistical procedures were carried out using Infostat/L® 2019 software (Universidad Nacional de Córdoba, Córdoba, Argentina). Graphs and visualizations were generated using GraphPad Prism version 9.0 (GraphPad Software, Inc., San Diego, CA, USA). After confirming normal distribution, one-way analysis of variance (ANOVA) followed by Tukey’s multiple comparison test was applied. A p-value threshold of <0.05 was used to determine statistical significance.

3. Results

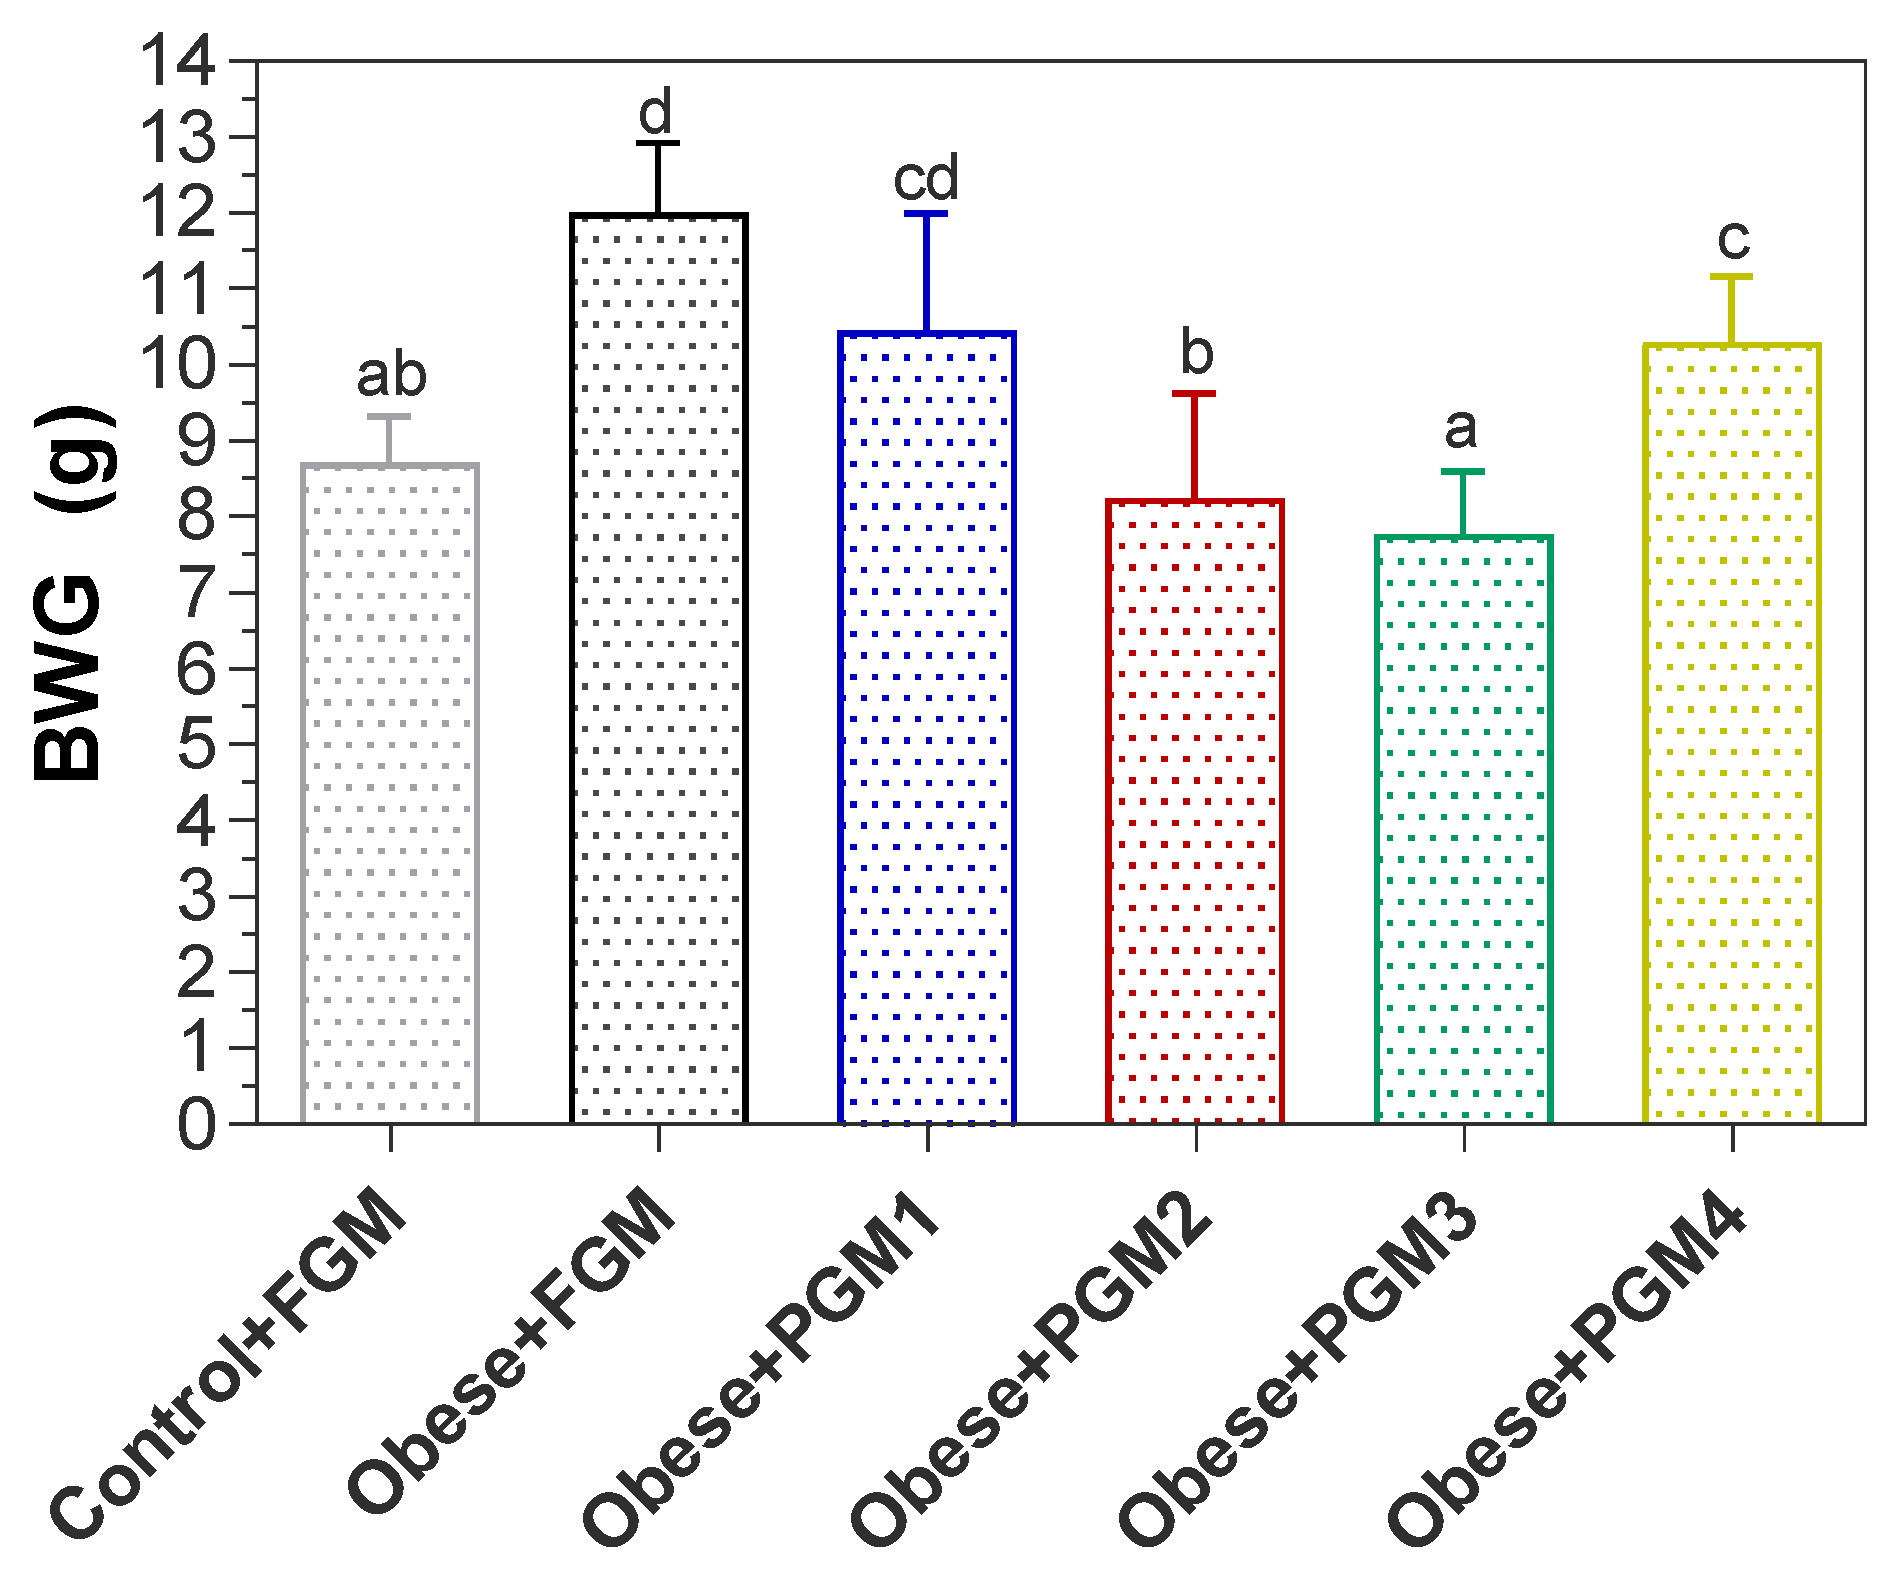
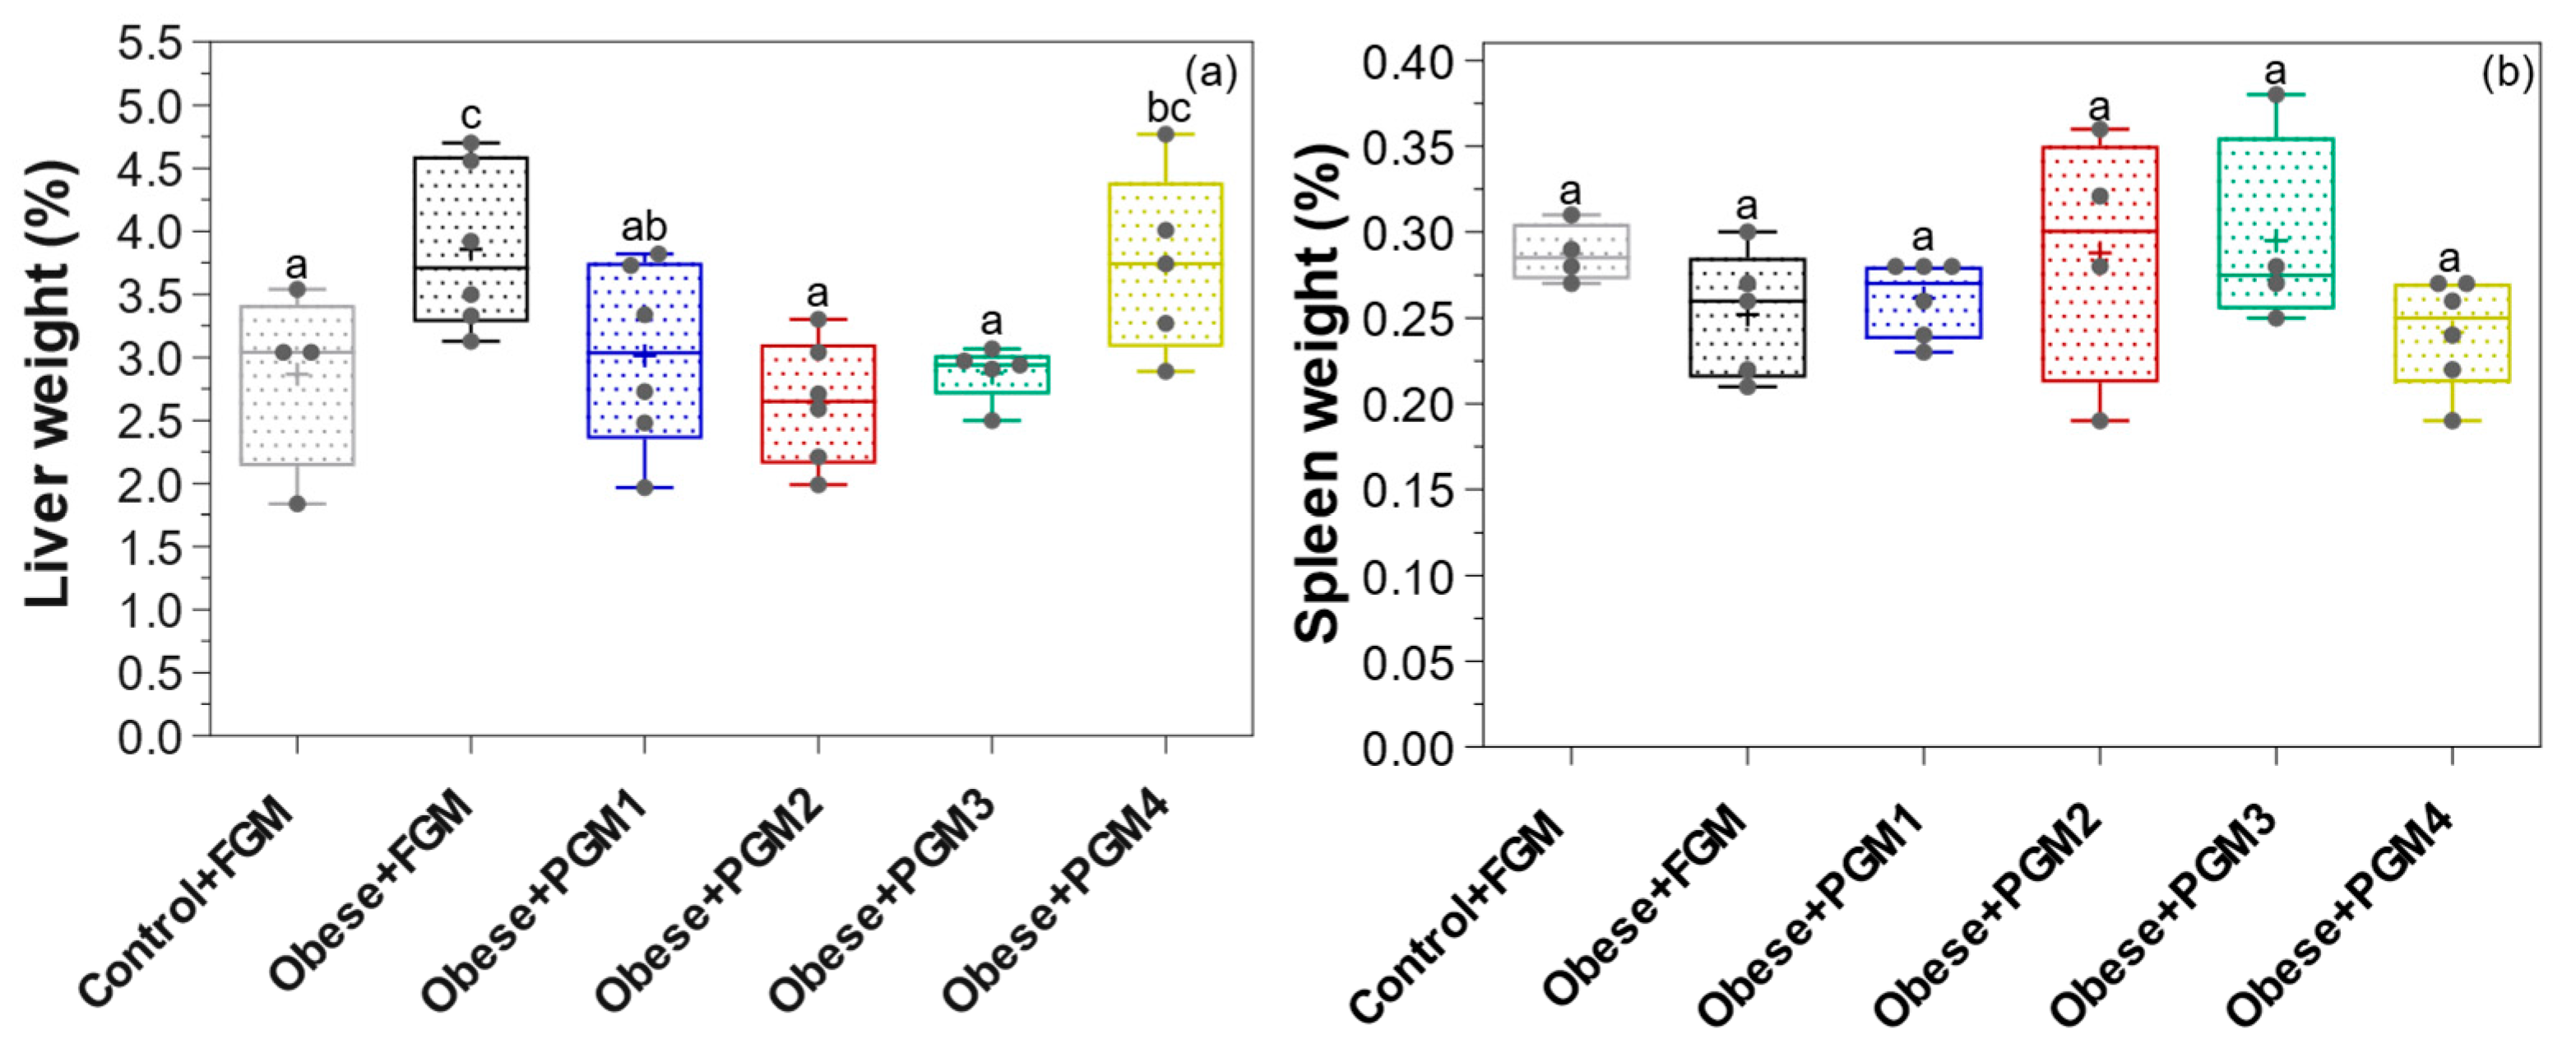
3.1. Effect of PGM on Body, Liver, and Spleen Weight

Following a ten-week dietary intervention, the Obese + FGM group exhibited a 37% greater body weight gain (BWG) compared to the Control + FGM group. Notably, the Obese + PGM2 and Obese + PGM3 groups demonstrated significant reductions in BWG by 30% and 34%, respectively, relative to the Obese + FGM group. In contrast, BWG in the Obese + PGM1 and Obese + PGM4 groups did not differ significantly from that of the Obese + FGM group, indicating that these interventions did not attenuate weight gain under the experimental conditions (Figure 1).
After the sacrifice, the spleen and liver were extracted. No macroscopic alterations in shape or color were detected; however, variations in liver weight were observed (Figure 2a), which warranted subsequent histological analysis. No statistically significant differences were found among the experimental groups (Figure 2b) regarding relative spleen weight. PGM2 and PGM3 induced a significant reduction in relative liver weight compared to the Obese + FGM group.

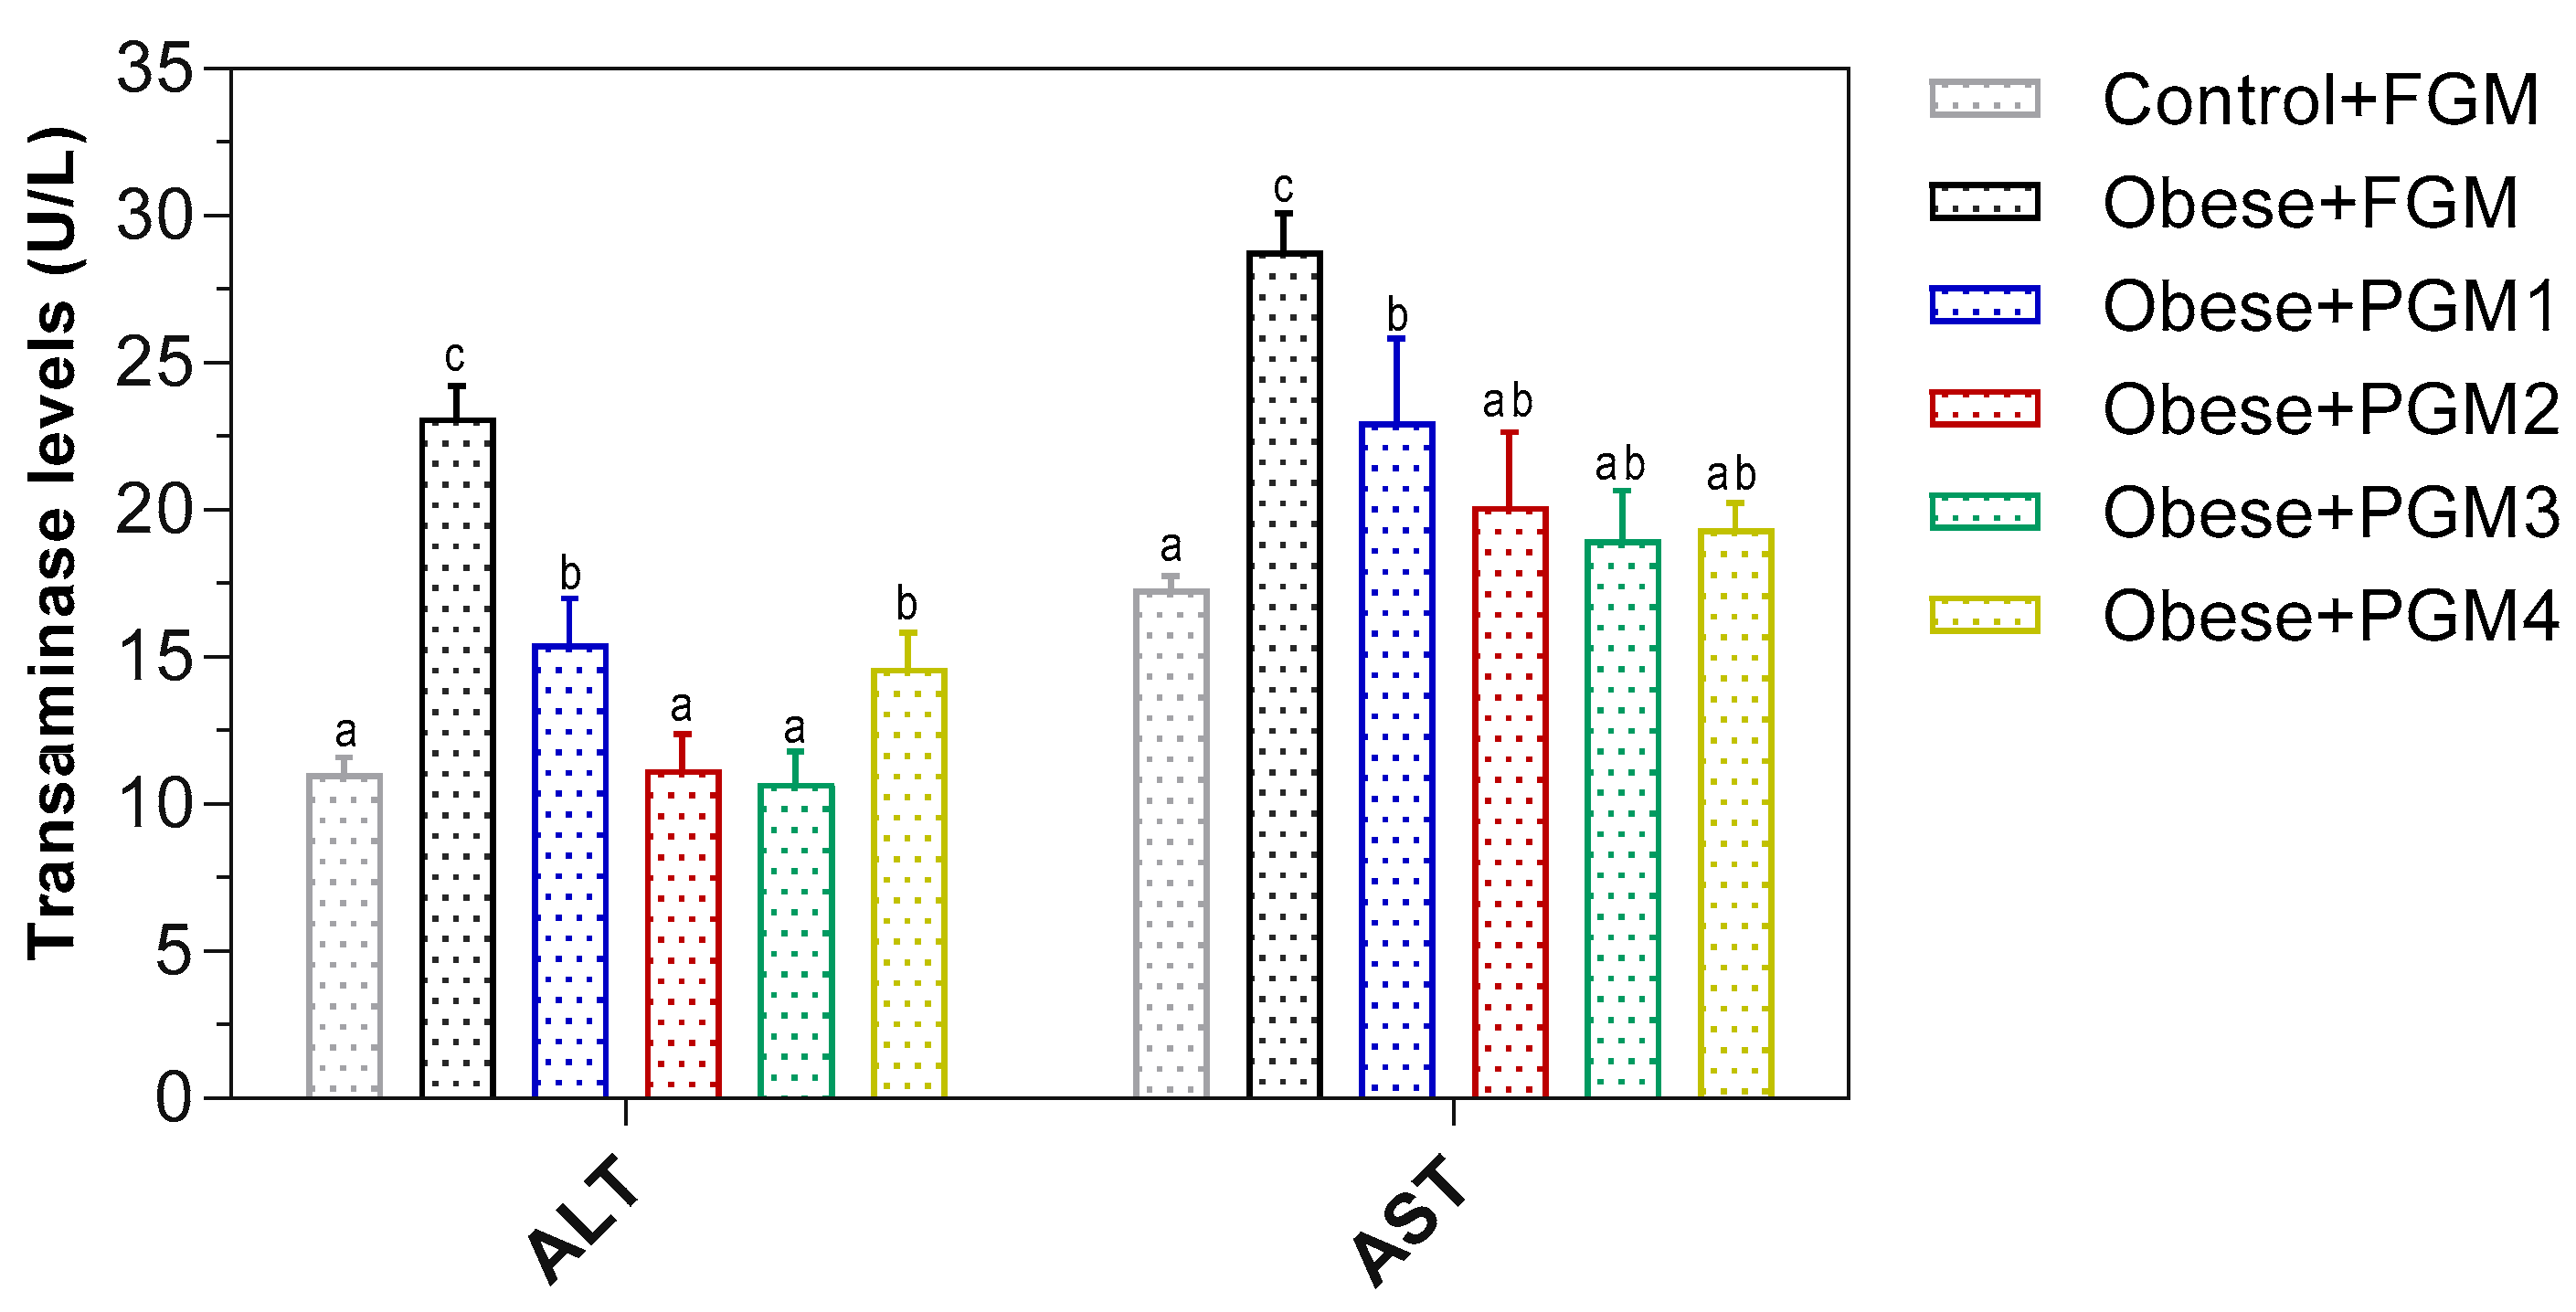
3.2. Evaluation of PGM on Transaminase Activities and the Structure of Hepatocytes in Mice

Elevated levels of alanine aminotransferase (ALT) and aspartate aminotransferase (AST) commonly indicate hepatic injury. In the Obese + FGM group, plasma ALT and AST activities were increased by approximately 1.6-fold relative to the Control + FGM group. Administration of PGM3 markedly reduced both ALT and AST activities. While ALT levels were restored to values comparable to those in the Control + FGM group, AST levels were significantly decreased but remained slightly elevated compared to Control + FGM (Figure 3).
Hepatic histopathological analysis revealed a normal structure of liver parenchyma in mice from the Control + FGM group (Figure 4a). In contrast, the Obese + FGM group exhibited hepatocytes with extensive lipid droplet accumulation and hepatocellular binucleation (Figure 4b). The Obese + PGM2 and Obese + PGM3 groups (Figure 4d,e) showed markedly reduced lipid accumulation, with improved hepatic architecture compared to Obese + FGM. The Obese + PGM1 group (Figure 4c) displayed moderate fat accumulation and cellular alterations, while the Obese + PGM4 group (Figure 4f) exhibited a heterogeneous pattern with partial improvement in hepatic morphology.

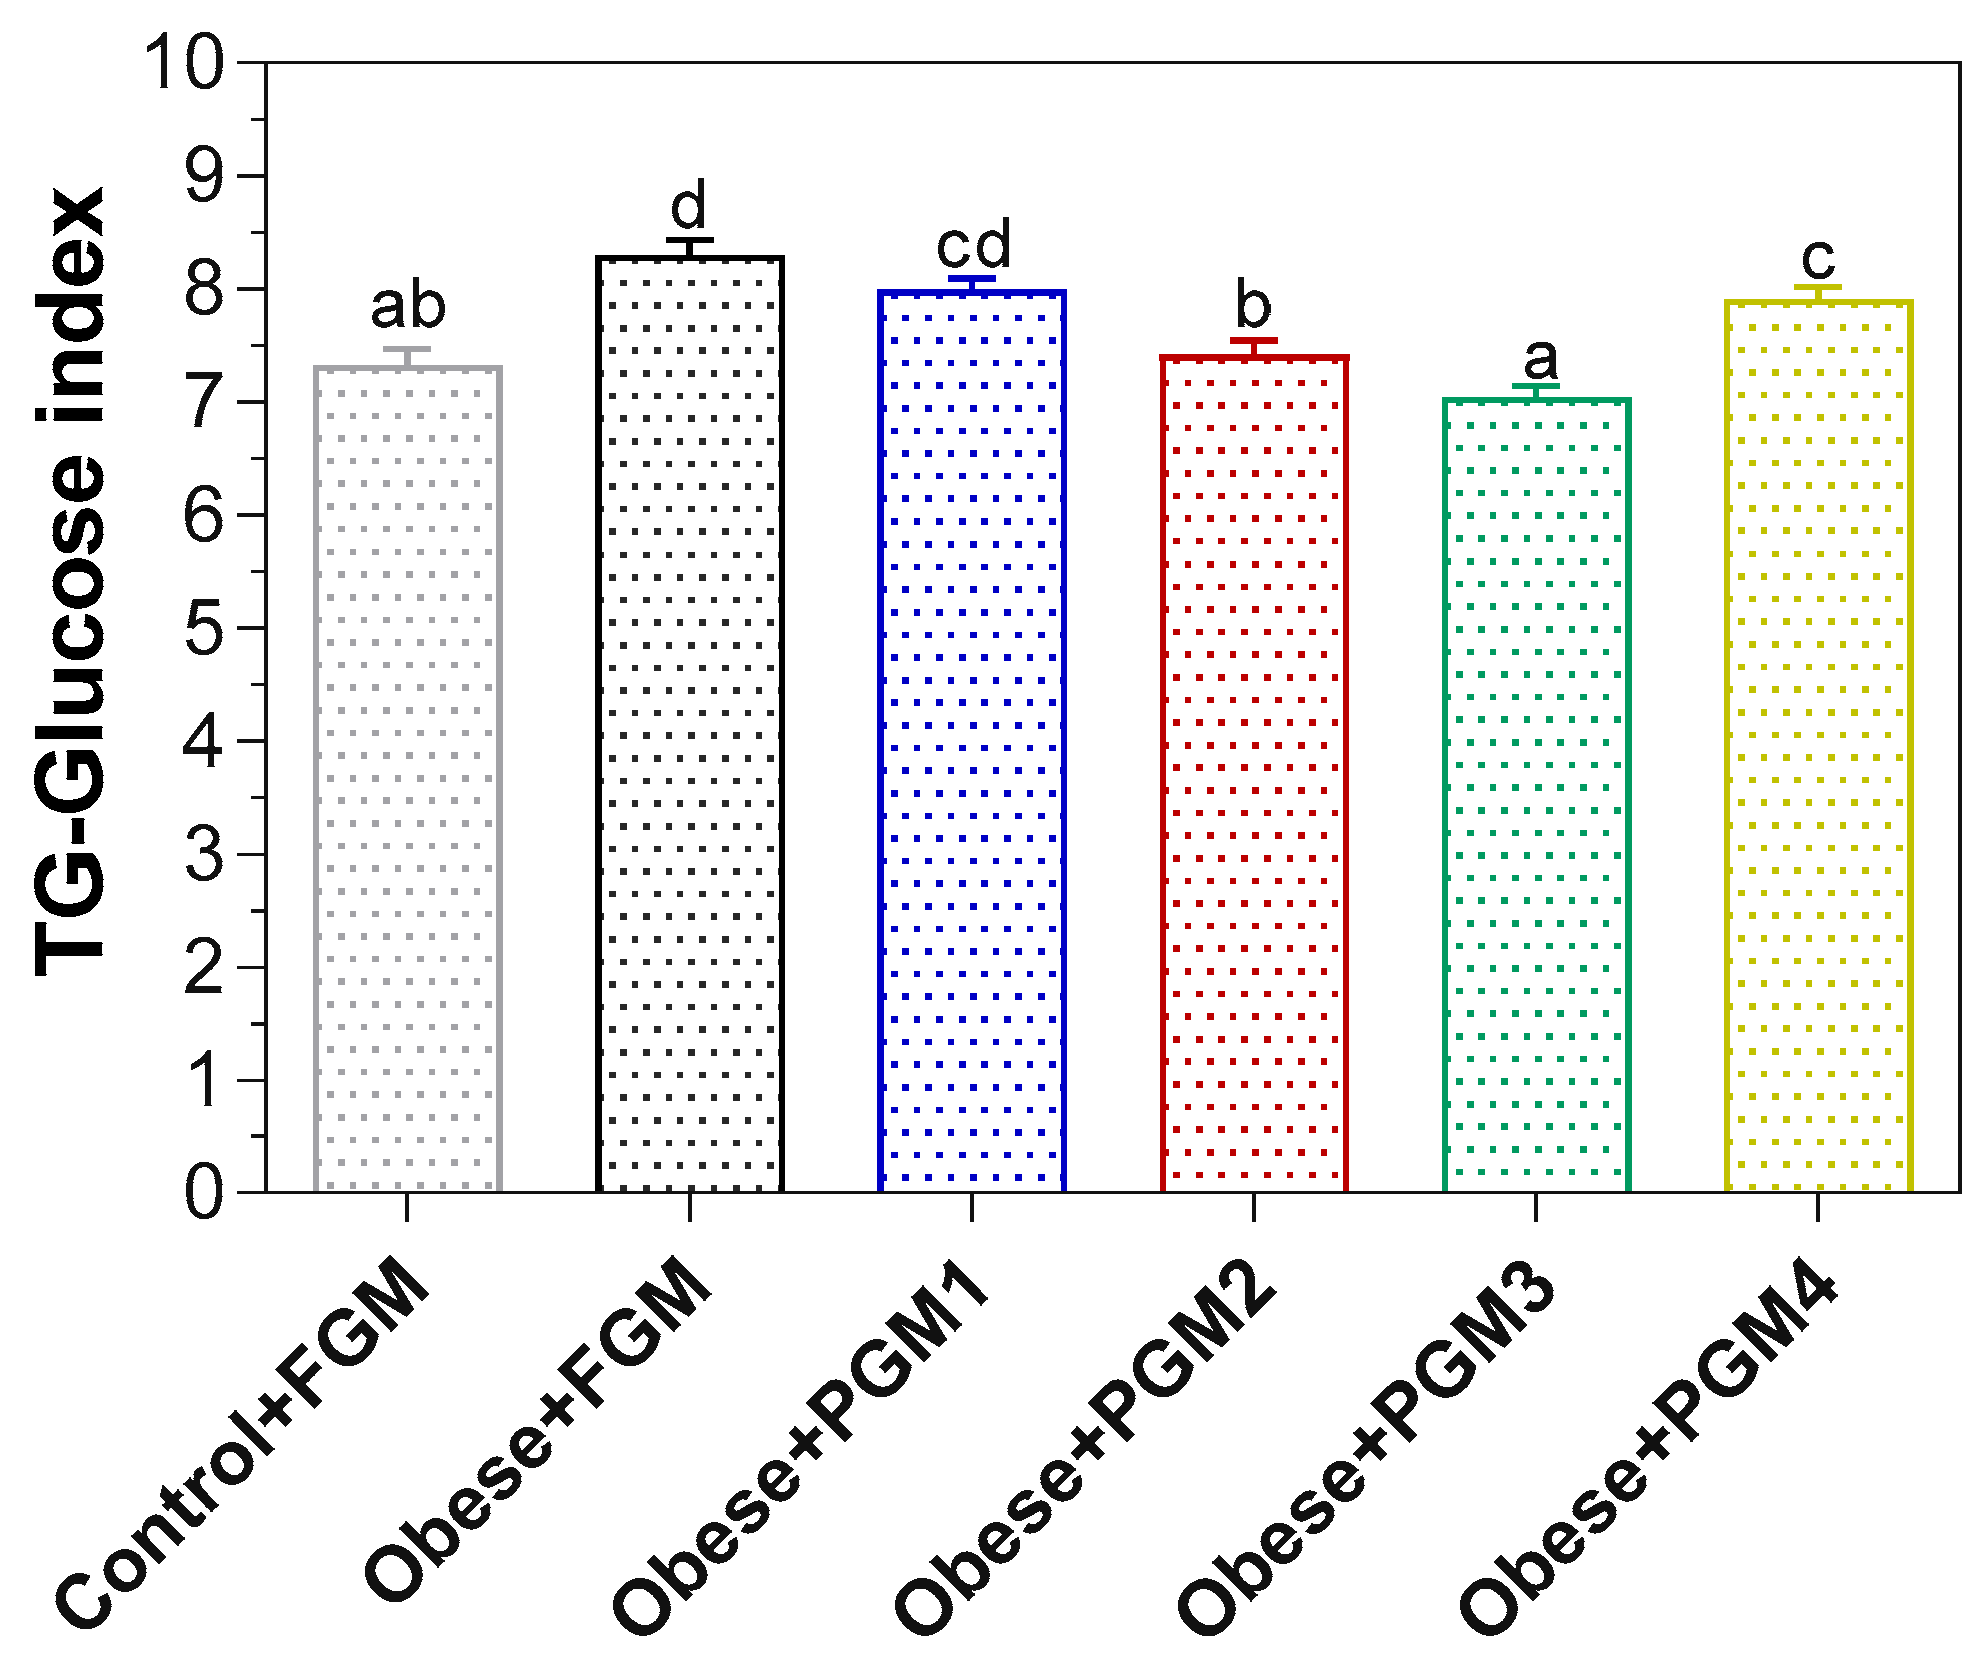
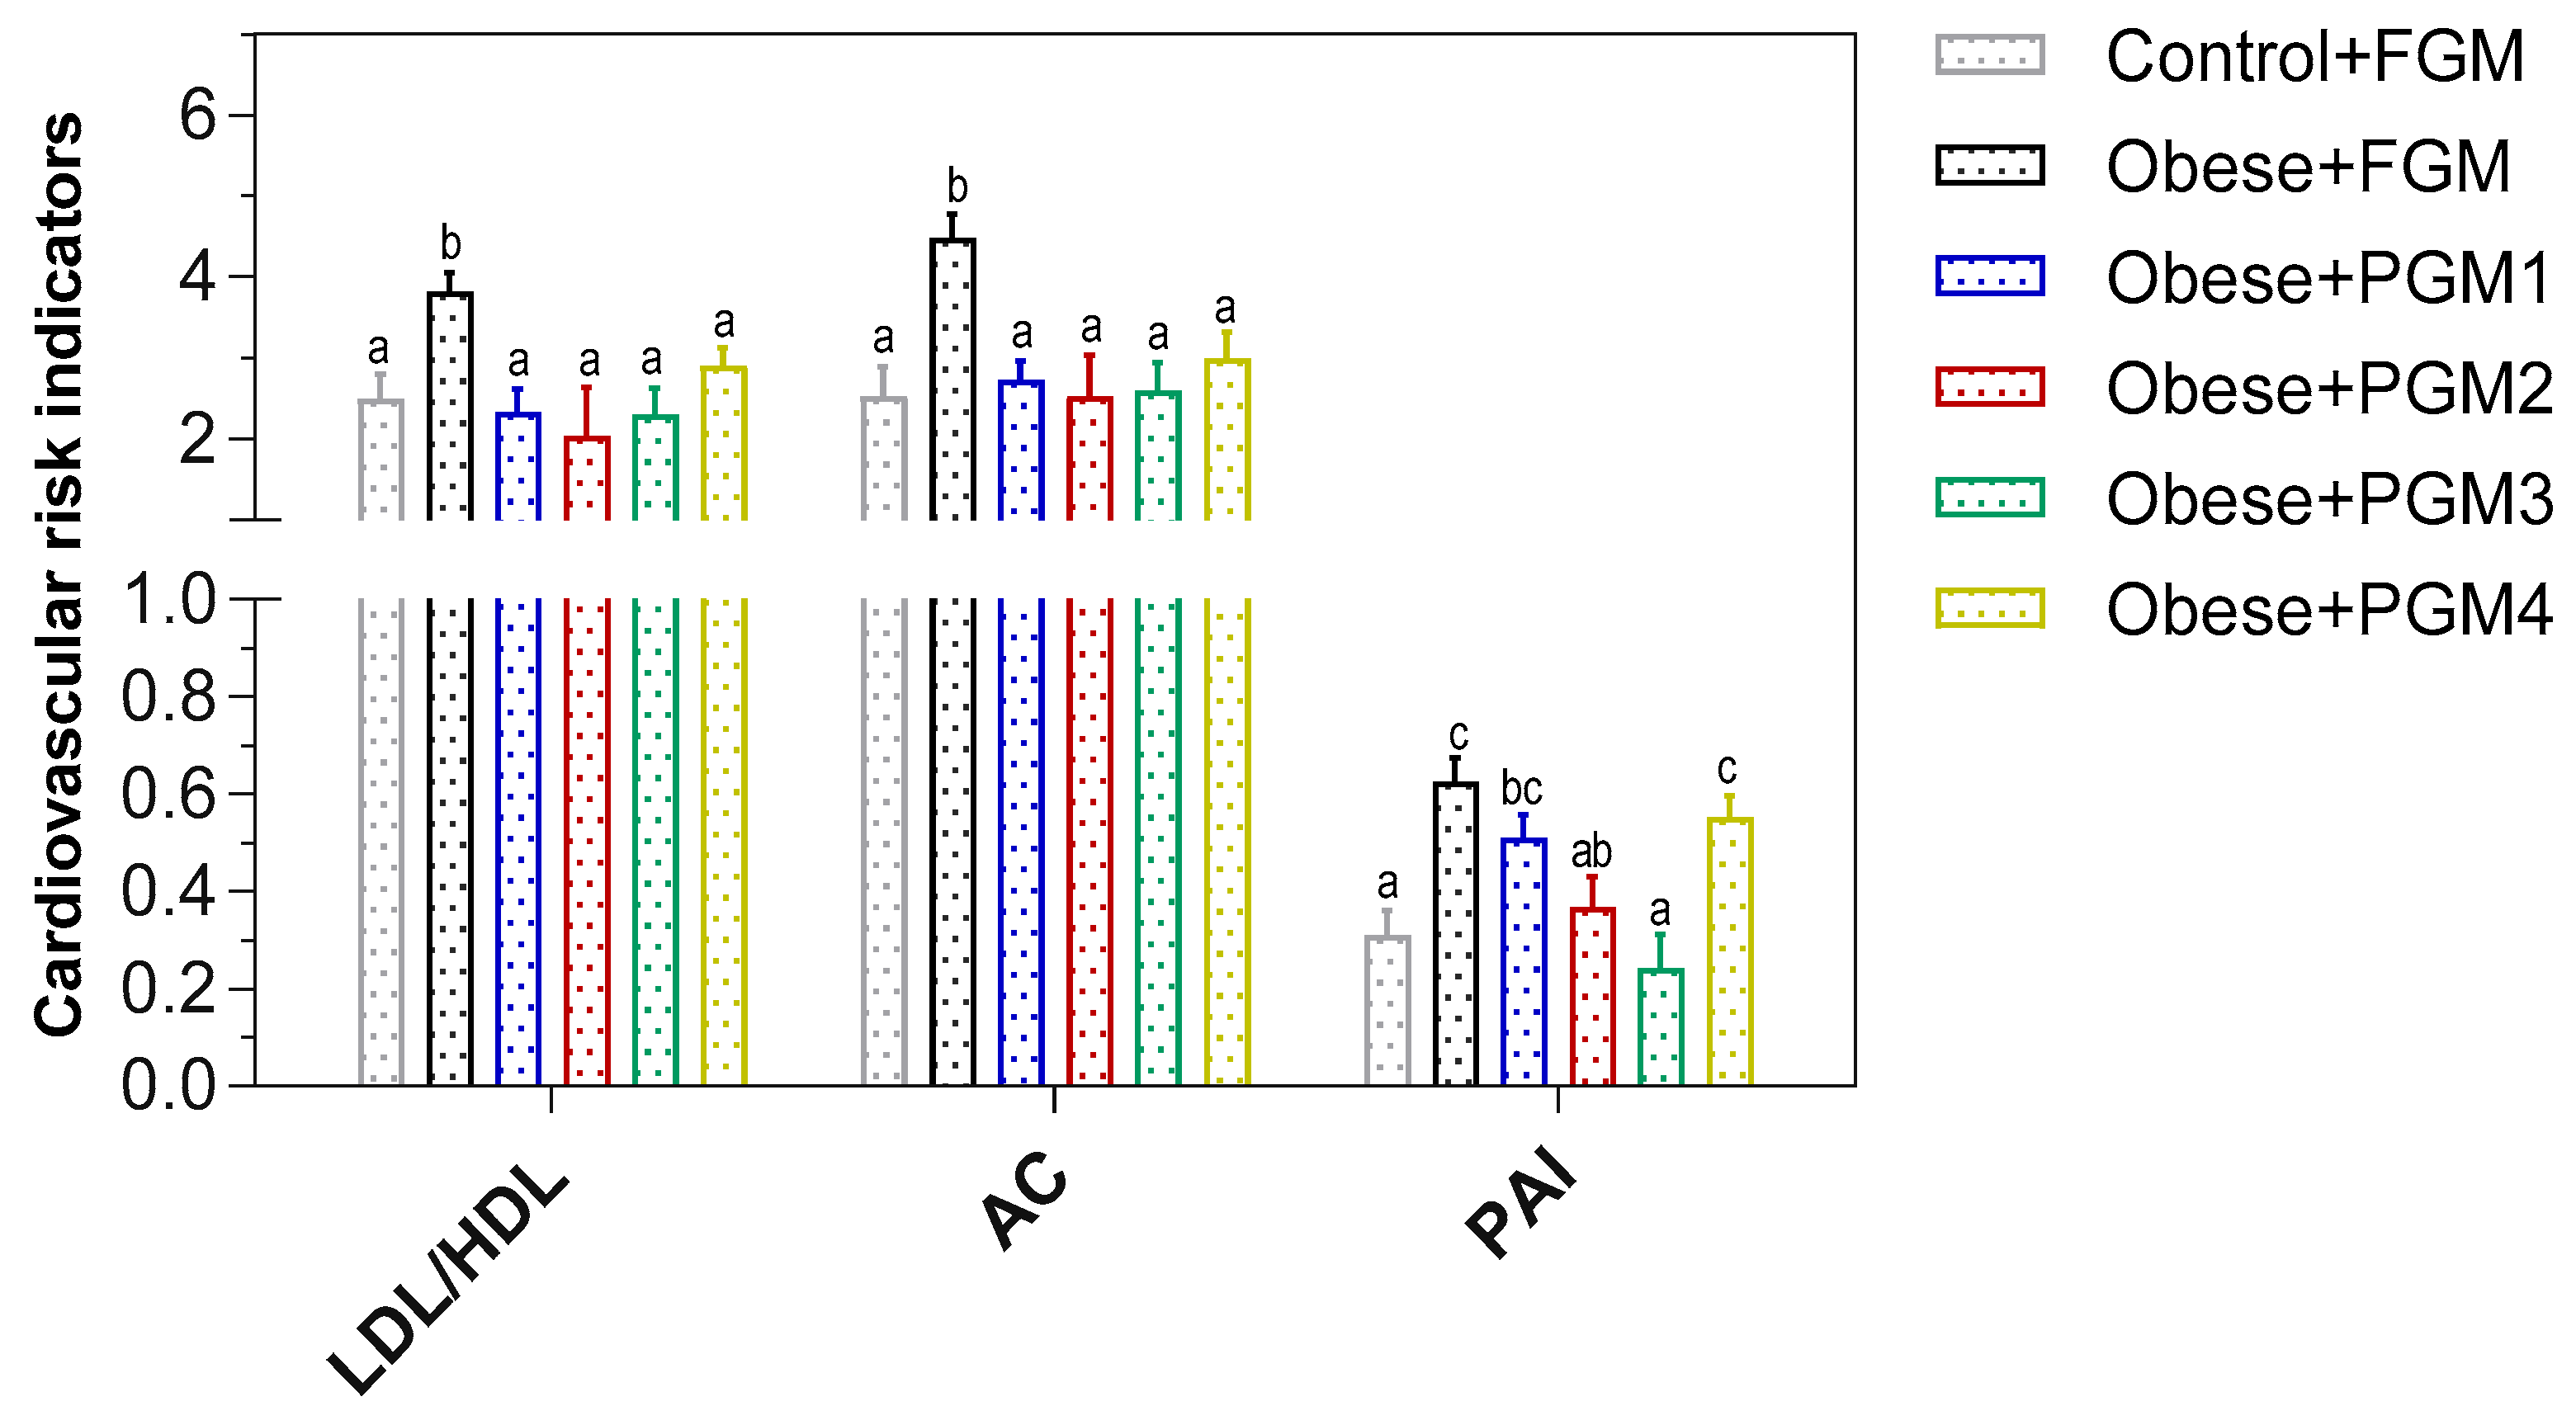
3.3. Effect of Administration of PGM on TG/Glucose Index, Lipid Profile, and Cardiovascular Risk Indicators

The triglyceride–glucose (TyG) index has been widely validated in the literature as a reliable surrogate marker of insulin resistance due to its strong correlation with the HOMA-IR index, which is the standard measure of insulin resistance [19,20,21]. As presented in Figure 5, the TG–glucose index in the Obese group was 8.3, whereas it was 15% lower in the Control + FGM group. Administration of PGM2 and PGM3 led to values that approximated those observed in the Control + FGM group. This index provides a reliable estimate of perturbations in glucose metabolism.
Compared to the Control + FGM group, TG levels were significantly elevated—nearly 2-fold—in the Obese + FGM group. Administration of PGM3 resulted in a significant 34% reduction in TG levels compared to the Obese + FGM group. TG concentrations in the Obese + PGM1, Obese + PGM2, and Obese + PGM4 groups did not differ significantly from those in the Obese + FGM group (Table 1). TC levels were significantly increased by 18% in the Obese + FGM group compared to the Control + FGM group. No significant differences in total cholesterol were observed among the treatment groups relative to the Obese + FGM group. LDL-c levels were comparable across all experimental groups. HDL-c levels were 28% lower in the Obese + FGM group compared to the Control + FGM group. All treatment groups exhibited higher HDL-c levels than the Control + FGM group (Table 1).
Cardiovascular risk indicators (CRI) were calculated based on the plasma lipid profiles (Figure 6). Compared to the Control + FGM group, the LDL/HDL ratio increased 1.5-fold in the Obese + FGM group. Treatment with the various supplemented PGM formulations reduced this ratio to levels comparable to those observed in the Control + FGM group. The atherogenic coefficient, calculated as (TC − HDL)/HDL, was 1.8 times higher in the Obese + FGM group relative to the Control + FGM group. This parameter also returned to baseline levels following administration of the supplemented FGM treatments. The plasma atherogenic index, defined as log(TG/HDL), was 2-fold higher in the Obese + FGM group compared to the Control + FGM group. Notably, PGM2 and PGM3 treatments reduced this index by 41% and 62%, respectively, relative to the Obese + FGM group.

3.4. Evaluation of Liver Functionality by Proteomic Analysis

Proteomic analysis was conducted on liver samples from mice in the Control + FGM, Obese + FGM, and Obese + PGM3 groups. Gene annotations from the Mus musculus (strain C57BL/6J) genome were utilized to identify genes encoding the significantly expressed proteins in the three experimental groups.

3.4.1. Quantitative Analysis of Proteins in Livers of Mice Fed HFD Supplemented with PGM3

A Venn diagram analysis was performed to identify common or specific proteins across the different experimental groups. As shown in Figure 7, 39 proteins were differentially expressed in the livers of Control and Obese mice fed with PGM3 compared to the livers in the Obese + FGM group. Of these, 14 proteins were uniquely differentially expressed in control mice, while 18 were specific to the Obese + PGM3 group. The remaining seven proteins were shared between both conditions.
Most of the identified proteins were assigned to one main functional category based on available annotation data (EggNOG, UniProt, accessed on 23 May 2022), even though some proteins are known to be involved in multiple cellular processes. These categories included metabolism of amino acids, lipids, carbohydrates, proteins, and coenzymes; signal transduction; defense mechanisms; transport; post-translational modification; transcription and translation; energy production and conversion; cell cycle control; RNA processing and modification; extracellular structure; unknown or uncharacterized functions; and others (e.g., cytoskeleton organization, chromatin structure, pheromone binding, and reproductive processes).

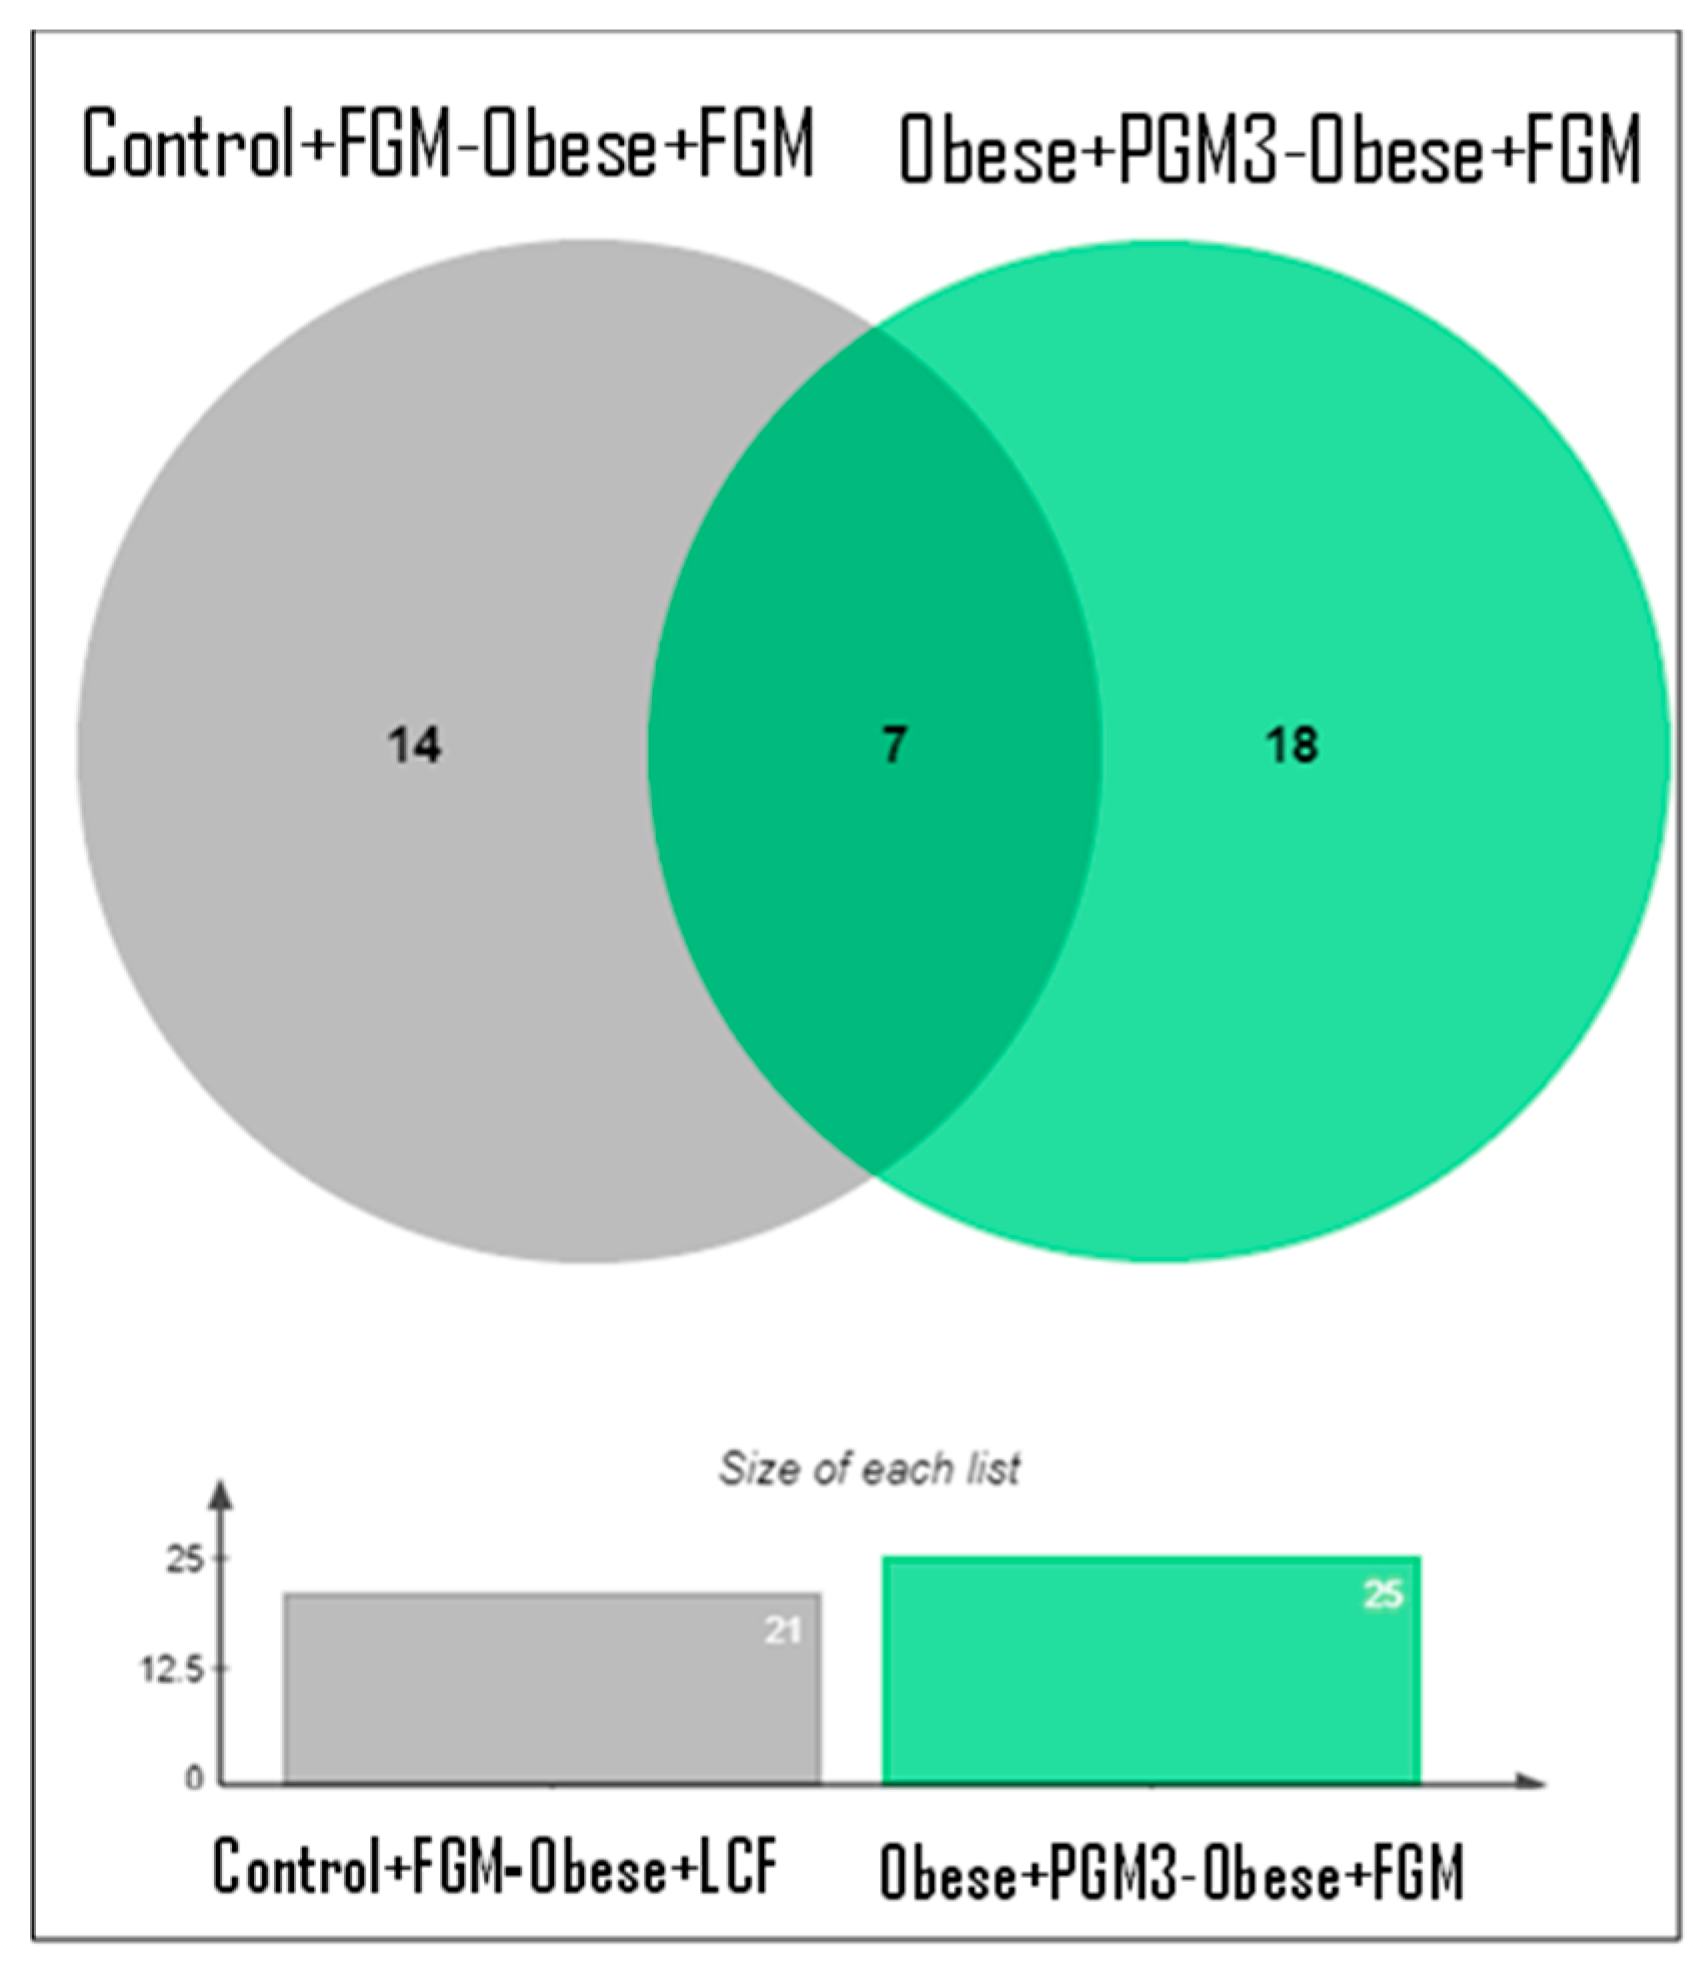
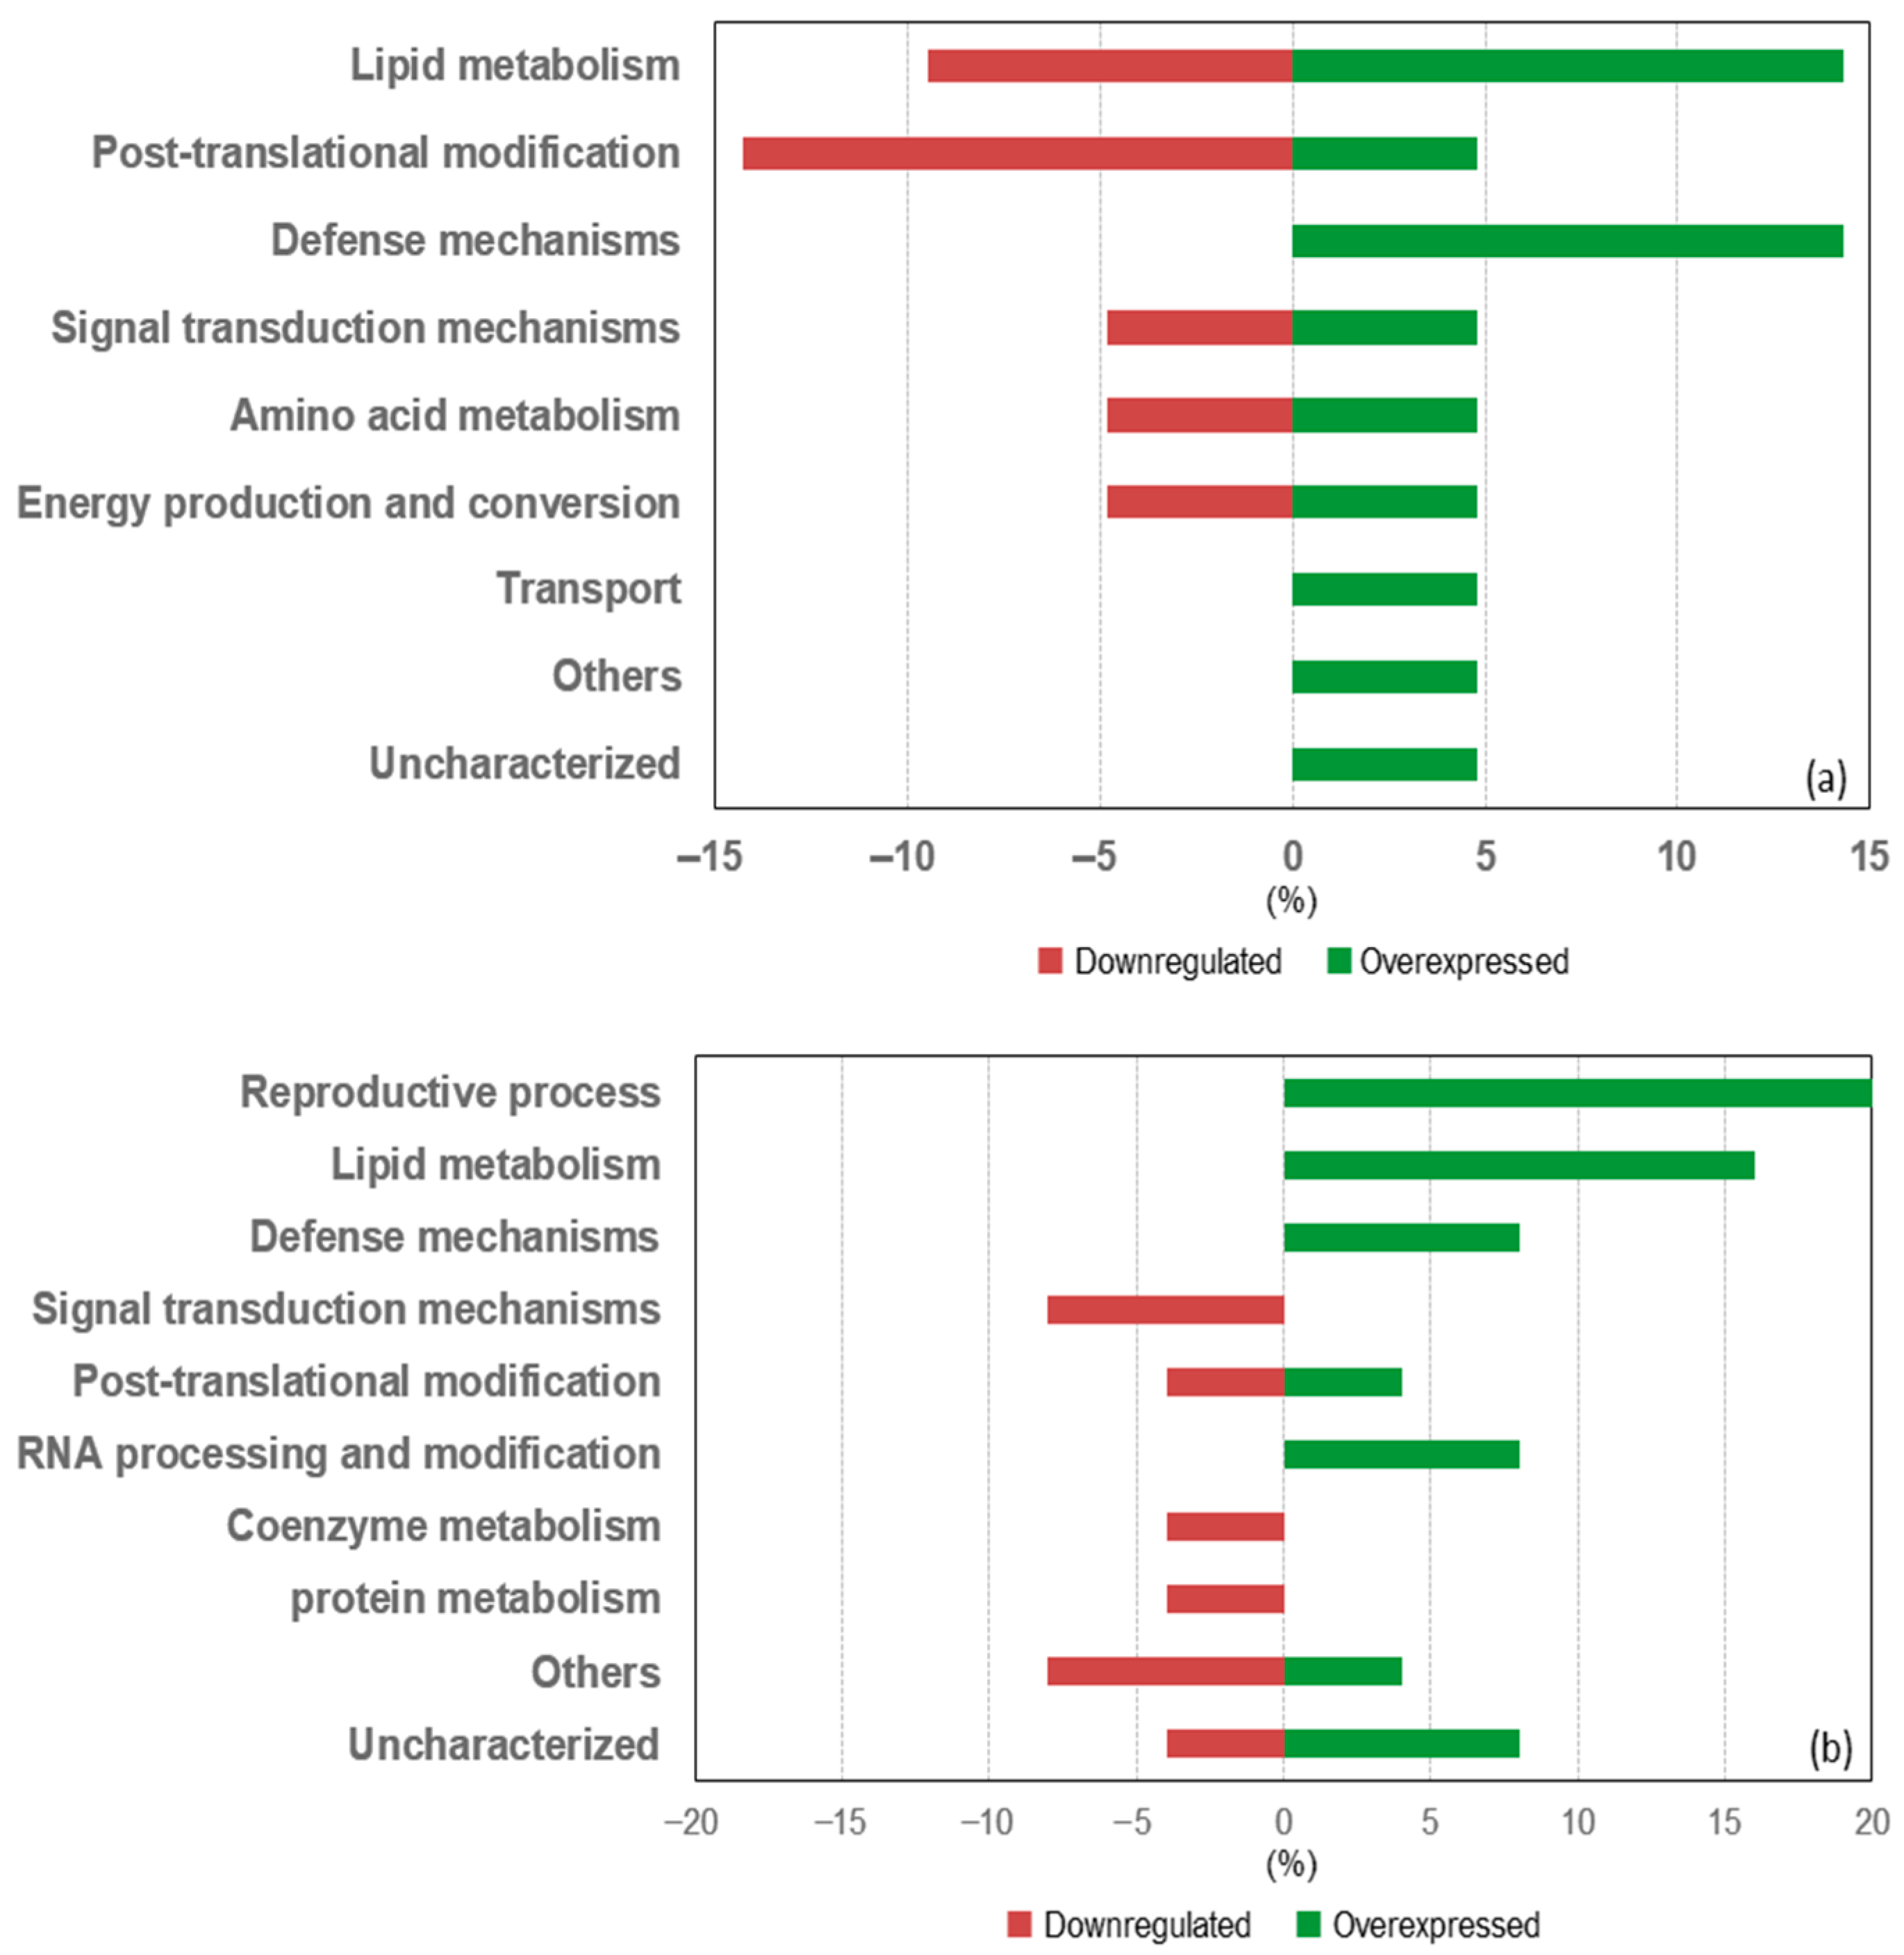
3.4.2. Differentially Expressed Proteins in the Livers of Mice from the Obese + FGM Group Compared to the Control + FGM Group

Proteins that exhibited significant differential expression (with >2-fold change and p < 0.05) were considered for further analysis. Twenty-one proteins were differentially expressed between the Control + FGM and Obese + FGM groups (Table 2).
These proteins are primarily associated with lipid metabolism, defense mechanisms, post-translational modifications, signal transduction, energy production and conversion, amino acid metabolism, and transport. Among these, 61.8% were upregulated and 38.2% were downregulated (Figure 8a).
The proteins with the most significant upregulation included fatty acid-binding protein 1 (FABP1), α-1-acid glycoprotein (AGP2), and acetyl-CoA acyltransferase (ACAA1). Conversely, the most downregulated proteins were ATP-citrate lyase (ACLY), glutathione S-transferase (GST), and major urinary protein (MUP1).
A network was constructed using the STRING database to explore the potential protein–protein interactions (PPIs) among the differentially expressed proteins (Figure 9a). The network revealed strong interactions between proteins involved in lipid metabolism, including FABP1, ACAA1, ACLY, and Acetyl-CoA carboxylase (ACACA), all of which are closely interconnected and play roles in lipid biosynthesis. Additionally, interactions were observed between these lipid-related proteins and two other enzymes, aspartate aminotransferase (AST) and cystathionine γ-lyase (CSE), which are involved in amino acid metabolism. Moreover, a relationship was detected between two proteins involved in post-translational modification, namely, heat shock protein 70 (HSPA4) and heat shock protein 60 (HSPD1).

3.4.3. Differentially Expressed Proteins in the Livers of Mice from the Obese + PGM3 Group Compared to the Obese + FGM Group

A total of 25 proteins were significantly differentially expressed when comparing the hepatic proteomic profiles of the Obese + PGM3 group to the Obese + FGM group (Table 3).
The majority of these proteins are involved in reproductive processes, lipid metabolism, defense mechanisms, signal transduction, post-translational modifications, RNA processing and modification, coenzyme metabolism, and protein metabolism. Of these, 68% were upregulated, while 32% were downregulated (Figure 8b).
Among the proteins associated with lipid metabolism, a process notably affected by a high-fat diet (HFD), were nucleobindin-2 (NUNCB2), apolipoprotein A-I (APOA1), apolipoprotein A-IV (APOA4), glutathione S-transferase (GSTP1), and major urinary protein (MUP1). Given that proteins do not function in isolation but interact within complex networks to coordinate various biological reactions, a network was constructed using the STRING database to analyze potential interactions among these proteins. Figure 9b shows a network of interactions between APOA1, APOA4, AGP2, serine protease inhibitor (SERPINA3), and transferrin (TRFE).

4. Discussion

The increasing prevalence of obesity and its associated metabolic disorders have prompted the exploration of alternative and effective dietary interventions. Among these, probiotic fermented goat milk has garnered attention for its potential therapeutic effects.
Goat milk was selected over milk from other mammals due its better digestibility, lower allergenicity, and unique nutritional profile, making it ideal for studying metabolic health and gut–liver interactions in mice with relevance to humans. Compared to cow’s milk, it contains smaller fat globules, higher medium-chain triglycerides, and lower αs1-casein that improve digestion and nutrient absorption. Goat milk also provides greater mineral bioavailability (e.g., calcium, zinc) and prebiotic oligosaccharides that support gut microbiota. Additionally, it has anti-inflammatory and antioxidant effects important in obesity and MAFLD. As a fermentation matrix, goat milk improves probiotic viability and functionality, enhancing its role as a functional food for dietary interventions [22,23].
The bacterial strains included in the functional culture mixes—Limosilactobacillus fermentum CRL1446, Lactiplantibacillus paraplantarum CRL1449, and Lactiplantibacillus paraplantarum CRL1472—were previously characterized through both in vitro assays and in vivo studies using a diet-induced obesity murine model. These evaluations demonstrated their complementary metabolic and immunomodulatory properties, justifying their selection for inclusion in a functional probiotic consortium [12,24]. Limosilactobacillus fermentum CRL1446 has emerged as the most potent strain, with demonstrated anti-obesity effects, including significant reductions in weight gain, blood glucose levels, HOMA-IR index, and pro-inflammatory cytokines (TNF-α, IL-6), alongside increased IL-10 levels. It also improves the lipid profile by lowering plasma triglycerides, total cholesterol, and LDL cholesterol—key markers of cardiovascular risk. Additionally, this strain exhibits strong in vitro α-glucosidase inhibitory activity, consistent with its hypoglycemic effects in vivo. Limosilactobacillus fermentum CRL1446 also modulates gut microbiota composition, reducing the Firmicutes/Bacteroidetes ratio and enhancing beneficial Lactobacillus spp., reinforcing its role in metabolic health [12,24,25,26]. Lactiplantibacillus paraplantarum CRL1449 and Lactiplantibacillus paraplantarum CRL1472 have also shown beneficial effects in diet-induced obesity models. Both strains contributed to reduced weight gain and improved lipid profiles. Lactiplantibacillus paraplantarum CRL1449 exhibits bile salt hydrolase (BSH) activity, which may underlie its cholesterol-lowering effects. In contrast, Lactiplantibacillus paraplantarum CRL1472 has notable immunomodulatory properties, reducing pro-inflammatory cytokine levels and potentially mitigating the chronic inflammation associated with metabolic syndrome [12,24]. Taken together, these findings support the use of probiotic consortia to target multiple aspects of metabolic dysregulation, including lipid, glycemic, and immune metabolism. The synergistic interactions within this multi-strain formulation may enhance therapeutic efficacy, offering greater benefits than individual strains alone.
Recent studies have highlighted the impact of probiotics and functional foods on hepatic proteomics, offering insights into its role in modulating obesity-related pathways [27,28]. This study provides compelling evidence that specific formulations of PGM, particularly PGM3, can effectively attenuate the metabolic consequences of HFD-induced obesity in mice. Among the key findings, the reduction in BWG observed in these groups stands out as one of the most prominent outcomes. Consistent with previous evidence suggesting that specific probiotic strains can improve energy balance [29], the administration of PGM3 led to significant reductions in BWG compared to obese controls receiving non-supplemented FGM. This reduction was paralleled by improvements in insulin sensitivity, as indicated by normalized TG–glucose index values, which approached those of lean control animals. Previous studies have demonstrated a significant and consistent correlation between the TyG index and HOMA-IR across different populations. This allows the use of the TyG index as an alternative marker, eliminating the need for direct insulin measurement, thereby simplifying the analysis and reducing costs [19,20,21].
In addition to body weight modulation, the impact of PGM formulations on the plasma lipid profile was particularly noteworthy. PGM3 significantly lowered circulating TG levels by 35% compared to the Obese + FGM group, bringing values closer to those seen in lean control animals. While TC and LDL-c levels remained largely unchanged across groups, the increase in HDL-c observed in all PGM-treated mice represents a meaningful improvement, especially given the 23% reduction in HDL-c found in the obese group. Elevation of HDL-c is generally associated with reduced cardiovascular risk, as HDL plays a protective role in reverse cholesterol transport and inflammation regulation [30]. These results suggest that targeted probiotic supplementation may modulate energy balance and fat accumulation in a formulation-dependent manner, consistent with prior studies reporting anti-obesogenic effects of specific Lactobacillus strains [29,31].
Crucially, the beneficial effects of PGM extended beyond individual lipid markers to integrated indicators of cardiovascular health. The LDL/HDL ratio, a well-established marker of atherogenic risk, was elevated 1.5-fold in the Obese + FGM group but normalized in all PGM-treated groups, particularly in PGM3. Thus, the normalization of LDL/HDL by PGM3 not only reflects favorable lipid changes but aligns with current evidence linking lower ratios to reduced atherosclerosis and cardiovascular risk [32]. Similarly, the atherogenic coefficient and the plasma atherogenic index (log[TG/HDL])—both predictors of cardiovascular morbidity and mortality [33]—were significantly reduced with PGM2 and PGM3 treatments. In the case of PGM3, the atherogenic index was lowered by 62%, indicating a substantial improvement in lipid-related cardiovascular risk. Notably, proteins such as APOA1 and APOA4, known for their roles in lipid transport and anti-atherogenic functions [34,35], were upregulated in the PGM3 group, which could help explain the observed improvements in cardiovascular risk indices. The restoration of HDL-c levels and reduction in atherogenic coefficients further support the cardiovascular protective properties of this dietary intervention.
Obesity is commonly associated with ectopic fat accumulation in the liver, which is indicative of steatosis and the early onset of metabolic-associated fatty liver disease (MAFLD). This condition is often linked to disruptions in lipid and glucose metabolism [36]. Consequently, a histological analysis of liver tissue was conducted to investigate these changes further. The Obese + FGM group exhibited multiple fat-filled micro-vesicles within the cytoplasm of the hepatocyte. This hepatic lipid droplet accumulation was reduced in the animals of the groups that received the FGM supplemented with the different mixtures. Such outcomes are particularly relevant considering the central role of hepatic lipid accumulation in developing metabolic syndrome and MAFLD [36].
The observed hepatoprotective effects were supported by reductions in liver weight and plasma transaminase (ALT and AST) levels in the PGM3-treated group. Transaminases are widely recognized as clinical indicators of liver health and disease. Elevated levels of these enzymes are also linked to higher body mass index and central obesity, even in individuals without liver conditions [37,38]. Additionally, some studies have shown that administering a combination of probiotics to rats with fatty liver disease led to improvements, with reduced fat accumulation associated with changes in lipid profiles, leptin levels, and inflammatory markers. Furthermore, a meta-analysis conducted by Zhu et al. [39] provided clinical evidence supporting the hepatoprotective effects of probiotics. The study revealed significant reductions in serum ALT and AST levels among patients with MAFLD and non-alcoholic steatohepatitis (NASH) following probiotic supplementation, underscoring the therapeutic potential of modulating gut microbiota in liver disease management [39].
Together, these findings demonstrate that supplementation with select probiotic strains in goat milk not only prevents excessive weight gain but also exerts a favorable effect on lipid metabolism and cardiovascular risk parameters and is in line with histological assessments showing decreased fat infiltration in hepatocytes and improved tissue morphology. These results highlight probiotic goat milk’s potential as a functional dietary strategy for obesity management and metabolic health promotion.
Among the evaluated parameters, PGM3 was the most effective in reducing BWG, improving markers of insulin resistance, such as the TG–glucose index, and ameliorating liver damage—both at the biochemical and histological levels. In light of these findings, we selected the PGM3-treated group for subsequent proteomic analyses of liver tissue to investigate the underlying molecular mechanisms further.
The beneficial metabolic effects observed in the PGM3 group are likely mediated by the production of specific microbial metabolites and enzymatic activities from the probiotic strains included in the functional culture mix. One of the key enzymatic features is the feruloyl esterase (FAE) activity exhibited by Limosilactobacillus fermentum CRL1446. This enzyme hydrolyzes ester bonds between ferulic acid and plant cell wall components—particularly arabinoxylans—allowing the release of free ferulic acid, a bioactive phenolic compound. Ferulic acid has demonstrated antioxidant, anti-inflammatory, and hypolipidemic effects, including the downregulation of lipogenic genes (e.g., SREBP-1c, FAS), enhancement of fatty acid oxidation (e.g., via PPAR-α activation), and modulation of glucose uptake and insulin signaling pathways [40]. These molecular actions collectively contribute to the reduction of hepatic steatosis, improvement in lipid metabolism, and attenuation of systemic oxidative stress, which are consistent with the outcomes observed in our study [25,26]. In addition to phenolic biotransformation, the strains in the PGM3 consortium are known to produce short-chain fatty acids (SCFAs) such as acetate, propionate, and butyrate during the fermentation of dietary fibers [25]. These SCFAs are pivotal signaling molecules that influence host energy metabolism through multiple mechanisms: they serve as energy substrates, activate G-protein coupled receptors (e.g., GPR41, GPR43), and modulate hormonal axes involved in satiety (e.g., GLP-1, PYY). SCFAs have also been shown to enhance insulin sensitivity, reduce lipogenesis in the liver, and increase fatty acid oxidation, thereby contributing to weight reduction and improved glycemic control [41,42].
The liver regulates the comprehensive maintenance of lipid and glucose metabolism throughout the body through dynamic control of lipogenesis, lipolysis, gluconeogenesis, and glycolysis. Some metabolic disorders related to obesity manifest in the liver, causing, for example, non-alcoholic fatty liver disease (NAFLD). For this reason, the hepatic proteome is an optimal representative of the changes that occur in obesity.
Proteins overexpressed in the liver of mice in the Obese + FGM group compared to the Control + FGM group are generally involved in the oxidation of fatty acids. FABP1 is a protein that plays an important role in regulating lipid metabolism, participating in the absorption and transport of fatty acids. Lu et al. [43] demonstrated that elevated plasma FABP1 levels were closely associated with NAFLD in patients with type 2 DM. Newberry et al. [44] studied the effect of a Western diet on FABP1 knockout mice, and they developed less obesity and accumulated less TG than the controls. Increased fatty acid flux to the liver contributes to increased de novo lipogenesis in the liver and elevated blood TG levels in response to ingestion of an HFD. AGP2 is an acute-phase protein synthesized primarily in the liver in response to a systemic reaction to inflammation. AGPP2 fulfills at least two sets of functions, apparently different from each other but closely related. On the one hand, it is an immunomodulatory protein; on the other hand, it is one of the most important binding proteins in plasma. It can bind and transport several endogenous ligands related to inflammation [45]. This protein is used in the clinic as a marker of inflammation. High levels of AGP2 in blood are related to HFD and obesity and were recently proposed as a potential biomarker to evaluate nutritional status in humans [46]. ACAA1 belongs to the thiolase enzyme family. It catalyzes the final step of β-oxidation, which is the cleavage of 3-ketoacyl CoA by the thiol group of another coenzyme A molecule. Kim et al. [47] revealed that HFD induces a positive regulation of genes involved in the absorption and oxidation of fatty acids, including ACAA1. Proteins downregulated in the liver of mice in the Obese + FGM group compared to the Control + FGM group generally repressed proteins involved in lipid synthesis. ACLY, which catalyzes the cleavage of citrate into oxaloacetate and acetyl-CoA, is a common substrate for the de novo synthesis of cholesterol and fatty acids, linking carbohydrate metabolism and fatty acid production [48]. GST constitutes a family of liver-detoxifying isoenzymes that catalyze the conjugation of glutathione with toxic xenobiotics and lipid peroxidation products, converting them into more soluble compounds capable of being eliminated by the body. Given that elevated levels of lipid peroxides and reduced levels of glutathione were associated with rodents that received an HFD [49,50] as well as in patients with metabolic alterations [51], reduced GST activity would not effectively counteract the elevated levels of lipid peroxides in obese subjects, thus determining an oxidative modification of proteins, mitochondrial dysfunction, and tissue damage in such subjects. Urinary MUP1/pheromone complexes not only mediate chemical communication in rodents but also regulate glucose and lipid metabolism through paracrine/autocrine regulation of gluconeogenesis and lipogenesis, respectively [52]. MUP1 deficiency is associated with obesity and type 2 DM. Two studies reported that hepatic expression and circulating levels of MUP1 are markedly reduced in genetically obese and HFD-induced obese mice [52,53].
When we study the relationship that exists between different proteins we can observe a strong interaction between proteins related to lipid metabolism: FABP1, ACAA1, and ACLY, described above, and Acetyl-CoA carboxylase (ACACA), which is strongly related to the ACLY protein, also involved in lipid biosynthesis. This protein catalyzes the carboxylation of acetyl-CoA to malonyl-CoA, the rate-determining step in fatty acid synthesis [54]. A close relationship is also observed between these proteins and AST and CSE, which are involved in amino acid metabolism. Both AST (overexpressed) and CSE (repressed) are closely linked to obesity. High plasma AST activity is a marker of hepatocellular damage, while Ali et al. [55] demonstrated that the expressions of genes related to lipogenesis, inflammation, and fibrosis were significantly higher in the liver tissues of CSE knockout mice compared with control mice.
Additionally, a relationship is observed between two proteins that participate in post-translational modification: heat shock protein 70 (HSPA4) and heat shock protein 60 (HSPD1). HSPs not only function as chaperones controlling protein folding but also intervene in numerous biological processes. Obesity is closely related to a process of inflammation and a state of oxidative stress. An important molecule that links these two processes is the 60 kDa heat shock protein that is overexpressed during oxidative stress in metabolic diseases such as obesity and diabetes, among others. This protein binds to Toll-like receptors on immune cells and induces the inflammatory process through the NF-κB pathway [56]. The data show that changes in protein expression induced by HFD include proteins involved in a variety of biological processes. Generally, it upregulates proteins involved in fatty acid oxidation and represses proteins involved in lipid synthesis, suggesting that HFD-fed mice try to optimize fat utilization and suppress lipid synthesis as a protective mechanism to counteract excessive fat loading. These results suggest that dysfunction of lipid metabolic processes, together with alterations in protein and amino acid metabolism, play a role in the pathogenesis of obesity. It is expected that the administration of FGM supplemented with the mixture of strains will affect the expression of liver proteins involved in these mechanisms, reversing the alterations caused by HFD. Kim et al. [57] reported that dairy intake of kefir for 12 weeks resulted in a reduction in BWG and liver injury, positive modulation of the GM, and upregulation of genes related to fatty acid oxidation in mice fed with a HFD.
The administration of PGM3 affects the expression of proteins related to lipid metabolism, a process most affected by HFD. NUNCB2 is a precursor protein of the bioactive peptide nesfatin-1, involved in the regulation of lipid metabolism, satiety, and glucose homeostasis. It is expressed in the hypothalamic nucleus, which controls food intake but is also ubiquitously expressed in peripheral tissues, such as the liver, pancreas, intestine, and adipose tissue [58]. Such a distribution implies that NUCB2/nesfatin-1 has important metabolic and immunological functions. Reducing hypothalamic nesfatin-1 levels increases hepatic glucose flux and decreases glucose uptake from peripheral tissues. Öztürk Özkan [59] reported that nesfatin-1 injection can prevent hepatic glucose formation and stimulate glucose uptake. Different experimental models have also reported that nesfatin-1 improves blood lipid levels, reducing TG and cholesterol levels [60]. Suggested mechanisms are that it affects the expression of genes and signaling pathways related to lipid metabolism and the sympathetic nervous system [61]. Nesfatin-1 levels were able to distinguish healthy population patients from obese ones. Therefore, nefastin-1 is considered a potential biomarker for diagnosing and monitoring these diseases.
APOA1 is the most abundant protein constituent of high-density lipoproteins (HDL). Ruan et al. [62] analyzed the anti-obesity effect of APOA1 using transgenic mice with overexpression of APOA1, which received an HFD. Overexpression of APOA1 reduced fat and improved insulin sensitivity in mice significantly. APOA1 treatment increased the levels of mRNA and uncoupling protein (UCP1) and stimulated the phosphorylation of AMP-activated protein kinase (AMPK) in cultured adipocytes. These results reveal that the anti-obesity effect of APOA1 is associated with the increase in energy expenditure and the expression of UCP1 in adipose tissue. Some recent studies have linked APOA1 to glucose and energy metabolism, revealing that APOA-I can stimulate AMPK in different cells [63]. APOA4 is a lipid-binding protein mainly synthesized in the intestine of mammals and the liver of rodents. It participates in a broad spectrum of biological processes, including lipid metabolism, reverses cholesterol transport, protection against atherosclerosis, platelet aggregation and thrombosis, glucose homeostasis, and food intake [34]. APOA4 deficiency is associated with atherosclerosis and diabetes, making it a potential therapeutic target for the treatment of these diseases. Other proteins related to lipid metabolism are GST and MUP1. These showed a trend opposite to that found in the livers of Obese + FGM mice compared to the Control + FGM group, where they were repressed, while in the Obese + PGM3 group, they were overexpressed compared to that of the Obese + FGM group. Zhou et al. [52] showed that overexpression of recombinant MUP1 in the liver markedly decreased hyperglycemia and lipid levels in diabetic mice, presumably due to suppression of gluconeogenic and lipogenic genes in the liver. Oxidative stress is an important factor in the development of obesity and its complications, and people with decreased antioxidant capacity were found to have a higher risk of type 2 DM [51]. GSTs can effectively modulate systemic oxidative stress levels in humans, therefore playing a fundamental role in these pathologies. Interactions between these proteins and AGP2, serine protease inhibitor (SERPINA3), and serotransferrin (TRFE) were observed. The AGP2 protein was overexpressed in the Obese + FGM group compared to the Control + FGM group, but this trend was modified after treatment with PGM3. High levels of AGP2 are useful in supporting the diagnosis of acute and chronic inflammatory conditions, cardiovascular diseases, and myocardial infarction. TRFE is a blood plasma glycoprotein that is produced mainly in the liver. It is a protein responsible for iron metabolism and stimulating cell proliferation. Lee et al. [64] suggested that increased indicators of iron status, including TRFE and TRFE receptor levels in soluble form, may be related to insulin resistance and metabolic syndrome. A recent human study also showed that elevated serum TRFE concentrations were positively correlated with the risk of metabolic syndrome and obesity [65]. It is important to control TRFE levels to regulate the balance of iron transport to tissues involved in glucose and lipid metabolism, such as the liver and adipose tissue. A recent study demonstrated that serine protease inhibitor SERPINA1 and SERPINA1A3 dysfunctions were associated with liver disease. To identify early diagnostic markers of diabetes, serum proteomics was performed to evaluate the type 2 DM mouse model, and high levels of SERPINA3 were identified in the prediabetic state [66].
Other authors have identified different proteomic profiles between animals that received HFD and SD [54,67,68]. However, these discrepancies may be due to the animal model used, the type of diet administered, and the different methodologies used during protein extraction, among other factors. Proteomics data show that HFD generally upregulates proteins involved in fatty acid oxidation and downregulates proteins involved in lipid synthesis. The administration of PGM3 showed a regulatory and beneficial effect on the expression of proteins that participate in the pathogenesis of obesity.

5. Conclusions

Overall, this work supports using strain-specific probiotic formulations in goat milk as a promising dietary strategy to counteract obesity-related metabolic disturbances. Among the tested formulations, PGM3 exhibited the most pronounced benefits, significantly reducing body weight gain, improving lipid profiles, lowering hepatic transaminases, and attenuating liver steatosis. These physiological improvements were accompanied by distinct changes in the hepatic proteome, particularly the modulation of proteins involved in lipid metabolism, oxidative stress, inflammation, and glucose homeostasis. Our findings provide molecular evidence that functional dairy products containing targeted probiotic strains can exert systemic metabolic effects beyond the gut, likely mediated via the gut–liver axis. The upregulation of beneficial proteins in the PGM3 group and the downregulation of pro-inflammatory or dysmetabolic proteins highlight the potential of proteomics to uncover mechanistic insights into probiotic action.
Further clinical and mechanistic studies are warranted to validate these human effects and explore their translational potential in preventing and managing obesity-associated liver diseases.

Author Contributions

All authors contributed to this study’s conception and design. Conceptualization, A.M. and P.G.-C.; Data Curation, A.M., E.A. and M.R.; Formal Analysis, A.M., E.A., M.R., J.D.B. and P.G.-C.; Funding Acquisition, P.G.-C. and R.M.; Investigation, A.M., E.A., M.R. and J.D.B.; Methodology, A.M., E.A., M.R., J.D.B. and P.G.-C.; Project Administration, R.M. and P.G.-C.; Resources, R.M. and P.G.-C.; Software, A.M., E.A. and J.D.B.; Supervision, P.G.-C. and R.M.; Validation, A.M. and P.G.-C.; Writing—Original Draft Preparation, A.M., R.M. and P.G.-C.; Writing—Review and Editing, A.M., R.M. and P.G.-C. All authors have read and agreed to the published version of the manuscript.

Funding

This research was funded by FONCyT (grant number PICT-2020-03777), CONICET( grant numbers PIP 0406 and PIP 0869), and Universidad Nacional de Tucumán (PIUNT A722).

Institutional Review Board Statement

The animal experiments were carried out under the Guidelines for Animal Experimentation of CERELA. The Institutional Committee for the Care and Use of Laboratory Animals at CERELA approved this research under the protocol CRL-BIOT-EF-2012/2B. All experiments comply with the current laws of Argentina and international organizations for the use of experimental animals.

Informed Consent Statement

Not applicable.

Data Availability Statement

The mass spectrometry proteomics data have been deposited to the ProteomeXchange Consortium via the PRIDE partner repository with the dataset identifier PXD050536.

Acknowledgments

The authors are grateful for the technical support provided by Eduardo Alvarez Villamil and Alejandra de Moreno.

Conflicts of Interest

The authors declare no conflicts of interest.

References

  1. WHO Obesity and Overweight. Available online: https://www.who.int/news-room/fact-sheets/detail/obesity-and-overweight (accessed on 2 June 2025).
  2. Vulchi, J.; Suryadevara, V.; Mohan, P.; Kamalanathan, S.; Sahoo, J.; Naik, D.; Selvarajan, S. Obesity and Metabolic Dysfunction-Associated Fatty Liver Disease: Understanding the Intricate Link. J. Transl. Gastroenterol. 2023, 1, 74–86. [Google Scholar] [CrossRef]
  3. Li, H.; Huang, W.; Wang, M.; Chen, P.; Chen, L.; Zhang, X. Tandem Mass Tag-Based Quantitative Proteomics Analysis of Metabolic Associated Fatty Liver Disease Induced by High Fat Diet in Mice. Nutr. Metab. 2020, 17, 97. [Google Scholar] [CrossRef] [PubMed]
  4. Luo, M.; Mengos, A.E.; Stubblefield, T.M.; Mandarino, L.J. High Fat Diet-Induced Changes in Hepatic Protein Abundance in Mice. J. Proteomics Bioinform. 2012, 5, 60–66. [Google Scholar] [CrossRef] [PubMed]
  5. Gupta, A.C.; Bhat, A.; Maras, J.S. Early Hepatic Proteomic Signatures Reveal Metabolic Changes in High-Fat-Induced Obesity in Rats. Br. J. Nutr. 2024, 131, 773–785. [Google Scholar] [CrossRef] [PubMed]
  6. Nardo, W.D.; Lee, O.; Johari, Y.; Bayliss, J.; Pensa, M.; Miotto, P.M.; Keenan, S.N.; Ryan, A.; Rucinski, A.; Svinos, T.M.; et al. Integrated Liver-Secreted and Plasma Proteomics Identify a Predictive Model That Stratifies MASH. Cell Rep. Med. 2025, 6, 102085. [Google Scholar] [CrossRef] [PubMed]
  7. Martins, T.; Ferreira, T.; Nascimento-Gonçalves, E.; Castro-Ribeiro, C.; Lemos, S.; Rosa, E.; Antunes, L.M.; Oliveira, P.A. Obesity Rodent Models Applied to Research with Food Products and Natural Compounds. Obesities 2022, 2, 171–204. [Google Scholar] [CrossRef]
  8. De Moura, E.; Dias, M.; Dos Reis, S.A.; Da Conceição, L.L.; Sediyama, C.M.N.D.O.; Pereira, S.S.; De Oliveira, L.L.; Gouveia Peluzio, M.D.C.; Martinez, J.A.; Milagro, F.I. Diet-Induced Obesity in Animal Models: Points to Consider and Influence on Metabolic Markers. Diabetol. Metab. Syndr. 2021, 13, 32. [Google Scholar] [CrossRef] [PubMed]
  9. Rai, A.K.; Yadav, M.; Duary, R.K.; Shukla, P. Gut Microbiota Modulation Through Dietary Approaches Targeting Better Health During Metabolic Disorders. Mol. Nutr. Food Res. 2025, e70033. [Google Scholar] [CrossRef] [PubMed]
  10. Yang, F.; Li, X.; Sun, J.; Pang, X.; Sun, Q.; Lu, Y. Regulatory Mechanisms of the Probiotic-Targeted Gut–Liver Axis for the Alleviation of Alcohol-Related Liver Disease: A Review. Crit. Rev. Food Sci. Nutr. 2025, 1–22. [Google Scholar] [CrossRef] [PubMed]
  11. Jiang, S.; Su, Y.; Wang, Q.; Lv, L.; Xue, C.; Xu, L.; Li, L. Multi-Omics Analysis of the Effects of Dietary Changes and Probiotics on Diet-Induced Obesity. Curr. Res. Food Sci. 2023, 6, 100435. [Google Scholar] [CrossRef] [PubMed]
  12. Marquez, A.; Andrada, E.; Russo, M.; Bolondi, M.L.; Fabersani, E.; Medina, R.; Gauffin-Cano, P. Characterization of Autochthonous Lactobacilli from Goat Dairy Products with Probiotic Potential for Metabolic Diseases. Heliyon 2022, 8, e10462. [Google Scholar] [CrossRef] [PubMed]
  13. Wang, Z.; Li, Q.; Xiang, M.; Zhang, F.; Wei, D.; Wen, Z.; Zhou, Y. Astragaloside Alleviates Hepatic Fibrosis Function via PAR2 Signaling Pathway in Diabetic Rats. Cell. Physiol. Biochem. Int. J. Exp. Cell. Physiol. Biochem. Pharmacol. 2017, 41, 1156–1166. [Google Scholar] [CrossRef] [PubMed]
  14. Low, S.; Khoo, K.C.J.; Irwan, B.; Sum, C.F.; Subramaniam, T.; Lim, S.C.; Wong, T.K.M. The Role of Triglyceride Glucose Index in Development of Type 2 Diabetes Mellitus. Diabetes Res. Clin. Pract. 2018, 143, 43–49. [Google Scholar] [CrossRef] [PubMed]
  15. Sasikala, T.; Goswami, K. Castelli Risk Index-1 and Atherogenic Coefficient Are Better Predictors of Cardiometabolic Risk in Patients with Hypothyroidism. Int. J. Clin. Biochem. Res. 2020, 7, 254–259. [Google Scholar] [CrossRef]
  16. Yang, L.; Vaitheesvaran, B.; Hartil, K.; Robinson, A.J.; Hoopmann, M.R.; Eng, J.K.; Kurland, I.J.; Bruce, J.E. The Fasted/Fed Mouse Metabolic Acetylome: N6-Acetylation Differences Suggest Acetylation Coordinates Organ-Specific Fuel Switching. J. Proteome Res. 2011, 10, 4134–4149. [Google Scholar] [CrossRef] [PubMed]
  17. La Greca, A.; Solari, C.; Furmento, V.; Lombardi, A.; Biani, M.C.; Aban, C.; Moro, L.; García, M.; Guberman, A.S.; Sevlever, G.E.; et al. Extracellular Vesicles from Pluripotent Stem Cell-Derived Mesenchymal Stem Cells Acquire a Stromal Modulatory Proteomic Pattern during Differentiation. Exp. Mol. Med. 2018, 50, 1–12. [Google Scholar] [CrossRef] [PubMed]
  18. Szklarczyk, D.; Franceschini, A.; Wyder, S.; Forslund, K.; Heller, D.; Huerta-Cepas, J.; Simonovic, M.; Roth, A.; Santos, A.; Tsafou, K.P.; et al. STRING V10: Protein-Protein Interaction Networks, Integrated over the Tree of Life. Nucleic Acids Res. 2015, 43, D447–D452. [Google Scholar] [CrossRef] [PubMed]
  19. Gounden, V.; Devaraj, S.; Jialal, I. The Role of the Triglyceride-Glucose Index as a Biomarker of Cardio-Metabolic Syndromes. Lipids Health Dis. 2024, 23, 416. [Google Scholar] [CrossRef] [PubMed]
  20. Avagimyan, A.; Pogosova, N.; Fogacci, F.; Aghajanova, E.; Djndoyan, Z.; Patoulias, D.; Sasso, L.L.; Bernardi, M.; Faggiano, A.; Mohammadifard, N.; et al. Triglyceride-Glucose Index (TyG) as a Novel Biomarker in the Era of Cardiometabolic Medicine. Int. J. Cardiol. 2025, 418, 132663. [Google Scholar] [CrossRef] [PubMed]
  21. Sun, Y.; Ji, H.; Sun, W.; An, X.; Lian, F. Triglyceride Glucose (TyG) Index: A Promising Biomarker for Diagnosis and Treatment of Different Diseases. Eur. J. Intern. Med. 2025, 131, 3–14. [Google Scholar] [CrossRef] [PubMed]
  22. Chen, L.; Bagnicka, E.; Chen, H.; Shu, G. Health Potential of Fermented Goat Dairy Products: Composition Comparison with Fermented Cow Milk, Probiotics Selection, Health Benefits and Mechanisms. Food Funct. 2023, 14, 3423–3436. [Google Scholar] [CrossRef] [PubMed]
  23. Andrada, E.; Marquez, A.; Russo, M.; Gauffin-Cano, P.; Medina, R. Fermented Goat Milk as a Functional Food for Obesity Prevention or Treatment: A Narrative Review. Front. Food Sci. Technol. 2024, 3. [Google Scholar] [CrossRef]
  24. Marquez, A.; Russo, M.; Tomei, C.; Castellano, P.; Puglisi, E.; Medina, R.; Gauffin-Cano, P. Effects of Fermented Goat Milk on Adiposity and Gut Microbiota in a Diet-Induced Obesity Murine Model. Fermentation 2024, 10, 155. [Google Scholar] [CrossRef]
  25. Russo, M.; Marquez, A.; Abeijón-Mukdsi, M.C.; Santacruz, A.; López-Malo, A.; Gauffin-Cano, P.; Medina, R. Microencapsulated Feruloyl Esterase-Producing Lactobacilli Ameliorate Lipid Profile and Glycaemia in High Fat Diet-Induced Obese Mice. Benef. Microbes 2019, 10, 189–198. [Google Scholar] [CrossRef] [PubMed]
  26. Russo, M.; Marquez, A.; Herrera, H.; Abeijon-Mukdsi, C.; Saavedra, L.; Hebert, E.; Gauffin-Cano, P.; Medina, R. Oral Administration of Lactobacillus Fermentum CRL1446 Improves Biomarkers of Metabolic Syndrome in Mice Fed a High-Fat Diet Supplemented with Wheat Bran. Food Funct. 2020, 11, 3879–3894. [Google Scholar] [CrossRef] [PubMed]
  27. Cong, S.; Li, Z.; Yu, L.; Liu, Y.; Hu, Y.; Bi, Y.; Cheng, M. Integrative Proteomic and Lipidomic Analysis of Kaili Sour Soup-Mediated Attenuation of High-Fat Diet-Induced Nonalcoholic Fatty Liver Disease in a Rat Model. Nutr. Metab. 2021, 18, 26. [Google Scholar] [CrossRef] [PubMed]
  28. Qu, H.; Yu, H.; Gu, R.; Chen, D.; Chen, X.; Huang, Y.; Xi, W.; Huang, Y. Proteomics for Studying the Effects of L. Rhamnosus LV108 against Non-Alcoholic Fatty Liver Disease in Rats. RSC Adv. 2018, 8, 38517–38528. [Google Scholar] [CrossRef] [PubMed]
  29. Lim, S.Y.M.; Chong, E.-J.; Mah, W.Y.; Pan, Y.; Fang, C.M.; Murugaiah, C.; Alshagga, M. Exploring the Anti-Obesity Effects of Lactobacillus in C57BL/6 Mice: Mechanisms, Interventions, and Future Directions. Lett. Appl. Microbiol. 2025, 78, ovaf024. [Google Scholar] [CrossRef] [PubMed]
  30. Madaudo, C.; Bono, G.; Ortello, A.; Astuti, G.; Mingoia, G.; Galassi, A.R.; Sucato, V. Dysfunctional High-Density Lipoprotein Cholesterol and Coronary Artery Disease: A Narrative Review. J. Pers. Med. 2024, 14, 996. [Google Scholar] [CrossRef] [PubMed]
  31. Galindev, U.; Erdenebold, U.; Batnasan, G.; Ganzorig, O.; Batdorj, B. Anti-Obesity Effects of Potential Probiotic Lactobacillus Strains Isolated from Mongolian Fermented Dairy Products in High-Fat Diet-Induced Obese Rodent Model. Braz. J. Microbiol. Publ. Braz. Soc. Microbiol. 2024, 55, 2501–2509. [Google Scholar] [CrossRef] [PubMed]
  32. Hu, S.; Fan, H.; Zhang, S.; Chen, C.; You, Y.; Wang, C.; Li, J.; Luo, L.; Cheng, Y.; Zhou, M.; et al. Association of LDL-C/HDL-C Ratio with Coronary Heart Disease: A Meta-Analysis. Indian Heart J. 2024, 76, 79–85. [Google Scholar] [CrossRef] [PubMed]
  33. Li, Y.; Feng, Y.; Li, S.; Ma, Y.; Lin, J.; Wan, J.; Zhao, M. The Atherogenic Index of Plasma (AIP) Is a Predictor for the Severity of Coronary Artery Disease. Front. Cardiovasc. Med. 2023, 10, 1140215. [Google Scholar] [CrossRef] [PubMed]
  34. Qu, J.; Ko, C.-W.; Tso, P.; Bhargava, A. Apolipoprotein A-IV: A Multifunctional Protein Involved in Protection against Atherosclerosis and Diabetes. Cells 2019, 8, 319. [Google Scholar] [CrossRef] [PubMed]
  35. San Mauro Martín, I.; Collado Yurrita, L.; Cuadrado Cenzual, M.Á.; Ciudad Cabañas, M.J.; Mendive Dubourdieu, P. Role of ApoA1 on High-Density Lipoprotein: An Intervention with Plant Sterols in Patients with Hypercholesterolemia. Nutr. Hosp. 2014, 31, 494–499. [Google Scholar] [CrossRef] [PubMed]
  36. Eslam, M.; Sanyal, A.J.; George, J.; Sanyal, A.; Neuschwander-Tetri, B.; Tiribelli, C.; Kleiner, D.E.; Brunt, E.; Bugianesi, E.; Yki-Järvinen, H.; et al. MAFLD: A Consensus-Driven Proposed Nomenclature for Metabolic Associated Fatty Liver Disease. Gastroenterology 2020, 158, 1999–2014.e1. [Google Scholar] [CrossRef] [PubMed]
  37. Flores Lopez, A.; Quiros-Tejeira, R.; Lyden, E.; McGill, B.; Dike, C. Association between BMI Change, Transaminases, and Other Metabolic Parameters in Children with Nonalcoholic Fatty Liver Disease. J. Obes. 2024, 2024, 6997280. [Google Scholar] [CrossRef] [PubMed]
  38. Huang, Z.; Liu, H.; Zhuo, W.; Chen, Y.; Huang, Y.; Chen, X.; Lu, T.; Xu, Z. U-Shaped Associations between Body Mass Index and Serum Liver Enzyme Levels. Sci. Rep. 2025, 15, 443. [Google Scholar] [CrossRef] [PubMed]
  39. Zhu, Y.; Tan, J.K.; Liu, J.; Goon, J.A. Roles of Traditional and Next-Generation Probiotics on Non-Alcoholic Fatty Liver Disease (NAFLD) and Non-Alcoholic Steatohepatitis (NASH): A Systematic Review and Network Meta-Analysis. Antioxidants 2024, 13, 329. [Google Scholar] [CrossRef] [PubMed]
  40. Ye, L.; Hu, P.; Feng, L.-P.; Huang, L.-L.; Wang, Y.; Yan, X.; Xiong, J.; Xia, H.-L. Protective Effects of Ferulic Acid on Metabolic Syndrome: A Comprehensive Review. Molecules 2022, 28, 281. [Google Scholar] [CrossRef] [PubMed]
  41. Münte, E.; Hartmann, P. The Role of Short-Chain Fatty Acids in Metabolic Dysfunction-Associated Steatotic Liver Disease and Other Metabolic Diseases. Biomolecules 2025, 15, 469. [Google Scholar] [CrossRef] [PubMed]
  42. Qin, X.; Chen, M.; He, B.; Chen, Y.; Zheng, Y. Role of Short-Chain Fatty Acids in Non-Alcoholic Fatty Liver Disease and Potential Therapeutic Targets. Front. Microbiol. 2025, 16, 1539972. [Google Scholar] [CrossRef] [PubMed]
  43. Lu, Y.-C.; Chang, C.-C.; Wang, C.-P.; Hung, W.-C.; Tsai, I.-T.; Tang, W.-H.; Wu, C.-C.; Wei, C.-T.; Chung, F.-M.; Lee, Y.-J.; et al. Circulating Fatty Acid-Binding Protein 1 (FABP1) and Nonalcoholic Fatty Liver Disease in Patients with Type 2 Diabetes Mellitus. Int. J. Med. Sci. 2020, 17, 182–190. [Google Scholar] [CrossRef] [PubMed]
  44. Newberry, E.P.; Xie, Y.; Kennedy, S.M.; Luo, J.; Davidson, N.O. Protection against Western Diet-Induced Obesity and Hepatic Steatosis in Liver Fatty Acid-Binding Protein Knockout Mice. Hepatology 2006, 44, 1191–1205. [Google Scholar] [CrossRef] [PubMed]
  45. Ceciliani, F.; Lecchi, C. The Immune Functions of A1 Acid Glycoprotein. Curr. Protein Pept. Sci. 2019, 20, 505–524. [Google Scholar] [CrossRef] [PubMed]
  46. Wu, S.; Teng, Y.; Lan, Y.; Wang, M.; Zhang, T.; Wang, D.; Qi, F. The Association between Fat Distribution and A1-Acid Glycoprotein Levels among Adult Females in the United States. Lipids Health Dis. 2024, 23, 235. [Google Scholar] [CrossRef] [PubMed]
  47. Kim, E.J.; Kim, E.; Kwon, E.-Y.; Jang, H.-S.; Hur, C.-G.; Choi, M.-S. Network Analysis of Hepatic Genes Responded to High-Fat Diet in C57BL/6J Mice: Nutrigenomics Data Mining from Recent Research Findings. J. Med. Food 2010, 13, 743–756. [Google Scholar] [CrossRef] [PubMed]
  48. Verschueren, K.H.G.; Blanchet, C.; Felix, J.; Dansercoer, A.; De Vos, D.; Bloch, Y.; Van Beeumen, J.; Svergun, D.; Gutsche, I.; Savvides, S.N.; et al. Structure of ATP Citrate Lyase and the Origin of Citrate Synthase in the Krebs Cycle. Nature 2019, 568, 571–575. [Google Scholar] [CrossRef] [PubMed]
  49. Zhang, X.; Yang, J.; Guo, Y.; Ye, H.; Yu, C.; Xu, C.; Xu, L.; Wu, S.; Sun, W.; Wei, H.; et al. Functional Proteomic Analysis of Nonalcoholic Fatty Liver Disease in Rat Models: Enoyl-Coenzyme a Hydratase down-Regulation Exacerbates Hepatic Steatosis. Hepatology 2010, 51, 1190–1199. [Google Scholar] [CrossRef] [PubMed]
  50. Noeman, S.A.; Hamooda, H.E.; Baalash, A.A. Biochemical Study of Oxidative Stress Markers in the Liver, Kidney and Heart of High Fat Diet Induced Obesity in Rats. Diabetol. Metab. Syndr. 2011, 3, 17. [Google Scholar] [CrossRef] [PubMed]
  51. Valle, A.; Catalán, V.; Rodríguez, A.; Rotellar, F.; Valentí, V.; Silva, C.; Salvador, J.; Frühbeck, G.; Gómez-Ambrosi, J.; Roca, P.; et al. Identification of Liver Proteins Altered by Type 2 Diabetes Mellitus in Obese Subjects. Liver Int. Off. J. Int. Assoc. Study Liver 2012, 32, 951–961. [Google Scholar] [CrossRef] [PubMed]
  52. Zhou, Y.; Jiang, L.; Rui, L. Identification of MUP1 as a Regulator for Glucose and Lipid Metabolism in Mice. J. Biol. Chem. 2009, 284, 11152–11159. [Google Scholar] [CrossRef] [PubMed]
  53. Hui, X.; Zhu, W.; Wang, Y.; Lam, K.S.L.; Zhang, J.; Wu, D.; Kraegen, E.W.; Li, Y.; Xu, A. Major Urinary Protein-1 Increases Energy Expenditure and Improves Glucose Intolerance through Enhancing Mitochondrial Function in Skeletal Muscle of Diabetic Mice. J. Biol. Chem. 2009, 284, 14050–14057. [Google Scholar] [CrossRef] [PubMed]
  54. Wang, Y.; Yu, W.; Li, S.; Guo, D.; He, J.; Wang, Y. Acetyl-CoA Carboxylases and Diseases. Front. Oncol. 2022, 12, 836058. [Google Scholar] [CrossRef] [PubMed]
  55. Ali, A.; Zhang, Y.; Fu, M.; Pei, Y.; Wu, L.; Wang, R.; Yang, G. Cystathionine Gamma-Lyase/H2S System Suppresses Hepatic Acetyl-CoA Accumulation and Nonalcoholic Fatty Liver Disease in Mice. Life Sci. 2020, 252, 117661. [Google Scholar] [CrossRef] [PubMed]
  56. Juwono, J.; Martinus, R.D. Does Hsp60 Provide a Link between Mitochondrial Stress and Inflammation in Diabetes Mellitus? J. Diabetes Res. 2016, 2016, 8017571. [Google Scholar] [CrossRef] [PubMed]
  57. Kim, S.-J.; Park, S.; Sin, H.-S.; Jang, S.-H.; Lee, S.-W.; Kim, S.-Y.; Kwon, B.; Yu, K.-Y.; Kim, S.; Yang, D. Hypocholesterolemic Effects of Probiotic Mixture on Diet-Induced Hypercholesterolemic Rats. Nutrients 2017, 9, 293. [Google Scholar] [CrossRef] [PubMed]
  58. Dore, R.; Levata, L.; Lehnert, H.; Schulz, C. Nesfatin-1: Functions and Physiology of a Novel Regulatory Peptide. J. Endocrinol. 2017, 232, R45–R65. [Google Scholar] [CrossRef] [PubMed]
  59. Öztürk Özkan, G. Effects of Nesfatin-1 on Food Intake and Hyperglycemia. J. Am. Coll. Nutr. 2020, 39, 345–351. [Google Scholar] [CrossRef] [PubMed]
  60. Tekin, T.; Cicek, B.; Konyaligil, N. Turkey Regulatory Peptide Nesfatin-1 and Its Relationship with Metabolic Syndrome. Eurasian J. Med. 2019, 51, 280–284. [Google Scholar] [CrossRef] [PubMed]
  61. Yin, Y.; Li, Z.; Gao, L.; Li, Y.; Zhao, J.; Zhang, W. AMPK-Dependent Modulation of Hepatic Lipid Metabolism by Nesfatin-1. Mol. Cell. Endocrinol. 2015, 417, 20–26. [Google Scholar] [CrossRef] [PubMed]
  62. Ruan, X.; Li, Z.; Zhang, Y.; Yang, L.; Pan, Y.; Wang, Z.; Feng, G.-S.; Chen, Y. Apolipoprotein A-I Possesses an Anti-Obesity Effect Associated with Increase of Energy Expenditure and up-Regulation of UCP1 in Brown Fat. J. Cell. Mol. Med. 2011, 15, 763–772. [Google Scholar] [CrossRef] [PubMed]
  63. Song, P.; Kwon, Y.; Yea, K.; Moon, H.-Y.; Yoon, J.H.; Ghim, J.; Hyun, H.; Kim, D.; Koh, A.; Berggren, P.-O.; et al. Apolipoprotein A1 Increases Mitochondrial Biogenesis through AMP-Activated Protein Kinase. Cell. Signal. 2015, 27, 1873–1881. [Google Scholar] [CrossRef] [PubMed]
  64. Lee, H.-J.; Jang, H.B.; Park, J.E.; Park, K.-H.; Kang, J.H.; Park, S.I.; Song, J. Relationship between Serum Levels of Body Iron Parameters and Insulin Resistance and Metabolic Syndrome in Korean Children. Osong Public Health Res. Perspect. 2014, 5, 204–210. [Google Scholar] [CrossRef] [PubMed]
  65. Zhao, H.-Q.; Wu, H.; Meng, R.; Du, S.; Tao, S.-J. Distribution of Serum Transferrin, and Its Associations with Metabolic Disorders among Chinese: A Nation-Wide, Health and Nutrition Survey. Mol. Nutr. Food Res. 2015, 59, 1535–1540. [Google Scholar] [CrossRef] [PubMed]
  66. Takahashi, E.; Unoki-Kubota, H.; Shimizu, Y.; Okamura, T.; Iwata, W.; Kajio, H.; Yamamoto-Honda, R.; Shiga, T.; Yamashita, S.; Tobe, K.; et al. Proteomic Analysis of Serum Biomarkers for Prediabetes Using the Long-Evans Agouti Rat, a Spontaneous Animal Model of Type 2 Diabetes Mellitus. J. Diabetes Investig. 2017, 8, 661–671. [Google Scholar] [CrossRef] [PubMed]
  67. Kirpich, I.A.; Gobejishvili, L.N.; Homme, M.B.; Waigel, S.; Cave, M.; Arteel, G.; Barve, S.S.; McClain, C.J.; Deaciuc, I.V. Integrated Hepatic Transcriptome and Proteome Analysis of Mice with High-Fat Diet-Induced Nonalcoholic Fatty Liver Disease. J. Nutr. Biochem. 2011, 22, 38–45. [Google Scholar] [CrossRef] [PubMed]
  68. Guzmán-Flores, J.; Flores-Pérez, E.; Hernández-Ortiz, M.; Vargas-Ortiz, K.; Ramírez-Emiliano, J.; Encarnación-Guevara, S.; Pérez-Vázquez, V. Protein Expression Profile of Twenty-Week-Old Diabetic Db/Db and Non-Diabetic Mice Livers: A Proteomic and Bioinformatic Analysis. Biomolecules 2018, 8, 35. [Google Scholar] [CrossRef] [PubMed]
Figure 1. Body weight gain (BWG) after 10 weeks of dietary intervention in mice. Data are expressed as mean ± standard error (SE). Different letters denote statistically significant differences (p < 0.05), as assessed by Tukey’s test. FGM: fermented goat milk; PGM: probiotic goat milk.
Fermentation 11 00419 g001
Figure 2. Relative organ weights of mice after 10 weeks of dietary intervention. (a) Liver weight; (b) spleen weight. Values are expressed as percentage per 100 g of body weight. Data are shown as individual values for each mouse (●), with minimum and maximum, median (—), and mean (+). Different letters indicate statistically significant differences (p < 0.05), as determined by Tukey’s test. FGM: fermented goat milk; PGM: probiotic goat milk.
Fermentation 11 00419 g002
Figure 3. Plasma transaminase levels in mice after dietary interventions. Data are expressed as mean ± SE. Different letters indicate statistically significant differences (p < 0.05), as assessed by Tukey’s test. ALT: alanine aminotransferase; AST: aspartate aminotransferase; FGM: fermented goat milk; PGM: probiotic goat milk.
Fermentation 11 00419 g003
Figure 4. Representative liver histological sections of mice after 10 weeks of dietary intervention. Hematoxylin–eosin staining; 40× magnification; scale bar: 20 μm. (a) Control + FGM; (b) Obese + FGM; (c) Obese + PGM1; (d) Obese + PGM2; (e) Obese + PGM3; (f) Obese + PGM4. FGM: fermented goat milk; PGM: probiotic goat milk.
Fermentation 11 00419 g004
Figure 5. Triglyceride–glucose index (TyG index) in mice after dietary interventions. Data are expressed as mean ± SE. Different letters indicate statistically significant differences (p < 0.05), as assessed by Tukey’s test. TG: triglycerides; Glucose: fasting plasma glucose; FGM: fermented goat milk; PGM: probiotic goat milk.
Fermentation 11 00419 g005
Figure 6. Cardiovascular risk indicators (CRI) in mice after 10 weeks of dietary intervention. Data are expressed as mean ± SE. Different letters in the same index denote significant differences (p < 0.05), as assessed by Tukey’s test. AC: atherogenic coefficient = (TC−HDL-c)/HDL-c; PAI: plasma atherogenic index = log(TG/HDL-c); LDL/HDL: ratio of low- to high-density lipoprotein cholesterol. FGM: fermented goat milk; PGM: probiotic goat milk.
Fermentation 11 00419 g006
Figure 7. Venn diagram showing the overlap of differentially expressed hepatic proteins in Control + FGM and Obese + PGM3 mice compared to Obese + FGM mice. FGM: fermented goat milk; PGM3: probiotic goat milk 3.
Fermentation 11 00419 g007
Figure 8. Functional categorization and regulation of hepatic proteins. (a) Obese + FGM vs. Control + FGM; (b) Obese + PGM3 vs. Obese + FGM. Overexpressed and downregulated proteins are classified by biological function. FGM: fermented goat milk; PGM3: probiotic goat milk 3.
Fermentation 11 00419 g008
Figure 9. Protein–protein interaction networks (STRING analysis) of differentially expressed hepatic proteins. (a) Obese + FGM vs. Control + FGM; (b) Obese + PGM3 vs. Obese + FGM. Node thickness reflects interaction strength. Functional clusters are grouped by lipid and amino acid metabolism and post-translational modifications. FGM: fermented goat milk; PGM3: probiotic goat milk 3.
Fermentation 11 00419 g009
Table 1. Plasma lipid profile of mice after dietary interventions.
GroupsTGTCLDL-cHDL-c
Control + FGM0.23 ± 0.02 a0.46 ± 0.01 a0.32 ± 0.02 a0.14 ± 0.01 b
Obese + FGM0.45 ± 0.05 c0.54 ± 0.03 a0.38 ± 0.03 ab0.10 ± 0.01 a
Obese + PGM10.50 ± 0.05 c0.57 ± 0.03 a0.36 ± 0.05 ab0.15 ± 0.01 bc
Obese + PGM20.39 ± 0.03 ab0.57 ± 0.07 a0.32 ± 0.08 ab0.16 ± 0.01 c
Obese + PGM30.29 ± 0.04 bc0.59 ± 0.04 a0.37 ± 0.05 ab0.16 ± 0.01 c
Obese + PGM40.46 ± 0.04 c0.57 ± 0.04 a0.40 ± 0.04 b0.13 ± 0.01 b
Data are shown as mean ± standard error (SEM); n = 6 per group. Values with different superscript letters in the same column differ significantly (p < 0.05), as assessed by Tukey’s test. TG: triglycerides; TC: total cholesterol; LDL-c: low-density lipoprotein cholesterol; HDL-c: high-density lipoprotein cholesterol (g l-1). FGM: fermented goat milk; PGM: probiotic goat milk.
Table 2. Differentially expressed hepatic proteins in mice from the Obese + FGM group compared to mice from the Control + FGM group.
Access No.GeneDescriptionCategory/FunctionExpression Changes
P12710Fabp1Fatty acid-binding protein 1Lipid metabolism3.73
P07361Agp2Alpha-1-acid glycoprotein 2Signal transduction mechanisms3.45
Q8VCH0Acaa1bAcetyl-CoA acyltransferaseLipid metabolism2.91
Q9DCX2Atp5hATP synthase subunit dEnergy production and conversion2.86
Q3U2G2Hspa4Heat shock protein 70Post-translational modification2.34
P70362Ufd1Ubiquitin recognition factorPost-translational modification2.22
P05201Got1Aspartate aminotransferaseAmino acid metabolism2.17
P63038Hspd1Heat shock protein 60Post-translational modification2.03
P17563Selenbp1Methanethiol oxidaseTransport−2.01
Q9DA03Lyrm7Complex III assembly factor LYRM7Energy production and conversion−2.12
Q5SWU9AcacaAcetyl-CoA carboxylaseLipid metabolism−2.15
Q03734Serpina3mSerine protease inhibitor A3MDefense mechanisms−2.28
O08692NgpNeutrophilic granule proteinDefense mechanisms−2.51
Q3UH59Myh10Myosin XCytoskeletal organization−2.64
F7AA26PakapProtein kinase A-anchoring proteinsSignal transduction mechanisms−3.69
Q8VCN5CthCystathionine gamma-lyaseAmino acid metabolism−4.36
P18419Svs4Seminal vesicle secretory protein 4Uncharacterized−4.43
G3X8T9Serpina3nSerine protease inhibitor A3NDefense mechanisms−4.77
P11588Mup1Major urinary protein 1Post-translational modification−4.84
P19157Gstp1Glutathione S-transferase P1Lipid metabolism−4.86
Q91V92AclyATP-citrate synthaseLipid metabolism−4.93
Expression values indicate fold change (positive: upregulated; negative: downregulated). FGM: fermented goat milk.
Table 3. Differentially expressed hepatic proteins in mice from the Obese + PGM3 group compared to mice from the Obese + FGM group.
Access No.GeneDescriptionCategory/FunctionExpression Changes
Q8BS30Svs2Seminal vesicle secretory protein 2Reproductive process5.44
P18419Svs4 Seminal vesicle secretory protein 4Reproductive process4.95
P81117Nucb2Nucleobindin-2Lipid metabolism4.51
Q00623Apoa1 Apolipoprotein A-ILipid metabolism3.15
O08692Ngp Neutrophilic granule proteinDefense mechanisms3.15
G3X8T9Serpina3nSerine protease inhibitor A3NDefense mechanisms3.08
P06728Apoa4Apolipoprotein A-IVLipid metabolism3.39
A0A5F8MPB9Rdx RadixinUncharacterized2.88
Q9R0U0Srsf10 Serine/arginine-rich splicing factor 10RNA processing and modification2.80
Q8C845Efhd2EF-hand domain-containing protein D2Uncharacterized2.54
P11588Mup22Major urinary protein 1Post-translational modification2.32
P19157Gstp1Glutathione S-transferase P1Lipid metabolism2.15
Q9WVB0Rbpms RNA-binding protein RNA processing and modification2.10
P43275H1-1 Histone H1Chromatin structure2.01
P30933Svs5 Seminal vesicle secretory protein 5Reproductive process2.23
Q64356Svs6 PSeminal vesicle secretory protein 6Reproductive process2.34
Q8BZH8Svs3b Seminal vesicle secretory protein 3BReproductive process2.46
Q01149Col1a2 Collagen type I alpha 2 chainExtracellular structures−2.36
Q9QXS1Plec PlectinCytoskeletal organization−2.40
D3YZD8AamdcMth938 domain-containing proteinUncharacterized−2.51
P0CG50UbcPolyubiquitin-CProtein metabolism−3.11
Q3U2G2Hspa4 Heat shock proteinPost-translational modification−3.38
P07361Agp2 /Alpha-1-acid glycoproteinSignal transduction mechanisms−3.77
Q921I1Orm2SerotransferrinSignal transduction mechanisms−3.98
Q9R1Z7Tf 6-pyruvoyltetrahydropterin synthaseCoenzyme metabolism−4.12
Expression values indicate fold change (positive: upregulated; negative: downregulated). FGM: fermented goat milk; PGM3: probiotic goat milk 3.
Disclaimer/Publisher’s Note: The statements, opinions and data contained in all publications are solely those of the individual author(s) and contributor(s) and not of MDPI and/or the editor(s). MDPI and/or the editor(s) disclaim responsibility for any injury to people or property resulting from any ideas, methods, instructions or products referred to in the content.

