Article

Characterization and Multi-Omics Basis of Biofilm Formation by Lactiplantibacillus plantarum

1
College of Biomass Science and Engineering, Sichuan University, Chengdu 610065, China
2
Key Laboratory of Leather Chemistry and Engineering, Ministry of Education, Sichuan University, Chengdu 610065, China
3
Wuliangye Yibin Co., Ltd., Yibin 644000, China
*
Authors to whom correspondence should be addressed.
Fermentation 2025, 11(7), 400; https://doi.org/10.3390/fermentation11070400
Submission received: 5 April 2025 / Revised: 21 May 2025 / Accepted: 9 July 2025 / Published: 12 July 2025

Abstract

Lactiplantibacillus plantarum is a kind of common lactic acid bacteria, which plays an important role in the production of fermented foods. In general, the formation of biofilm is conducive to the adaptability of cells in the face of fierce competition and an increasingly harsh fermentation environment. In this work, optimum conditions for the formation of biofilm by L. plantarum were investigated, and scanning electron microscopy (SEM) and confocal laser scanning microscopy (CLSM) analysis showed the morphology of biofilm cells and 3D architecture of biofilm under different conditions, respectively. In addition, cells in the biofilms showed higher cell viability under heat stress, acid stress, and oxidative stress compared with planktonic cells. RNA-seq technology and TMT-based proteomic technology were employed to reveal the differential expression of profiles between biofilm cells and planktonic cells. The shelter provided by biofilm and the differential expression of genes and proteins involved in PTS, the TCA cycle, alanine, and teichoic acid biosynthesis may be involved in the formation of biofilm cells. The results presented in this study will help to understand the formation of biofilms in L. plantarum and regulate the industrial performance of cells in the food industry.

1. Introduction

Biofilm is defined as a structured microbial community adherent to biotic or abiotic surfaces, characterized by its encapsulation within a self-secreted extracellular matrix (ECM) [1,2]. This ECM constitutes a dynamic three-dimensional architecture comprising hydrated bacterial cells, extracellular polymeric substances (EPS), and adsorbed particulate matter, which collectively mediate microbial adhesion and environmental adaptation [3]. Biofilm cells can exchange chemical substances through quorum sensing, thus regulating the acquisition and transport of nutrients, inter-cell hybridization, cell movement, and generation of metabolites, so that the biofilm becomes a group similar to multicellular organisms [4,5].
Previous research suggested that biofilm formation gave cells higher resistance to environmental stresses and probiotic properties [6]. As we all know, microorganisms will encounter various environmental stresses in the production of fermented foods, such as high salt stress, acid stress, extreme temperature, ethanol stress, oxidative stress, and so on. Biofilms can provide a barrier for cells to fight against adverse environmental factors. The strains of L. plantarum, Saccharomyces, and Acetobacter isolated during rice vinegar fermentation can form good biofilms and can produce ethanol and acetic acid efficiently and exhibit good tolerance to ethanol and pH [7]. In addition, it was suggested that regulating the formation of biofilm was a feasible and effective strategy to improve the stress resistance of cells [8]. Furthermore, biofilm diffusion after biofilm maturation can provide plankton cells, increasing the number of functional microbial cells. Several reports highlighted the biotechnological applications of controlled biofilm formation using beneficial microorganisms in fermentation processes. These applications primarily focus on controlling food spoilage or toxin-producing microorganisms within biofilms, optimizing fermentation conditions, and enhancing the yield and quality of fermented foods [9,10,11].
In recent years, increasing attention has been paid to the formation and characterization of biofilm in lactic acid bacteria (LAB). Hu et al. [12] cultured L. plantarum biofilm on electrospinning nanofiber membrane and found that compared with floating Lactobacillus, the lactobacilli biofilm on nanofiber membrane had excellent gastrointestinal resistance, and the number of surviving cells increased after 3 h of digestion in vitro. In some cases, LAB biofilms may improve the quality of food products because certain substances produced (such as aldehydes and ketones produced by LAB biofilms in some cheeses) can change the original aroma and texture of the food [13,14]. Speranza et al. [15] found that L. plantarum, L. casei, L. paracasei, and L. campylobacter can all form biofilms, and cheese fermented with lactobacilli biofilms also contained high-quality biofilms, and the biofilms in these cheeses can effectively inhibit the growth of Listeria monocytogenes.
The purpose of this study was to investigate the formation of biofilm by L. plantarum and to compare the properties of the biofilm cells with those of plankton cells. In addition, the transcriptomic and proteomic profiles of biofilm cells and planktonic cells were compared to investigate the molecular mechanism of biofilm formation by L. plantarum. The results of this study will help to further understand the formation of biofilm by LAB and improve the industrial functionality of cells during food fermentation.

2. Materials and Methods

2.1. Strains, Culture Conditions, and Biofilm Formation

The strain L. plantarum B6 (CCTCC 2022434) used in this study was isolated from kimchi and identified by physiological, biochemical, and 16S rDNA sequence analysis. It was stored in the China Center for Type Culture Collection Center (CCTCC).
The strain L. plantarum cultures stored at −80 °C were inoculated into MRS (deMan, Rogosa, and Sharp) medium (OxoidQ15, Hampshire, UK) and incubated at 30 °C for 24 h. The cell suspension was then inoculated at 1% (v/w) into 100 mL of fresh MRS medium. The culture with a final concentration of 1 × 10⁵ CFU/mL was distributed to a conical flask or 96-well or 24-well droplet polystyrene plate (Sangon Biotech, Shanghai, China). The biofilm was formed at 30 °C.
In order to optimize the conditions for biofilm formation, the effects of different carbon sources (glucose, galactose, lactose, cellobiose, fructose, sucrose, and mannose), glucose content (15, 20, 25, 30, and 35 g/L), pH (6.5, 6.0, 5.5, 5.0, 4.5, and 4.0), culture temperature (20, 25, 30, 37, and 42 °C), magnesium ion concentration (0, 8, 16, 24, and 32 mg/L), and supporting materials (polystyrene, glass, and stainless steel) on biofilm formation were investigated. The synthetic MRS medium was prepared from each component and added with a carbon source and magnesium ion in different concentrations. The cells were incubated at 30 °C for 72 h, and the amount of biofilm was measured.

2.2. Crystal Violet Assay

The detection of L. plantarum biofilm was referred to the method of Stepanovic et al. [16] and improved appropriately with some modifications. At the end of the culture, the fermentation broth in the upper portion of the culture medium was determined by the multi-function microplate tester at the wavelength 600 nm, and the biofilm was fixed with 99% methanol. After drying at 35~40 °C for 3 h, the cells were stained with 0.1% crystal violet for 10 min, washed with distilled water three times, and dried at 35 °C for 2 h. After drying, add 200 μL of 33% glacial acetic acid to rest for 5 min, wait for crystal violet to be desorbed completely, absorb 200 μL of 33% glacial acetic acid to clean the blank orifice plate, and use a multi-functional microplate tester to measure OD492 at a wavelength of 492 nm and record. The blank control was treated with clean MRS medium without inoculation. There parallels in each group were performed.

2.3. Scanning Electron Microscopy Analysis

For scanning electron microscopy (SEM) analysis, the biofilm cells were incubated in a 24-well plate with a sterile glass cover with a diameter of 12 mm at the bottom at 30 °C for 24 h. The methods of washing, fixing, dehydration, and drying of biofilm and planktonic cells refer to Yao et al. [17]. The biofilms and planktonic cells were sputtered and coated with gold and observed by SEM (Apreo S, Thermo Fisher Scientific, Waltham, MA, USA). The scan parameter was set to 15.00 kV.

2.4. Confocal Laser Scanning Microscopy Analysis

For confocal laser scanning microscopy (CLSM) analysis, cells were cultured in MRS medium containing glucose or sucrose as a carbon source and cultured at 37 °C or 25 °C, respectively. The biofilm cells were incubated in a glass-bottomed cell Petri dish with a diameter of 15 mm (NEST Biotechnology, Wuxi, China). The methods of staining and scanning of biofilm and planktonic cells refer to Yao et al. [17].

2.5. Cell Viability Assessment During Environmental Stresses

Biofilm cells were statically incubated in a 24-well plate for biofilm formation, and planktonic cells were incubated in a conical flask at 100 rpm. Both cells were cultured in MRS medium at 30 °C for 24 h. After incubation, the biofilm cells and planktonic cells were treated in fresh MRS medium adjusted to pH 2.30 with hydrochloric acid (acid stress) or fresh MRS medium containing 0.05% (v/v) H2O2 (oxygen stress). The planktonic cells were subjected to acid stress and oxygen stress at 30 °C and 100 rpm, while the biofilm cells were subjected statically to acid stress and oxygen stress at 30 °C. Heat stress was performed in a 45 °C water bath. Acid stress, oxidative stress, and heat stress were performed for 1, 2, 3, and 4 h. Then, 200 μL of each group was inoculated on MRS solid medium and cultured at 30 °C for 48 h. The number of living cells and survival rate were calculated according to the results of the blank group.

2.6. Transcriptomic and Proteomic Analyses

As for transcriptomic analysis, the biofilm cells (BC) and planktonic cells (PC) were collected, and RNA extraction and sequencing were performed according to methods described by Zhang et al. [18]. After sequencing, HASAT2 (version 2.0) was used to align RNA-seq reads with the genome of the reference strain L. plantarum SK151 (EMBL-EBI login: GCA_003269405.1), and the position of the sample short sequence in the reference genome sequence was recorded by RSeQC (version 2.6.1). Differentially expressed transcripts were quantified using DESeq2 (version 1.12.4), and the transcript with p < 0.05 and the expression fold changes > 1.5 was considered to be differentially expressed genes (DEGs). TopGO and Cluster Profiler were used for enrichment analysis of Gene Ontology (GO) and Kyoto Encyclopedia of Genes and Genomes (KEGG), respectively. When the corrected Q value ≤ 0.05, the GO term and KEGG pathway in DEGs were considered to be significantly abundant. As for TMT-based proteomic analysis, the protein extraction, digestion, and peptide fractionation were performed according to methods described by Yang et al. [19]. Proteins were detected by Majorbio (Shanghai Majorbio Bio-pharm Technology Co., Ltd., Shanghai, China), and proteins with expression fold changes > 1.2 and p < 0.05 were considered as differentially expressed proteins (DEPs). Bioinformatics analysis was performed using Blast2GO and KOBAS, including GO enrichment analysis and KEGG enrichment analysis.

2.7. Statistical Analysis

All the analyses were conducted in triplicate. The transcriptomic data and proteomic data were both obtained from three biological replicates. Significant differences were tested by one-way analysis of variance (ANOVA) using IBM SPSS Statistics Software (version 22) at p < 0.05, and Tukey’s test was applied for comparison of means.

3. Results

3.1. Biofilm Formation by L. plantarum

In this study, the growth and biofilm formation by L. plantarum were firstly investigated, and then the relationship between the biofilm formation and the growth of L. plantarum cells was explored (Figure 1). As shown in Figure 1A, L. plantarum entered the logarithmic phase and stationary phase after 6 h and 16 h of culture, respectively. The results of the crystal violet experiment showed that the biofilm grew continuously with the passage of time after inoculation, and the biofilm increased rapidly from 6 h to 16 h (Figure 1B). The illustration of Figure 1B also showed the continued growth of the biofilm area at the bottom of the 96-well plate.
It was previously reported that environmental conditions are closely related to the formation and structure of biofilms [20,21]. In this study, the effects of environmental conditions such as carbon source, ion concentration, pH, sugar content, temperature, and supporting materials on biofilm formation were investigated.
As shown in Figure 1C, both the growth and the film-forming properties of L. plantarum varied in different carbon sources, and the highest amount of biofilm was detected in glucose, followed by sucrose, lactose, mannose, fructose, and cellobiose, and the least in galactose. The amount of biofilm formed in glucose is more than two times that in other sugars except sucrose. Similarly, the cell concentrations from high to low were glucose, mannose, sucrose, cellobiose, fructose, lactose, and galactose. Figure 1D showed the effect of glucose concentration on biofilm formation. The results showed that the highest amount of biofilm and cell biomass was obtained when the glucose concentration was 30 g/L. Based on this, the increase or decrease in glucose concentration led to the decrease in biofilm. The effect of pH on cell growth and biofilm formation was investigated. As shown in Figure 1E, L. plantarum can form biofilm in an acidic environment, and no obvious differences were observed in biofilm formation at pH 5 to 6.5. When the pH was lower than 4.5, the biofilm quality and biomass decreased sharply, and the amounts of biofilm and biomass were less than half of the highest value when the pH was lower than 4. As for temperature, the amount of biofilm showed a peak distribution with the culture temperature, and the optimum temperature for biofilm formation was 30 °C, which was in agreement with the optimal growth temperature for cells (Figure 1F). The amount of biofilm at 30 °C demonstrated a 3.96-fold and 10.14-fold increase compared to that at 20 °C and 42 °C, respectively. Figure 1G displayed the effect of different magnesium ion concentrations on cell growth and biofilm formation. As shown in Figure 1G, the appropriate concentration of magnesium ions promoted biofilm formation. When the concentration of magnesium ions ranged from 16 to 24 mg/L, the amount of biofilm was the highest. When the concentration of magnesium ions was below 16 or above 24 mg/L, the amount of biofilm markedly decreased, and no obvious difference was observed from that without magnesium ions. In order to test the formation of biofilm on different supporting materials, three supporting materials (polystyrene, glass, and stainless steel) were used. The results showed that L. plantarum could form biofilm on all surfaces, among which the biofilm formed on the surface of polystyrene was the strongest, followed by stainless steel (Figure 1H).

3.2. Scanning Electron Microscopy Images of the Biofilm Matrix

The stationary phase cells were selected according to the bacterial growth curve, and the biofilm cells were further observed by SEM (Figure 2). The SEM micrographs in Figure 2A,a showed that the planktonic cells of L. plantarum were scattered and stacked together, and no attachment on the cell surface. While in biofilm cells (Figure 2B,b), there were block structures attached to the surface of biofilm cells.

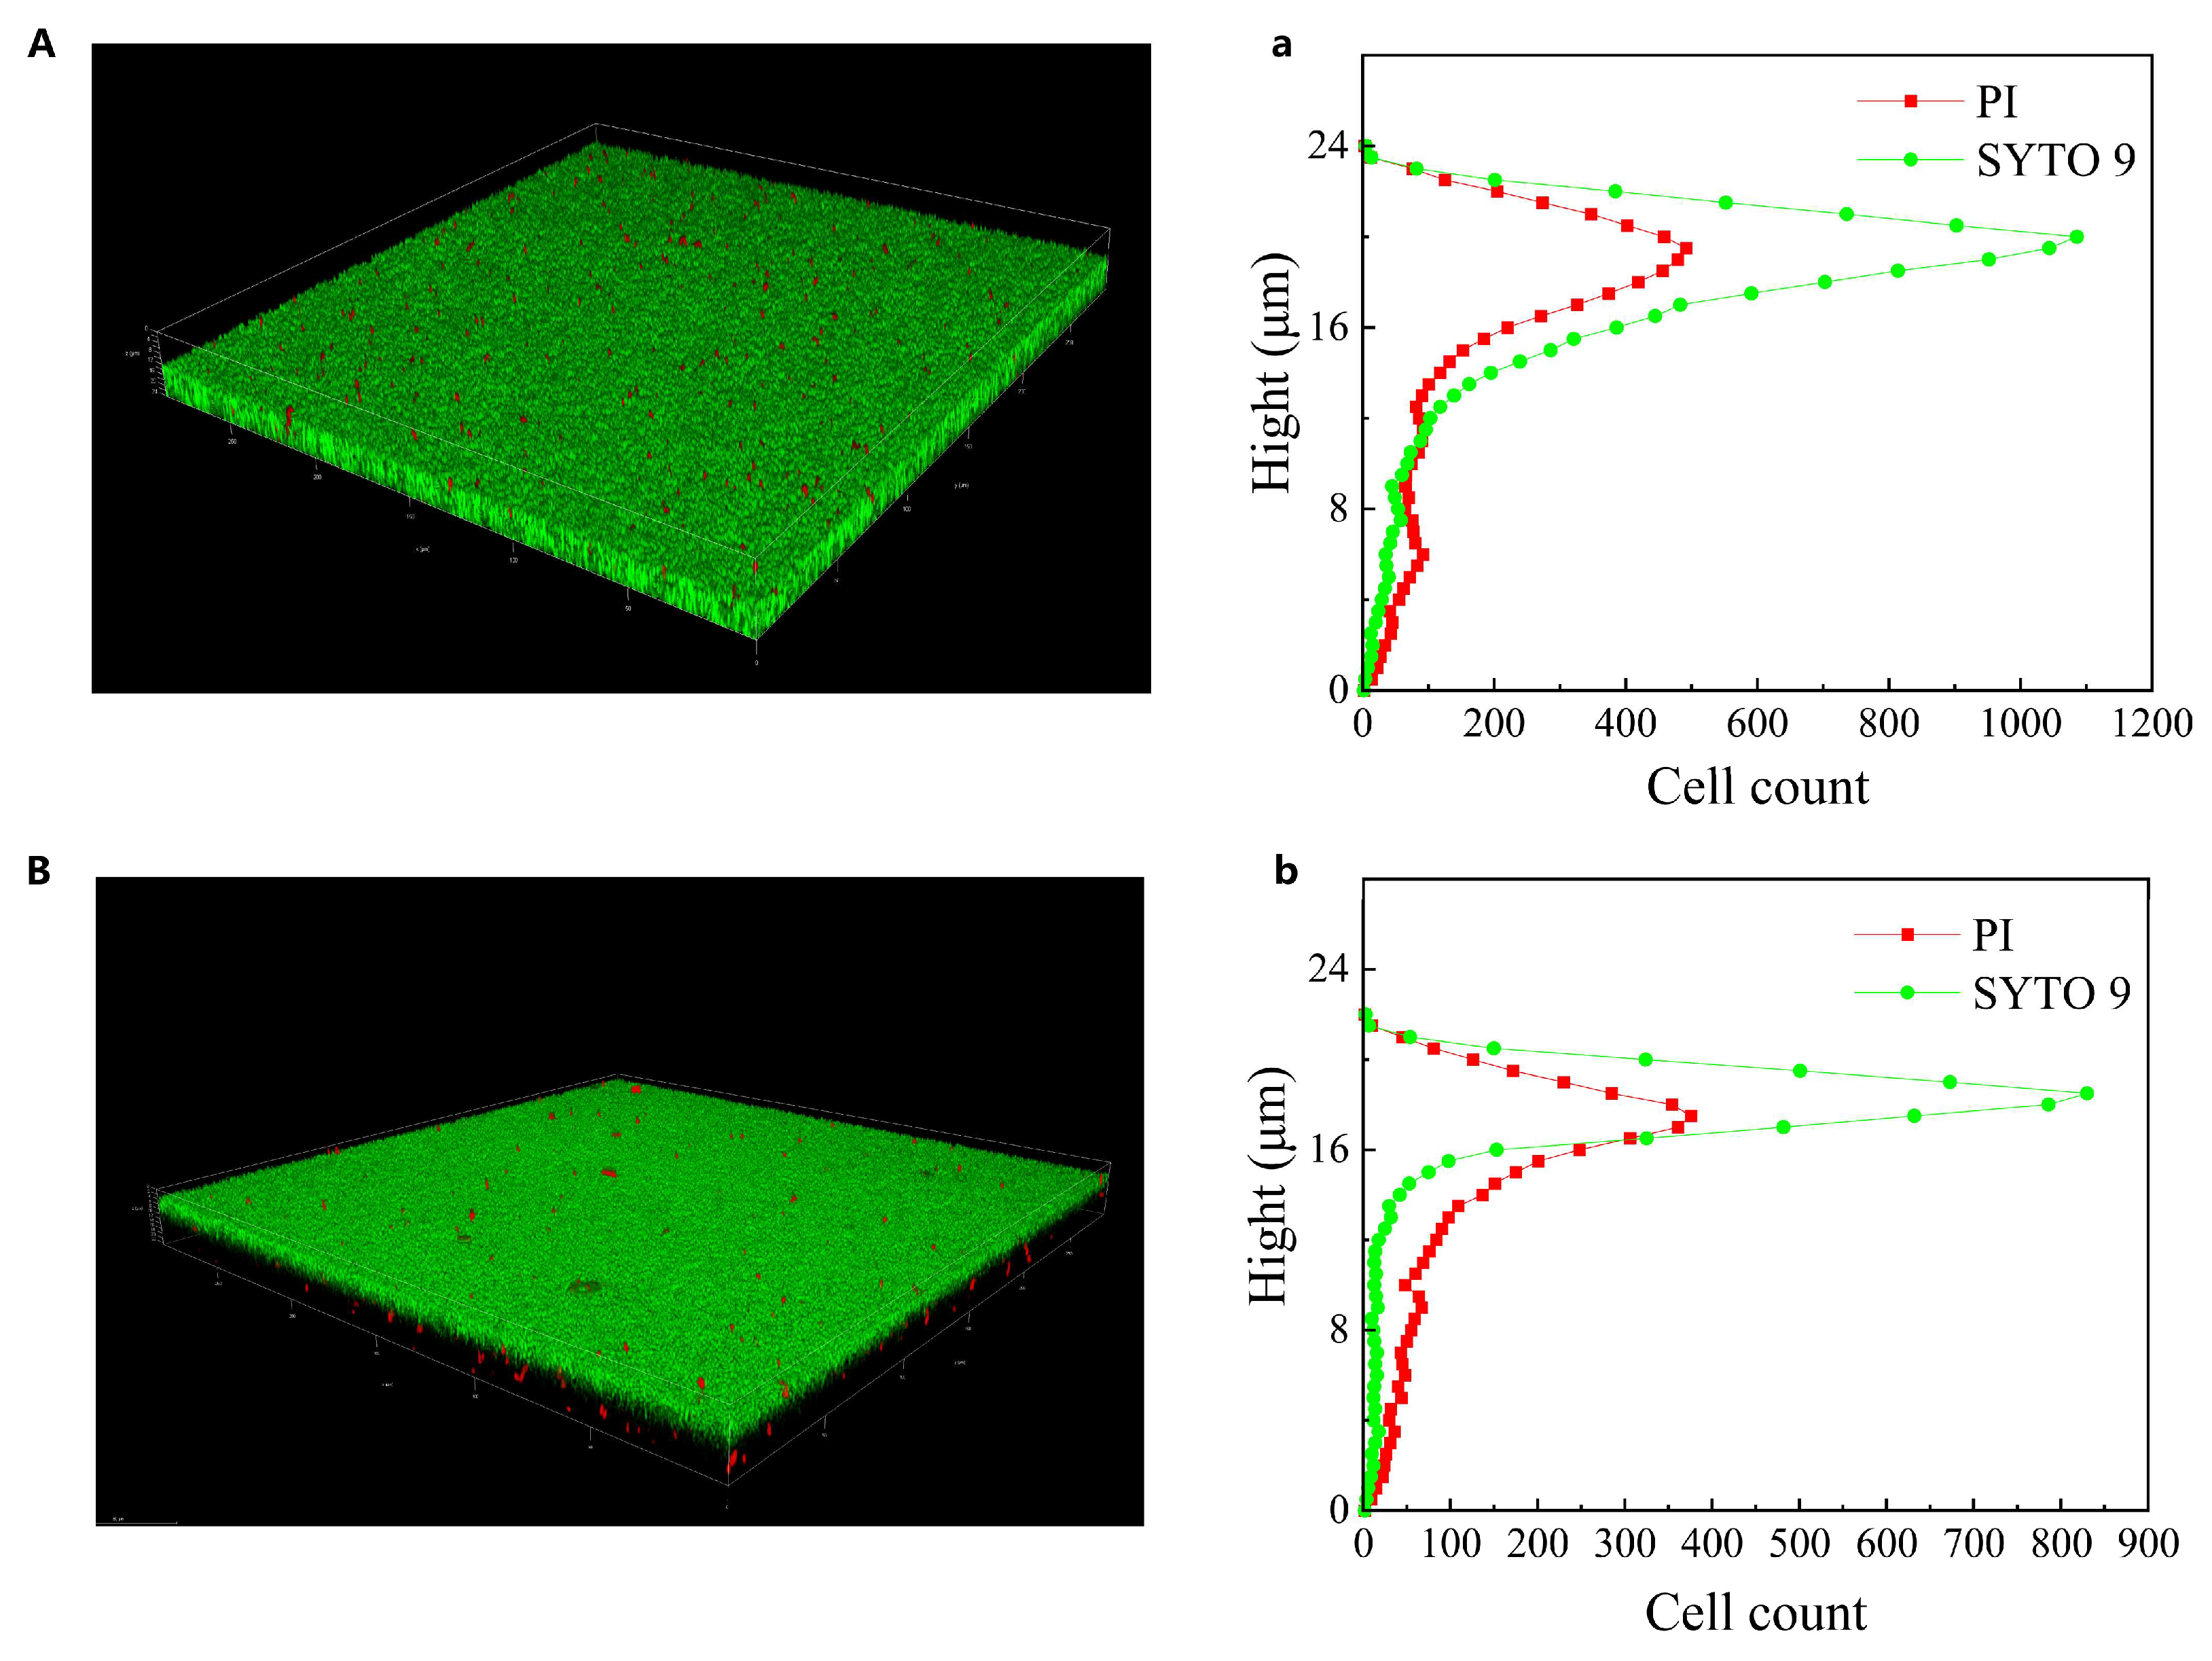
3.3. Three-Dimensional Architecture and Cell Distribution of L. plantarum Biofilm

CLSM analysis was performed to further explore the information about the distribution of cells in the biofilm and visualize other matrix components (Figure 3). CLSM analysis of biofilm cells under different culture conditions provided a better understanding of the 3D architecture of biofilm. As shown in Figure 3, the L. plantarum biofilm was stained by SYTO 9 and PI, and the spatial tissue of the L. plantarum biofilm was visualized. Figure 3A showed that L. plantarum cultured in glucose as a carbon source formed a dense biofilm covering the entire surface. Figure 3a showed the distribution of living cells and dead cells at different heights in a biofilm with a thickness of at least 24 μm. From the surface to the depth of 12 μm, the number of living cells was greater than that of dead cells, and more dead cells were measured below 19.5 μm. When cells were cultured in medium using sucrose as a carbon source, the biofilm was significantly thinner, and the number of living cells at 18.5 μm was less than the number of dead cells (Figure 3B,b).

3.4. Effect of Biofilm Formation on Cell Viability Under Environmental Stress

In this study, in order to investigate whether biofilm is beneficial to cell viability of L. plantarum under environmental stresses, survival rates of L. plantarum under acid stress, heat stress, and oxidative stress were determined (Figure 4). Under heat stress (45 °C), the survival rate of both cells gradually decreased, and biofilm cells exhibited slightly higher survival (10.19%) than that of planktonic cells (7.46%), and about 20% of biofilm cells still survived after heat stress for 3 h (Figure 4A). As shown in Figure 4B, when exposed to acid stress (pH 2.3) for 2 h, a large number of planktonic cells died, and the survival rate of biofilm cells was nine times higher than that of planktonic cells. When treated for 3 h, the biofilm cells exhibited a 4.2-fold higher survival rate compared to that of planktonic cells. Figure 4C suggested that after oxidative stress by 0.04% H2O2, the survival rate of biofilm cells was significantly higher than that of planktonic cells, and after oxygen shock for 2 h, the survival rate of biofilm cells was 2.15 times higher than that of planktonic cells.

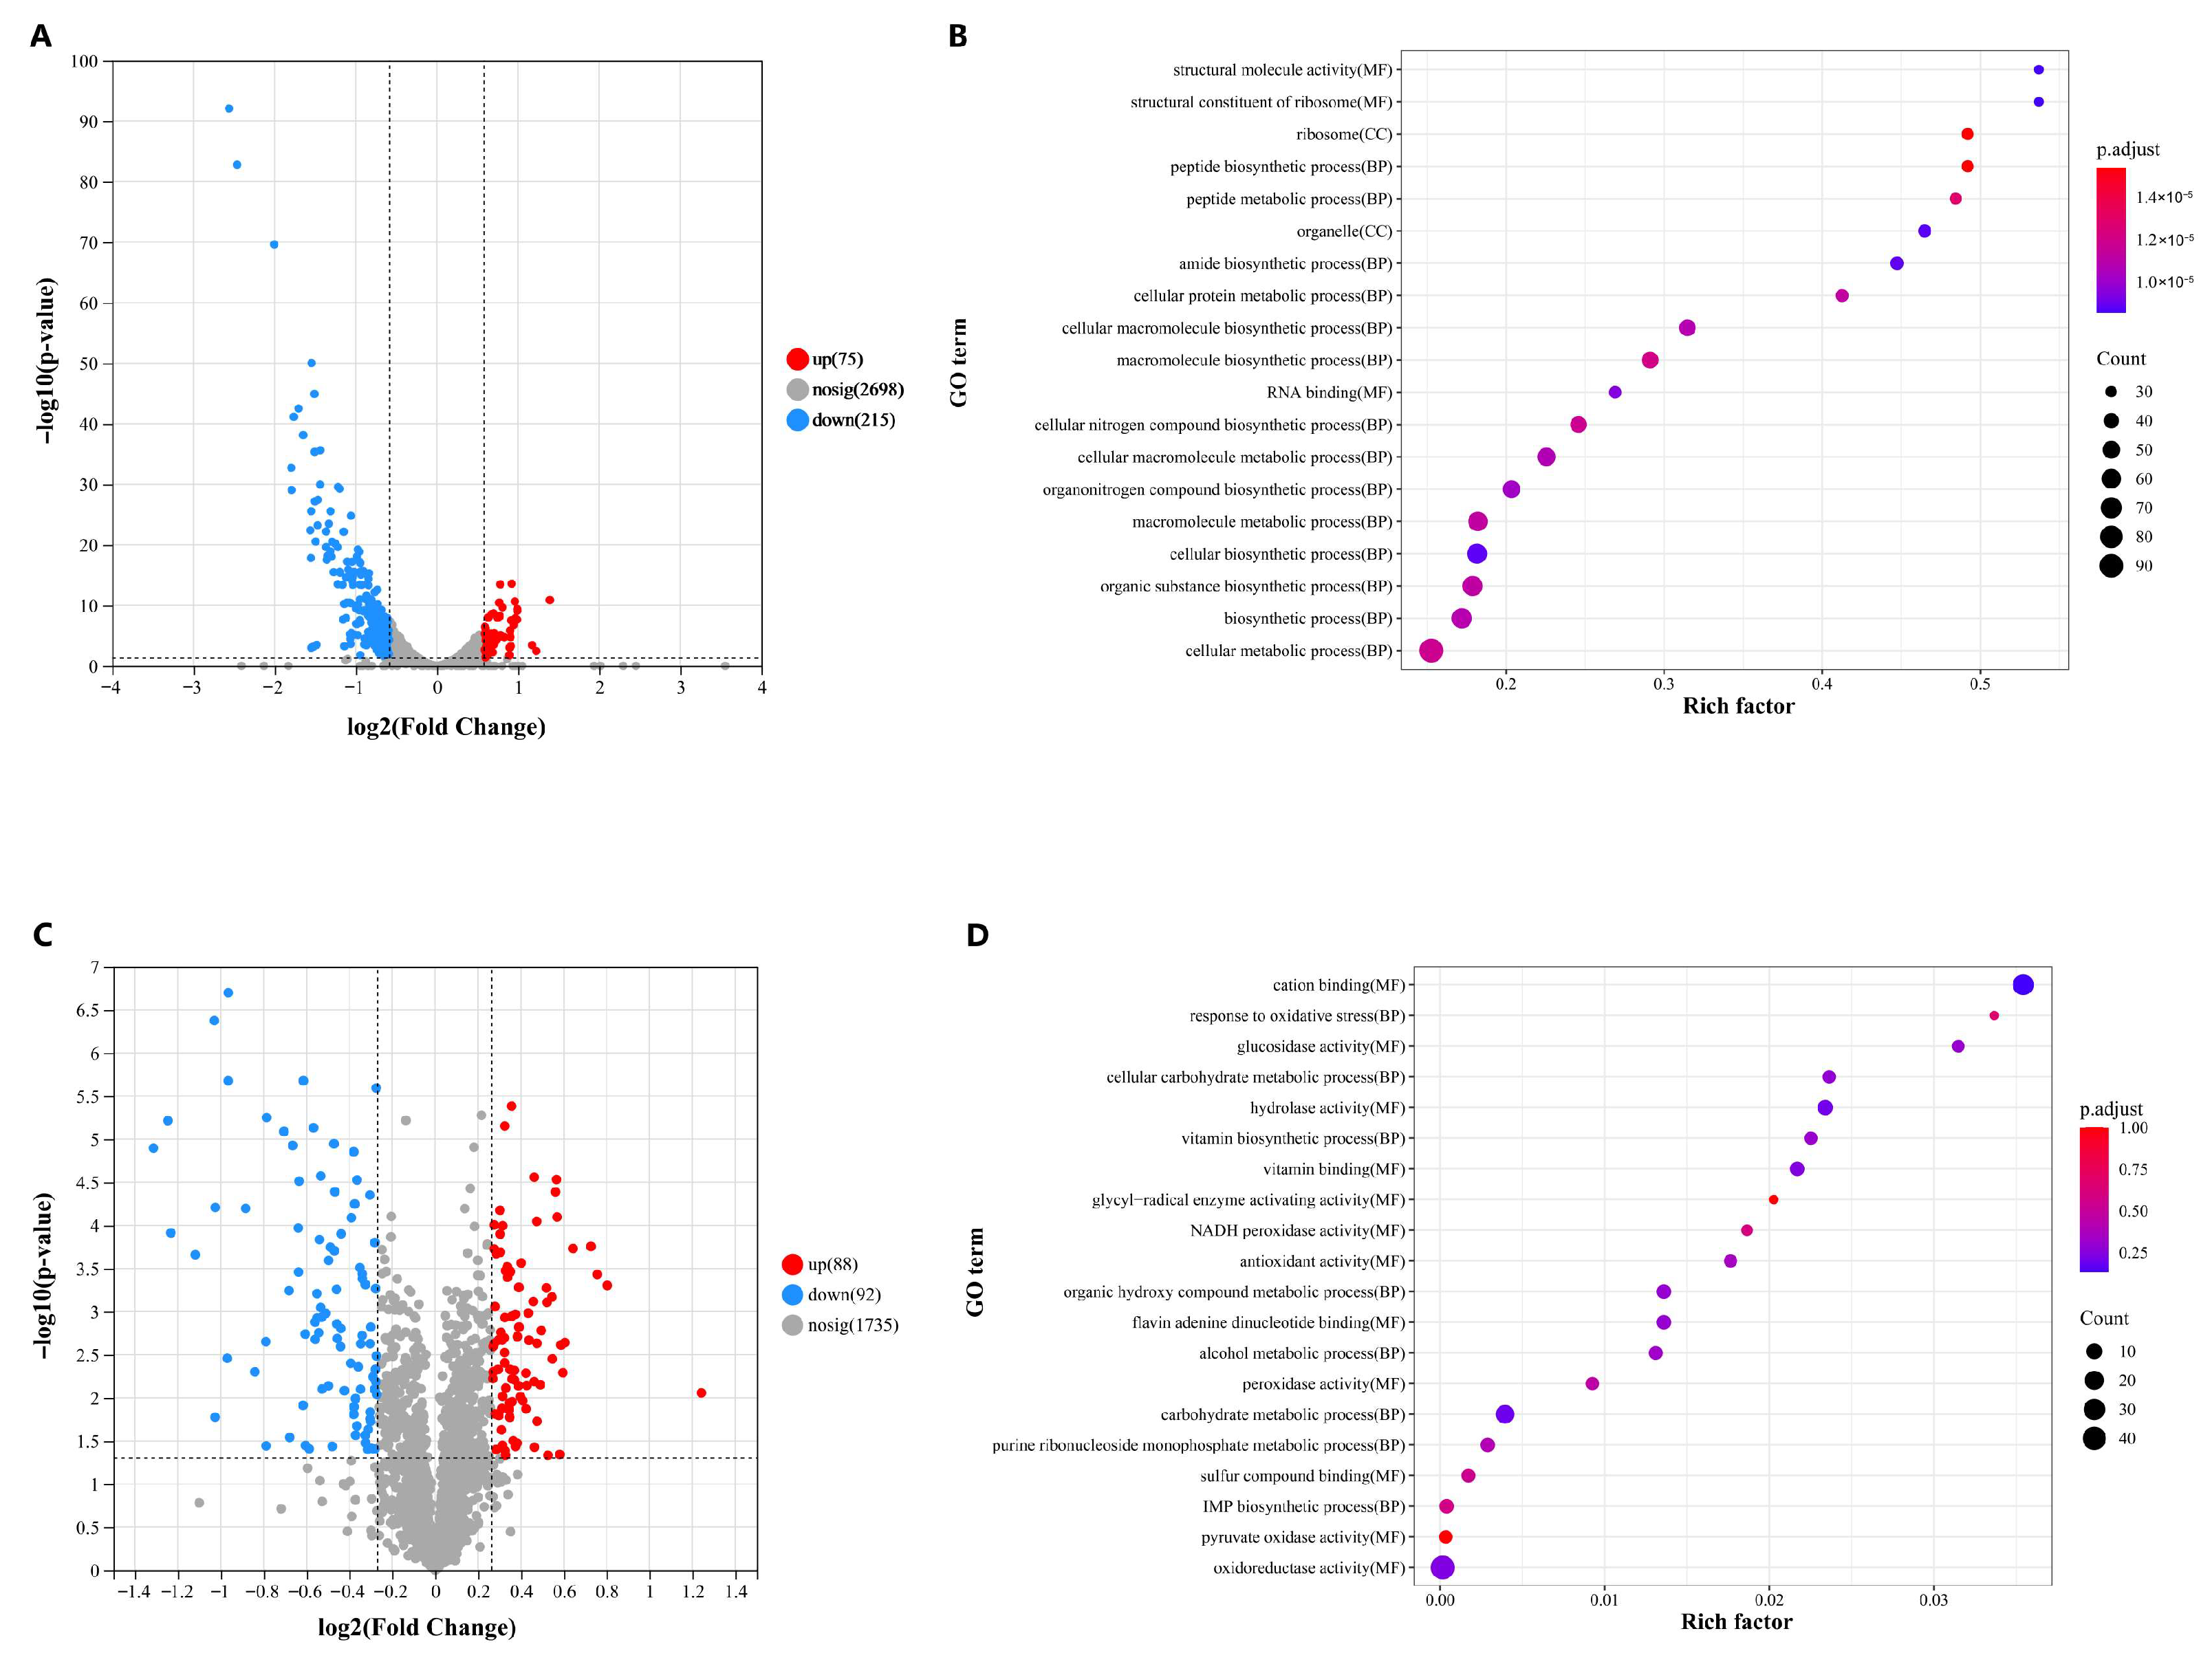
3.5. Transcriptomic and Proteomic Analyses

To further reveal the effect of biofilm formation on gene and protein expression of L. plantarum, RNA-seq-based transcriptomic and TMT-based proteomic analyses were employed to compare the gene and protein expression in L. plantarum between biofilm and planktonic cells. Compared with planktonic cells, biofilm culture resulted in up-regulation of 75 genes and down-regulation of 215 genes (Figure 5A). Table S1 showed more detailed information on DEGs expression and KO entries of DEGs. GO enrichment analysis of DEGs was carried out, and the results are shown in Figure 5B. Based on GO enrichment analysis, it was indicated that DEGs were mainly dispersed in cellular metabolic, biosynthetic, organic substance biosynthetic, and cellular biosynthetic processes. The significantly enriched GO terms were mainly related to biological processes (BP). Proteomic analysis demonstrated that a total of 1915 proteins were identified from all samples, with 88 proteins and 92 proteins displaying higher and lower expression in biofilm cells, respectively, compared with planktonic cells (Figure 5C, Table S2). GO enrichment analysis indicated that most DEPs were enriched in oxidoreductase activity and cation binding in MF and carbohydrate metabolic processes in BP (Figure 5D).
The differentially expressed genes and proteins in biofilm cells (BC) and planktonic cells (PC) based on KEGG enrichment analysis are shown in Figure 6. Biofilm formation led to the up-regulation of differentially expressed genes involved in purine metabolism, propanoate metabolism, carbon fixation pathways, fatty acid biosynthesis, and other pathways (Figure 6A). The down-regulated expression of genes involved in ribosome, phosphotransferase system (PTS), pyruvate metabolism, two-component system, amino sugar and nucleotide sugar metabolism, and fructose and mannose metabolism (Figure 6B). The up-regulated DEPs in biofilm culture were mainly involved in starch and sucrose metabolism, pyruvate metabolism, ABC transporters, cysteine and methionine metabolism, glycolysis/gluconeogenesis, cysteine and methionine metabolism, and butanoate metabolism (Figure 6C). The down-regulated expression of proteins was mainly enriched in purine metabolism, biosynthesis of cofactors, thiamine metabolism, and galactose metabolism (Figure 6D).

4. Discussion

In this study, the conditions for biofilm formation by L. plantarum were investigated, and the effects of environmental conditions, including carbon sources, pH, magnesium ion content, temperature, and support material, were explored. The results of cell growth and biofilm formation of L. plantarum showed that there was a significant positive correlation between the number of biofilms and cell density. A detailed analysis of this result showed that when the cell biomass remained unchanged in the stationary phase, a slight increase in biofilm mass was observed, which may be due to the accumulation of biofilm matrix caused by cell secretion and death [22]. When different carbon sources were selected, the biomass and biofilm formation of L. plantarum were different. When glucose was used as a carbon source, the growth and biofilm formation ability of L. plantarum were the highest (Figure 1), which proved that glucose played a very important role in the growth, reproduction, and metabolism of LAB. Similar results were also reported by Terraf et al. [23], who found that biofilm formation was not observed when L. rhamnosus, L. reuteri, and L. delbrueckii were cultured in MRS medium lacking glucose as a carbon source. Moreover, high-degree polymerizate (DP) isomaltooligosaccharides (IMOs) culture of L. paracasei could significantly promote biofilm formation and thus play its probiotic role [24]. The content of the carbon source will also affect the quality of bacterial biofilm formation. Slížová et al. [25] suggested that the biofilm growth of L. reuteri was the best at a glucose concentration of 1%, and a gradual increase in the sugar concentration instigated a significant decrease in biofilm formation. With increasing glucose concentration in culture medium, the dry weight of the biofilm, along with the areal densities of extracellular proteins and polysaccharides, exhibited a biphasic trend characterized by an initial increase followed by a progressive decline [26]. The reason why the growth and biofilm formation are inhibited in high-concentration glucose may be that high-concentration glucose can lead to excessive osmotic pressure to inhibit the production of extracellular polysaccharides or hinder the absorption of nutrients from the culture medium. L. plantarum had a certain tolerance to low pH (Figure 1). Similarly, Yang et al. [27] found that the growth rate of L. plantarum strain 48-1 was significantly higher than that of other strains at pH 3.5. Temperature is also one of the important indicators of bacterial growth. Muruzovic et al. [28] reported that Lactococcus lactis subsp. lactis KGPMF23 and Lactobacillus fermentum KGPMF29 failed to form biofilm at 4 °C, while the biofilm at 37 °C grew better than that at 20 °C. Magnesium ions can also affect the production of biofilm. Previous research suggested that metal ions such as Ca2+ and Mg2+ were closely related to biofilm formation [29]. Metal divalent cations had a stabilizing effect on bacterial outer membrane lipopolysaccharide, thus contributing to the cross-linking stability of bacterial extracellular polysaccharides. The electrostatic interaction between metal divalent cations and anions also contributed to the aggregation and adhesion of bacteria, which was conducive to the formation of biofilms [30]. The amount of biofilm formed by L. plantarum on the polystyrene board was the highest. However, Yao et al. [17] found that the adhesion of Tetragenococcus halophilus on hydrophilic surfaces (stainless steel and glass) was better than that on hydrophobic surfaces (polystyrene). Heistad et al. [31] found that interfacial hydrophobicity did not make a difference in the formation and stability of biofilm. Thus, it can be seen that the relationship between the carrier interface and the formation and stability of the biofilm needs to be further explored.
Clear cell colonies can be observed in SEM images; dense colonies can be observed in cell clusters; and extracellular substances can be observed between cells (Figure 2). Moreover, the biofilm cells displayed better adhesion than planktonic cells, which may be explained by the biofilm matrix layer covering the biofilm cells [32]. As shown in SEM images, we can observe the specific structure of biofilms and gain a better understanding of their effects on cells. CLSM images revealed the spatial structure of the biofilm, which tightly enveloped the cell surface with a certain thickness, and showed the difference in the number of live and dead cells in different biofilm heights (Figure 3). This phenomenon may be due to the fact that the cells near the surface of the culture dish died and disintegrated, while the upper cells exhibited a high survival rate due to better living conditions. In addition, the images also demonstrated that glucose was a more suitable carbon source for biofilm cultivation compared to sucrose, which was consistent with the results obtained above (Figure 1).
Biofilm is considered to play an important role in cell survival and metabolism. In previous research on the biofilm of L. plantarum, biofilm cells showed better tolerance to various stresses, including acid stress, ethanol stress, and antibiotics, compared to planktonic cells [33,34]. Generally, the formation of biofilm was an important means for cells to resist environmental pressure, and biofilm provided a natural barrier for cells so that the cells could survive under environmental pressure. Previous studies found that biofilms can protect microorganisms from environmental stresses such as drying, osmotic pressure, oxidative stress, and antibiotics [35,36]. In addition, biofilm cells were also reported to be resistant to metal ions in the environment through related metabolic changes in extracellular polysaccharides [37].
In recent years, omics technology has been widely used to study biofilm-related topics. To further deepen the understanding of mechanisms for biofilm formation, combined transcriptomics and proteomics analyses were performed. In this study, genes and proteins exhibiting significantly differential expression in biofilm cells compared with planktonic cells were revealed. According to the results of GO enrichment analysis of DEGs and DEPs, genes related to cellular metabolic process, biosynthetic process, organic substance biosynthetic process, cellular biosynthetic process in biofilm cells, and proteins related to oxidoreductase activity, cation binding, and carbohydrate metabolic process were significantly regulated in biofilm cells. The analysis of Lactobacillus rhamnosus by Liu et al. [38] showed that 368 genes were overexpressed and 413 genes were underexpressed during the attachment phase, and then the maturation phase yielded 162 up-regulated genes and 279 down-regulated genes in biofilm state cells in Mn2+-deficient and normal environments. Xu et al. [39] found that the biofilm formation of Lactobacillus reuteri SH23 was only half of that under normal conditions in the simulated gastrointestinal tract (GIT) environment. Proteomics analysis showed that 83 proteins were up-regulated and 297 proteins were down-regulated after treatment.
To further elucidate the key genes/proteins potentially involved in biofilm formation, a detailed analyses of the transcriptomic and proteomic were performed, and the results are shown in Figure 7. ABC transporter proteins are transmembrane transporters that are ubiquitously identified in biofilms. They utilized the energy generated by hydrolyzing ATP to complete the transport of various substances, from small ions to large proteins. Four genes (fliY, tcyC, glnH, and tcyB) involved in ABC protein transport were down-regulated after biofilm formation, but the expressions of five related proteins (GanQ, GanP, CycB, MsmX, and PatB) were up-regulated. The two-component system is the main signal transduction mechanism in bacteria, which enables bacterial cells to perceive changes in the environment and adjust their intracellular state. Previous studies showed that the two-component system played a key role in the regulation of microbial stress tolerance and biofilm formation [40,41]. In this study, two genes (lrgA and lrgB) involved in the two-component system were down-regulated during biofilm formation. lrgA and lrgB may be involved in the formation of extracellular murein hydrolase transport channels to regulate signal transduction and then control programmed cell death [42]. These genes accumulated in this pathway by sensing external signal stimulation, eventually leading to biofilm formation. D-alanine is a structural component of peptidoglycan in bacterial cell walls. Cells regulate surface charge by attaching D-alanine ester to teichoic acid, so D-alanine can affect the formation of biofilm [43]. The protein D-alanine-poly(phosphoribitol) ligase subunit-2 (DltC) involved in teichoic acid biosynthesis and D-amino acid metabolism was up-regulated in biofilm cells. This may lead to changes in cell surface properties that increase cell aggregation and promote biofilm formation. A total of eleven DEGs (fruK, fruA, bglF, nagE, manY, manX, mtlA, manZ, celB, celA, and scrA) and three DEPs (CelB, BglF, and Fruab) were associated with the phosphotransferase system, as well as energy metabolism and carbohydrate metabolism pathways, including pyruvate metabolism, glycolysis/gluconeogenesis, the TCA cycle, the pentose phosphate pathway, glyoxylic acid and dicarboxylic acid metabolism, oxidative phosphorylation, and starch and sucrose metabolism. These DEGs and DEPs may have a profound impact on the precursors and energy supply of cellular metabolic processes. At the same time, in the study of biofilms of some microorganisms, differential expressions of genes or proteins in some of the above pathways were also reported, including pyruvate metabolism, the TCA cycle, the pentose phosphate pathway, and glycolysis/gluconeogenesis [19,44,45]. Compared with planktonic cells, the expression levels of most DEGs in the PTS and TCA cycles in biofilm cells were lower, indicating that the cells showed a tendency to reduce carbohydrate uptake. In addition, the down-regulated expressions of DEGs and DEPs were inhibited in pyruvate metabolism, glyoxylic acid and dicarboxylic acid metabolism, and pentose phosphorylation, indicating energy metabolism and respiratory intensity in biofilms. While DEPs (AmY, MapA, MalZ, TreC, and MalL) involved in starch and sucrose metabolism were up-regulated in biofilm cells. In addition, although genes involved in alanine, aspartate, and glutamate metabolism in planktonic cells showed up-regulated expression, most DEGs and DEPs involved in amino sugar and nucleotide sugar metabolism, purine metabolism, arginine biosynthesis, and phenylalanine, tyrosine, and tryptophan biosynthesis were up-regulated after biofilm formation. Combined with results obtained in Figure 1 that biofilm cells displayed higher biomass, it can be seen that biofilm cells had a stronger ability to synthesize DNA. Therefore, it can be speculated that these DEGs and DEPs may contribute to cell aggregation and biofilm formation.

5. Conclusions

This study investigated the formation of biofilm by L. plantarum and characterized the structure of biofilm by SEM and CLSM. Then, the stress tolerance between planktonic cells and biofilm cells was compared, and the results suggested that the formation of biofilm increased the stress tolerance of cells to environmental stresses. Transcriptomics and proteomics analyses were employed to explore the molecular mechanism of biofilm formation, and the DEGs and DEPs during biofilm formation were revealed. In conclusion, these results may help to further understand the biofilm formation mechanism of LAB and subsequently improve the robustness and industrial performance of LAB.

Supplementary Materials

The following supporting information can be downloaded at: https://www.mdpi.com/article/10.3390/fermentation11070400/s1. Table S1: The expression and KO entries of DEGs in PC vs. BC. Table S2: The expression and KO entries of DEPs in PC vs. BC.

Author Contributions

Conceptualization, R.M., D.Z., R.Z., J.Z., and C.W.; methodology, R.M., D.Z., R.Z., J.Z., and C.W.; software, R.M.; validation, R.M., J.Z., and C.W.; formal analysis, R.M.; investigation, D.Z., J.Z., and C.W.; resource, D.Z. and J.Z.; writing—original draft preparation, R.M.; writing—review and editing, R.M., R.Z., and C.W.; supervision, D.Z., R.Z., J.Z., and C.W. All authors have read and agreed to the published version of the manuscript.

Funding

This work was financially supported by the National Natural Science Foundation of China (32272280), the Science and Technology Department of Sichuan Province of China (2023ZHJY0022), and the Open Funding Project of Key Laboratory of Wuliangye-flavor Liquor Solid-state Fermentation, China National Light Industry (2022JJ002).

Institutional Review Board Statement

Not applicable.

Informed Consent Statement

Not applicable.

Data Availability Statement

The original contributions presented in this study are included in the article/Supplementary Materials. Further inquiries can be directed to the corresponding authors.

Conflicts of Interest

Authors Jia Zheng and Dong Zhao were employed by the company Wuliangye Yibin Co., Ltd. Jia Zheng participated in conceptualization, methodology, validation, investigation, resource, supervision, and writing—review and editing of this study. Dong Zhao participated in conceptualization, methodology, investigation, resource, and supervision of this study. The role of the company was to fund the research. The remaining authors declare that the research was conducted in the absence of any commercial or financial relationships that could be construed as a potential conflict of interest. The authors declare that this study received funding from Wuliangye Yibin Co., Ltd. The funder was not involved with methodology, resources, analysis, and writing—review and editing of this study.

References

  1. Brück, H.L.; Delvigne, F.; Dhulster, P.; Jacques, P.; Coutte, F. Molecular strategies for adapting 168 biosurfactant production to biofilm cultivation mode. Bioresour. Technol. 2019, 293, 122090. [Google Scholar] [CrossRef] [PubMed]
  2. Merino, L.; Procura, F.; Trejo, F.M.; Bueno, D.J.; Golowczyc, M.A. Biofilm formation by Salmonella sp. in the poultry industry, Detection, control and eradication strategies. Food Res. Int. 2019, 119, 530–540. [Google Scholar]
  3. Hu, X.W.; Chen, K.; Lai, X.K.; Ji, S.P.; Kaiser, K. Effects of Fe (III) on biofilm and its extracellular polymeric substances (EPS) in fixed bed biofilm reactors. Water Sci. Technol. 2016, 73, 2060–2066. [Google Scholar] [CrossRef]
  4. Da Silva, D.P.; Schofield, M.C.; Parsek, M.R.; Tseng, B.S. An update on the sociomicrobiology of quorum sensing in gram-negative biofilm development. Pathogens 2017, 6, 51. [Google Scholar] [CrossRef]
  5. Tseng, B.S.; Majerczyk, C.D.; da Silva, D.P.; Chandler, J.R.; Greenberg, E.P.; Parsek, M.R. Quorum sensinginfluences biofilm development and matrix production. J. Bacteriol. 2016, 198, 2643–2650. [Google Scholar] [CrossRef] [PubMed]
  6. Al-Hadidi, A.; Navarro, J.; Goodman, S.D.; Bailey, M.T.; Besner, G.E. Lactobacillus reuteri in its biofilm state improves protection from experimental necrotizing enterocolitis. Nutrients 2021, 13, 918. [Google Scholar] [CrossRef] [PubMed]
  7. Furukawa, S. Studies on formation, control and application of biofilm formed by food related microorganisms. Biosci. Biotechnol. Biochem. 2015, 79, 1050–1056. [Google Scholar] [CrossRef]
  8. Nguyen, P.T.; Nguyen, T.T.; Nguyen, T.T.U.; Hoang, Q.K.; Nguyen, H.T. Improve the viability and extracellular polymeric substances bioactivity of VAL6 using the environmental adaptation. Food Bioprod. Process. 2022, 131, 149–155. [Google Scholar] [CrossRef]
  9. Berlanga, M.; Guerrero, R. Living together in biofilms: The microbial cell factory and its biotechnological implications. Microb. Cell Factories 2016, 15, 165. [Google Scholar] [CrossRef]
  10. Assaf, J.C.; El Khoury, A.; Chokr, A.; Louka, N.; Atoui, A. A novel method for elimination of aflatoxin M1 in milk using GG biofilm. Int. J. Dairy Technol. 2019, 72, 248–256. [Google Scholar] [CrossRef]
  11. Pannella, G.; Lombardi, S.J.; Coppola, F.; Vergalito, F.; Iorizzo, M.; Succi, M.; Tremonte, P.; Iannini, C.; Sorrentino, E.; Coppola, R. Effect of biofilm formation by on the malolactic fermentation in model wine. Foods 2020, 9, 797. [Google Scholar] [CrossRef]
  12. Hu, M.X.; Li, J.N.; Guo, Q.; Zhu, Y.Q.; Niu, H.M. Probiotics biofilm-integrated electrospun nanofiber membranes: A new starter culture for fermented milk production. J. Agric. Food Chem. 2019, 67, 3198–3208. [Google Scholar] [CrossRef]
  13. Shokri, D.; Khorasgani, M.R.; Mohkam, M.; Fatemi, S.M.; Ghasemi, Y.; Taheri-Kafrani, A. The inhibition effect of Lactobacilli against growth and biofilm formation of Pseudomonas aeruginosa. Probiotics Antimicrob. Proteins 2018, 10, 34–42. [Google Scholar] [CrossRef] [PubMed]
  14. Ramírez, M.D.F.; Smid, E.J.; Abee, T.; Groot, M.N.N. Characterisation of biofilms formed by WCFS1 and food spoilage isolates. Int. J. Food Microbiol. 2015, 207, 23–29. [Google Scholar] [CrossRef] [PubMed]
  15. Speranza, B.; Sinigaglia, M.; Corbo, M.R. Non starter lactic acid bacteria biofilms: A means to control the growth of Listeria monocytogenes in soft cheese. Food Control 2009, 20, 1063–1067. [Google Scholar] [CrossRef]
  16. Stepanović, S.; Vuković, D.; Dakić, I.; Savić, B.; Švabić-Vlahović, M. A modified microtiter-plate test for quantification of staphylococcal biofilm formation. J. Microbiol. Methods 2000, 40, 175–179. [Google Scholar] [CrossRef]
  17. Yao, S.J.; Hao, L.Y.; Zhou, R.Q.; Jin, Y.; Huang, J.; Wu, C.D. Formation of biofilm by Tetragenococcus halophilus benefited stress tolerance and anti-biofilm activity against S. aureus and S. Typhimurium. Front. Microbiol. 2022, 13, 819302. [Google Scholar] [CrossRef]
  18. Zhang, L.J.; Zhang, L.; Xu, Y. Effects of Tetragenococcus halophilus and Candida versatilis on the production of aroma-active and umami-taste compounds during soy sauce fermentation. J. Sci. Food Agric. 2020, 100, 2782–2790. [Google Scholar] [CrossRef] [PubMed]
  19. Yang, H.; Zhang, L.; Li, J.S.; Jin, Y.; Zou, J.P.; Huang, J.; Zhou, R.Q.; Huang, M.Q.; Wu, C.D. Cell surface properties and transcriptomic analysis of cross protection provided between heat adaptation and acid stress in Tetragenococcus halophilus. Food Res. Int. 2021, 140, 110005. [Google Scholar] [CrossRef]
  20. Desai, S.; Sanghrajka, K.; Gajjar, D. High adhesion and increased cell death contribute to strong biofilm formation in Klebsiella pneumoniae. Pathogens 2019, 8, 277. [Google Scholar] [CrossRef]
  21. Campoccia, D.; Montanaro, L.; Arciola, C.R. A review of the biomaterials technologies for infection-resistant surfaces. Biomaterials 2013, 34, 8533–8554. [Google Scholar] [CrossRef]
  22. Zhang, B.; Yang, X.; Liu, L.C.; Chen, L.; Teng, J.; Zhu, X.P.; Zhao, J.M.; Wang, Q. Spatial and seasonal variations in biofilm formation on microplastics in coastal waters. Sci. Total Environ. 2021, 770, 145303. [Google Scholar] [CrossRef] [PubMed]
  23. Terraf, M.C.L.; Juárez, T.M.S.; Nader-Macías, M.E.F.; Silva, C. Screening of biofilm formation by beneficial vaginal lactobacilli and influence of culture media components. J. Appl. Microbiol. 2012, 113, 1517–1529. [Google Scholar] [CrossRef]
  24. Lin, Q.R.; Liu, M.W.; Ni, H.; Hao, Y.; Yu, Y.Q.; Chen, Y.R.; Wu, Q.; Shen, Y.; Zhang, L.; Lyu, M.; et al. High-degree polymerizate IMOs of dextranase hydrolysates enhance Lactobacillus acid metabolism: Based on growth, and metabolomic and transcriptomic analyses. LWT 2023, 187, 115345. [Google Scholar] [CrossRef]
  25. Slížová, M.; Nemcová, R.; Mad’ar, M.; Jana, H.; Soňa, G.; Miroslav, P.; Juraj, P. Analysis of biofilm formation by intestinal lactobacilli. Can. J. Microbiol. 2015, 61, 437–446. [Google Scholar] [CrossRef] [PubMed]
  26. Mei, J.; Chen, H.Z.; Liao, Q.; Nizami, A.; Xia, A.; Huang, Y.; Zhu, X.Q.; Zhu, X. Effects of operational parameters on biofilm formation of mixed bacteria for hydrogen fermentation. Sustainability 2020, 12, 8863. [Google Scholar] [CrossRef]
  27. Yang, C.; Huang, B.H.; Lin, J.H.; Yang, Q.J.; Guo, Y.Q.; Liu, D.W.; Sun, B.L. Isolation and screening of high biofilm producing lactic acid bacteria, and exploration of its effects on the microbial hazard in corn straw silage. J. Hazard. Mater. 2024, 480, 136009. [Google Scholar] [CrossRef]
  28. Muruzovic, M.Z.; Mladenovic, K.G.; Comic, L.R. In vitro evaluation of resistance to environmental stress by planktonic and biofilm form of lactic acid bacteria isolated from traditionally made cheese from Serbia. Food Biosci. 2018, 23, 54–59. [Google Scholar] [CrossRef]
  29. Flemming, H.C.; Wingender, J. The biofilm matrix. Nat. Rev. Microbiol. 2010, 8, 623–633. [Google Scholar] [CrossRef] [PubMed]
  30. Geesey, G.G.; Wigglesworth-Cooksey, B.; Cooksey, K.E. Influence of calcium and other cations on surface adhesion of bacteria and diatoms: A review. Biofouling 2000, 15, 195–205. [Google Scholar] [CrossRef]
  31. Heistad, A.; Scott, T.; Skaarer, A.M.; Seidu, R.; Hanssen, J.F.; Stenström, T.A. Virus removal by unsaturated wastewater filtration: Effects of biofilm accumulation and hydrophobicity. Water Sci. Technol. 2009, 60, 399–407. [Google Scholar] [CrossRef]
  32. Volle, C.B.; Ferguson, M.A.; Aidala, K.E.; Spain, E.M.; Núñez, M.E. Spring constants and adhesive properties of native bacterial biofilm cells measured by atomic force microscopy. Colloids Surf. B-Biointerfaces 2008, 67, 32–40. [Google Scholar] [CrossRef] [PubMed]
  33. Kubota, H.; Senda, S.; Nomura, N.; Tokuda, H.; Uchiyama, H. Biofilm formation by lactic acid bacteria and resistance to environmental stress. J. Biosci. Bioeng. 2008, 106, 381–386. [Google Scholar] [CrossRef]
  34. Rezaei, Z.; Khanzadi, S.; Salari, A. A survey on biofilm formation of Lactobacillus rhamnosus (PTCC 1637) and Lactobacillus plantarum (PTCC 1745) as a survival strategy of probiotics against antibiotic in vitro and yogurt. J. Food Process. Preserv. 2022, 46, e15991. [Google Scholar] [CrossRef]
  35. Wang, M.M.; Liu, Q.H.; Kang, X.X.; Zhu, Z.B.; Yang, H.; Xi, X.Y.; Zhang, X.; Du, Y.; Guo, M.Z.; Tang, D.Q.; et al. Glycogen metabolism impairment via single gene mutation in the glgBXCAP operon alters the survival rate of Escherichia coli under various environmental stresses. Front. Microbiol. 2020, 11, 588099. [Google Scholar] [CrossRef] [PubMed]
  36. Van Acker, H.; Van Dijck, P.; Coenye, T. Molecular mechanisms of antimicrobial tolerance and resistance in bacterial and fungal biofilms. Trends Microbiol. 2014, 22, 326–333. [Google Scholar] [CrossRef]
  37. Booth, S.C.; Workentine, M.L.; Wen, J.; Shaykhutdinov, R.; Vogel, H.J.; Ceri, H.; Turner, R.J.; Weljie, A.M. Differences in metabolism between the biofilm and planktonic response to metal stress. J. Proteome Res. 2011, 10, 3190–3199. [Google Scholar] [CrossRef]
  38. Liu, Y.; Shen, K.; Liu, Q.; Diao, X.; Ma, W.; Liu, G. Transcriptomics analysis of the mechanism behind Lactobacillus rhamnosus Gr18 biofilm formation in an Mn2+-deficient environment. LWT 2024, 200, 116163. [Google Scholar] [CrossRef]
  39. Xu, H.; Wu, L.; Pan, D.; Zeng, X.; Cai, Z.; Guo, Y.; Wang, W.; Wu, Z. Adhesion characteristics and dual transcriptomic and proteomic analysis of Lactobacillus reuteri SH23 upon gastrointestinal fluid stress. J. Proteome Res. 2021, 20, 2447–2457. [Google Scholar] [CrossRef]
  40. Mikkelsen, H.; Sivaneson, M.; Filloux, A. Key two-component regulatory systems that control biofilm formation in Pseudomonas aeruginosa. Environ. Microbiol. 2011, 13, 1666–1681. [Google Scholar] [CrossRef]
  41. Pöntinen, A.; Lindström, M.; Skurnik, M.; Korkeala, H. Screening of the two-component-system histidine kinases of Listeria monocytogenes EGD-e. LiaS is needed for growth under heat, acid, alkali, osmotic, ethanol and oxidative stresses. Food Microbiol. 2017, 65, 36–43. [Google Scholar] [CrossRef]
  42. Zhang, F.X.; Gao, J.Y.; Wang, B.N.; Huo, D.X.; Wang, Z.X.; Zhang, J.C.; Shao, Y.Y. Whole-genome sequencing reveals the mechanisms for evolution of streptomycin resistance in Lactobacillus plantarum. J. Dairy Sci. 2018, 101, 2867–2874. [Google Scholar] [CrossRef] [PubMed]
  43. Heptinstall, S.; Archibald, A.R.; Baddiley, J. Teichoic acids and membrane function in bacteria. Nature 1970, 225, 519. [Google Scholar] [CrossRef] [PubMed]
  44. Yao, S.J.; Zhou, R.Q.; Jin, Y.; Huang, J.; Qin, J.F.; Wu, C.D. Formation of biofilm changed the responses of Tetragenococcus halophilus to ethanol stress revealed by transcriptomic and proteomic analyses. Food Res. Int. 2022, 161, 111817. [Google Scholar] [CrossRef] [PubMed]
  45. Ao, X.L.; Zhao, J.W.; Yan, J.L.; Liu, S.L.; Zhao, K. Comparative transcriptomic analysis of Lactiplantibacillus plantarum RS66CD biofilm in high-salt conditions and planktonic cells. Peerj 2020, 8, e9639. [Google Scholar] [CrossRef]
Figure 1. Biofilm formation by L. plantarum. (A) Growth curves of L. plantarum. (B) Time course of biofilm formation quantified by crystal violet assay. Insets show images of stained biofilm in gray. Biofilm was incubated for 18 h in MRS with (C) different sugars, (D) glucose concentrations, (E) pHs, (F) temperatures, and (G) magnesium ion concentrations. (H) Biofilm incubated in a 24-well plate containing a piece of polystyrene, glass, or 304 stainless steel (12 mm in diameter) for 18 h. Columns labeled with different lowercase letters are significantly different at p < 0.05.
Fermentation 11 00400 g001
Figure 2. Scanning electron microscopy (SEM) images of L. plantarum biofilms. (A,a) SEM images of planktonic cells taken at ×10,000 and ×25,000 magnification, respectively. (B,b) SEM images of biofilms taken at ×10,000 and ×25,000 magnification, respectively. Red circles display surface attachments.
Fermentation 11 00400 g002
Figure 3. Confocal laser scanning microscopy (CLSM) images of L. plantarum biofilms. (A,B) CLSM images of biofilm stained by PI (dead cells, red) and SYTO 9 (live cells, green). (a,b) The distribution of live cells and dead cells at different heights. Cells were cultured by using glucose (A,a) and sucrose (B,b) as carbon sources and incubated at 37 °C and 25 °C, respectively.
Fermentation 11 00400 g003
Figure 4. Viability of planktonic and biofilm cells after various environmental stresses. (A) The survival rate of L. plantarum cells after heat stress (45 °C) for 1, 2, 3, and 4 h. (B) The survival rate of L. plantarum cells after acid stress (pH 2.3) for 1, 2, 3, and 4 h. (C) The survival rate of L. plantarum cells after oxidative stress (0.04% H2O2) for 1, 2, 3, and 4 h. The blank column and shadow column represent planktonic and biofilm cells, respectively. Columns labeled with different lowercase letters are significantly different at p < 0.05.
Fermentation 11 00400 g004
Figure 5. The expression of genes and GO enrichment analysis of DEGs and DEPs in biofilm cells (BC) compared with planktonic cells (PC) according to transcriptomic and proteomic analyses. (A) Volcano plots of the gene expression profile. (B) Enriched GO terms of DEGs. (C) Volcano plots of the protein expression profile. (D) Enriched GO terms of DEPs.
Fermentation 11 00400 g005
Figure 6. Enriched KEGG pathways of up-/down-regulated DEGs and DEPs in biofilm cells (BC) and planktonic cells (PC) according to transcriptomic and proteomic analyses. (A) KEGG pathways enriched in up-regulated DEGs. (B) KEGG pathways enriched in down-regulated DEGs. (C) KEGG pathways enriched in up-regulated DEPs. (D) KEGG pathways enriched in down-regulated DEPs.
Fermentation 11 00400 g006
Figure 7. Heatmap representing expression levels of DEGs (A) and DEPs (B) in biofilm cells (BC) compared with planktonic cells (PC) based on KEGG enrichment analysis.
Fermentation 11 00400 g007
Disclaimer/Publisher’s Note: The statements, opinions and data contained in all publications are solely those of the individual author(s) and contributor(s) and not of MDPI and/or the editor(s). MDPI and/or the editor(s) disclaim responsibility for any injury to people or property resulting from any ideas, methods, instructions or products referred to in the content.

