Article

Comparison of the Effect of Different Microbial Agents on the Decomposition of Rice Straw

1
Department of Agronomy, College of Agronomy, Hunan Agricultural University, Changsha 410128, China
2
Crop Raw Material Guarantee Innovation Research Center, Hunan Agricultural University, Changsha 410128, China
*
Authors to whom correspondence should be addressed.
These authors contributed equally to this work.
Fermentation 2025, 11(6), 332; https://doi.org/10.3390/fermentation11060332
Submission received: 17 April 2025 / Revised: 21 May 2025 / Accepted: 4 June 2025 / Published: 9 June 2025
(This article belongs to the Section Industrial Fermentation)

Abstract

:
This study compared the decomposition effects of different microbial agents added to rice straw to screen for efficient and stable microbial agents and achieve effective utilization of rice straw resources. Different microbial agents can accelerate the decomposition of rice straw. The E4/E6 value of rice straw added with the Bacillus subtilis agent was significantly lower than that of rice straw added with other microbial agents on the 30th day. The lignin degradation rates for the Bacillus subtilis agent and Trichoderma viride agent treatments were higher than those of the other treatments from the 5th to 30th days. After adding the Bacillus subtilis agent for 30 days, the degradation rates of hemicellulose and cellulose in rice straw were higher than others, reaching 33.62% and 41.31%, respectively. Through principal component analysis and grey relational analysis, it was determined that the C/N ratio, organic carbon, E4/E6 value, conductivity value, and pH value are important evaluation indicators for the maturity promotion effect. Using the membership function analysis method, it was found that the Bacillus subtilis agent had the best overall performance in straw decomposition. This research provides a new viewpoint for the efficient utilization of straw resources.

1. Introduction

Crop straw plays a crucial role as a significant source of organic matter in soil. Its impact on soil carbon cycling and nutrient accumulation is profound. The cumulative global production of straw is estimated to reach nearly 6 billion tons annually [1]. China’s annual crop straw production is calculated to be approximately 1 billion tons [2]. The improper utilization of straw can result in the wastage of valuable resources and impose significant pressure on the ecological environment [3]. Microbial decomposition is an effective biological transformation method for straw decomposition. This method can significantly reduce the release of carbon dioxide (CO2), methane (CH4), particulate matter (PM2.5), and harmful gases by replacing incineration [4]. Meanwhile, the degraded straw is converted into humus, which can effectively improve soil health [5]. In addition, during the decomposition process, the microbial community is active, accelerating nutrient cycling [6]. Therefore, achieving the comprehensive utilization of crop straw holds immense significance.
Rice straw, as a crucial renewable resource, contains abundant mineral nutrients and organic substances essential for the growth and development of plants [7]. It is highly enriched with essential nutrient elements such as nitrogen, phosphorus, potassium, and other minerals. Returning straw to the field benefits crop growth. It can effectively reduce water evaporation, enhance the soil’s water storage capacity and structural stability, improve soil fertility, and promote a balanced nutrient cycle within the soil–crop system [8].
Rice straw primarily consists of lignocellulose, with minor amounts of sugar, protein, pectin, tannins, wax, and other compounds. Cellulose, hemicellulose, and lignin intertwine, bound by non-covalent and covalent forces, to form lignocellulose, which makes up over 90% of straw’s dry weight [9,10]. Cellulose is straw’s main component, intertwined with hemicellulose and lignin. It gives straw a dense, organized structure that resists decomposition [11]. Hemicellulose makes up about 25–30% of straw and is a complex compound made of several components. Along with proteins such as cellulose, it adds hardness and elasticity to the plant cell wall, making it tough to break down [12]. Lignin is a tough compound made from three alcohol monomers and is often called ‘natural plastic’. It does not dissolve in water, most solvents, or strong acids, but can break down in strong alkalis [13]. At present, high-value fine chemicals have been produced by disassembling the complex structure of lignocellulose through physical, chemical, and biocatalytic processes [14,15,16]. After a further analysis of the straw’s structure, it was discovered that the natural barrier created by hemicellulose and lignin poses a challenge to degradation, mainly due to the limited accessibility of cellulase to cellulose molecules. This difficulty in breaking down the straw’s composition accounts for its resistance to degradation [17,18,19]. Chemical and physical methods can quickly destroy the structure of straw and improve the accessibility of cellulose. This is applicable to industrial production. Microbial degradation has greater potential in terms of environmental friendliness, resource diversity, and ecological synergy. Especially suitable for agricultural circular utilization [20,21]. Therefore, it is crucial to encourage the adoption of efficient microbial agents that promote straw decomposition.
In natural environments, there is a diverse range of microorganisms capable of cellulose degradation. These microorganisms are typically isolated using methods such as enrichment, screening, and purification, resulting in the development of efficient cellulose-degrading strains with a high level of enzyme activity. Two bacterial strains that exhibit cellulose-degrading abilities, namely CMC-red and CMC-I, were discovered in rotting straw and nearby soil. Following a 16S rDNA sequence analysis, these two strains were identified as Massilia arvi and Flavobacterium banpakuense, respectively. Within a span of 10 days, these strains achieved a remarkable 24.14% degradation rate for straw [22]. Additionally, a thermophilic Bacillus species known for cellulose degradation was screened and isolated from the humus soil of Wuhu, China. After 40 days of soil culture, this bacterium achieved a relative degradation rate of 25.38% for rice straw [23]. Furthermore, an Azospirillum zeae maize strain with the dual capabilities of straw degradation and the promotion of plant growth was discovered in sand ginger black soil. Under liquid fermentation, it significantly increased the straw decomposition rate by 54.71% [24].
Different microorganisms exhibit both synergistic and antagonistic relationships, leading to variations in their ability to degrade straw. Previous studies have identified Bacillus thuringiensis, Bacillus subtilis, and Bacillus licheniformis as dominant strains in straw decomposition [25,26,27]. Additionally, Trichoderma viridis and Aspergillus oryzae have demonstrated their ability to decompose straw [28,29]. However, there has been limited research on the decomposition efficacy of these five types of microorganisms on rice straw. Therefore, this experiment aimed to compare the effects on straw decomposition when using these five microorganism types, investigate the influence of diverse straw-decay-promoting bacteria on straw breakdown, and establish a scientific foundation for the development of efficient rice straw decomposition microorganisms.

2. Materials and Methods

2.1. Experimental Material

The test material used in this study was straw from the Taiyou 553 rice variety, which was extensively cultivated in the double-crop rice region of the Yangtze River Basin, China. The straw harvesting location is Longping Rice Planting Park, Lukou Town, Changsha County, Changsha City, Hunan Province, China (113°23′ E, 28°42′ N). It was processed using a cutting machine, resulting in 1–2 cm pieces. Subsequently, the cut straw was dried to a constant weight at 70 °C, crushed, and passed through a 0.85 mm sieve. It was then put into a high-temperature sterilization pot and sterilized at 121 °C for later use. The microbial agents used in this study included Bacillus thuringiensis, Bacillus subtilis, Bacillus licheniformis, Trichoderma viride, and Aspergillus oryzae. All five types of microbial agents are commercial microbial preparations.

2.2. Experimental Design

The experimental treatments were as follows: (1) the addition of a Bacillus thuringiensis agent (T1); (2) the addition of a Bacillus subtilis agent (T2); (3) the addition of a Bacillus licheniformis agent (T3); (4) the addition of a Trichoderma viride agent (T4); (5) the addition of an Aspergillus oryzae agent (T5); and (6) a control group with no microbial agent (CK). A total of 20 g of screened straw was weighed and placed into a conical flask. Subsequently, 0.16 g of a microbial agent and 0.2 g of urea were added separately. Sterile water was added to these conical flasks to achieve a water content of 60%. After thorough mixing, the flasks were cultured under a constant temperature (37 °C) and sterile solid-state conditions. To preserve the growth environment of microorganisms, non-destructive sampling methods were employed in this experiment to prevent any disruption to the microbial growth. Samples were collected on the 1st, 5th, 10th, 15th, 25th, and 30th days, and an analysis of their physical and chemical parameters was performed. Additionally, samples were taken on the 1st and 30th days to assess the nutrient content. All the measurements were repeated three times. After collection, the samples designated for testing were immediately frozen in liquid nitrogen and stored at −80 °C in a refrigerator.

2.3. Determination Items and Methods

2.3.1. Apparent Color Record

The color of the rice straw was observed on the 1st, 5th, 10th, 15th, 25th, and 30th days, and the color change during the decomposition process was recorded.

2.3.2. Determination of the pH Value, Electrical Conductivity Value (EC Value), and Humus Polymerization Degree (E4/E6 Value)

The sample to be tested was added to a sterilized triangular flask along with distilled water in a ratio of 1:10 (w (g):V (mL)). The mixture was then horizontally oscillated at 180 r/min for 30 min at room temperature. After filtering the mixture using filter paper, the pH value was measured using a pH meter (S210-S, Mettler-Toledo International Inc., Zurich, Switzerland), and the electrical conductivity (EC value) was measured using a conductivity meter (DDS-307A, INESA Scientific Instrument Co., Ltd., Shanghai, China). Another set of samples was horizontally oscillated at 200 r/min for 60 min. The humus polymerization degree (E4/E6 value) was measured after filtering through filter paper. The E4/E6 value represents the ratio of the wavelengths of 465 nm to 665 nm and was measured using an ultraviolet–visible spectrophotometer (UV-2600, Shimadzu Corporation, Kyoto, Japan).

2.3.3. Determination of Lignocellulose

The cellulose content was determined using a cellulose content assay kit (BC4280, Solarbio Science & Technology Co., Ltd., Beijing, China) following the manufacturer’s user manual. The hemicellulose content was determined using a hemicellulose content assay kit (BC4440, Solarbio Science & Technology Co., Ltd., Beijing, China). The lignin content was determined using a lignin content assay kit (BC4200, Solarbio Science & Technology Co., Ltd., Beijing, China). The calculation formula for the lignocellulose degradation rate was as follows:
Lignin degradation rate (%) = (Xa − Xb)/(Xa) × 100
Hemicellulose degradation rate (%) = (Xc − Xd)/(Xc) × 100
Cellulose degradation rate (%) = (Xe − Xf)/(Xe) × 100
In the formula, Xa represents the lignin content of the test sample before decomposition, and Xb represents the lignin content of the test sample after decomposing for n days. Xc represents the hemicellulose content of the test sample before decomposition, and Xd represents the hemicellulose content of the test sample after decomposing for n days. Xe represents the cellulose content of the test sample before decomposition, and Xb represents the cellulose content of the test sample after decomposing for n days. The value of n varied for each measurement, corresponding to the 1st, 5th, 10th, 15th, 25th, and 30th days.

2.3.4. Determination of Nutrient Content

The organic carbon content was determined using the thermodilution method [30]. After digestion and filtration using H2SO4-H2O2, the total nitrogen and total phosphorus contents were determined using a continuous flow analyzer (San++, Scala analytical instruments (Shanghai) Co., Ltd., Shanghai, China) [31]. The total potassium content was determined using a flame spectrophotometer method (6400A, INESA Scientific Instrument Co., Ltd., Shanghai, China). The content of alkali-hydrolyzable nitrogen was determined using an alkali diffusion method. The content of available phosphorus was determined using the molybdenum antimony colorimetric method (UV-2600, Shimadzu Corporation, Kyoto, Japan). The available potassium content was determined using a flame spectrophotometer method (6400A, INESA Scientific Instrument Co., Ltd., Shanghai, China) [32].

2.4. Statistical Analysis

The data were sorted and calculated using the Microsoft Excel 2017 software. A statistical analysis was performed using the DPS statistics processing system, and the differences were tested using Duncan’s new complex difference method at a significance level of p ≤ 0.05. GraphPad Prism 9.0 was used for data visualization and graph plotting.
A gray correlation analysis is a statistical method that involves analyzing multiple factors. It utilizes linear interpolation to transform discrete observational system factor data into segmented continuous polylines. Based on the geometric characteristics of these polylines, a model is constructed to quantify the level of correlation. The closer the geometric shape of the polyline, the stronger the correlation between the corresponding sequences [33]. The specific calculation is outlined as follows:
ξ i j = m i n i j + ρ m a x Δ i j Δ i j + ρ m a x Δ i j
In this equation, ξ i j represents the gray correlation coefficient, m i n i j and m a x Δ i j represent the minimum and maximum values of all absolute differences, and ρ is the resolution coefficient.
r i = 1 N j = 1 N ξ i j
In the above formula, ri represents the gray correlation degree, and N represents the number of evaluation indicators.
The membership function method was employed based on fuzzy sets of attribute values. Its principle involves utilizing membership functions to describe fuzzy sets. Following the decision maker’s definition, the decision attribute values are fuzzified, and all the decision attribute values are expressed using membership function expressions. Subsequently, the membership function is utilized to determine the optimal decision [34]. The specific calculation is outlined as follows:
Xu = (X − Xmin)/(Xmax − Xmin)
Xu = 1 − (X − Xmin)/(Xmax − Xmin)
In the formula, X represents the measured value of a specific indicator in the tested sample, while Xmax and Xmin denote the maximum and minimum values of the indicator across all the samples, respectively.
If the measurement index exhibits a positive correlation, the membership value is calculated using Equation (6); for a negative correlation, Equation (7) is used. Finally, the membership function values of each indicator for each sample are accumulated and the average value is computed.

3. Results

3.1. Variation in Color

The changes in rice straw color for each treatment were subjected to a statistical analysis (Table 1). The rate of color change in the appearance of rice straw treated with the microbial agents was faster compared with that of the CK. Among the treatments, rice straw treated with the T2 or T4 treatment exhibited a dark brown appearance on the 30th day. Rice straw treated with the T1 or T3 treatment displayed a brown color on the 30th day, with a lower degree of color deepening compared with the T2 and T4 treatments. The least noticeable color change was observed for rice straw treated with the T5 treatment, which only reached a yellowish-brown hue on the 30th day. Additionally, it took 15 days to transform the color of rice straw from yellowish brown to dark brown when using the T4 treatment, whereas the T2 treatment achieved the same color change in just 10 days.

3.2. Variation in pH Value

The pH value reflects the intensity of microbial activity. The pH value variation in response to the treatments was greater than that for the CK (Table 2). Among the treatments, the overall trend in the pH value change with the addition of the T1, T3, T4, or T5 treatment showed an initial rapid decline followed by a rapid rise to a range of 7.20–7.70, and then subsequent fluctuations of decreases and rises. However, the overall pH value trend with the T2 treatment initially exhibited a decrease, followed by an increase. Specifically, the pH value showed a downward trend for the first 10 days and an upward trend for the following 20 days. This pattern differed from the other treatments. Moreover, the pH value for the T1, T3, and T4 treatments first increased on the 10th day, which was 5 days earlier compared with the T5 treatment.

3.3. Variation in EC Value

The EC value can indicate the level of soluble salt content in the decomposed environment [35]. It has been established that, when the EC value falls within the range of 0.75–4.00 ms/cm, plants can grow normally [36]. On the 30th day, the EC values of the treatments were higher than those of the CK by 1.56, 0.82, 0.72, 0.83, and 1.3 ms/cm (Table 3). Among them, the EC values for the T1 and T5 treatments were 4.65 ms/cm and 4.39 ms/cm, respectively. Neither of them satisfied the normal growth of plants.

3.4. Variation in Humus Polymerization Degree (E4/E6 Value)

Humic acid constitutes a significant component of humus. The optical density ratio (E4/E6 value) measured at 465 nm and 665 nm serves as an indicator of the condensation and aromatization of humus in raw fermentation materials. A lower E4/E6 value signifies a higher degree of humus polymerization [37]. The E4/E6 value for rice straw with the T2, T3, and T4 treatments displayed an increasing trend followed by a decrease (Table 4). However, the peak value for the T2 treatment was observed five days earlier than that for the T3 and T4 treatments, with a peak value of 2.72. Furthermore, the lowest values of the entire process for the T2, T3, and T4 treatments all occurred on the 30th day. However, the E4/E6 value of T2 was the lowest, even lower than the minimum values of all the other treatments, reaching 1.52. The E4/E6 values for the T1 and T5 treatments exhibited a continuous upward trend throughout the duration of the experiment.

3.5. Variation in Lignocellulose Degradation Rate

Lignin acts as a protective layer that surrounds cellulose and hemicellulose in straw, and it is also the most resilient component that undergoes decomposition [38]. Hemicellulose is a component of the plant cell wall that contributes to the cross-linking of cell wall components, thereby enhancing the structural integrity of plant cells [39]. The treatments with microbial agents exhibited a higher lignocellulose degradation rate compared with the CK (Figure 1). On the 30th day, compared with the degradation rate of the CK, the lignin degradation rates represent increases of 16.86%, 26.43%, 20.50%, 26.51%, and 20.06%, respectively (Figure 1A). The hemicellulose degradation rate represents an increase of 21.2%, 23.49%, 24.05%, 15.53%, and 13.19%, respectively (Figure 1B). And the cellulose degradation rate represents increases of 19.89%, 31.21%, 24.19%, 19.94%, and 16.72%, respectively (Figure 1C). It was observed that the lignin degradation rates for the T1 and T4 treatments were higher than those of the other treatments. And the hemicellulose degradation rate and cellulose degradation rate of the T2 and T3 treatments were higher than those of the other treatments, while the hemicellulose degradation rate of the T5 treatment was the lowest.

3.6. Variation in Nutrient Content

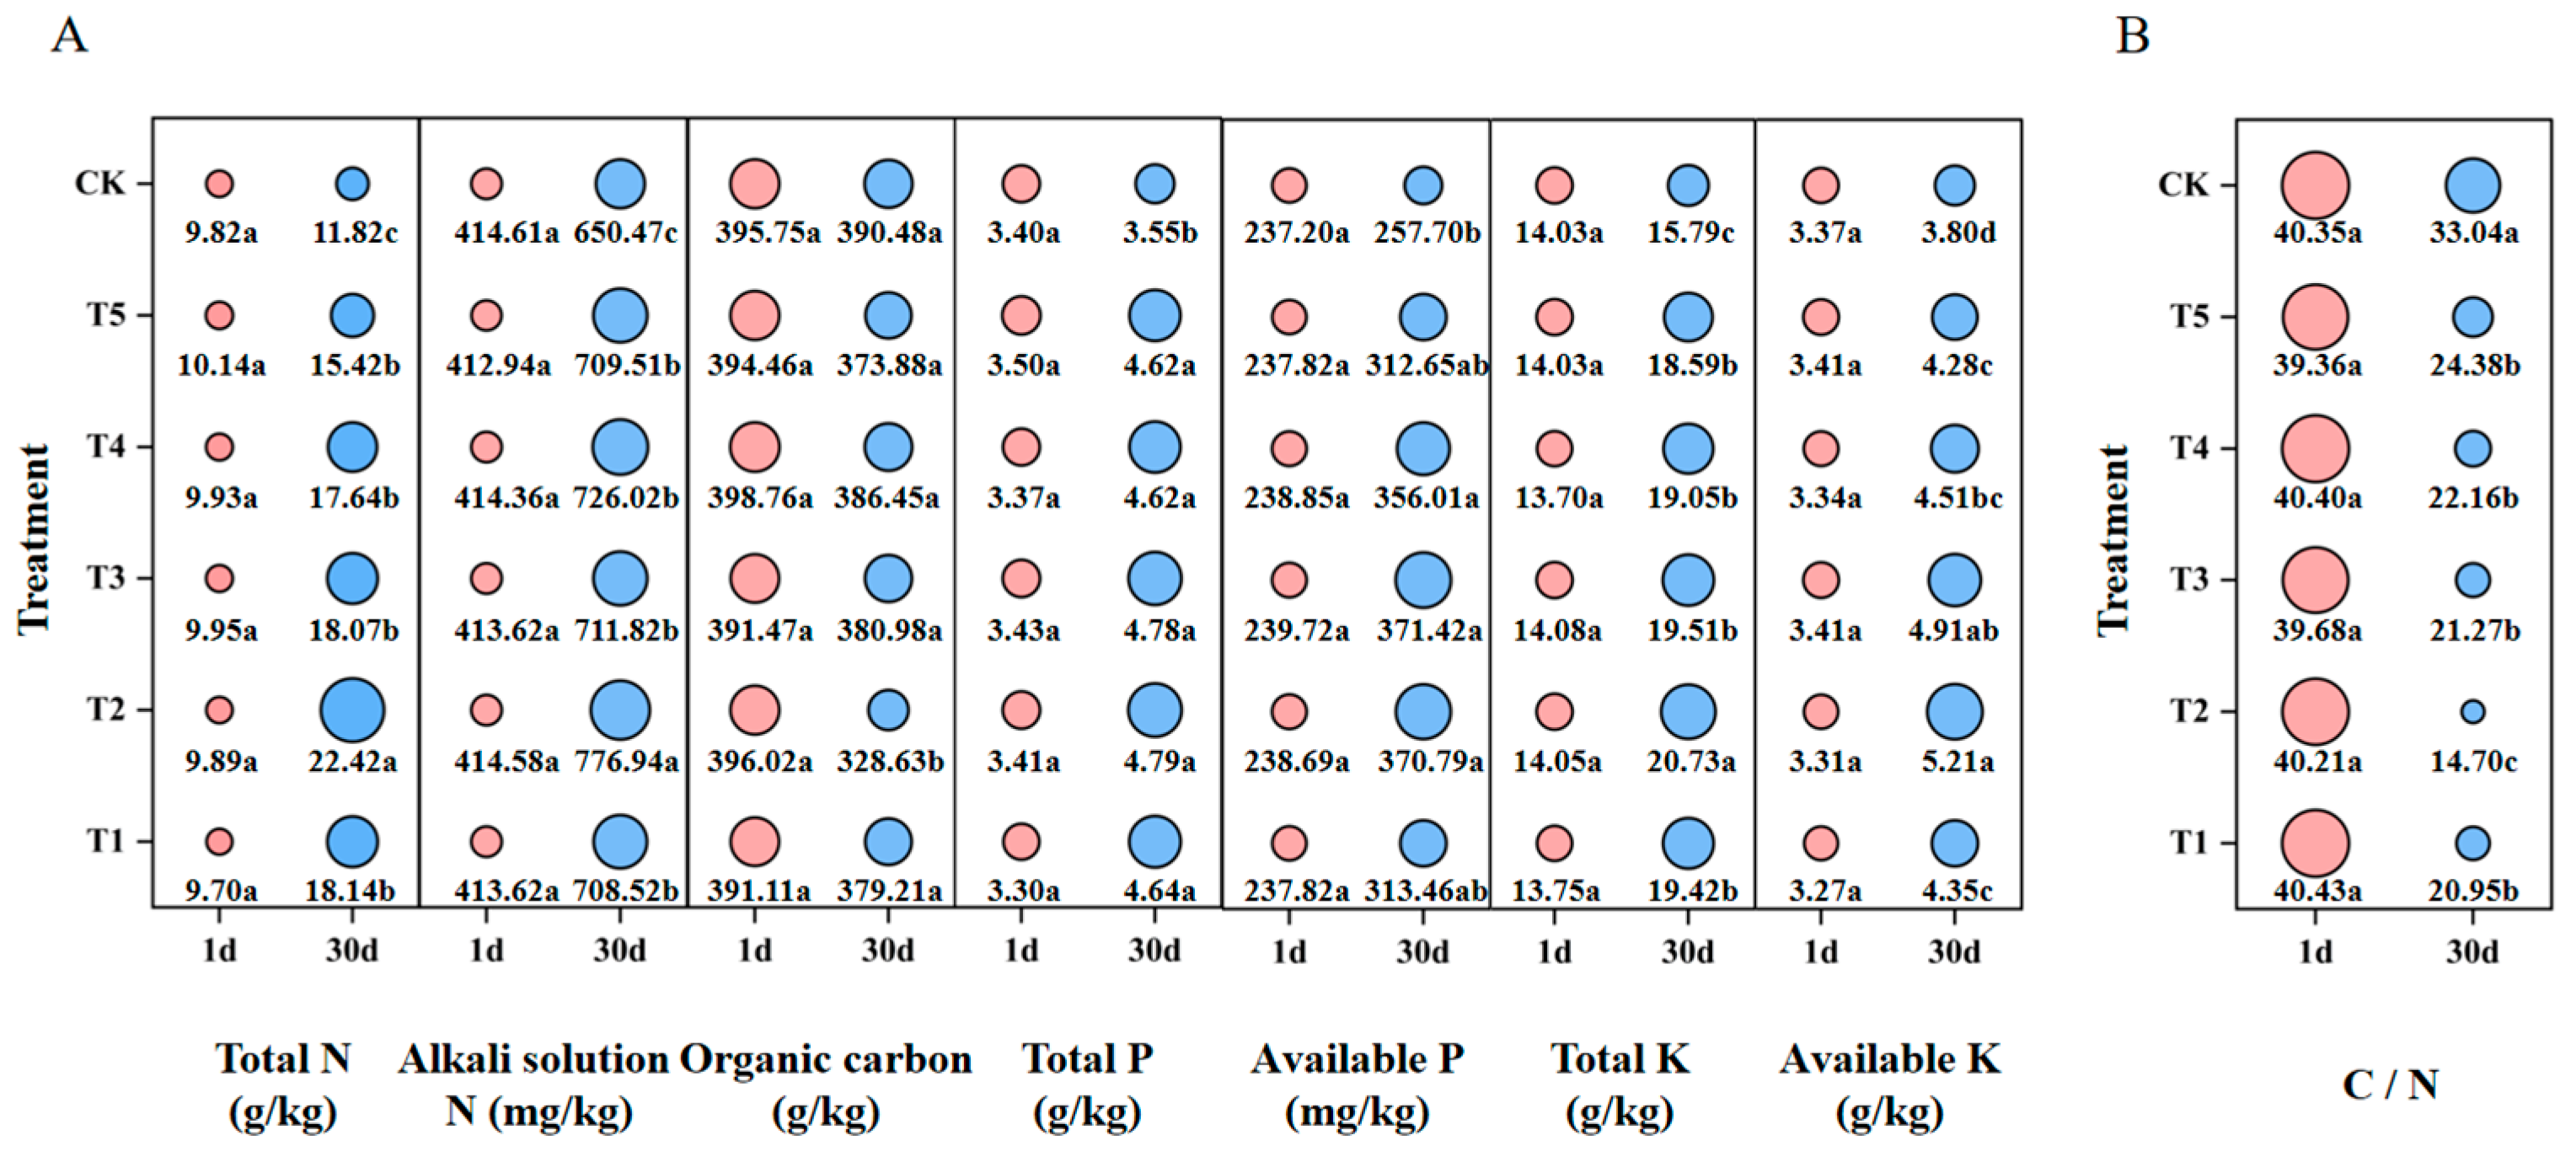
During the decomposition of straw, nitrogen-containing organic matter breaks down, releasing substances such as ammonia and causing nitrogen loss. However, the formation of humus helps to retain nitrogen. Alkali-hydrolyzable nitrogen includes inorganic and simple organic nitrogen that crops can quickly absorb, which is crucial for their growth. After 30 days of rice straw decomposition, each treatment had higher total nitrogen and alkali-hydrolyzable nitrogen contents compared with the CK (Figure 2A). Among them, the T2 treatment had the highest contents compared with the other treatments, reaching 22.42 g/kg and 776.94 mg/kg, respectively. As the decomposition process progresses, the continuous action of microorganisms converts the organic carbon content into volatile CO2, resulting in a gradual decline in organic carbon levels. The decrease in organic carbon serves as a vital indicator to assess the speed of decomposition and the maturity of straw. After a 30-day decomposition period for rice straw, each treatment with a microbial agent exhibited a lower organic carbon content compared with the CK. The T2 treatment had a significantly lower organic carbon content than the other treatments, measuring at 67.39 g/kg. As the straw decomposition process progressed, the total mass of the pile continued to decrease, leading to an increase in the concentrations of total phosphorus and potassium. Among the treatments, the T2 treatment had a significantly higher content of total phosphorus, total potassium, available phosphorus, and available potassium compared with the other treatments, which were 4.79 g/kg, 20.73 g/kg, 370.79 mg/kg, and 5.21 g/kg, respectively.
The C/N ratio is considered a crucial parameter for assessing the decomposition process and maturity level [40]. The C/N ratio of each treatment on the 30th day compared with the 1st day of rice straw decomposition decreased from 18.12% to 63.44%. Notably, the C/N ratio value of the T2 treatment on the 30th day was the lowest, showing a significant reduction of 29.84% to 57.42% compared with the other treatments (Figure 2B).

3.7. Principal Component Analysis

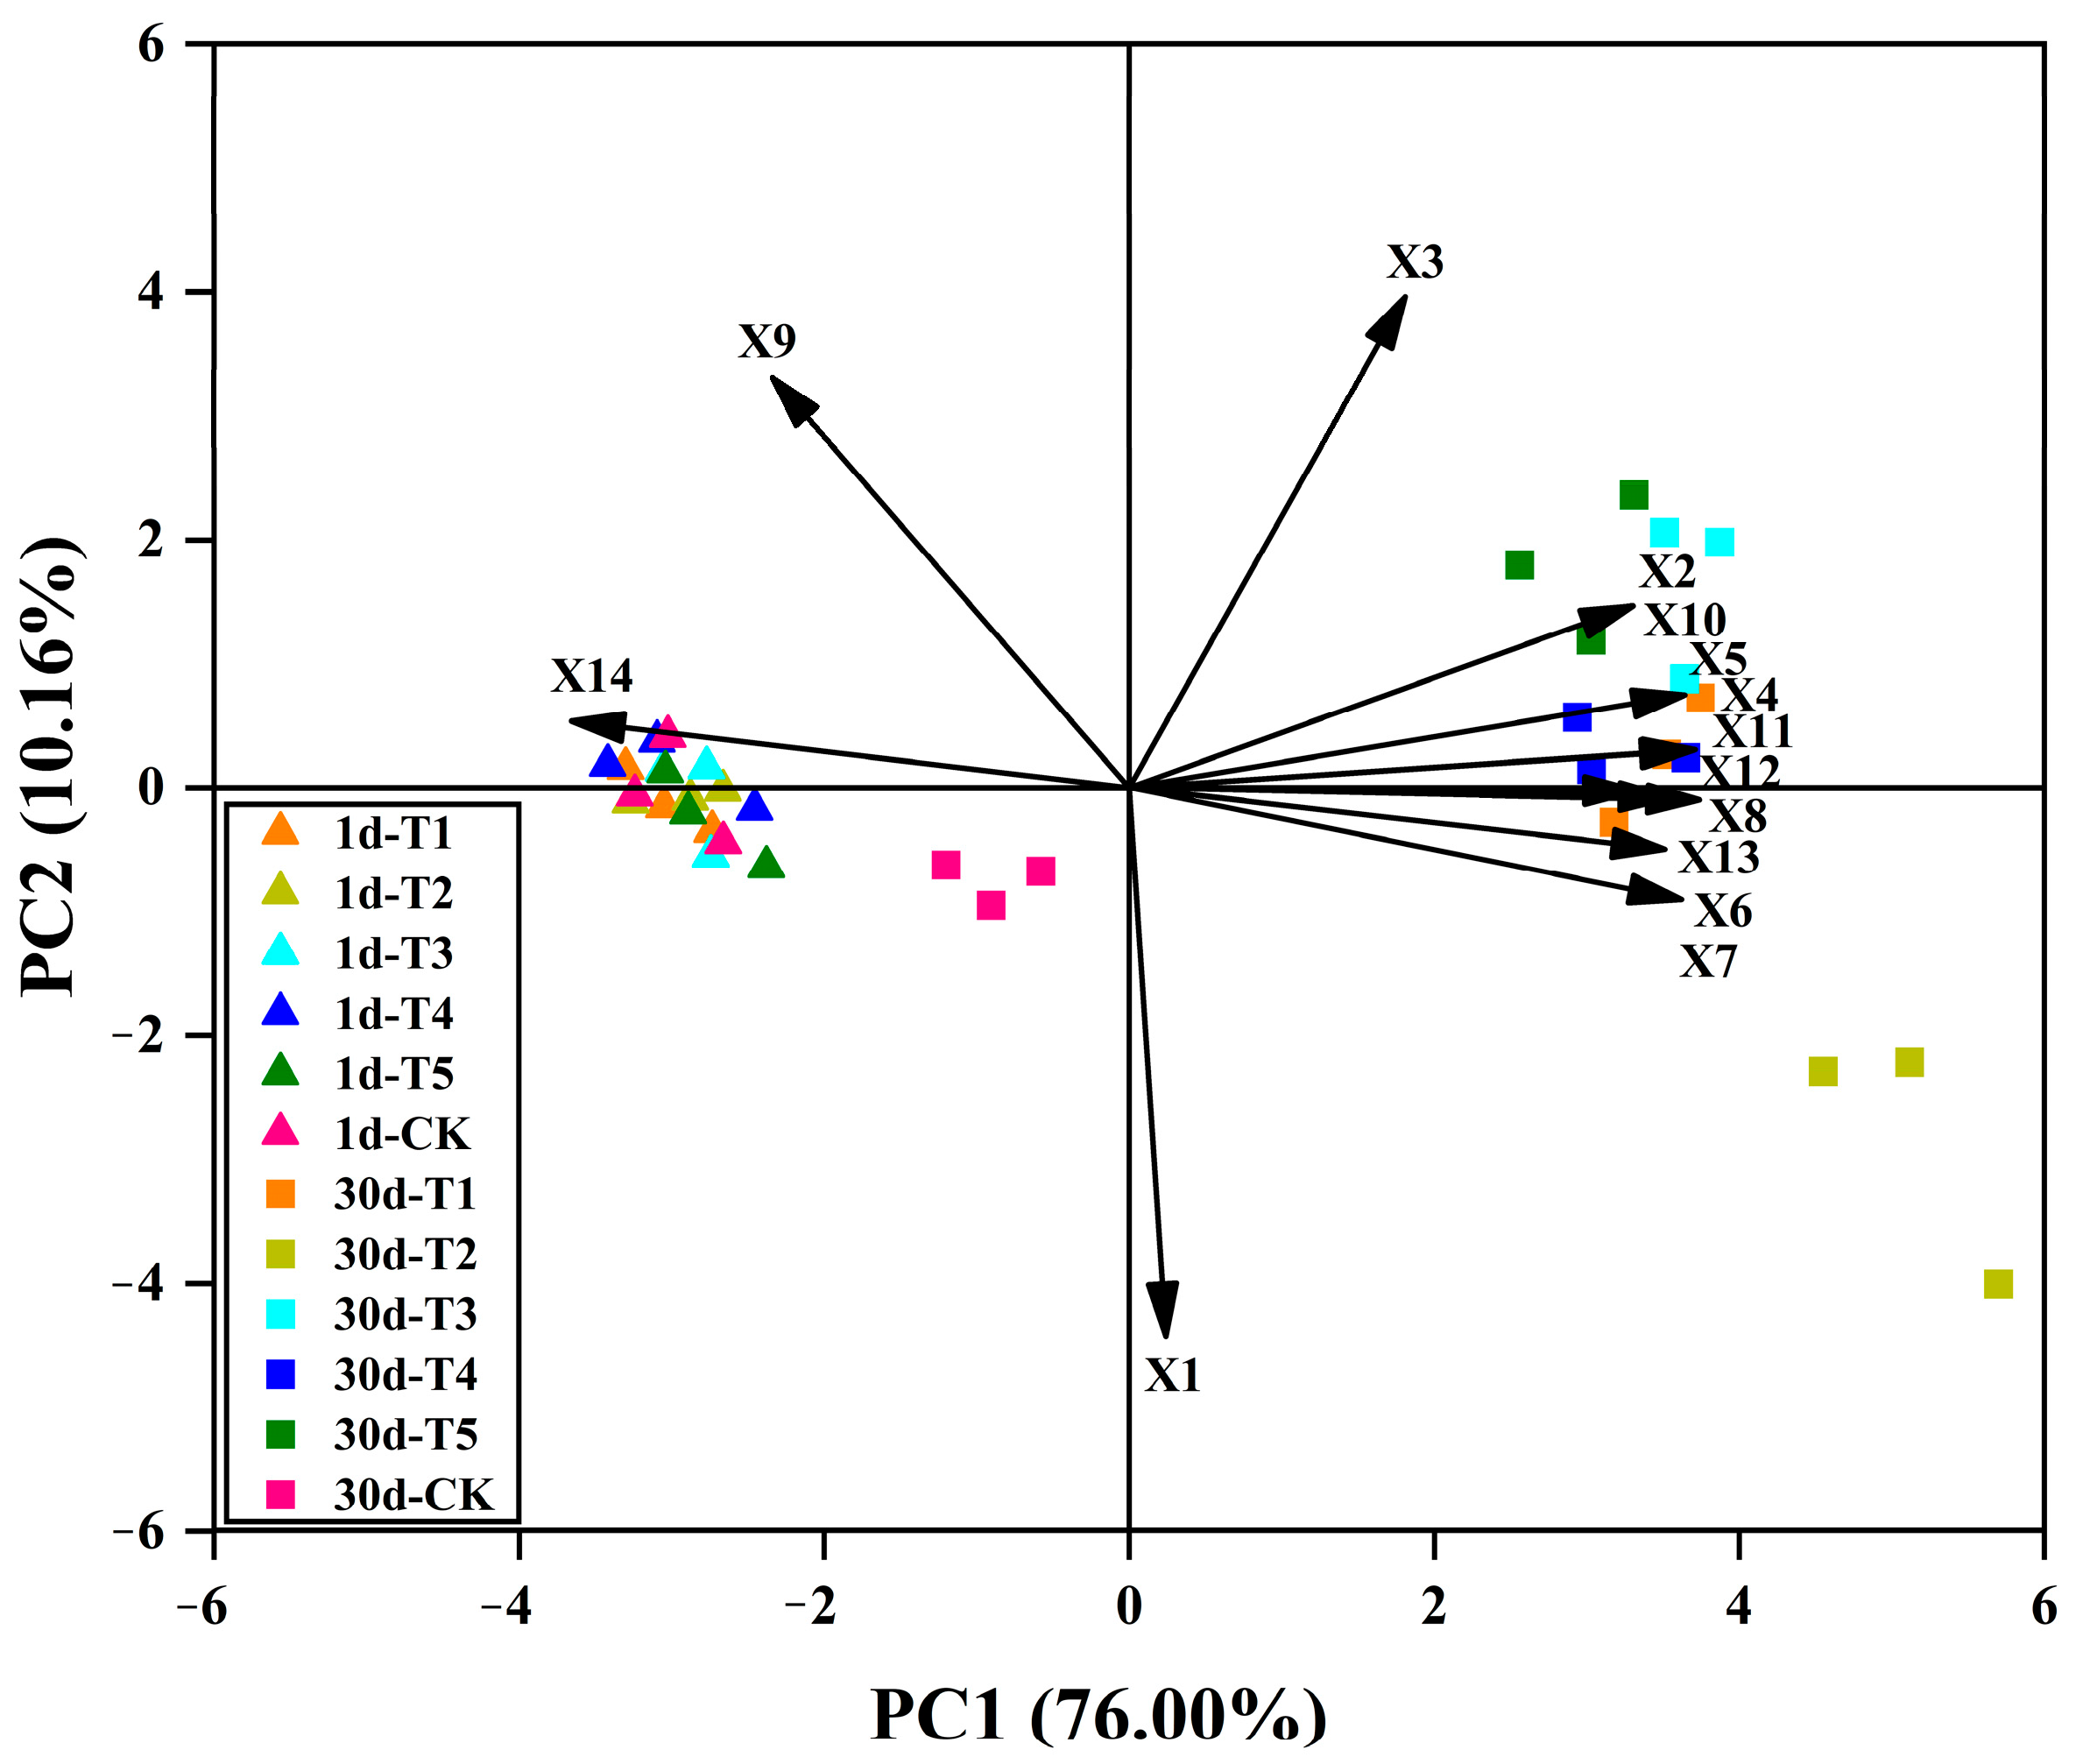
A principal component analysis (PCA) is commonly used to assess the similarity among different samples. Figure 3 illustrates the similarity in the ripening effects among the six treatments throughout the ripening process. PC1 and PC2 accounted for 76.00% and 10.16% of the total variation, respectively. After 30 days of rice straw decomposition, the distance between the 30th-day treatments increased compared with the 1st-day treatments, indicating a reduced similarity in the decomposition effect of the 30th-day treatments. When comparing the distance between the 30th day and 1st day for each treatment, the CK treatment exhibited the closest proximity, indicating the highest similarity in the ripening effect. The T2 treatment showed the greatest distance between the 30th day and the 1st day, indicating the lowest similarity in the ripening effect. Additionally, the T1, T3, T4, and T5 treatments were closely grouped together at the 30th day, indicating a high similarity in the ripening effect of these four microbial agents. Furthermore, the distributions of the C/N ratio, organic carbon, E4/E6 value, EC value, and pH value were relatively dispersed, indicating that these indicators significantly impact the overall assessment of the decomposition effect.

3.8. Correlation Analysis

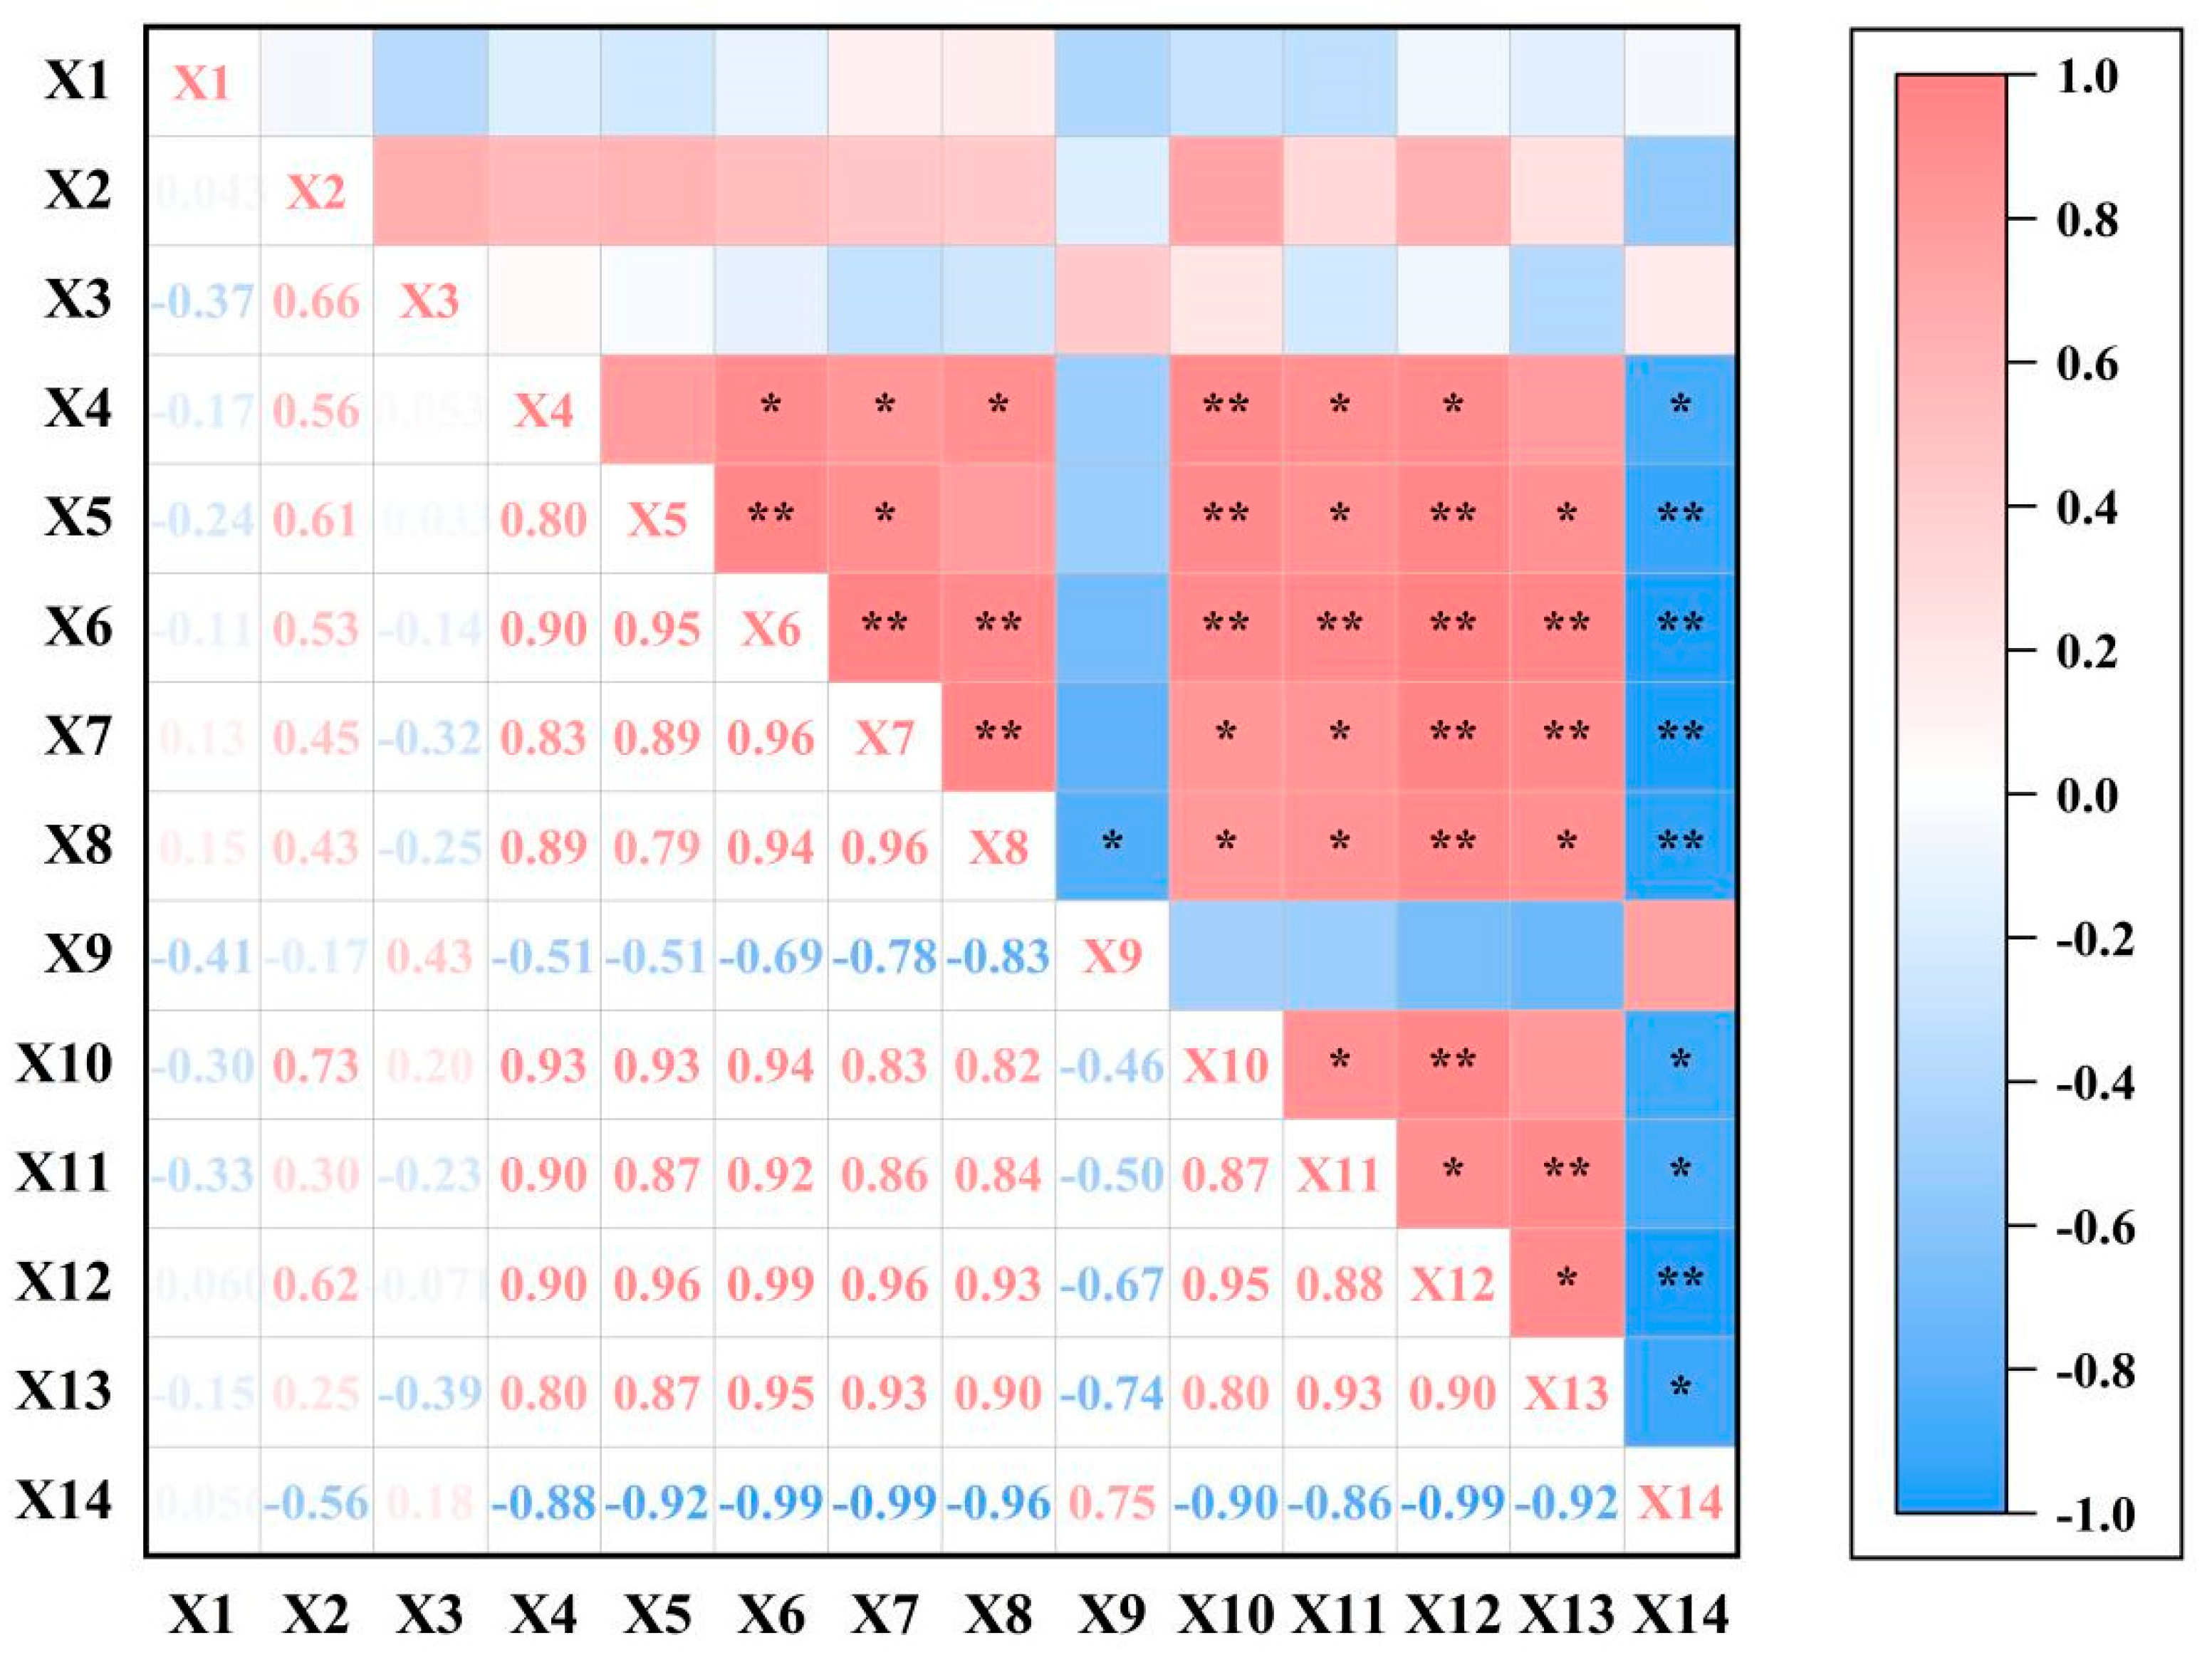
A correlation analysis was conducted for each maturity index with the maturity (Figure 4). The C/N ratio exhibited a significant negative correlation with the lignin decomposition rate, total phosphorus content, available phosphorus content, and available potassium content (p < 0.05). Moreover, it showed an extremely significant negative correlation with the hemicellulose decomposition rate, cellulose decomposition rate, total nitrogen content, alkali-hydrolyzable nitrogen content, and total potassium content (p < 0.01). There was a notable negative correlation observed between the organic carbon content and alkali-hydrolyzable nitrogen (r = −0.83 *, p < 0.05). Additionally, there were varying degrees of significant or highly significant correlations observed among the degradation rates of the three components of lignocellulose, among the nutrient contents within each component, and between the degradation rates of the three components and the nutrient contents.

3.9. Gray Analysis Between Different Processing C/N Ratios and Other Indices

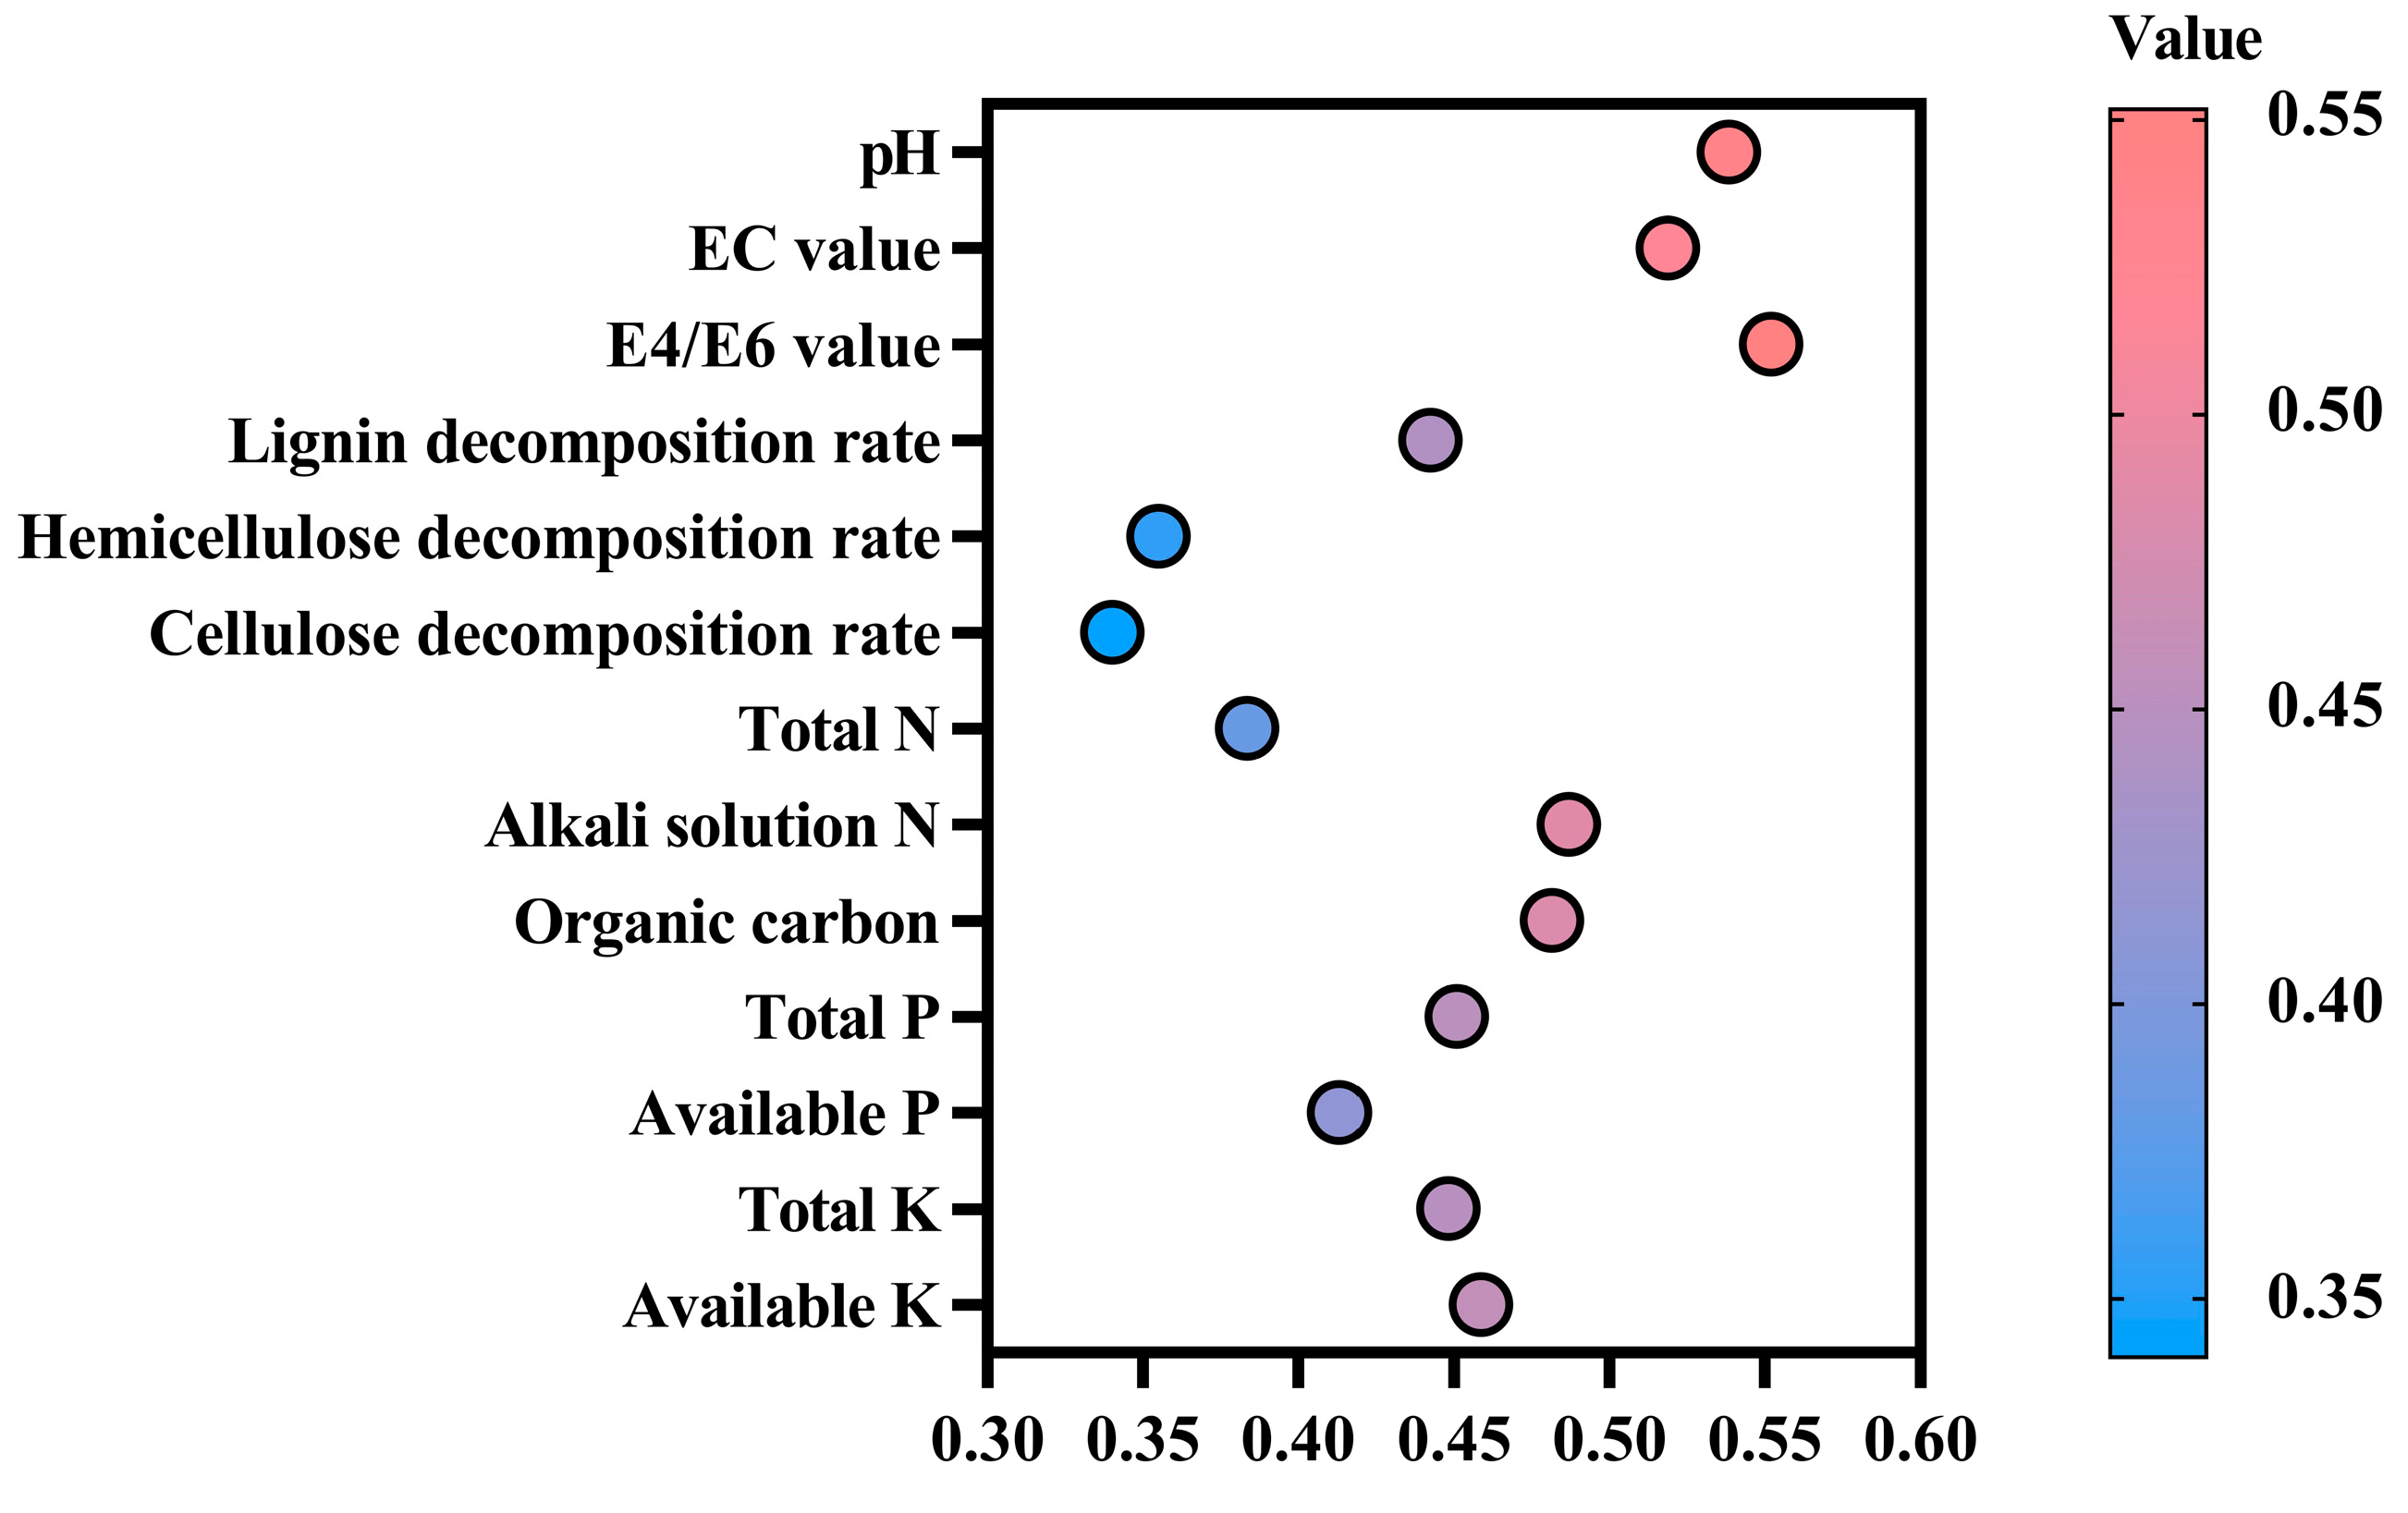
The C/N ratio plays a crucial role in the composting process and is often used as a measure of compost maturity. A low C/N ratio leads to the rapid decomposition of organic matter and potential nitrogen loss. Figure 5 presents a gray analysis of the C/N ratio and other indicators. The correlation coefficients between the E4/E6 value, pH value, and EC value, and the C/N ratio were all above 0.50, indicating a strong positive correlation. The corresponding gray scale coefficients were 0.55, 0.54, and 0.52, respectively.

3.10. Comprehensive Evaluation of Microbial Agents

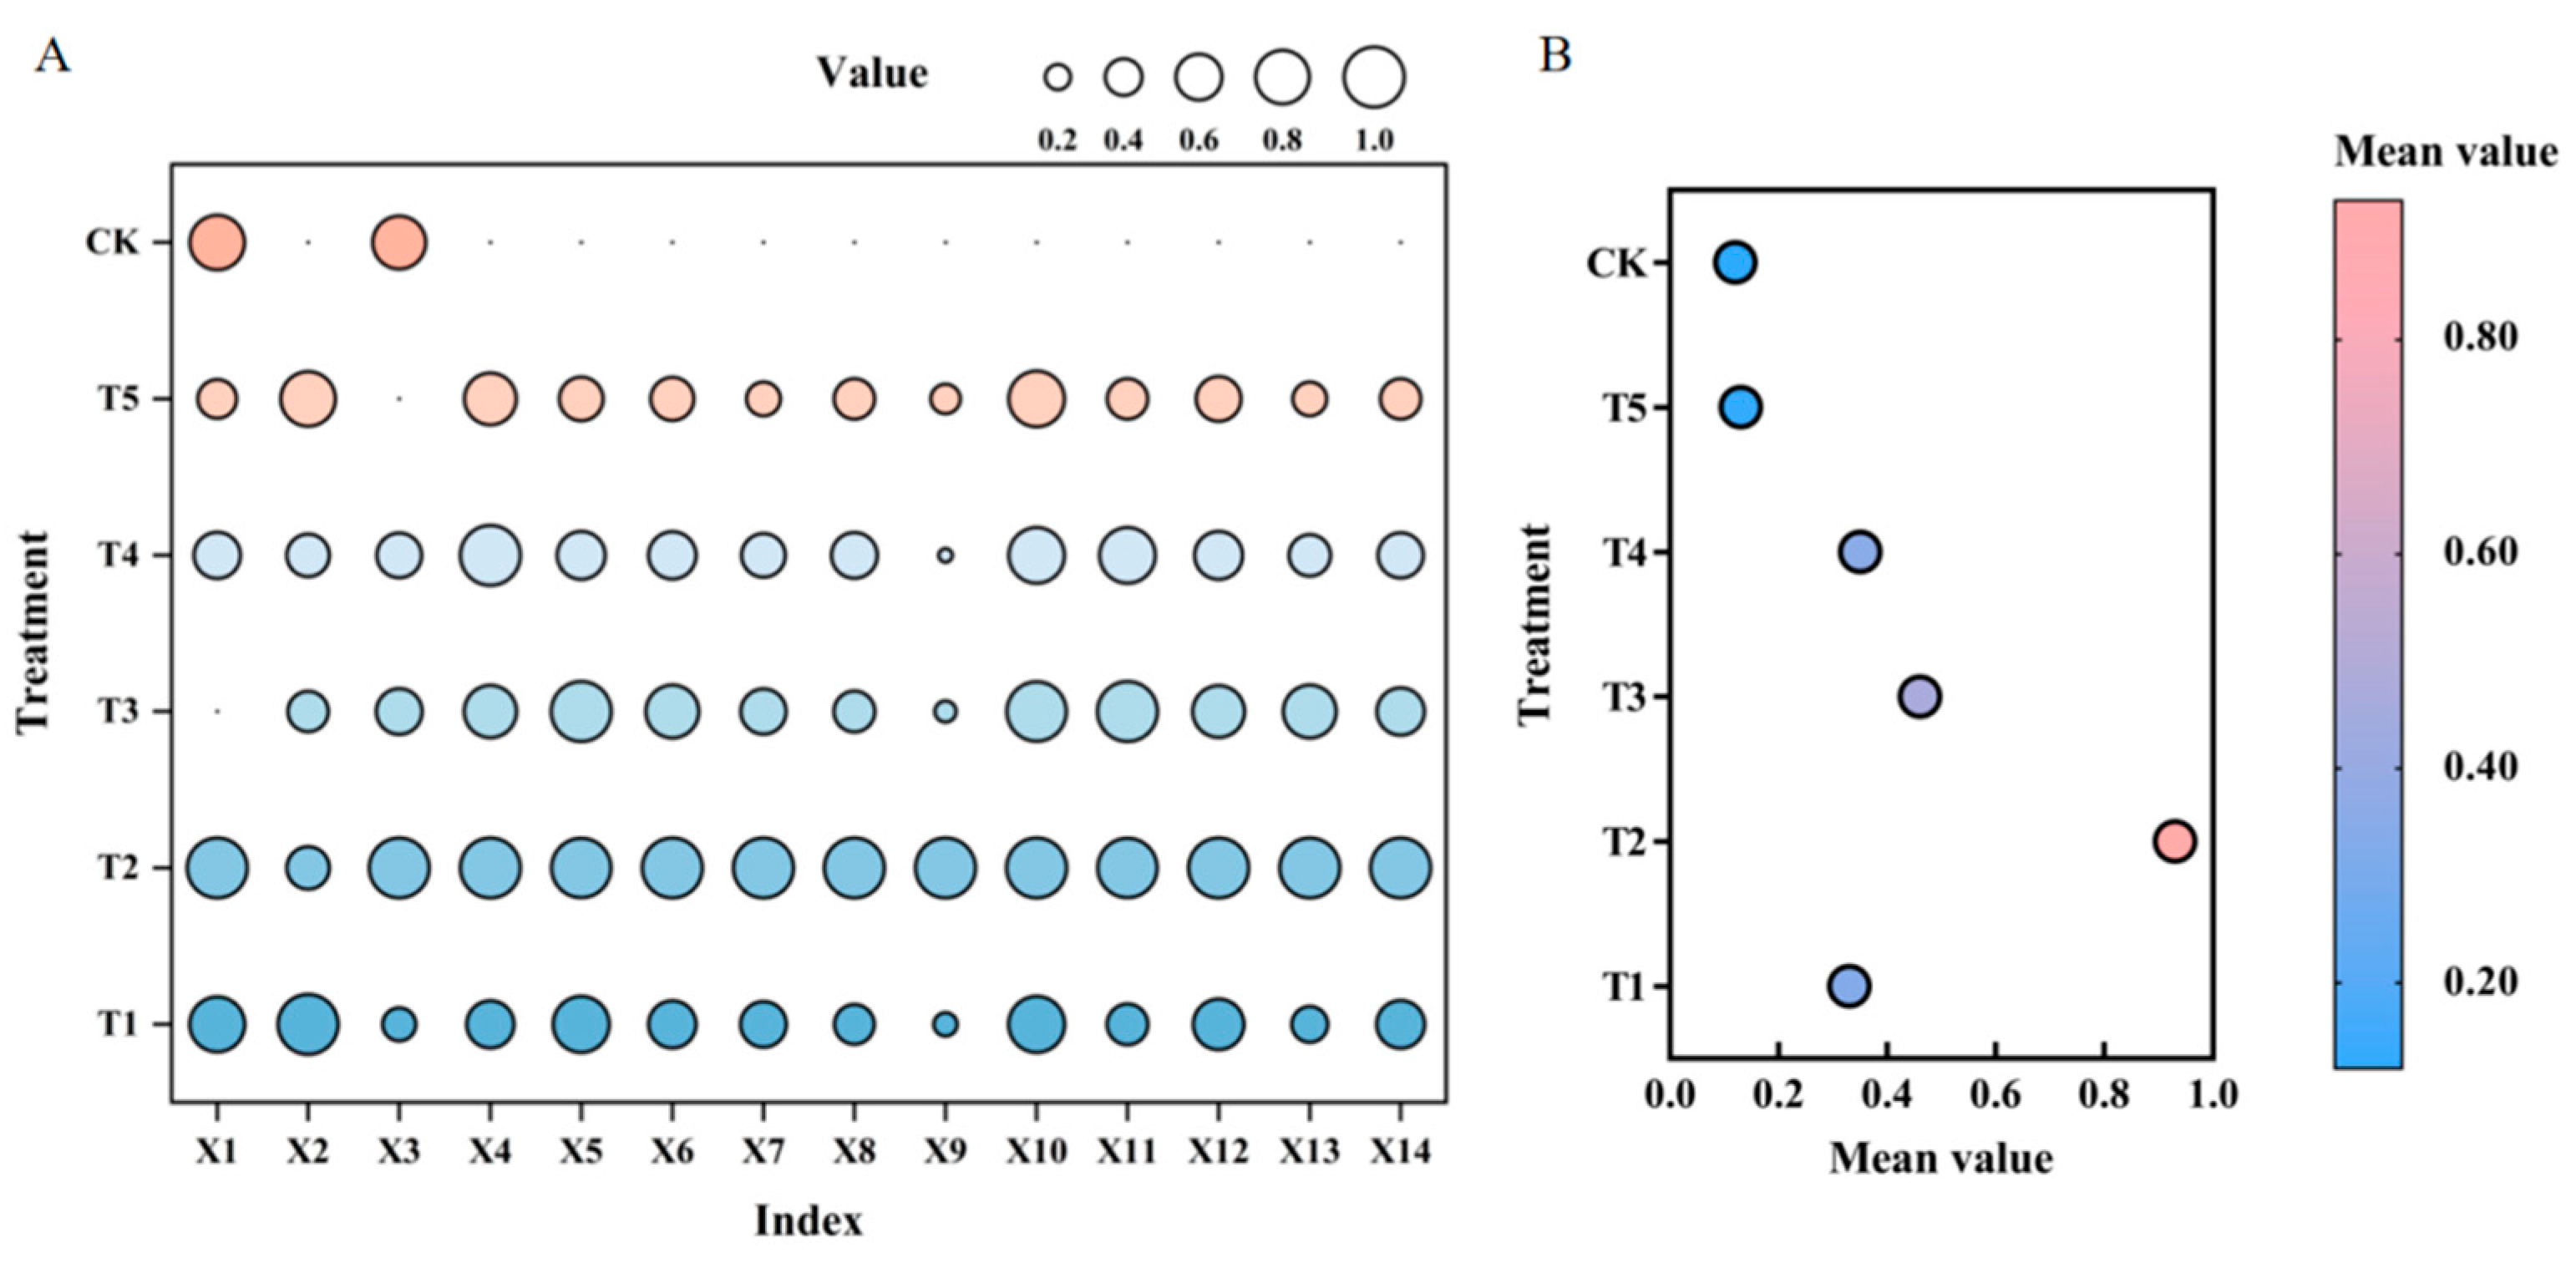
The membership function analysis method provides a comprehensive evaluation of various characteristic indices by converting them into measurement values and facilitating quantitative and comprehensive comparisons on a unified platform. This analysis revealed that the T2 treatment exhibited the highest average membership function value of 0.96 (Figure 6). This indicates that the T2 treatment offered the most effective decomposition of rice straw compared with the other treatments.

4. Discussion

A straw microbial agent is a type of microbial agent specifically designed to facilitate the rapid degradation of straw. These agents effectively convert cellulose, hemicellulose, lignin, and other substances present in straw into simple compounds that are rich in nutrients. The findings of this study demonstrate that the five different microbial agents tested were capable of promoting the decomposition of rice straw. However, it was observed that each microbial agent displayed varying degrees of effectiveness in facilitating the decomposition process of rice straw.
During the process of straw decomposition, the color of the straw intensifies over time. The study results revealed that rice straw treated with the Bacillus subtilis agent (T2) displayed a dark brown color on the 30th day, with the transition from brown to dark brown occurring within just 5 days. The pH value is a crucial indicator for assessing microbial activity. The decomposition process involves a dynamic equilibrium between mineralization and nitrification. An optimal pH value enables microorganisms to function effectively, aiding in the retention of beneficial nitrogen (N) within straw and minimizing the loss of NH4+ [41,42]. During the process of straw decomposition, maintaining a pH value of 7–8 is optimal, as this meets the requirements for safe decomposition and yields the best results [43,44]. The study results indicate that, by the 30th day of ripening, the pH value in all the treatments with microbial agents met the requirements for safe ripening. Furthermore, the inclusion of Bacillus thuringiensis (T1), Bacillus licheniformis (T3), Trichoderma viride (T4), or Aspergillus oryzae (T5) led to the decomposition of urea, which is required for microbial reproduction in the initial stage of rice straw decomposition. This led to the production of NH3 and subsequently caused an increase in the pH value. As a result, a significant amount of oxygen in the surrounding environment was consumed, leading to the creation of a localized anaerobic environment. This, in turn, resulted in the accumulation of abundant organic acids in the environment. Consequently, the pH value rapidly decreased below 7, giving rise to an acidic environment. Within this acidic environment, organic nitrogen underwent robust mineralization and decomposition reactions facilitated by microorganisms. During this period, a substantial quantity of NH3 was generated, leading to a rapid increase in the pH value to its highest level. Simultaneously, due to nitrification, a significant amount of H+ was produced, while the microorganisms continued to degrade the organic carbon and total nitrogen. Consequently, the combined effect of carbonate and organic acids contributed to a subsequent decline in the pH value. In the later stages of rice straw decomposition, as easily decomposable organic matter gradually depleted and the oxygen content in the environment continued to decline, the activity of the microorganisms decreased, along with a decline in ammonia volatilization within the pile. As a result, a carbonate buffer system was formed in the decomposition process, leading to a subsequent rise in the pH value and maintaining stability. However, in the findings of this study, the pH value of the rice straw supplemented with the Bacillus subtilis agent (T2) initially decreased and then increased. Previous research has shown that Bacillus subtilis exhibits a robust tolerance to challenging environmental conditions, including a resistance to acidity and alkalinity [45]. The inclusion of the Bacillus subtilis agent (T2) effectively sustained microbial vitality, subsequently enhancing the quality and application efficacy of the strains. It is thus speculated that the Bacillus subtilis agent (T2) exhibits rapid propagation and robust adaptability. It demonstrates significant activity under both anaerobic and aerobic conditions, allowing microorganisms to multiply rapidly within the initial 5 days. As a result, the continuous degradation of organic carbon and total nitrogen by microorganisms yields carbonate and organic acids, leading to a decrease in the pH value. Over time, with the gradual depletion of organic matter and the decline in the environmental oxygen content, the activity of Bacillus subtilis and the ability for environmental ammonia volatilization gradually weaken. This process culminates in the formation of a carbonate buffer system, leading to a subsequent rise in the pH value, which then stabilizes.
Exogenous microorganisms have the capability of decomposing organic matter in the soil into low molecular matter. Subsequently, through processes such as condensation, decomposition, and aromatization, the concentration of humus in the soil is accelerated. During the decomposition of straw, the E4/E6 value initially increased and then decreased [46]. In simpler terms, during the initial stage of decomposition, the material contained a significant amount of macromolecular organics. These macromolecular organics exhibit unstable characteristics when subjected to microbial decomposition. As the decomposition process progresses, the population of microorganisms continues to increase. Consequently, the macromolecular organics are broken down into smaller molecules. Through a series of complex reactions, such as aerobic polymerization, new humus substances are formed, leading to a reduction in the E4/E6 value. The results of this study demonstrate that the change in the E4/E6 value was significantly greater when using a bacterial agent compared with when no microbial agent was used (CK). In other words, the addition of bacterial agents facilitated the decomposition of macromolecular organics and the condensation of humus. The E4/E6 changes in the treatments supplemented with Bacillus subtilis (T2), Bacillus licheniformis (T3), or Trichoderma viride (T4) followed a similar pattern of initially increasing and then decreasing. The peak time for the treatment with the Bacillus subtilis agent (T2) occurred early, with the smallest E4/E6 value observed after 30 days. This indicates that the microbial agent has a short maturity cycle and a high efficiency. The relevant research results also indicate that adding Bacillus subtilis to compost can increase the humus content of the compost [47,48]. However, the E4/E6 value for the treatments with Bacillus thuringiensis (T1) or Aspergillus oryzae (T5) continued to increase steadily for 30 days. When the materials decompose into macromolecular organics, they exhibit unstable characteristics [49]. It is speculated that the rice straw treated with these two microbial agents did not undergo complete decomposition within 30 days.
Lignin, hemicellulose, and cellulose are the fundamental components of straw. These three components are primarily decomposed by various enzymes secreted by microorganisms during their growth and metabolism. The addition of exogenous microorganisms can effectively accelerate the decomposition of macromolecular organics, such as lignocellulose. The results of this study demonstrate that, after 30 days of decomposition, the degradation rates of lignin, hemicellulose, and cellulose were significantly higher in the treatments with microbial agents compared with the treatment without microbial agents (CK). In other words, different microbial agents play a certain role in promoting the decomposition of rice straw. Among the treatments, Bacillus subtilis (T2) and Bacillus licheniformis (T3) exhibited relatively higher degradation rates for lignin, hemicellulose, and cellulose compared with the other agents. This indicates that these agents have a higher overall efficiency for decomposing rice straw. The same result is also reflected in the composting process of corn stover. By isolating cellulose-degrading microbial strains from naturally decaying corn stover, it was found that Bacillus subtilis is also beneficial for the decomposition of corn stover to produce high-quality compost [50]. Wang et al. further proposed that co inoculation of Trichoderma viridis and Bacillus subtilis can further improve the efficiency of aerobic composting and the degradation of lignocellulose [51]. Relevant studies have shown that lignin and hemicellulose form a dense protective layer between cells and in the intercellular substances of the cell wall, resulting in a waxy layer on the surface of the straw. Only by breaking through this protective layer can a significant amount of cellulose be exposed [52,53]. As a safe and additive microorganism, Bacillus subtilis produces various enzymes such as cellulase, xylanase, and ligninase during the microbial biomass conversion process. Under the action of various enzymes, the wax layer can be destroyed and difficult to degrade lignocellulosic macromolecules can be converted into easily utilizable small molecules [54,55]. Meanwhile, studies have shown that Bacillus subtilis is heat-resistant and can secrete antibacterial substances. It has strong antibacterial ability and stability, and can inhibit the production of harmful bacteria [56]. This may be the main reason why Bacillus subtilis showed higher degradation of lignocellulose compared with other microbial agents in this study. Additionally, it was observed that the decomposition of lignin, hemicellulose, and cellulose in all the treatments commenced during the early stages of decomposition, with the degradation rates of lignin and hemicellulose being higher than that of cellulose. The reason may be that the activity of lignocellulose related enzymes is higher in the early stage of composting than in the later stage [57]. The decomposition of macromolecular organic matter is paralleled by the formation of humus. These nutrient elements play a crucial role in enhancing soil fertility and promoting plant growth [58,59]. The results of this study indicate that the inclusion of microbial agents resulted in a noticeable enhancement of nutrient content. Among them, the addition of Bacillus subtilis (T2) had the most pronounced impact on increasing the content. In other words, it exhibited the highest effectiveness in promoting decomposition.
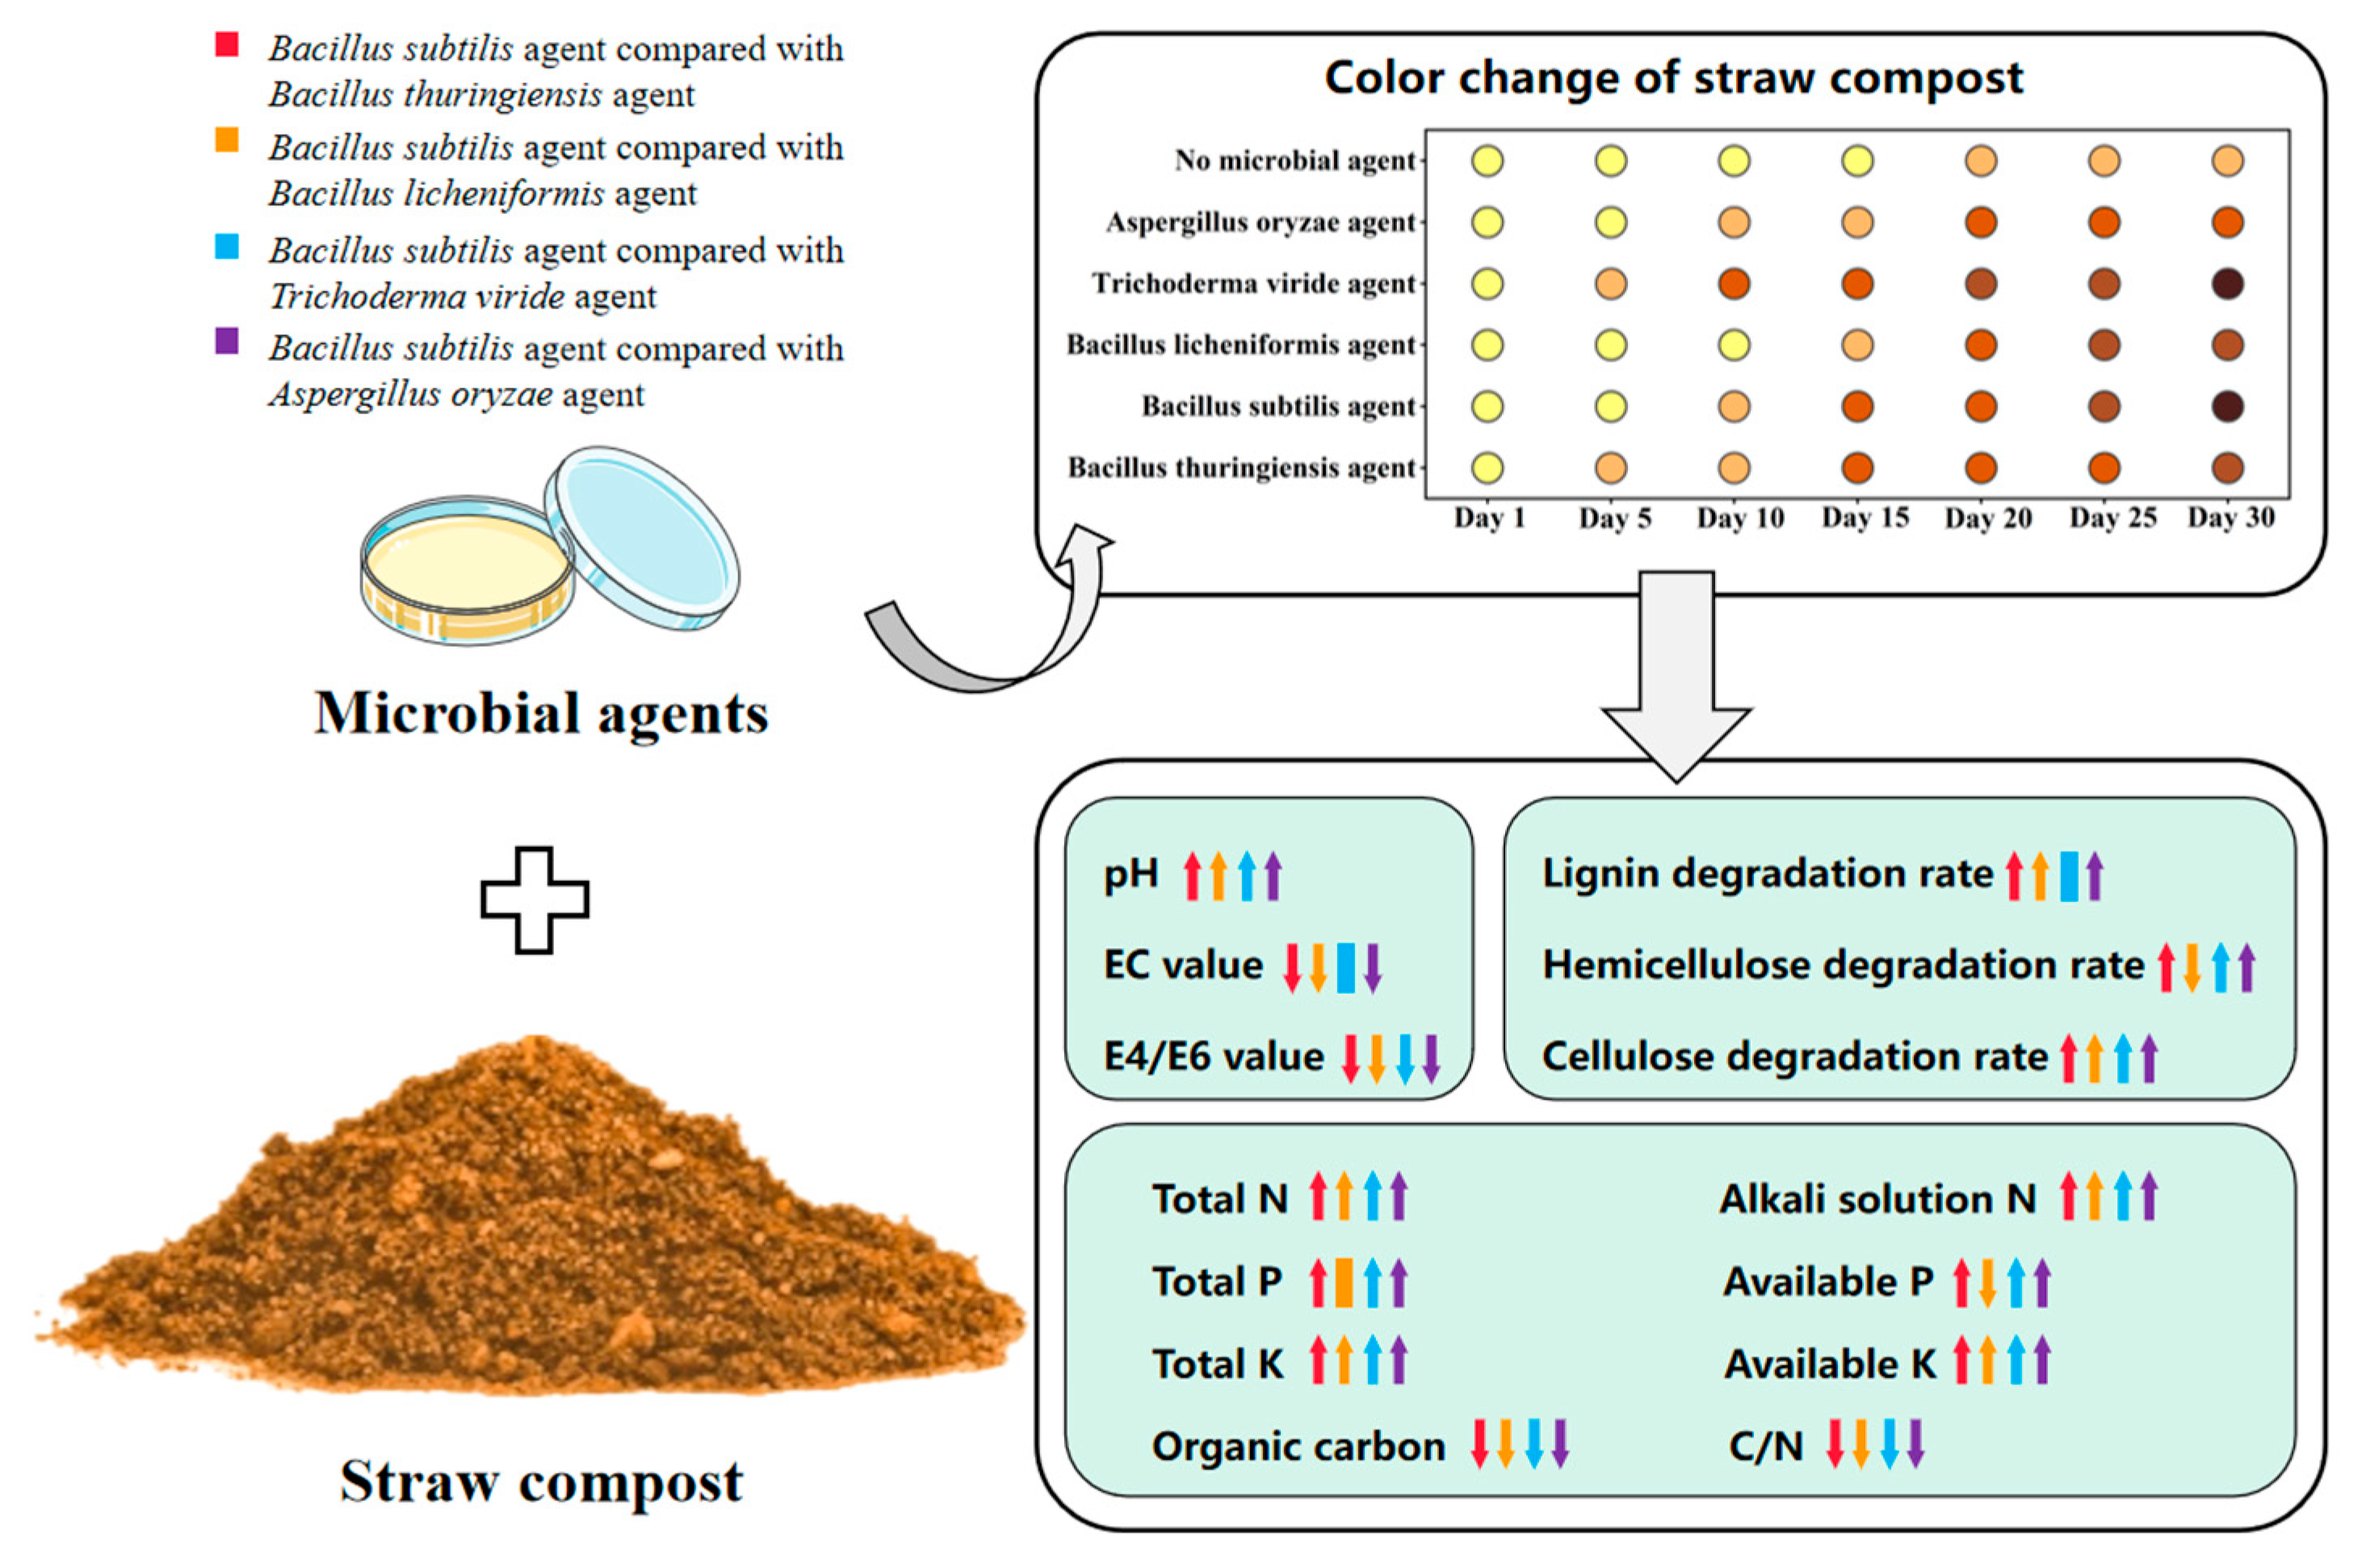
By employing a principal component analysis and a comprehensive examination, it was observed that the incorporation of microbial agents expedited the decomposition of rice straw. Additionally, the effectiveness of the five microbial agents in promoting decomposition was discernible through the first principal component. Based on the distance between points, it can be inferred that the addition of the Bacillus subtilis agent (T2) yielded the most favorable decomposition outcome for rice straw. In conjunction with a correlation analysis, the C/N ratio, organic carbon, E4/E6 value, EC value, and pH value hold specific importance in assessing the ripening effect. These indicators significantly influence the overall evaluation of ripening and serve as crucial factors in determining the ripening effect. The content of other nutrients aligned with the overall assessment of the degradation rate of lignin, hemicellulose, and cellulose in relation to the ripening effect. As maturity progresses, the values of these nutrients are expected to increase. Furthermore, a significant or extremely significant correlation exists between them. Ultimately, by employing the methods of a membership function analysis, a comprehensive evaluation of the microbial agents was conducted, with the best ripening effect observed when the Bacillus subtilis agent (T2) was added. Figure 7 shows a comparison of the morphophysiological parameters of rice straw decomposition between other microbial agents and Bacillus subtilis.

5. Conclusions

The effects of the microbial agents on the apparent color change, pH value, electrical conductivity value, humus polymerization degree, lignocellulose degradation rate, and nutrients were studied. The results show that different microbial agents can accelerate the decomposition of rice straw. The membership function analysis method was used to comprehensively evaluate the decomposition effect of rice straw. It was found that the Bacillus subtilis agent had the best overall performance in straw decomposition. At the same time, through principal component analysis and grey relational analysis, it was determined that the C/N ratio, organic carbon, E4/E6 value, conductivity value, and pH value are important evaluation indicators for the maturity promotion effect.

Author Contributions

G.C. and X.H. conceived and supervised the work; Y.L. and K.S. conducted the experiments, analyzed data, and prepared the figures; J.L. drafted the manuscript together with Y.L. and K.S. All authors have read and agreed to the published version of the manuscript.

Funding

This work was funded by the National Key R&D Program of China (2018YFD0301005); the Research and Application of Crop Collaborative Quality Improvement and Efficiency Enhancement Cultivation Technology (HN2023KJ03); and the Hunan Province Graduate Research Innovation Project (QL20230173).

Institutional Review Board Statement

Not applicable.

Informed Consent Statement

Not applicable.

Data Availability Statement

The original contributions presented in the study are included in the article; further inquiries are available from the corresponding authors on reasonable request.

Acknowledgments

The authors thank Xilin Fang, Wenlu Liu, and Fan Zhu at Hunan Agricultural University for all their help during the experiment.

Conflicts of Interest

The authors declare no conflicts of interest.

References

  1. Lal, R. World crop residues production and implications of its use as a biofuel. Environ. Int. 2005, 31, 575–584. [Google Scholar] [CrossRef] [PubMed]
  2. Jia, W.; Qin, W.; Zhang, Q.; Wang, X.; Ma, Y.; Chen, Q. Evaluation of crop residues and manure production and their geographical distribution in China. J. Clean. Prod. 2018, 188, 954–965. [Google Scholar] [CrossRef]
  3. Wang, X.; Yang, Z.; Liu, X.; Huang, G.; Xiao, W.; Han, L. The composition characteristics of different crop straw types and their multivariate analysis and comparison. Waste Manag. 2020, 110, 87–97. [Google Scholar] [CrossRef]
  4. Nur, A.R.; Noor, F.F.; Kamarul, Z.Z.; Azrin, S. Biological and chemical composition related to particulate matter in open rice straw burning event: A mini review. AIP Conf. Proc. 2023, 2785, 030011. [Google Scholar] [CrossRef]
  5. Zhang, Y.F.; Dou, S.; Ndzelu, B.S.; Ma, R.; Zhang, D.D.; Zhang, X.W.; Ye, S.F.; Wang, H.R. Effects of returning corn straw and fermented corn straw to fields on the soil organic carbon pools and humus composition. Soil 2022, 8, 605–619. [Google Scholar] [CrossRef]
  6. Zhan, Y.S.; Liu, W.J.; Bao, Y.Y.; Zhang, J.W.; Evangelos, P.; Li, Z.P.; Lin, X.G.; Feng, Y.Z. Fertilization shapes a well-organized community of bacterial decomposers for accelerated paddy straw degradation. Sci. Rep. 2018, 8, 7981. [Google Scholar] [CrossRef] [PubMed]
  7. Chen, L.M.; Sun, S.L.; Yao, B.; Peng, Y.T.; Gao, C.F.; Qin, T.; Zhou, Y.Y.; Sun, C.R.; Quan, W. Effects of straw return and straw biochar on soil properties and crop growth: A review. Front. Plant Sci. 2022, 13, 986763. [Google Scholar] [CrossRef]
  8. Wang, X.; Wang, X.; Geng, P.; Yang, Q.; Chen, K.; Liu, N.; Fan, Y.; Zhan, X.; Han, X. Effects of different returning method combined with decomposer on decomposition of organic components of straw and soil fertility. Sci. Rep. 2021, 11, 15495. [Google Scholar] [CrossRef] [PubMed]
  9. Chen, H.Z. Chemical Composition and Structure of Natural Lignocellulose. In Biotechnology of Lignocellulose; Springer: Dordrecht, The Netherlands, 2014; pp. 25–71. [Google Scholar] [CrossRef]
  10. Chang, J.; Lu, M.; Yin, Q.Q.; Zhen, Q.H.; Guo, H.W.; Fan, C.G. Progress of research on pretreatment of corn stover. Chin. Agric. Sci. Bull. 2012, 28, 1–8. [Google Scholar] [CrossRef]
  11. Zhao, X.B.; Zhang, L.H.; Liu, D.H. Biomass recalcitrance. Part I: The chemical compositions and physical structures affecting the enzymatic hydrolysis of lignocellulose. Biofuels Bioprod. Biorefining 2012, 6, 465–482. [Google Scholar] [CrossRef]
  12. Bledzki, A.K.; Mamun, A.A.; Volk, J. Barley husk and coconut shell reinforced polypropylene composites: The effect of fibre physical, chemical and surface properties. Compos. Sci. Technol. 2010, 70, 840–846. [Google Scholar] [CrossRef]
  13. Xie, C.X.; Sun, J.Z.; Li, C.L.; Zhu, D.C. Exploring the lignin degradation by bacteria. Microbiol. China 2015, 42, 1122–1132. [Google Scholar] [CrossRef]
  14. Fidio, D.N.; Carmassi, L.; Kasmiarti, G.; Fulignati, S.; Licursi, D.; Galletti, A.M.R.; Antonetti, C. Chemical and enzymatic hydrolysis of waste wheat bran to sugars and their simultaneous biocatalytic conversion to valuable carotenoids and lipids. Catal. Today 2024, 442, 114941. [Google Scholar] [CrossRef]
  15. Fidio, D.N.; Federico, T.; Marco, M.; Domenico, L.; Sara, F.; Claudia, A.; Maria, R.G.A. Sustainable Valorisation and Efficient Downstream Processing of Giant Reed by High-Pressure Carbon Dioxide Pretreatment. ChemPlusChem 2022, 87, e202200189. [Google Scholar] [CrossRef]
  16. Fidio, D.N.; Domenico, L.; Monica, P.; Sandra, V.; Maria, R.G.A. Closing a biorefinery cycle of giant reed through the production of microporous and reusable activated carbon for CO2 adsorption. J. Clean. Prod. 2023, 428, 139359. [Google Scholar] [CrossRef]
  17. Chu, X.; Awasthi, M.K.; Liu, Y.; Cheng, Q.; Qu, J.; Sun, Y. Studies on the degradation of corn straw by combined bacterial cultures. Bioresour. Technol. 2021, 320, 124174. [Google Scholar] [CrossRef]
  18. Sarnklong, C.; Cone, J.W.; Pellikaan, W.; Hendriks, W.H. Utilization of Rice Straw and Different Treatments to Improve Its Feed Value for Ruminants: A Review. Asian-Australas. J. Anim. Sci. 2010, 23, 680–692. [Google Scholar] [CrossRef]
  19. Zeng, J.; Singh, D.; Laskar, D.D.; Chen, S. Degradation of native wheat straw lignin by Streptomyces viridosporus T7A. Int. J. Environ. Sci. Technol. 2013, 10, 165–174. [Google Scholar] [CrossRef]
  20. Piao, M.; Li, A.; Du, H.; Sun, Y.; Du, H.; Teng, H. A review of additives use in straw composting. Environ. Sci. Pollut. Res. Int. 2023, 30, 57253–57270. [Google Scholar] [CrossRef]
  21. Wang, L.Y.; Wang, T.F.; Xing, Z.J.; Zhang, Q.F.; Niu, X.H.; Yu, Y.S.; Teng, Z.J.; Chen, J.X. Enhanced lignocellulose degradation and composts fertility of cattle manure and wheat straw composting by Bacillus inoculation. J. Environ. Chem. Eng. 2023, 11, 109940. [Google Scholar] [CrossRef]
  22. Sun, L.; Wu, J.G.; Li, J.M.; Fan, W.; Wang, C.Y.; Yao, Y.Y. Effects of cellulose-degrading bacteria on degradation of corn stalk. J. Jilin Agric. Univ. 2019, 41, 402–407. [Google Scholar] [CrossRef]
  23. Cheng, P.; Liu, S.S.; Wang, Y.; Lu, C.L.; Liu, A.M. Screening and identification of a cellulase- producing strain and its degradation of rice straw. J. South China Agric. Univ. 2019, 40, 84–91. [Google Scholar] [CrossRef]
  24. Wu, Q.; Nie, C.E.; Zhu, Y.Y.; Huang, W.; Ma, C.; Jiang, Y.; Zhu, L.; Fao, H.J. Isolation, identification of a cellulose degrading bacterium with IAA-producing ability and optimization of its culture conditions. Biotechnol. Bull. 2020, 36, 54–63. [Google Scholar] [CrossRef]
  25. Lin, L.; Kan, X.; Wang, D.N. Characterization of extracellular cellulose-degrading enzymes from Bacillus thuringiensis strains. Semant. Sch. 2012, 15, 2. [Google Scholar] [CrossRef]
  26. Sreena, C.P.; Sebastian, D. Augmented cellulase production by Bacillus subtilis strain MU S1 using different statistical experimental designs. J. Genet. Eng. Biotechnol. 2018, 16, 9–16. [Google Scholar] [CrossRef]
  27. Karim, A.; Nawaz, M.A.; Aman, A.; Ul Qader, S.A. Hyper production of cellulose degrading endo (1,4) β-d-glucanase from Bacillus licheniformis KIBGE-IB2. J. Radiat. Res. Appl. Sci. 2015, 8, 160–165. [Google Scholar] [CrossRef]
  28. Ghorbani, F.; Karimi, M.; Biria, D.; Kariminia, H.R.; Jeihanipour, A. Enhancement of fungal delignification of rice straw by Trichoderma viride sp. to improve its saccharification. Biochem. Eng. J. 2015, 101, 77–84. [Google Scholar] [CrossRef]
  29. Fan, Y.; Zhang, Z.; Wang, F.; Li, J.; Hu, K.; Du, Z. Lignin degradation in corn stover catalyzed by lignin peroxidase from Aspergillus oryzae broth: Effects of conditions on the kinetics. Renew. Energy 2019, 130, 32–40. [Google Scholar] [CrossRef]
  30. Lu, R.K. Methods for Agrochemical Analysis of Soil; China Agriculture Press: Beijing, China, 2000; pp. 272–282. (In Chinese) [Google Scholar]
  31. Gu, P.Y.; Luo, F.F.; Tao, W.Q.; Li, Y.; Wang, D.J.; Wu, X.; Ju, X.X.; Chao, L.; Zhang, Y.L. Higher nitrogen content and auxin export from rice tiller enhance low-ammonium-dependent tiller outgrowth. J. Plant Physiol. 2022, 268, 153562. [Google Scholar] [CrossRef]
  32. Bao, S.D. Agrochemical Analysis of Soil, 3rd ed.; China Agriculture Press: Beijing, China, 2000; pp. 30–107. (In Chinese) [Google Scholar]
  33. Wang, Z.H.; Wu, X.S.; Chang, X.P.; Li, R.Z.; Jing, R.L. Chlorophyll content and chlorophyll fluorescence kinetics parameters of flag leaf and their gray relational grade with yield in wheat. Acta Agron. Sin. 2010, 36, 217–227. (In Chinese) [Google Scholar] [CrossRef]
  34. Sun, Q.; Hu, J.J. Research Technology of Plant Physiology; Northwest University of Agriculture and Forestry Science and Technology Press: Yangling, China, 2005; p. 67. (In Chinese) [Google Scholar]
  35. St Martin, C.C.; Bekele, I.; Eudoxie, G.D.; Bristol, D.; Brathwaite, R.A.I.; Campo, K.R. Modelling response patterns of physico-chemical indicators during high-rate composting of green waste for suppression of Pythium ultimum. Environ. Technol. 2014, 35, 590–601. [Google Scholar] [CrossRef] [PubMed]
  36. Carmine, A.; Del, V.L.; Silvano, S.; Antonio, C.; Gianluca, C. Effects of cultural cycle and nutrient solution electrical conductivity on plant growth, yield and fruit quality of “Friariello” pepper grown in hydroponics. Hortic. Sci. 2017, 44, 91–98. [Google Scholar] [CrossRef]
  37. Marouani, E.; Benzina, N.K.; Ziadi, N.; Bouslimi, B.; Abouda, A.; Koubaa, A. Deinking sludge compost stability and maturity assessment using Fourier transform infrared spectroscopy and thermal analysis. Waste Manag. Res. 2019, 37, 1043–1057. [Google Scholar] [CrossRef]
  38. Chen, F.R.; Zeng, G.M.; Yu, H.Y.; Xi, X.M. Biodegradation of lignin in compost environment. J. Microbiol. 2008, 28, 88–93. [Google Scholar] [CrossRef]
  39. Salmén, L. On the organization of hemicelluloses in the wood cell wall. Cellulose 2022, 29, 1349–1355. [Google Scholar] [CrossRef]
  40. Barapatre, S.; Rastogi, M.; Khosla, B.; Nandal, M. Synergistic effect of fungal consortia and C/N ratio variation on rice straw degradation. Nat. Environ. Pollut. Technol. 2020, 19, 1831–1839. [Google Scholar] [CrossRef]
  41. Wang, X.; Selvam, A.; Chan, M.; Wong, J. Nitrogen conservation and acidity control during food wastes composting through struvite formation. Bioresour. Technol. 2013, 147, 17–22. [Google Scholar] [CrossRef]
  42. Xu, C.; Su, X.; Wang, J.; Zhang, F.; Wang, W. Characteristics and functional bacteria in a microbial consortium for rice straw lignin-degrading. Bioresour. Technol. 2021, 331, 125066. [Google Scholar] [CrossRef]
  43. Jiménez, E.I.; García, V.P. Composting of domestic refuse and sewage sludge. I. Evolution of temperature, pH, C/N ratio and cation-exchange capacity. Resour. Conserv. Recycling. 1991, 6, 45–60. [Google Scholar] [CrossRef]
  44. Nakasaki, K.; Yaguchi, H.; Sasaki, Y.; Kubota, H. Effects of pH control on composting of garbage. Waste Manag. Res. 1993, 11, 117–125. [Google Scholar] [CrossRef]
  45. Li, Y.Y.; Li, X.Q.; Qi, X.G.; Li, J.; Ren, Y.P.; Wang, X.H.; Xia, Q.Q. Optimization of Sporulation Parameters for Aerobic Composting Bacillus subtilis GX2 Strain. J. Food Sci. Biotechnol. 2021, 40, 91–99. [Google Scholar] [CrossRef]
  46. Gaind, S. Effect of fungal consortium and animal manure amendments on phosphorus fractions of paddy-straw compost. Int. Biodeterior. Biodegrad. 2014, 94, 90–97. [Google Scholar] [CrossRef]
  47. Xu, M.Y.; Yang, M.; Sun, H.S.; Meng, J.; Li, Y.S.; Gao, M.; Wang, Q.H.; Wu, C.F. Role of multistage inoculation on the co-composting of food waste and biogas residue. Bioresour. Technol. 2022, 361, 127681. [Google Scholar] [CrossRef]
  48. Wu, D.; Gao, W.F.; Zhao, Y.; Wei, Z.M.; Song, C.H.; Qu, F.T.; Wang, F. Elaborating the microbial mechanism of humic substance formation during lignocellulosic biomass composting by inoculation with different functional microbes. Ind. Crops Prod. 2024, 208, 117838. [Google Scholar] [CrossRef]
  49. Zhang, J.; Ying, Y.; Li, X.; Yao, X. Physical and chemical properties of Camellia oleifera shell composts with different additives and its maturity evaluation system. Environ. Sci. Pollut. Res. 2020, 27, 35294–35302. [Google Scholar] [CrossRef] [PubMed]
  50. Li, J.; Li, J.; Yang, R.P.; Yang, P.; Fu, H.B.; Yang, Y.C.; Liu, C.W. Construction of Microbial Consortium to Enhance Cellulose Degradation in Corn Straw during Composting. Agronomy 2024, 14, 2107. [Google Scholar] [CrossRef]
  51. Wang, S.C.; Long, H.C.; Hu, X.R.; Wang, H.; Wang, Y.C.; Guo, J.M.; Zheng, X.F.; Ye, Y.L.; Shao, R.X.; Yang, Q.H. The co-inoculation of Trichoderma viridis and Bacillus subtilis improved the aerobic composting efficiency and degradation of lignocellulose. Bioresour. Technol. 2024, 394, 130285. [Google Scholar] [CrossRef]
  52. Dash, P.K.; Padhy, S.R.; Bhattacharyya, P.; Pattanayak, A.; Pathak, H. Efficient Lignin Decomposing Microbial Consortium to Hasten Rice-Straw Composting with Moderate GHGs Fluxes. Waste Biomass Valorization 2022, 13, 481–496. [Google Scholar] [CrossRef]
  53. Zhang, C. Effects of C/N Ratio on Lignocellulose Degradation and Enzyme Activities in Aerobic Composting. Horticulturae 2021, 7, 482. [Google Scholar] [CrossRef]
  54. Qu, F.t.; Cheng, H.P.; Han, Z.Y.; Wei, Z.M.; Song, C.H. Identification of driving factors of lignocellulose degrading enzyme genes in different microbial communities during rice straw composting. Bioresour. Technol. 2023, 381, 129109. [Google Scholar] [CrossRef]
  55. Duan, M.L.; Zhang, Y.H.; Zhou, B.B.; Qin, Z.L.; Wu, J.H.; Wang, Q.J.; Yin, Y.N. Effects of Bacillus subtilis on carbon components and microbial functional metabolism during cow manure—Straw composting. Bioresour. Technol. 2020, 303, 122868. [Google Scholar] [CrossRef] [PubMed]
  56. Siu-Rodas, Y.; de los Angeles Calixto-Romo, M.; Guillén-Navarro, K.; Sánchez, J.E.; Zamora-Briseno, J.A.; Amaya-Delgado, L. Bacillus subtilis with endocellulase and exocellulase activities isolated in the thermophilic phase from composting with coffee residues. Rev. Argent. Microbiol. 2017, 50, 234–243. [Google Scholar] [CrossRef] [PubMed]
  57. Xu, P.; Shu, L.L.; Yang, Y.Y.; Kumar, S.; Tripathi, P.; Mishra, S.; Yang, Z.C. Microbial agents obtained from tomato straw composting effectively promote tomato straw compost maturation and improve compost quality. Ecotoxicol. Environ. Saf. 2024, 270, 115884. [Google Scholar] [CrossRef] [PubMed]
  58. Feng, X.; Sun, X.; Zhou, W.; Zhang, W.; Che, F.; Li, S. The effects of green waste compost on soil N, P, K, and organic matter fractions in forestry soils: Elemental analysis evaluation. RSC Adv. 2021, 11, 31983–31991. [Google Scholar] [CrossRef]
  59. Cardoso, E.; Santos, R.; Soares, S.; Ribeiro, M.; Silva, F. Substrate in the initial development of pajeu seedlings. Sci. Agrar. Parana. 2020, 19, 72–76. [Google Scholar] [CrossRef]
Figure 1. Changes in lignocellulose degradation rate during the decomposition of rice straw under different treatments. (A) Lignin degradation rate; (B) Hemicellulose degradation rate; (C) Cellulose degradation rate. Different lowercase letters indicate significant differences at 0.05 level. The following figure is the same.
Fermentation 11 00332 g001
Figure 2. Changes in nutrient content indicators during the decomposition of rice straw under different treatments: (A) Changes in nutrient content; (B) changes in C/N.
Fermentation 11 00332 g002
Figure 3. Principal component analysis of rice straw decomposition. X1: pH; X2: EC value/%; X3: E4/E6 value; X4: lignin decomposition rate/%; X5: hemicellulose decomposition rate/%; X6: cellulose decomposition rate/%; X7: total N, g/kg; X8: alkali solution, N mg/kg; X9: organic carbon, g/kg; X10: total P, g/kg; X11: available P, mg/kg; X12: total K, g/kg; X13: available K, g/kg; X14: C/N ratio; 1 d: the 1st day of rice straw decomposition; 30 d: the 30th day of rice straw decomposition.
Fermentation 11 00332 g003
Figure 4. Correlation analysis of related indices of rice straw decomposition. Note: * indicates significant difference (p < 0.05); ** indicates extremely significant difference (p < 0.01). X1: pH; X2: EC value/%; X3: E4/E6 value; X4: lignin decomposition rate/%; X5: hemicellulose decomposition rate/%; X6: cellulose decomposition rate/%; X7: total N, g/kg; X8: alkali solution, N mg/kg; X9: organic carbon, g/kg; X10: total P, g/kg; X11: available P, mg/kg; X12: total K, g/kg; X13: available K, g/kg; X14: C/N ratio.
Fermentation 11 00332 g004
Figure 5. Gray analysis of C/N ratio and other indicators.
Fermentation 11 00332 g005
Figure 6. Comprehensive evaluation of different microbial agents: (A) The subordinate function values of different indicators in different treatments. (B) The subordinate function mean values in different treatments. X1: pH value; X2: EC value/%; X3: E4/E6 value; X4: lignin decomposition rate/%; X5: hemicellulose decomposition rate/%; X6: cellulose decomposition rate/%; X7: total N, g/kg; X8: alkali solution, N mg/kg; X9: organic carbon, g/kg; X10: total P, g/kg; X11: available P, mg/kg; X12: total K, g/kg; X13: available K, g/kg; X14: C/N ratio.
Fermentation 11 00332 g006
Figure 7. Schematic diagram of the changes in the morphophysiological parameters when Bacillus subtilis is applied to the decomposition of rice straw. The depth of color in “Fermentation 11 00332 i001” represents the degree of apparent color change of straw. (↑), (↓), (|), and other symbols represent upregulation and downregulation, respectively, and there were no significant changes in any parameter.
Fermentation 11 00332 g007
Table 1. The color changes in rice straw during decomposition.
Time/dT1T2T3T4T5CK
1Light yellowLight yellowLight yellowLight yellowLight yellowLight yellow
5Dark yellowLight yellowLight yellowDark yellowLight yellowLight yellow
10Dark yellowDark yellowLight yellowYellowish brownDark yellowLight yellow
15Yellowish brownYellowish brownDark yellowYellowish brownDark yellowLight yellow
20Yellowish brownYellowish brownYellowish brownBrownYellowish brownDark yellow
25Yellowish brownBrownBrownBrownYellowish brownDark yellow
30BrownDark brownBrownDark brownYellowish brownDark yellow
Table 2. Changes in pH value during the decomposition of rice straw under different treatments.
Treatment051015202530
T17.62 ± 0.05a7.65 ± 0.03b6.56 ± 0.01d6.78 ± 0.05d7.61 ± 0.01b6.59 ± 0.03f7.81 ± 0.02b
T27.62 ± 0.05a7.65 ± 0.03b6.55 ± 0.05d6.74 ± 0.04d7.20 ± 0.08d7.39 ± 0.01b7.90 ± 0.01a
T37.60 ± 0.01a7.66 ± 0.01b6.84 ± 0.02c7.00 ± 0.03c7.25 ± 0.04d7.18 ± 0.09c7.25 ± 0.04e
T47.60 ± 0.01a7.66 ± 0.01b6.82 ± 0.10c7.31 ± 0.05b7.47 ± 0.04c6.91 ± 0.03d7.65 ± 0.02c
T57.67 ± 0.01a7.73 ± 0.01a7.47 ± 0.01b6.74 ± 0.01d7.43 ± 0.03c6.75 ± 0.03e7.54 ± 0.01d
CK7.61 ± 0.01a7.73 ± 0.01a7.65 ± 0.05a7.73 ± 0.04a7.76 ± 0.02a7.63 ± 0.04a7.80 ± 0.03b
Note: Different lowercase letters after data in the same column indicate significant differences at 0.05 level. The table below is the same.
Table 3. Changes in EC value during the decomposition of rice straw under different treatments.
Treatment051015202530
T13.09 ± 0.04a4.01 ± 0.11a4.34 ± 0.07a4.71 ± 0.09a3.71 ± 0.04d4.31 ± 0.06b4.65 ± 0.2a
T23.05 ± 0.07a3.95 ± 0.1a4.03 ± 0.02b4.13 ± 0.14b4.58 ± 0.12ab4.39 ± 0.07ab3.91 ± 0.05b
T32.98 ± 0.11a3.66 ± 0.03b3.93 ± 0.04b4.32 ± 0.26ab4.32 ± 0.04c4.42 ± 0.03ab3.83 ± 0.04b
T42.98 ± 0.05a3.58 ± 0.03b3.92 ± 0.01b4.42 ± 0.17ab4.37 ± 0.1bc4.31 ± 0.01b3.92 ± 0.06b
T52.94 ± 0.08a3.56 ± 0.01b3.74 ± 0.06c4.43 ± 0.04ab4.62 ± 0.05a4.58 ± 0.09a4.39 ± 0.07a
CK2.93 ± 0.06a2.86 ± 0.05c2.98 ± 0.02d3.04 ± 0.04c3.12 ± 0.05e3.03 ± 0.09c3.09 ± 0.08c
Table 4. Changes in E4/E6 value during the decomposition of rice straw under different treatments.
Treatment051015202530
T11.76 ± 0.05a1.82 ± 0.07b1.89 ± 0.09bc2.12 ± 0.18ab2.45 ± 0.12abc2.99 ± 0.21a2.64 ± 0.2ab
T21.78 ± 0.02a2.21 ± 0.18ab2.39 ± 0.12a2.72 ± 0.1a2.06 ± 0.24bcd2.57 ± 0.13ab1.51 ± 0.02d
T31.73 ± 0.03a2.41 ± 0.24a2.49 ± 0.18a2.48 ± 0.36a2.55 ± 0.17ab2.53 ± 0.23ab2.18 ± 0.29bc
T41.75 ± 0.05a2.25 ± 0.09ab2.52 ± 0.22a2.49 ± 0.12a2.55 ± 0.03ab2.23 ± 0.51ab2.24 ± 0.19bc
T51.75 ± 0.04a1.81 ± 0.1b2.23 ± 0.07ab2.24 ± 0.16ab2.92 ± 0.16a1.95 ± 0.42b3.2 ± 0.26a
CK1.72 ± 0.04a1.75 ± 0.22b1.73 ± 0.01c1.79 ± 0.08b1.87 ± 0.09d1.88 ± 0.03b1.89 ± 0.13cd
Disclaimer/Publisher’s Note: The statements, opinions and data contained in all publications are solely those of the individual author(s) and contributor(s) and not of MDPI and/or the editor(s). MDPI and/or the editor(s) disclaim responsibility for any injury to people or property resulting from any ideas, methods, instructions or products referred to in the content.