Article

Metabolic Engineering of Escherichia coli for De Novo Biosynthesis of Mandelic Acid

1
School of Life Science, Northeast Forestry University, Harbin 150040, China
2
Aulin College, Northeast Forestry University, Harbin 150040, China
3
College of Wildlife and Protected Area, Northeast Forestry University, Harbin 150040, China
4
Xiangbai Biotechnology Co., Ltd., Harbin 150040, China
*
Authors to whom correspondence should be addressed.
These authors contributed equally to this work.
Fermentation 2025, 11(6), 331; https://doi.org/10.3390/fermentation11060331
Submission received: 21 April 2025 / Revised: 30 May 2025 / Accepted: 6 June 2025 / Published: 9 June 2025
(This article belongs to the Section Microbial Metabolism, Physiology & Genetics)

Abstract

Mandelic acid (MA) is a valuable α-hydroxy acid with applications in pharmaceuticals, cosmetics, and fine chemicals. While chemical synthesis is well established, concerns over toxicity and sustainability have driven interest in microbial production. Here, we engineered Escherichia coli for de novo MA biosynthesis by integrating enzyme screening, metabolic flux optimization, and pathway regulation. We first screened and identified an efficient hydroxymandelate synthase (HMAS) homolog from Actinosynnema mirum for MA synthesis, and subsequently enhanced the shikimate pathway along with the supply of the precursors erythrose-4-phosphate (E4P) and phosphoenolpyruvate (PEP). Additionally, CRISPR interference (CRISPRi) was employed to repress competing pathways and redirect flux toward MA production. High-cell-density cultivation (HCDC) in a 5 L bioreactor demonstrated the strain’s industrial potential, achieving an MA titer of 9.58 g/L, the highest reported for microbial production. This study provides a systematic metabolic engineering approach for efficient MA biosynthesis from glucose, offering a foundation for sustainable large-scale production, demonstrating not only genetic-level optimizations, but also effective process scaling through high-cell-density cultivation, highlighting the power of pathway engineering in microbial cell factories.

1. Introduction

MA, an essential α-hydroxy acid, has garnered significant attention due to its chiral properties and broad biological activity, making it widely applicable in the pharmaceutical, cosmetic, and fine chemical industries [1]. Both MA and its derivatives are important in drug synthesis and stereochemical research, serving as key components in the production of antibiotics, disinfectants, and preservatives [2,3]. MA has been used in the treatment of urinary tract infections due to its antimicrobial activity and is also applied as a bladder irrigation solution to reduce catheter-associated infection risks [4]. Its antimicrobial properties have recently attracted growing interest in medical and agricultural applications [5]. As a chiral molecule, MA not only exhibits antimicrobial and anti-infective activities, but also serves as a key intermediate in synthesizing optically pure drugs, such as piminoline [6]. Furthermore, DL-MA has been shown to rapidly inhibit sperm motility with low vaginal irritation, highlighting its potential as a non-surfactant contraceptive agent [7,8,9,10]. These features underscore MA’s significance in biomedical applications. Halogen-substituted MA derivatives have also gained attention for their applications in metal–organic frameworks (MOFs) and chiral coordination polymers (CPs) [11]. Moreover, MA and its derivatives play a crucial role in enzyme-catalyzed reactions and biotechnological synthesis, contributing to sustainable chemical production [12]. These attributes highlight the broad utility of MA in fine chemical manufacturing and green chemistry.
MA can be synthesized through chemical or biological methods. Chemical synthesis, such as the cyanohydrin route, involves the reaction of benzaldehyde with hydrogen cyanide to form mandelonitrile, which is then hydrolyzed to titer MA [12]. Although this method is well-established, concerns over toxicity and environmental pollution have limited its industrial application. Recently, a nickel-catalyzed photoredox cross-coupling reaction has been developed for the selective synthesis of MA derivatives under mild conditions [13]. However, issues related to safety and sustainability have driven interest in biological synthesis as an alternative.
Biocatalytic approaches utilize nitrilases, nitrile hydratases (NHase), and amidases to convert mandelonitrile into MA, with nitrilases offering high catalytic efficiency but also producing amide by-products, which lower titer and purity [14,15]. NHase, which converts nitriles to amides before further hydrolysis to MA, suffers from poor thermal stability, limiting its industrial applicability [16]. To improve efficiency, multi-enzyme cascade reactions have been explored. A study using D-mandelate dehydrogenase (ManDH) and other enzymes converted phenylpyruvate (PP) and phenylglyoxylic acid (PGA) into MA, achieving a 90.9% conversion efficiency [17]. However, challenges such as enzyme compatibility and catalytic balance remain obstacles for industrial applications. To overcome these limitations, metabolic engineering has been applied to microbial MA production. In E. coli NST74, pathway optimization enabled the biosynthesis of (R)-MA through a five-enzyme cascade, reaching a titer of 760 mg/L [18]. Meanwhile, Saccharomyces cerevisiae (S. cerevisiae) has also been explored for de novo MA biosynthesis. The heterologous expression of HMAS, combined with the shikimate pathway enhancement, increased MA production to 2.9 mg/L [19]. Further metabolic flux optimization improved production to 236 mg/L, a 200-fold increase over the initial strain. Moreover, S. cerevisiae tolerated up to 7.5 g/L MA, suggesting its potential as a robust production host [20]. Despite recent advancements, current biocatalytic and microbial production methods still face limitations, including low titers, enzyme stability issues, and metabolic flux inefficiencies. Enhancing biosynthetic efficiency and achieving industrial-scale production remain major challenges in the field.
To address these challenges, this study focuses on enhancing de novo biosynthesis of MA through metabolic engineering strategies (Figure 1). We first screened and functionally validated HMAS homologs to identify a highly efficient enzyme for MA biosynthesis. Next, we optimized the expression of endogenous key genes involved in the aromatic amino acid pathway to improve precursor supply. Additionally, we employed CRISPRi to repress competing metabolic pathways and redirect flux toward MA synthesis. Finally, we evaluated the performance of the engineered strain under HCDC conditions in a 5 L bioreactor to assess its potential for large-scale production. This study provides a comprehensive metabolic engineering approach for sustainable and efficient microbial production of MA.

2. Materials and Methods

2.1. Chemical Compounds and Standards

Phenylpyruvic acid (98%) and Mandelic acid (99%) were purchased from MACKLIN (Shanghai, China). Analytical-grade glucose was obtained from Tianjin Regent Chemical Co., Ltd. (Tianjin, China). All other reagents used in this study were standard molecular biology reagents.

2.2. Strains and Plasmid Construction

The commonly used E. coli strains DH5α and BW25113 were obtained from Weidi Biotechnology Co., Ltd. (Shanghai, China). The plasmids pYB1a, pSB1c, and dCas9 used in this study were derived from previous research conducted in our laboratory.
All plasmids constructed in this study were assembled using the Gibson Assembly method [21] with the Gibson Assembly Cloning Kit (NEB, Ipswich, MA, USA). Plasmids were introduced into E. coli competent cells via heat shock transformation [22].
To ensure clarity and consistency, all engineered E. coli strains used in this study were assigned systematic names based on their genetic modifications. A detailed summary of strain names and corresponding genetic alterations is provided in Table S1.

2.3. Protein Network Analysis

A protein network was constructed to analyze the sequence relationships among HMAS homologs. First, the amino acid sequence of the query protein was used as input for the EFI-EST (https://efi.igb.illinois.edu/efi-est/, accessed on 1 June 2025) to perform a BLAST search (NCBI BLAST+ version 2.15.0) against available protein databases [23,24,25]. Sequences with a percent identity greater than 35% were selected from the output.
The resulting protein sequences were imported into Cytoscape (v3.8) for visualization. The yFiles Organic Layout algorithm was applied to generate an initial layout of the network. Edge thickness was adjusted based on sequence similarity (% identity) to better represent the relationships among proteins [26]. The final network visualization was manually refined for clarity and exported for further analysis.

2.4. Cultivation and Induction of Engineered Strains

Single colonies of engineered E. coli strains were inoculated into 5 mL of LB liquid medium supplemented with appropriate antibiotics (100 mg/L ampicillin, 30 mg/L chloramphenicol, or 50 mg/L kanamycin, depending on plasmid resistance). The cultures were incubated overnight at 37 °C with shaking at 220 rpm.
For induction, 1 mL of the overnight culture was transferred into 100 mL of ZYM-5052 medium containing 0.2% arabinose and cultivated at 30 °C with shaking at 220 rpm for 12 h. If the strain carried a CRISPRi plasmid, IPTG was also added to a final concentration of 1 mM to induce gene repression.
The composition of ZYM-5052 medium was as follows: 10 g/L tryptone, 5 g/L yeast extract, 50 mM phosphate buffer, 50 mM ammonium chloride, 5 mM sodium sulfate, 0.5% glycerol, 0.05% glucose, and 0.2 mM magnesium sulfate, along with essential trace metal ions.

2.5. Protein Expression and SDS-PAGE Analysis

To evaluate protein expression, a bacterial culture equivalent to 6 OD600 units (approximately 2 mg dry cell weight) was collected after induction. The culture was centrifuged at 10,000× g for 10 min, and the supernatant was discarded. The cell pellet was resuspended in 600 μL of double-distilled water (ddH2O) and disrupted by ultrasonication on ice. The lysate was centrifuged again at 10,000× g for 10 min to separate the soluble fraction (supernatant) from the insoluble fraction (pellet). The pellet was resuspended in 600 μL of ddH2O. Both fractions were stored at ≤4 °C until further analysis.
SDS-PAGE was performed following a previously described method [27]. A loading buffer was added to the protein samples, followed by denaturation at 95 °C for 5 min. Electrophoresis was conducted under denaturing conditions using a 12% polyacrylamide gel, and proteins were visualized by Coomassie Brilliant Blue staining.

2.6. Whole-Cell Biocatalysis

Following induction in shake flask cultures, the bacterial suspension was diluted 10-fold, and cell growth was monitored by measuring the optical density at 600 nm (OD600) using a UV–visible spectrophotometer. A total of 90 OD units of the culture was collected into a 10 mL centrifuge tube and harvested by centrifugation at 4200 rpm for 10 min. The supernatant was discarded, and the cell pellet was washed once with 50 mM Tris-HCl buffer (pH 7.5). After discarding the wash solution, the cells were resuspended in 3 mL of reaction mixture prepared by dissolving the substrate in 50 mM Tris-HCl buffer (pH 7.5).
The resuspended cells were then transferred to a 100 mL Erlenmeyer flask and incubated at 30 °C with shaking at 220 rpm for 24 h. Samples were taken periodically for analysis as required.

2.7. Extraction and Analysis of MA

After whole-cell biocatalysis, the reaction mixture was diluted 10-fold with deionized water. A 1 mL aliquot was transferred to a 1.5 mL microcentrifuge tube and centrifuged at 10,000× g for 10 min. The supernatant was carefully transferred to a new microcentrifuge tube, filtered through a 0.22 μm membrane filter using a 1 mL syringe, and then transferred into an HPLC vial for analysis.
HPLC analysis was performed using an Agilent 1100 series system equipped with an XB-C18 column (4.6 × 250 mm, 5 μm, Welch Materials, Shanghai, China). The injection volume was set to 5 μL, with a column temperature of 35 °C and a flow rate of 0.7 mL/min. The detection wavelength for MA was set to 210 nm. The mobile phase consisted of 20 mM phosphate buffer containing 10% methanol. The total runtime was 15 min.

2.8. CRISPRi-Mediated Gene Interference

Gene interference was performed using the CRISPRi system [28,29]. First, the GenBank (.gb) format sequence of the target gene was retrieved from NCBI or the existing literature. The sequence file was then uploaded to the CRISPy-web tool to identify suitable gRNA target sites [30]. A set of gRNA sequences located on the sense strand (strand = 1) was selected, and the 20-bp target sequence was used to replace the spacer sequence in the dCas9 plasmid. The constructed plasmid was then introduced into the engineered E. coli strain, and gene repression was induced by adding IPTG to a final concentration of 1 mM.
For multiplex gene interference, individual gRNA-expressing plasmids were first constructed for each target gene. The promoter-lac operator, spacer region, and gRNA scaffold of each plasmid were then assembled into a single dCas9 plasmid. The resulting plasmid was transformed into the engineered strain, and IPTG induction was performed to simultaneously repress multiple target genes.

2.9. HCDC of E. coli

HCDC was carried out in a 5 L bioreactor. The initial cultivation conditions were as follows: 37 °C, 20 g/L glucose, an initial agitation speed of 180 rpm, and pH maintained at 7.0 ± 0.2 using ammonia water, which also served as an important nitrogen source during fermentation; a bacterial inoculum of 10% (v/v), an aeration rate of 1 vvm, and dissolved oxygen (DO) maintained above 30% with cascade control of agitation speed. When the agitation speed reached its upper limit (800 rpm), the aeration rate was increased to 3 vvm.
The DO level was continuously monitored during fermentation. When a significant increase in DO was observed, accompanied by a rise in pH, glucose depletion in the bioreactor was inferred. At this point, a feeding solution containing 600 g/L glucose and 2 mM magnesium sulfate was supplied, with the feeding rate adjusted dynamically based on DO variations.
For cooling and induction, when the OD600 reached above 30, the culture temperature was lowered to 30 °C. After temperature stabilization, arabinose and IPTG were added to final concentrations of 0.2% and 1 mM, respectively, to induce gene expression. During fermentation, samples were periodically collected to determine cell density and MA concentration. The fermentation was terminated, and the culture was harvested when OD remained unchanged for 3 consecutive hours.

3. Results and Discussion

3.1. Selection and Functional Validation of HMAS Homologs

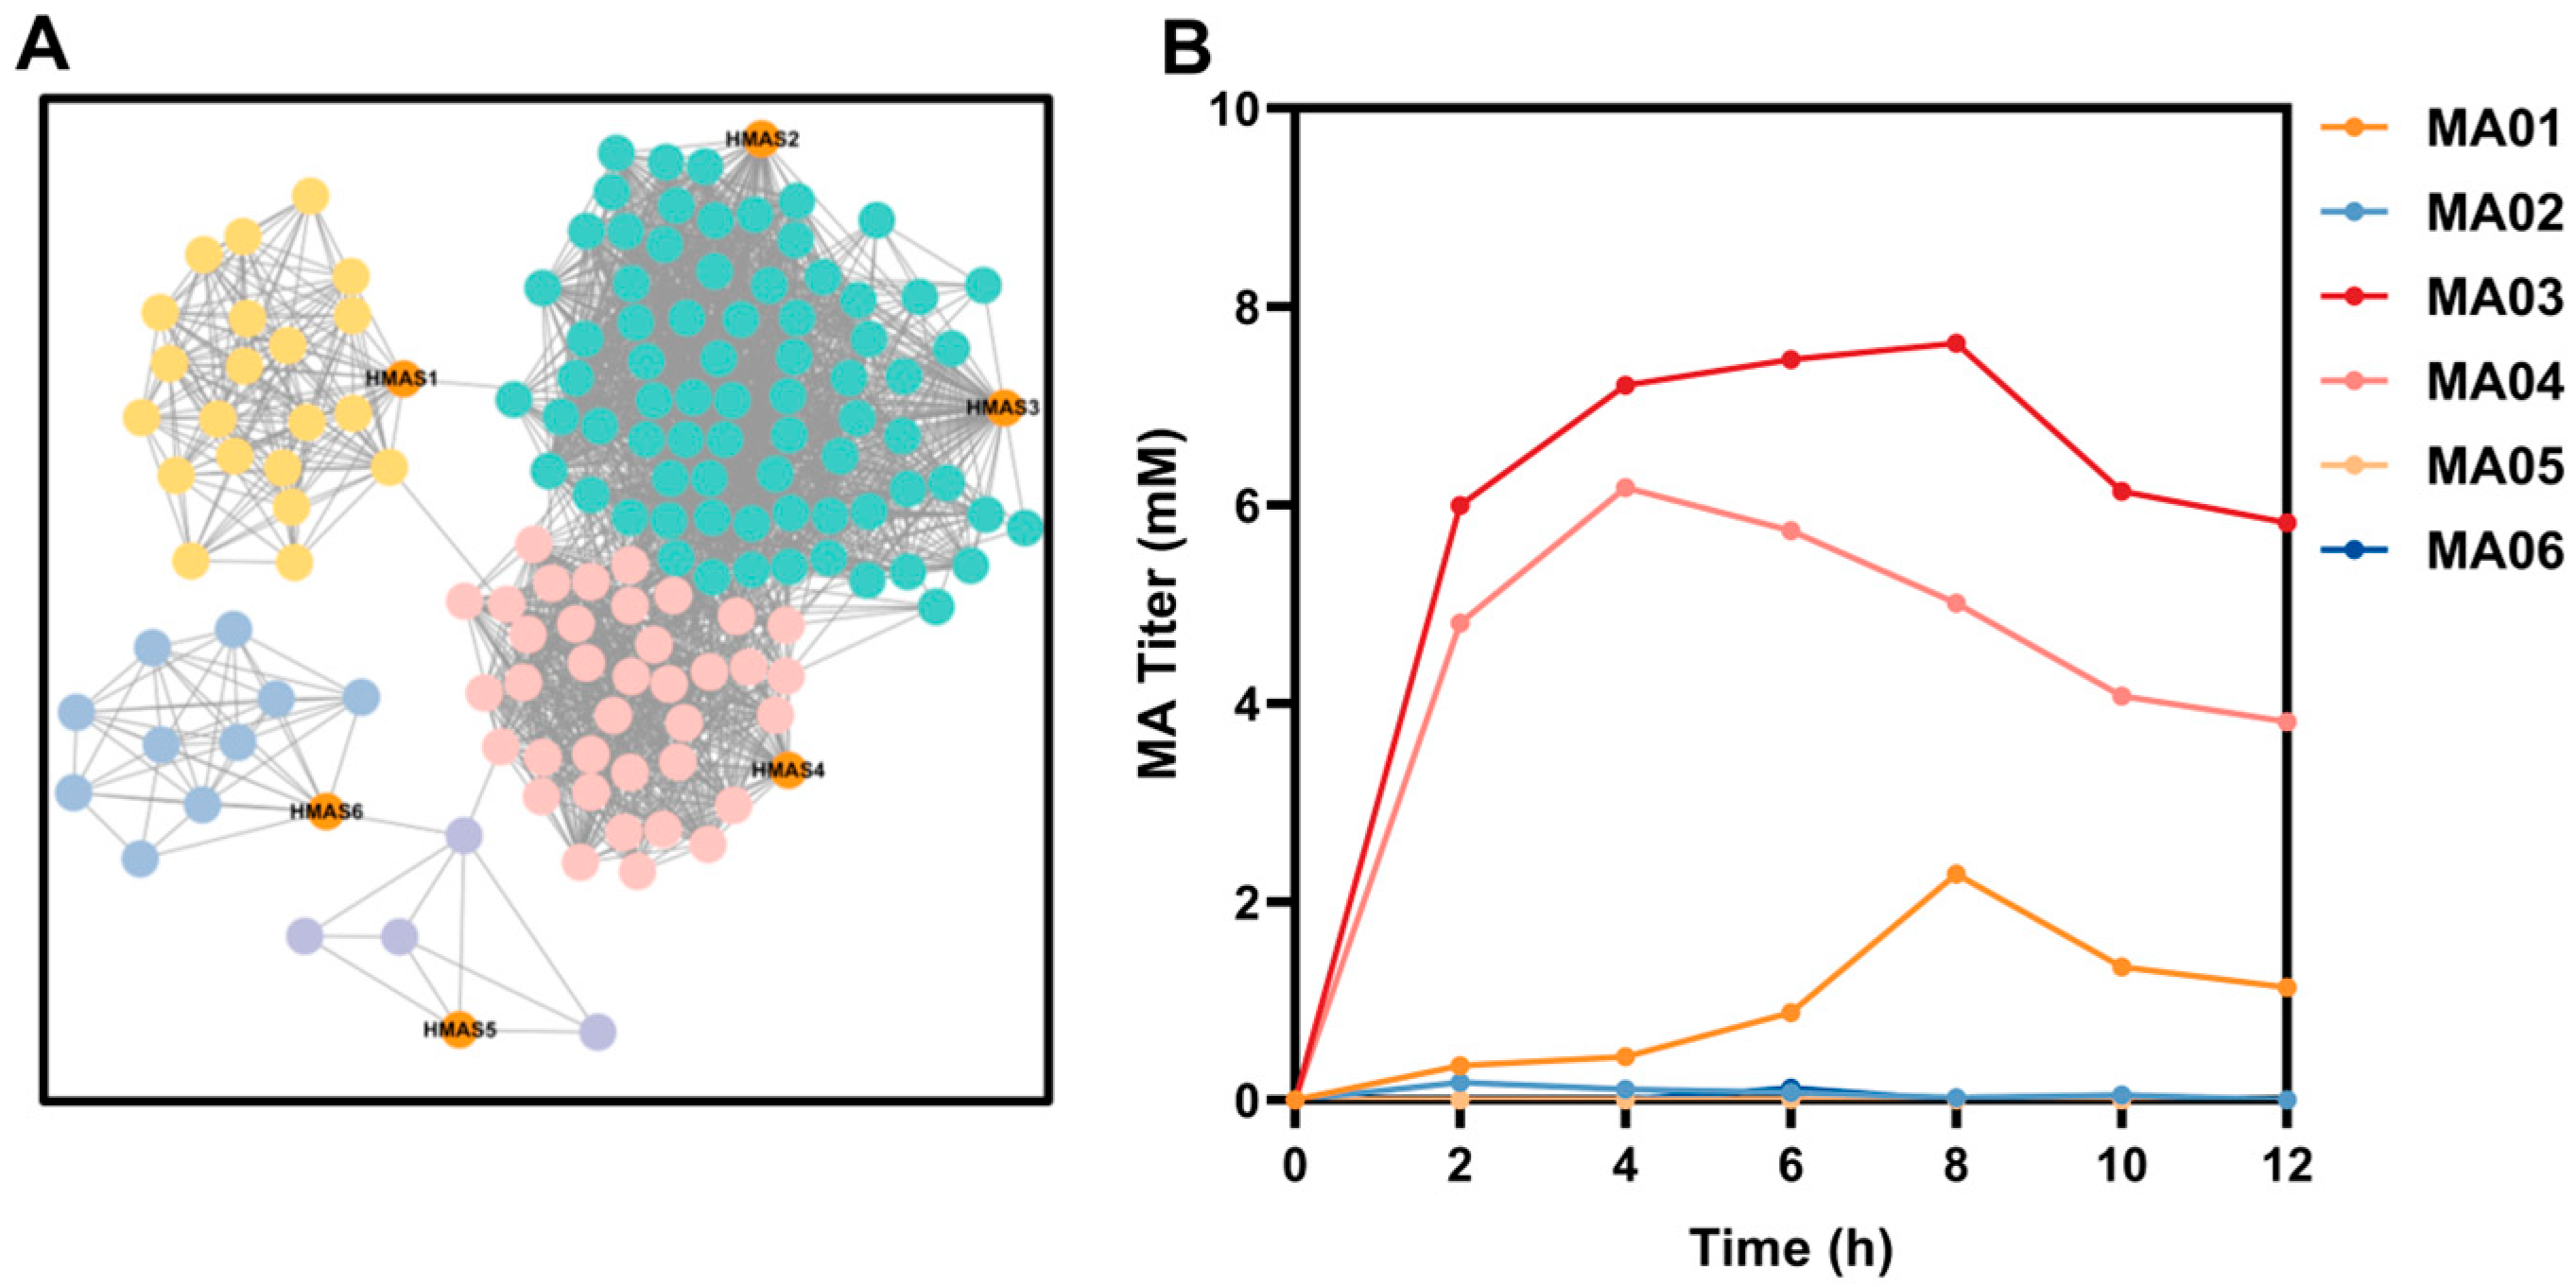
To analyze the sequence relationships among HMAS enzymes from different species and identify potential candidates with high catalytic efficiency, we constructed a similarity network of HMAS homologs. As the HMAS enzyme from Streptomyces coelicolor had been previously constructed and tested in our laboratory but exhibited suboptimal catalytic efficiency, it was used as the query sequence for a BLAST search on the Enzyme Function Initiative–Enzyme Similarity Tool (EFI-EST) platform. Sequences with ≥35% sequence identity were selected, and, based on literature evidence, six representative HMAS variants (HMAS1–HMAS6) were chosen for further investigation [31,32]. HMAS1–HMAS6 were derived from Streptomyces coelicolor, Amycolatopsis orientalis, Actinosynnema mirum, Micromonospora tulbaghiae, Myxococcus stipitatus and Herpetosiphon aurantiacus, respectively, representing distinct evolutionary lineages of Actinobacteria and Proteobacteria (Table S2).
To visualize the sequence similarity network (SSN), Cytoscape 3.8 was employed for data processing, and the yFiles Organic Layout algorithm was applied to optimize network topology. In the generated network, nodes represent HMAS enzymes from different species, while edge thickness reflects sequence similarity (% identity). As shown in (Figure 2A), HMAS1–HMAS4 formed a closely clustered group, suggesting potential functional similarities. In contrast, HMAS5 and HMAS6 appeared in more distant branches, indicating potential differences in substrate specificity or catalytic mechanisms. However, sequence similarity alone does not directly predict enzymatic efficiency, necessitating further experimental validation of PP-to-MA conversion efficiency among these HMAS homologs.
To assess the catalytic activity of HMAS1–HMAS6, whole-cell biocatalysis assays were performed using recombinant E. coli strains MA01–MA06, each expressing one of the six HMAS homologs. Reactions were conducted with 10 mM PP as the substrate, and samples were collected at 2 h intervals for HPLC analysis. As shown in Figure 2B, HMAS3 and HMAS4 exhibited the highest catalytic efficiencies, with HMAS3 displaying the most robust performance. HMAS1 exhibited a slower initial reaction rate but efficiently converted PP to MA after 6 h. In contrast, HMAS2, HMAS5, and HMAS6 showed minimal catalytic activity, with almost no detectable conversion of PP to MA.
To further investigate the observed differences in catalytic efficiency, we examined the heterologous expression of HMAS1–HMAS6 in E. coli BW25113. The same engineered strains (MA01–MA06) used for whole-cell biocatalysis were also employed for protein expression analysis, ensuring consistency in genetic background and cultivation conditions. SDS-PAGE analysis revealed that HMAS2, HMAS5, and HMAS6 primarily formed inclusion bodies, with negligible soluble protein detected in the supernatant. HMAS1 showed a small fraction of soluble protein, but the majority remained insoluble. In contrast, both HMAS3 and HMAS4 were predominantly expressed in soluble form (Figure S1, Table S3), indicating better folding efficiency in the heterologous host compared to the other homologs. While we did not quantify the relative solubility between HMAS3 and HMAS4 in detail, HMAS3 from Actinosynnema mirum produced a significantly higher MA titer under the test expression and reaction conditions. Therefore, MA03 was selected as the optimal candidate for further pathway engineering and process optimization.

3.2. Optimization of Endogenous Key Gene Overexpression

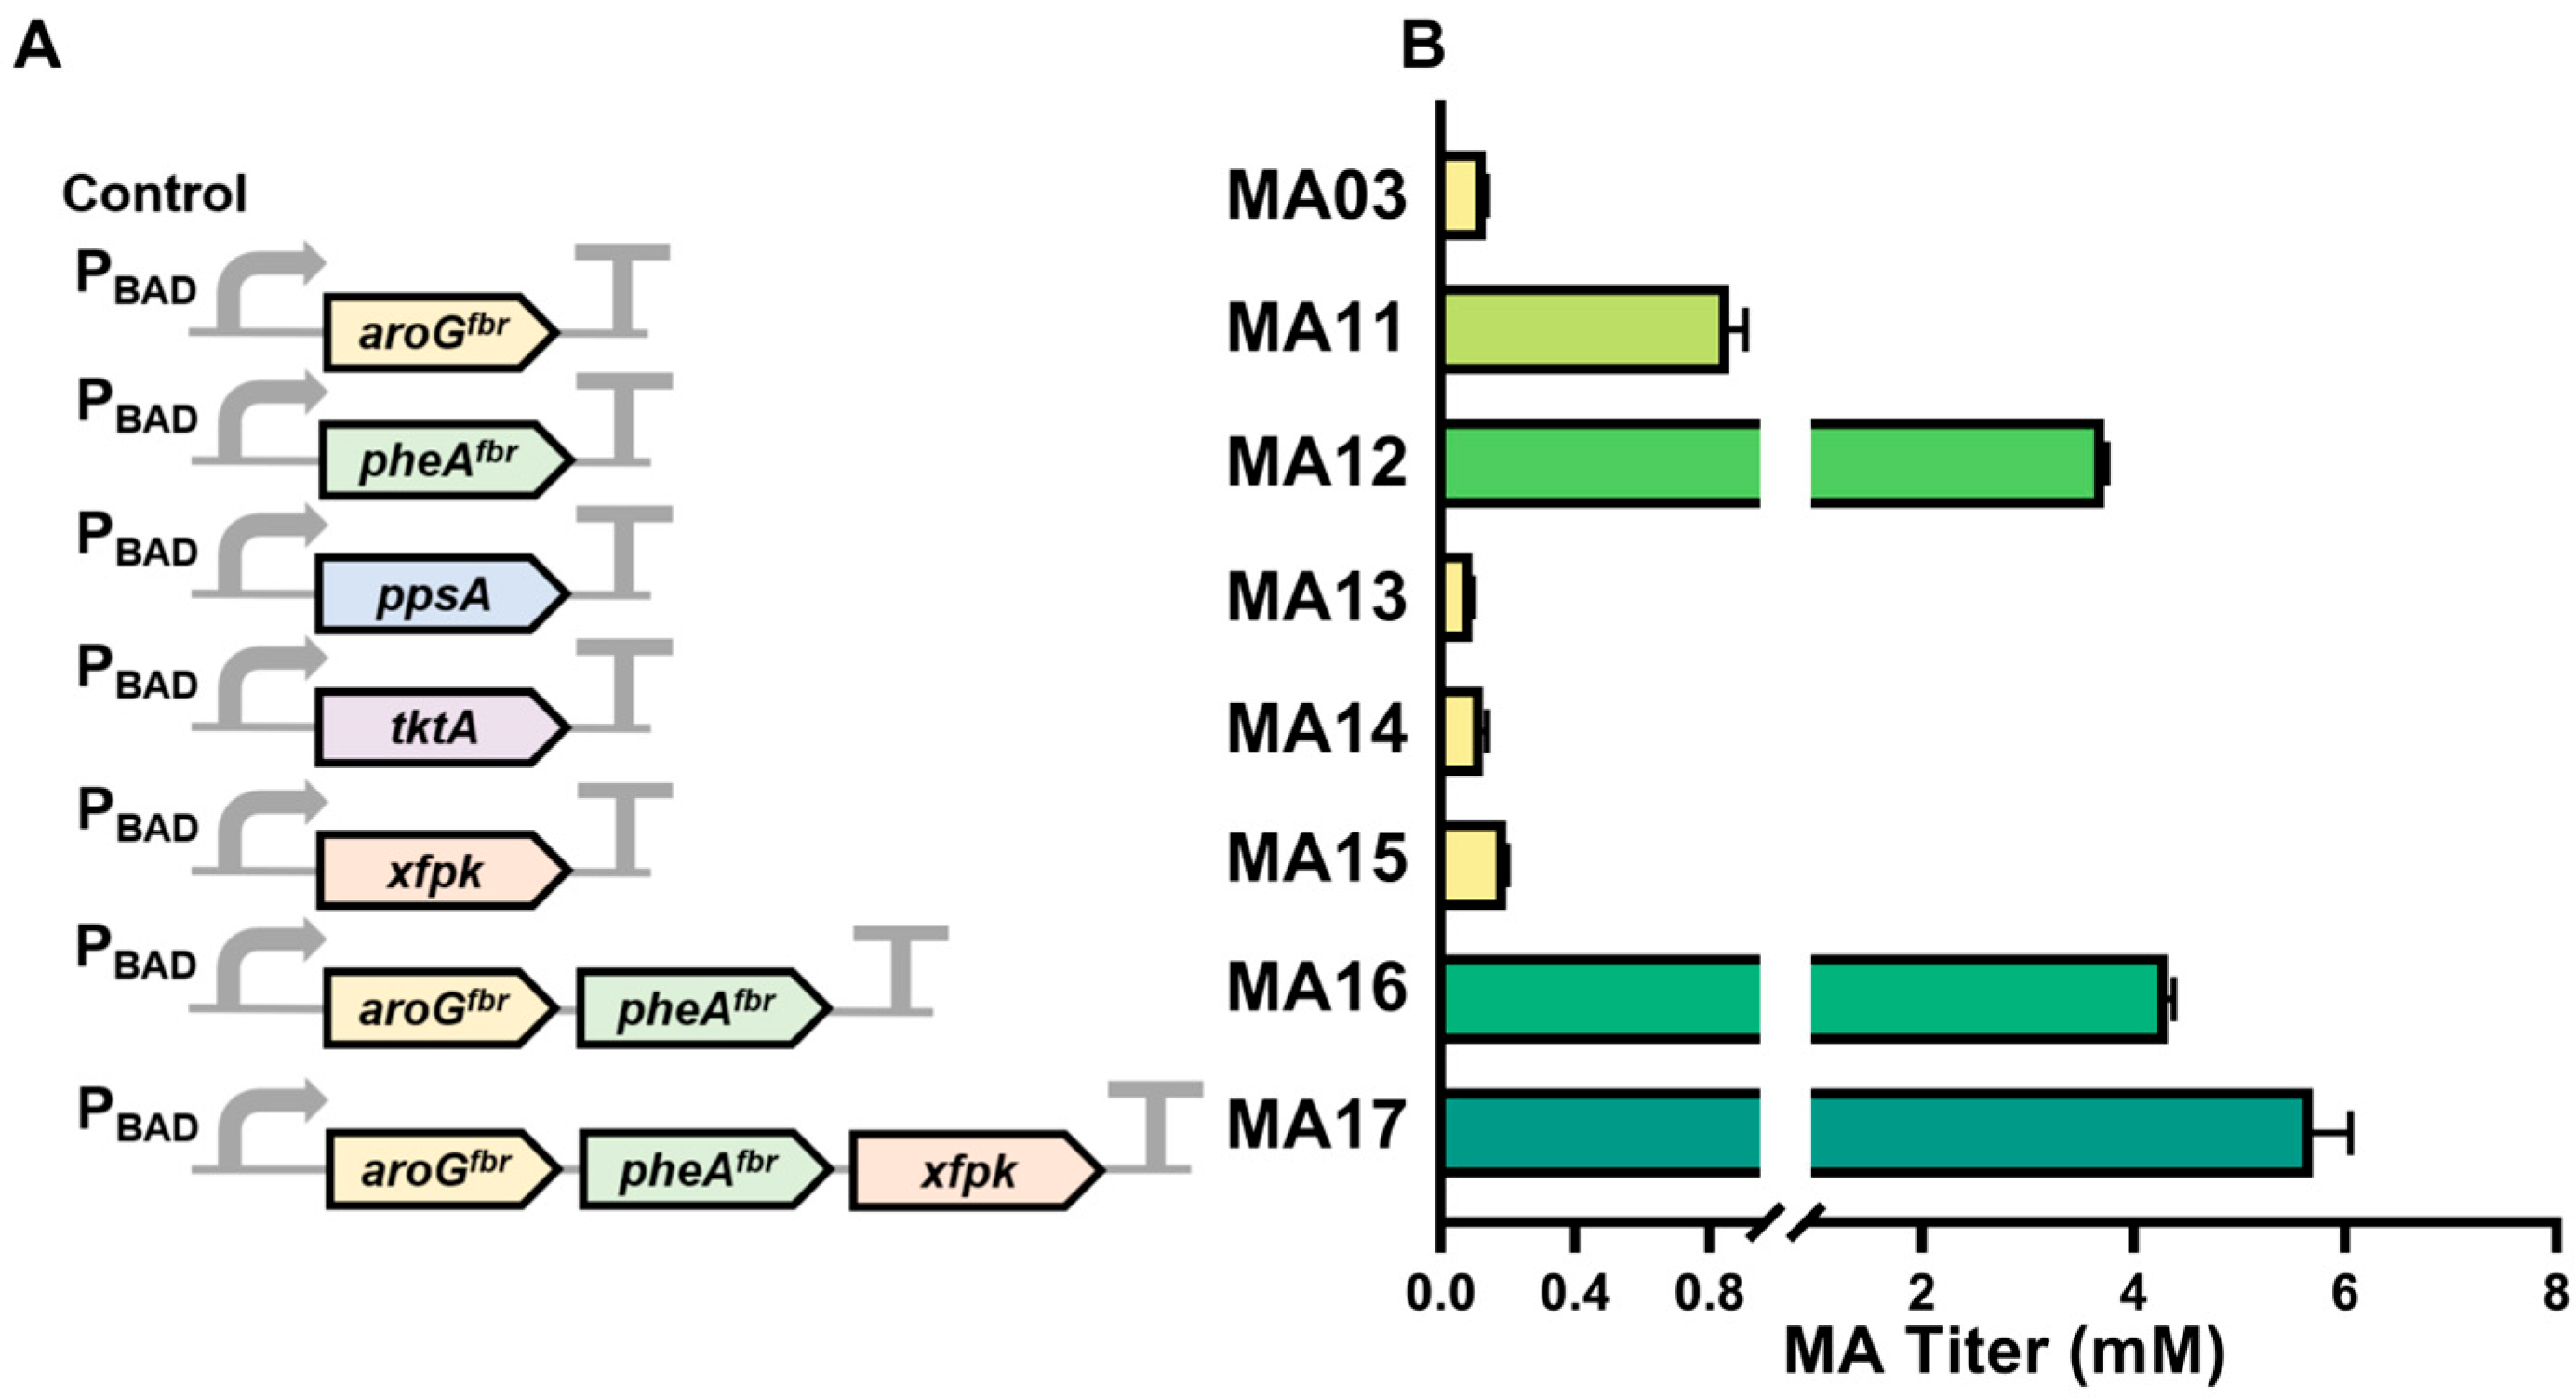
After identifying strain MA03 as the most efficient whole-cell catalyst for PP-to-MA conversion, we further optimized the host’s metabolic flux to enhance the MA titer. Based on the metabolic pathway shown in Figure 1, we selected several key genes that potentially influence PP supply and carbon flux distribution for overexpression Figure 3A (Table S2). To evaluate the effects of these genes, recombinant strains overexpressing AroGfbr, PheAfbr, Xfpk, TktA, and PpsA were constructed and subjected to whole-cell biocatalysis assays in shake flasks. MA production was quantified under conditions where 10 g/L glucose served as the sole carbon source in a fixed-volume reaction system (Figure 3B).
The results showed that gene overexpression had varying effects on MA production. In the shikimate pathway, strain MA11, which overexpresses AroGfbr (DAHP synthase), enhanced the supply of PP precursors, increasing MA production 6.6-fold compared to strain MA03. Strain MA12, overexpressing PheAfbr (aromatic aminotransferase), which catalyzes the conversion of chorismate (CHA) to PP, further boosted MA production to 28.62-fold that of MA03. In contrast, genes involved in precursor supply and carbon flux redistribution had mixed effects. Strain MA13, overexpressing PpsA (phosphoenolpyruvate synthase) reduced the MA titer by 30%, likely due to an unfavorable redistribution of carbon flux. Strain MA14, overexpressing TktA (transketolase), which enhances E4P supply via the PPP, had little impact, suggesting that native PPP activity was sufficient. Strain MA15, overexpressing of Xfpk (phosphoketolase), which regulates carbon flux between the EMP and PPP pathways, increased MA production by 44%, potentially optimizing metabolic flux toward the shikimate pathway.
To further enhance MA production, combinatorial strategies were explored. Strain MA16, through the co-overexpressing of AroGfbr and PheAfbr, increased MA production 32.16-fold compared to MA03, surpassing individual overexpression strains. Further addition of Xfpk in strain MA17, forming the AroGfbr+PheAfbr+Xfpk triple-gene overexpression strain, resulted in a 42.34-fold increase, the highest observed titer (Figure 3B, Table S4). These findings indicate that the simultaneous enhancement of shikimate pathway precursors (AroGfbr), PP conversion (PheAfbr), and carbon flux distribution (Xfpk) is more effective in boosting MA production than single-gene modifications.
By optimizing the expression of endogenous metabolic genes, we successfully enhanced PP availability and significantly improved MA production. However, despite these enhancements, PP metabolism remains interconnected with competing pathways that divert flux away from MA biosynthesis, potentially constraining further titer improvements. In particular, excessive carbon flux toward undesired byproducts may reduce the efficiency of the shikimate pathway. To address this limitation, we explored gene interference strategies to selectively downregulate competing pathways, thereby directing more metabolic flux toward MA biosynthesis.

3.3. CRISPRi-Mediated Inhibition of Competing Pathways to Enhance MA Production

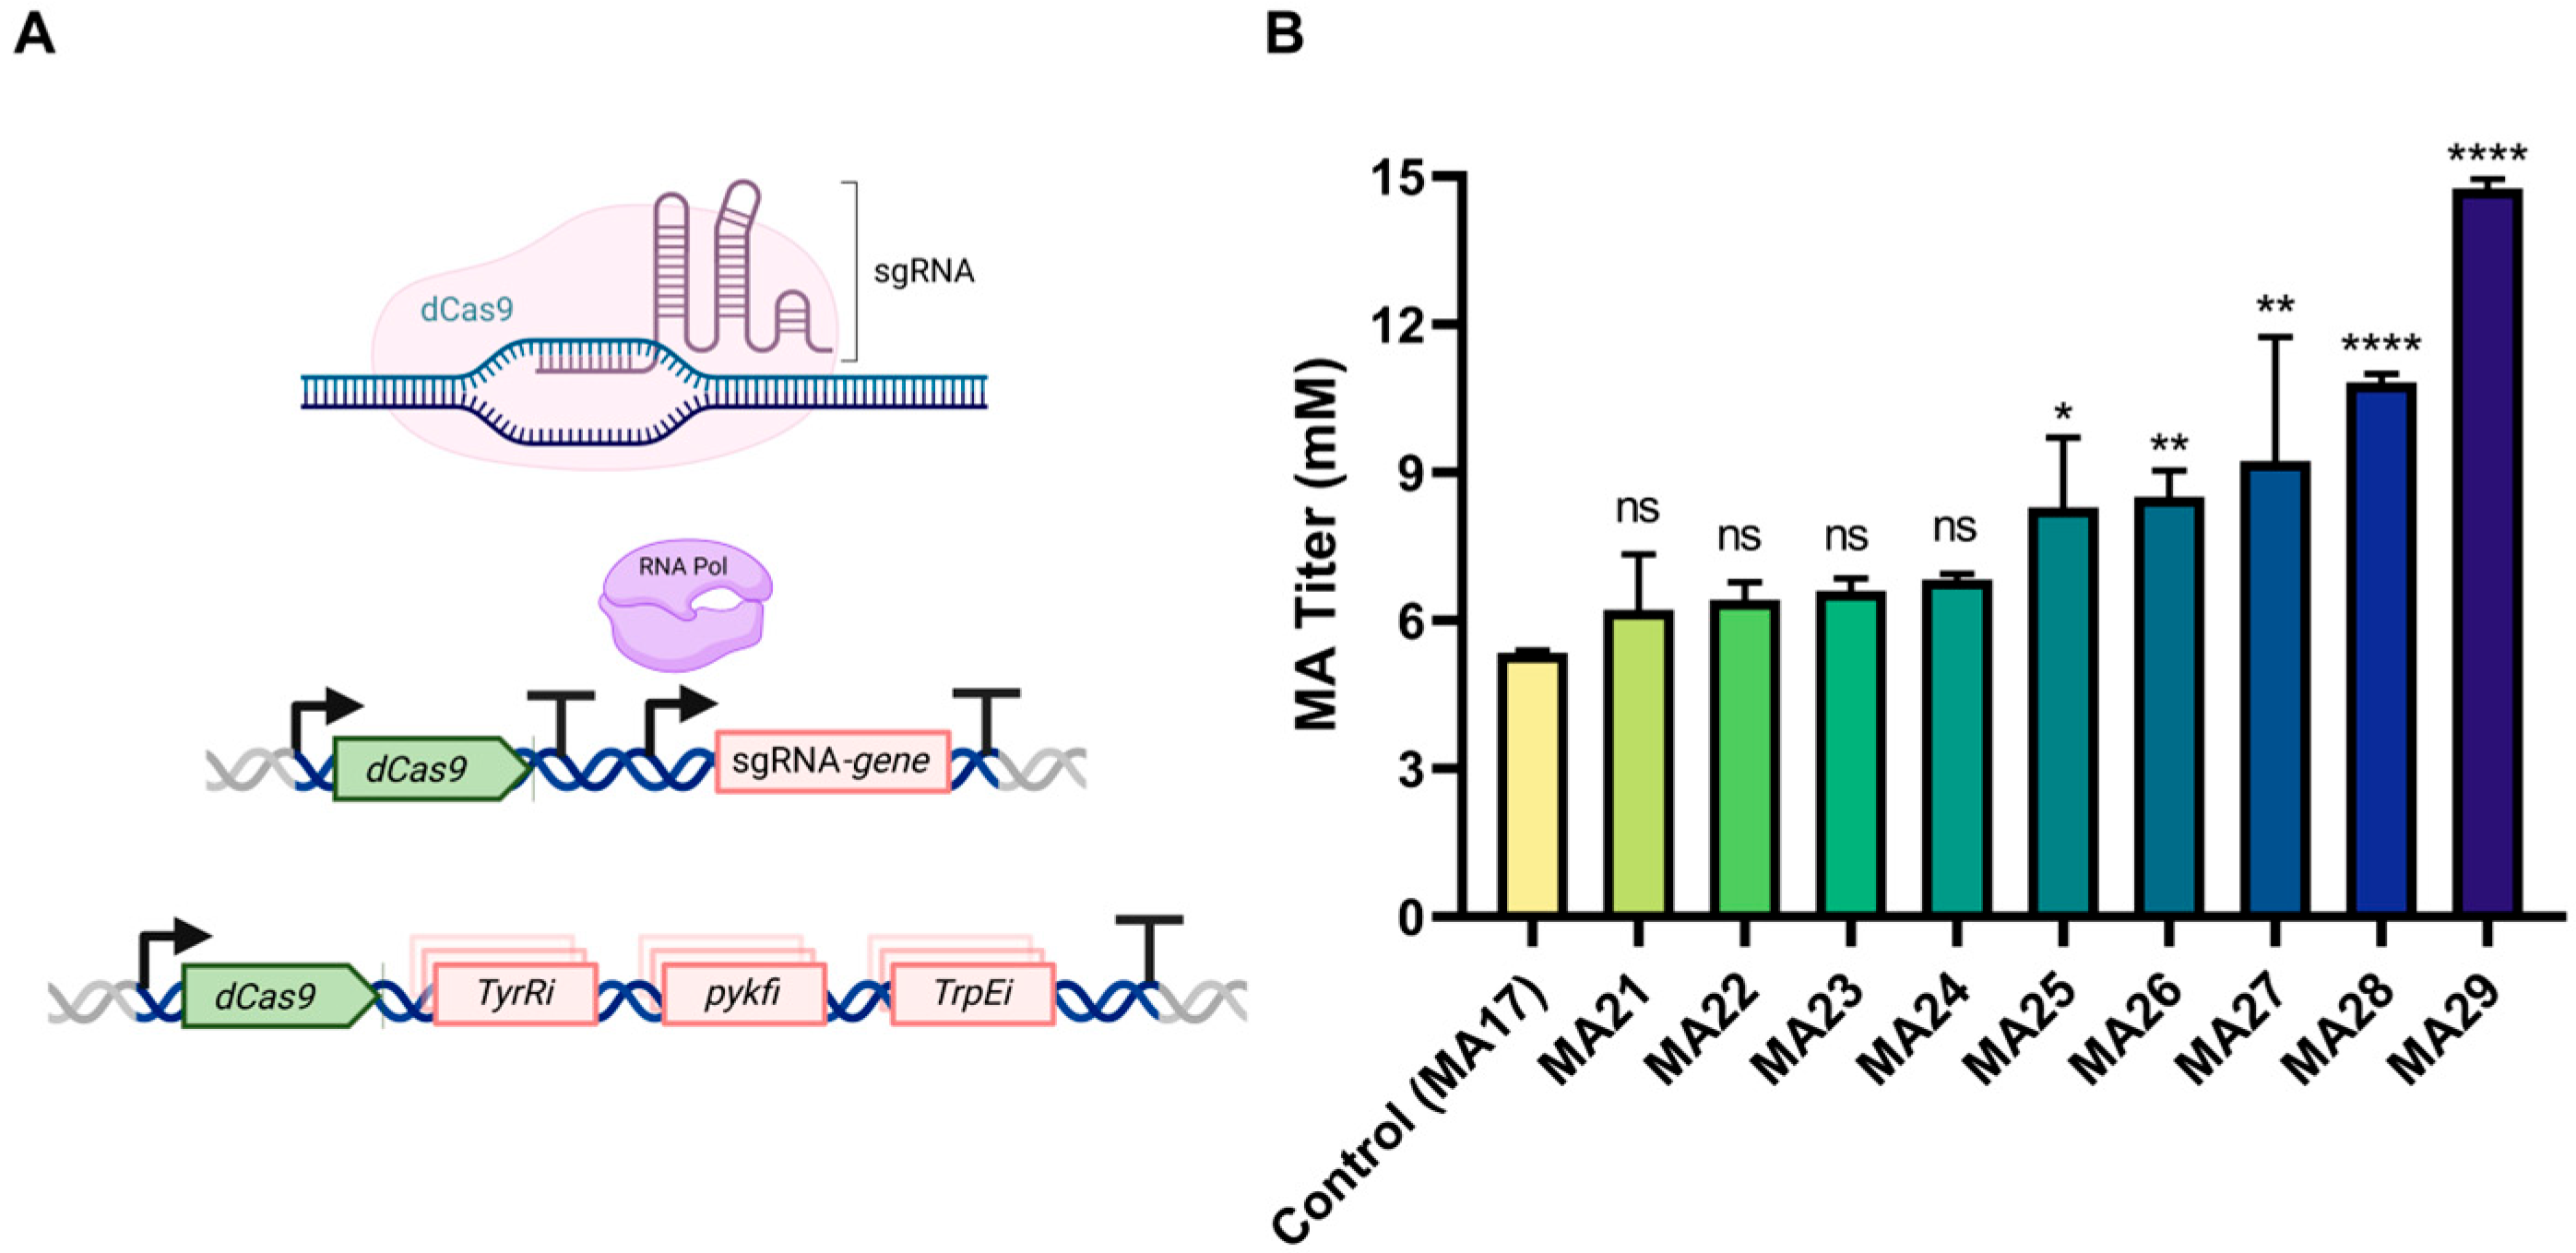
CRISPRi is a powerful tool for programmable gene repression, widely applied in metabolic engineering to fine-tune metabolic fluxes and optimize biosynthetic pathways. Unlike gene knockout strategies, CRISPRi enables transcriptional suppression without permanent genetic modifications, reducing the risk of growth defects caused by the loss of essential genes [33,34,35]. Given the significant increase in the MA titer achieved by overexpressing the endogenous genes AroGfbr, PheAfbr, and Xfpk, we further applied CRISPRi to redirect metabolic flux away from competing pathways, thereby increasing the precursor availability for MA biosynthesis (Figure 4A, Table S5).
Based on the metabolic pathway shown in Figure 1, we selected six endogenous genes (pykF, tyrR, trpR, trpA, trpE, and csrA) as potential targets for CRISPRi-mediated repression. These genes are primarily involved in aromatic amino acid metabolism, global transcriptional regulation, and glycolysis, and were hypothesized to affect the MA titer by diverting essential precursors away from the shikimate pathway; specifically, pykF encodes pyruvate kinase, directing PEP toward pyruvate synthesis and subsequently into the TCA cycle [36,37]. tyrR and trpR are transcriptional regulators that modulate aromatic amino acid biosynthesis [38,39,40], while trpE encodes anthranilate synthase involved in tryptophan synthesis [41], potentially competing with PP for common precursors. Additionally, tyrA, trpA, and csrA were selected as candidate genes based on their roles in amino acid biosynthesis and global carbon flux regulation [42,43,44].
We individually constructed CRISPRi strains targeting each of these genes and measured their effects on the MA titer through whole-cell biocatalysis assays (Figure 4B, Table S6). Strains MA21–MA27, each targeting one of the candidate genes, were evaluated. Repression in MA21, MA22, and MA23 (tyrA, trpA, and csrA) resulted in no significant improvement in MA production, suggesting these genes have limited influence on flux toward MA. In contrast, MA24 (targeting tyrR) and MA25 (targeting trpE) enhanced the MA titer by 55.2% and 59.0%, respectively, compared to the control strain. These results indicate a significant metabolic competition from aromatic amino acid biosynthesis pathways. More notably, MA27 (targeting pykF) resulted in a 72.8% increase in MA production compared to the control strain, confirming that reducing pyruvate formation can effectively redirect more PEP toward the shikimate pathway for PP synthesis.
Considering the beneficial effects observed with individual gene repression, we further combined CRISPRi targets to explore potential synergistic effects. To determine the most promising combinations, we selected genes that exhibited significant improvements in MA production upon single-gene repression. In contrast, genes such as trpA, tyrA, and csrA showed negligible effects when repressed individually and were therefore excluded from further combinatorial designs to avoid unnecessary metabolic burden or impaired growth. This strategy allowed us to prioritize synergistic interactions among effective targets and ensure metabolic stability. MA28, together with co-repression of tyrR and pykF, produced a 102.5% increase in MA production relative to the control, higher than any single-gene repression strain. Additionally, MA29, together with simultaneous repression of tyrR, pykF, and trpE, resulted in the highest MA titer, achieving a 176.1% improvement over MA27 and approximately 2.76-fold increase compared with the MA17. We also attempted the co-repression of tyrR and trpE; however, this combination led to severely impaired growth and significantly prolonged cultivation time. As a result, we did not proceed to evaluate its effect on MA production. These results collectively suggest that simultaneous modulation of transcriptional regulation (tyrR), PEP consumption (pykF), and competitive aromatic amino acid biosynthesis (trpE) significantly synergizes to enhance precursor flux toward MA synthesis.
Taken together, the CRISPRi-mediated repression of competing metabolic pathways effectively redirected metabolic flux toward MA biosynthesis, substantially improving the MA titer. The highest MA titer was obtained through the simultaneous repression of tyrR, pykF, and trpE, highlighting the effectiveness of combinational gene repression strategies in metabolic engineering.

3.4. HCDC of Engineered E. coli in a 5 L Bioreactor

To validate the effectiveness and scalability of our engineered strain, we next conducted an HCDC experiment using a 5 L bioreactor (Figure 5A). We used strain MA29, which harbored the previously identified optimal enzyme (HMAS3) for catalyzing the conversion of PP to MA, coupled with combinatorial metabolic enhancements through overexpression of key endogenous genes and CRISPRi-mediated repression of competing pathways.
The fermentation process was initiated at 37 °C to facilitate rapid bacterial growth. After cultivation for 16 h, the optical density OD600 exceeded 30, reaching approximately 45. At this point, the cultivation temperature was decreased to 30 °C. This temperature shift was implemented to reduce the cellular metabolic burden and favor proper protein folding during the expression of recombinant enzymes, thereby enhancing catalytic efficiency and overall production performance. Once the temperature stabilized, sterile arabinose and IPTG were added to final concentrations of 0.2% and 1 mM, respectively, to induce expression of engineered metabolic genes. To minimize overflow metabolism and the accumulation of byproducts such as acetate, we implemented a high-aeration and dynamic feeding strategy after induction. Throughout the fermentation process, sterile air was continuously supplied at a rate of 3 vvm, and dissolved oxygen was maintained between 10% and 30%, using cascade agitation control. A 500 g/L glucose solution was pulse-fed at a rate of 2 s every 50 s and adjusted as needed to ensure appropriate glucose availability without causing overaccumulation. This strategy ensured efficient carbon source utilization and minimized carbon flux toward undesired byproduct pathways.
After induction, MA production commenced rapidly, achieving a concentration of approximately 8.86 mM by 30 h, accompanied by continuous growth to an OD600 of around 80.7. Subsequently, between 30 and 78 h, cell density continued to increase steadily and eventually plateaued between 78 and 82 h at a maximum OD600 of approximately 183.3. MA production exhibited a continuous increase until approximately 82 h, ultimately reaching a peak titer of 62.81 mM (~9.58 g/L) at 86 h, with no further significant accumulation observed during the subsequent cultivation period (Figure 5B, Table S7). As MA was only produced after induction, the product formation period was defined as starting at 16 h post-inoculation. This corresponded to an overall volumetric productivity of approximately 0.137 g/L/h over the 70 h production period, and a maximum instantaneous productivity of 0.21 g/L/h observed between 66 h and 70 h. The observed growth plateau and cessation of MA accumulation suggest potential nutrient limitation, metabolic stress, or feedback inhibition of pathway enzymes, indicating areas for further process optimization.
Notably, the final MA titer obtained in this study represents a substantial improvement compared with previously reported microbial production systems, such as the engineered S. cerevisiae strain producing 49.3 mM MA through enhanced aromatic amino acid biosynthesis [20]. These results underscore the effectiveness of integrating systematic metabolic flux redirection and competitive pathway inhibition strategies for achieving high-level production of MA. Collectively, these findings demonstrate the potential of our engineered E. coli strain for large-scale industrial production of MA, while highlighting opportunities for further improvements through refined fermentation conditions and dynamic metabolic control strategies.
To further improve carbon utilization efficiency, it is necessary to consider redirecting overflow metabolites such as acetate, which can act as a potential competing carbon sink, especially under high-cell-density fermentation conditions. Given that the current MA titer has not yet reached the threshold at which byproduct formation becomes a major limiting factor, our work has primarily focused on enhancing the MA biosynthetic pathway. However, as production scales up and titers continue to increase, implementing additional strategies to minimize carbon loss will be essential for further improving product yield.

4. Conclusions

In this study, we successfully enhanced the biosynthesis of MA in E. coli through a systematic metabolic engineering approach. Initially, we screened and evaluated multiple HMAS homologs for their catalytic efficiency and identified HMAS3 as the optimal enzyme for facilitating the conversion of PP to MA. By heterologously expressing HMAS3 and optimizing endogenous metabolic pathways, we significantly improved MA production. The combinatorial overexpression of key genes effectively increased PP precursor availability and redirected metabolic flux toward MA biosynthesis. Additionally, the implementation of CRISPRi to repress competing metabolic pathways further optimized carbon flux distribution, leading to a substantial enhancement in the MA titer. In a 5 L bioreactor fermentation, our engineered strain achieved an MA titer of 9.58 g/L, representing a significant improvement over previously reported microbial production systems. These findings demonstrate that a comprehensive metabolic engineering strategy—integrating enzyme screening, metabolic flux optimization, and targeted gene regulation—can effectively enhance microbial MA biosynthesis. This study provides a solid foundation for the industrial-scale production of MA and offers valuable insights for the microbial synthesis of other high-value organic acids.

Supplementary Materials

The following supporting information can be downloaded at: https://www.mdpi.com/article/10.3390/fermentation11060331/s1, Figure S1. Protein expression analysis of HMAS1–HMAS6; Table S1. Genotypes and construction background of engineered E. coli strains; Table S2: Amino acid sequences of genes used in this study; Table S3: MA production from PP by whole-cell biocatalysis expressing HMAS1–HMAS6; Table S4: Effects of individual and combined gene overexpression on MA production; Table S5: sgRNA spacer sequences used for CRISPRi-mediated gene interference; Table S6: Effects of CRISPRi-mediated gene interference on MA production; Table S7: Time-course data of cell growth and MA production during HCDC.

Author Contributions

Conceptualization, C.L., X.X., G.C. and P.W.; data curation, C.L., R.N. and W.X.; formal analysis, C.L. and W.X.; funding acquisition, P.W.; investigation, C.L., R.N. and X.X.; methodology, C.L., X.X., W.X. and P.W.; project administration, C.L. and P.W.; resources, G.C. and P.W.; supervision, C.L., G.C. and P.W.; validation, C.L., X.X., W.X. and Y.S.; visualization, C.L.; writing—original draft, C.L. and X.X.; writing—review and editing, C.L., W.X. and P.W. All authors have read and agreed to the published version of the manuscript.

Funding

This work was supported by the Fund for High-Efficiency Tryptophan Synthesis Technology Development (Project No. 432244006), Heilongjiang Provincial Special Funds for High-Level Universities and Characteristic Disciplines (Project No. 41502003), the National Natural Science Foundation of China (Project No. 31900064), and Fundamental Research Funds for the Central Universities (Project No. 2572022BD03).

Institutional Review Board Statement

Not applicable.

Informed Consent Statement

Not applicable.

Data Availability Statement

The data presented in this study are available in the Supplementary Materials.

Acknowledgments

We sincerely thank the support from the research laboratories and faculty members of the College of Life Science, NEFU. During the preparation of this manuscript, the authors used ChatGPT (OpenAI, GPT-4, February–April 2025 version) for English language editing and grammatical refinement. The authors have reviewed and revised the content and take full responsibility for the final manuscript.

Conflicts of Interest

Author Guoqiang Cao was employed by the company Xiangbai Biotechnology Co., Ltd. The authors declare that the research was conducted in the absence of any commercial or financial relationships that could be construed as a potential conflict of interest.

Abbreviations

The following abbreviations are used in this manuscript:
MAmandelic acid
HMAShydroxymandelate synthase
E4Perythrose-4-phosphate
PEPphosphoenolpyruvate
CRISPRiCRISPR interference
HCDChigh-cell-density cultivation
MOFsmetal–organic frameworks
CPscoordination polymers
NHasenitrile hydratases
ManDHD-mandelate dehydrogenase
PPphenylpyruvate
PGAphenylglyoxylic acid
E. coliEscherichia coli
S. cerevisiaeSaccharomyces cerevisiae
EFI-ESTEnzyme Function Initiative–Enzyme Similarity Tool
SSNsequence similarity network
PPPpentose phosphate pathway
L-TyrL-tyrosine
L-TrpL-tryptophan

References

  1. Reddy, K.L.; Mathew, J.P.; Maniappan, S.; Tom, C.; Shiby, E.; Pujala, R.K.; Kumar, J. Mandelic acid appended chiral gels as efficient templates for multicolour circularly polarized luminescence. Nanoscale 2022, 14, 4946–4956. [Google Scholar] [CrossRef] [PubMed]
  2. Wang, Q.; Geng, S.; Wang, L.; Wen, Z.; Sun, X.; Huang, H. Bacterial mandelic acid degradation pathway and its application in biotechnology. J. Appl. Microbiol. 2022, 133, 273–286. [Google Scholar] [CrossRef]
  3. Wójcik, A.; Kubiak, M.; Rotsztejn, H. Influence of azelaic and mandelic acid peels on sebum secretion in ageing women. Adv. Dermatol. Allergol. 2013, 3, 140–145. [Google Scholar] [CrossRef]
  4. Van Putten, P.L. Mandelic acid and urinary tract infections. Antonie Leeuwenhoek 1979, 45, 622–623. [Google Scholar] [CrossRef]
  5. Świsłocka, R.; Świderski, G.; Nasiłowska, J.; Sokołowska, B.; Wojtczak, A.; Lewandowski, W. Research on the electron structure and antimicrobial properties of mandelic acid and its alkali metal salts. Int. J. Mol. Sci. 2023, 24, 3078. [Google Scholar] [CrossRef]
  6. Poterała, M.; Dranka, M.; Borowiecki, P. Chemoenzymatic preparation of enantiomerically enriched (R)-(–)-Mandelic acid derivatives: Application in the synthesis of the active agent pemoline. Eur. J. Org. Chem. 2017, 2017, 2290–2304. [Google Scholar] [CrossRef]
  7. Xia, M.; Yang, M.; Wang, Y.; Tian, F.; Hu, J.; Yang, W.; Tao, S.; Lu, L.; Ding, X.; Jiang, S.; et al. dl-Mandelic acid exhibits high sperm-immobilizing activity and low vaginal irritation: A potential non-surfactant spermicide for contraception. Biomed. Pharmacother. 2020, 126, 110104. [Google Scholar] [CrossRef] [PubMed]
  8. Dulęba, J.; Siódmiak, T.; Mastalerz, R.; Kocot, N.; Dębińska, A.; Suchomska, E.; Czeczka, M.; Cała, K.; Marszałł, M. The application of lipase from Burkholderia cepacia in the enantioselective pharmaceutical biocatalysis. Farm. Pol. 2022, 78, 194–200. [Google Scholar] [CrossRef] [PubMed]
  9. Jacobs, S.; Culbertson, E. Effects of topical mandelic acid treatment on facial skin viscoelasticity. Facial Plast. Surg. 2018, 34, 651–656. [Google Scholar] [CrossRef]
  10. Cai, P.; Gao, Z.; Yin, X.; Luo, Y.; Zhao, X.; Pan, Y. Facile enantioseparation and recognition of mandelic acid and its derivatives in self-assembly interaction with chiral ionic liquids. J. Sep. Sci. 2019, 42, 3589–3598. [Google Scholar] [CrossRef]
  11. Tay, H.M.; Hua, C. A structural study into halogenated derivatives of mandelic acid as building blocks of chiral coordination polymers. J. Coord. Chem. 2022, 75, 1656–1669. [Google Scholar] [CrossRef]
  12. Martínková, L.; Křen, V. Biocatalytic production of mandelic acid and analogues: A review and comparison with chemical processes. Appl. Microbiol. Biotechnol. 2018, 102, 3893–3900. [Google Scholar] [CrossRef] [PubMed]
  13. Monteith, J.J.; Rousseaux, S.A.L. A Dual Ni/Photoredox Cross-Coupling Approach toward Mandelic Acids. Org. Lett. 2024, 26, 4566–4570. [Google Scholar] [CrossRef]
  14. Singh, R.V.; Sambyal, K. Green synthesis aspects of (R)-(–)-mandelic acid; a potent pharmaceutically active agent and its future prospects. Crit. Rev. Biotechnol. 2022, 43, 1226–1235. [Google Scholar] [CrossRef]
  15. Stolz, A.; Eppinger, E.; Sosedov, O.; Kiziak, C. Comparative Analysis of the Conversion of Mandelonitrile and 2-Phenylpropionitrile by a Large Set of Variants Generated from a Nitrilase Originating from Pseudomonas fluorescens EBC191. Molecules 2019, 24, 4232. [Google Scholar] [CrossRef] [PubMed]
  16. Cheng, Z.; Xia, Y.; Zhou, Z. Recent advances and promises in nitrile hydratase: From mechanism to industrial applications. Front. Bioeng. Biotechnol. 2020, 8, 352. [Google Scholar] [CrossRef]
  17. Li, C.; Zhang, Z.; Wang, J. A thermophilic biofunctional multienzyme cascade reaction for Cell-Free synthesis of salvianic acid A and 3,4-Dihydroxymandelic acid. ACS Sustain. Chem. Eng. 2019, 7, 18247–18253. [Google Scholar] [CrossRef]
  18. Lukito, B.R.; Wang, Z.; Sekar, B.S.; Li, Z. Production of (R)-mandelic acid from styrene, L-phenylalanine, glycerol, or glucose via cascade biotransformations. Bioresour. Bioprocess. 2021, 8, 22. [Google Scholar] [CrossRef]
  19. Li, M.; Zhang, L.; Wu, B.; Hong, M. High-Enantioselectivity adsorption separation of racemic mandelic acid and methyl mandelate by robust Chiral UIO-68-Type ZR-MOFS. Inorg. Chem. 2023, 63, 381–389. [Google Scholar] [CrossRef]
  20. Reifenrath, M.; Boles, E. Engineering of hydroxymandelate synthases and the aromatic amino acid pathway enables de novo biosynthesis of mandelic and 4-hydroxymandelic acid with Saccharomyces cerevisiae. Metab. Eng. 2018, 45, 246–254. [Google Scholar] [CrossRef]
  21. Gibson, D.G.; Young, L.; Chuang, R.; Venter, J.C.; Hutchison, C.A.; Smith, H.O. Enzymatic assembly of DNA molecules up to several hundred kilobases. Nat. Methods 2009, 6, 343–345. [Google Scholar] [CrossRef] [PubMed]
  22. Bergmans, H.E.; Van Die, I.M.; Hoekstra, W.P. Transformation in Escherichia coli: Stages in the process. J. Bacteriol. 1981, 146, 564–570. [Google Scholar] [CrossRef] [PubMed]
  23. Zallot, R.; Oberg, N.; Gerlt, J.A. The EFI web resource for Genomic Enzymology tools: Leveraging protein, genome, and metagenome databases to discover novel enzymes and metabolic pathways. Biochemistry 2019, 58, 4169–4182. [Google Scholar] [CrossRef] [PubMed]
  24. Oberg, N.; Zallot, R.; Gerlt, J.A. EFI-EST, EFI-GNT, and EFI-CGFP: Enzyme Function Initiative (EFI) web resource for genomic enzymology tools. J. Mol. Biol. 2023, 435, 168018. [Google Scholar] [CrossRef]
  25. Gerlt, J.A.; Bouvier, J.T.; Davidson, D.B.; Imker, H.J.; Sadkhin, B.; Slater, D.R.; Whalen, K.L. Enzyme Function Initiative-Enzyme Similarity Tool (EFI-EST): A web tool for generating protein sequence similarity networks. BBA Proteins Proteom. 2015, 1854, 1019–1037. [Google Scholar] [CrossRef]
  26. Shannon, P.; Markiel, A.; Ozier, O.; Baliga, N.S.; Wang, J.T.; Ramage, D.; Amin, N.; Schwikowski, B.; Ideker, T. Cytoscape: A software environment for integrated models of biomolecular interaction networks. Genome Res. 2003, 13, 2498–2504. [Google Scholar] [CrossRef]
  27. Laemmli, U.K. Cleavage of Structural Proteins during the Assembly of the Head of Bacteriophage T4. Nature 1970, 227, 680–685. [Google Scholar] [CrossRef]
  28. Zhang, R.; Xu, W.; Shao, S.; Wang, Q. Gene silencing through CRISPR interference in bacteria: Current advances and future prospects. Front. Microbiol. 2021, 12, 635227. [Google Scholar] [CrossRef]
  29. Hawkins, J.S.; Wong, S.; Peters, J.M.; Almeida, R.; Qi, L.S. Targeted Transcriptional Repression in Bacteria Using CRISPR Interference (CRISPRI); Methods in Molecular Biology; Humana Press: New York, NY, USA, 2015; pp. 349–362. [Google Scholar] [CrossRef]
  30. Blin, K.; Pedersen, L.E.; Weber, T.; Lee, S.Y. CRISPy-web: An online resource to design sgRNAs for CRISPR applications. Synth. Syst. Biotechnol. 2016, 1, 118–121. [Google Scholar] [CrossRef]
  31. Müller, U.; Van Assema, F.; Gunsior, M.; Orf, S.; Kremer, S.; Schipper, D.; Wagemans, A.; Townsend, C.A.; Sonke, T.; Bovenberg, R.; et al. Metabolic engineering of the E. coli l-phenylalanine pathway for the production of d-phenylglycine (d-Phg). Metab. Eng. 2006, 8, 196–208. [Google Scholar] [CrossRef]
  32. Liu, P.; Jin, Q.; Li, X.; Zhang, R.; Yuan, H.; Liu, C.; Wang, P. Directed evolution and metabolic engineering generate an Escherichia coli cell factory for de novo production of 4-hydroxymandelate. Bioresour. Technol. 2024, 413, 131497. [Google Scholar] [CrossRef] [PubMed]
  33. Larson, M.H.; Gilbert, L.A.; Wang, X.; Lim, W.A.; Weissman, J.S.; Qi, L.S. CRISPR interference (CRISPRi) for sequence-specific control of gene expression. Nat. Protoc. 2013, 8, 2180–2196. [Google Scholar] [CrossRef]
  34. Zheng, Y.; Su, T.; Qi, Q. Microbial CRISPRI and CRISPRA systems for metabolic engineering. Biotechnol. Bioprocess Eng. 2019, 24, 579–591. [Google Scholar] [CrossRef]
  35. Gordon, G.C.; Korosh, T.C.; Cameron, J.C.; Markley, A.L.; Begemann, M.B.; Pfleger, B.F. CRISPR interference as a titratable, trans-acting regulatory tool for metabolic engineering in the cyanobacterium Synechococcus sp. strain PCC 7002. Metab. Eng. 2016, 38, 170–179. [Google Scholar] [CrossRef]
  36. Meza, E.; Becker, J.; Bolivar, F.; Gosset, G.; Wittmann, C. Consequences of phosphoenolpyruvate: Sugar phosphotranferase system and pyruvate kinase isozymes inactivation in central carbon metabolism flux distribution in Escherichia coli. Microb. Cell Factories 2012, 11, 127. [Google Scholar] [CrossRef]
  37. Zhao, C.; Lin, Z.; Dong, H.; Zhang, Y.; Li, Y. Reexamination of the Physiological Role of PykA in Escherichia coli Revealed that It Negatively Regulates the Intracellular ATP Levels under Anaerobic Conditions. Appl. Environ. Microbiol. 2017, 83, e00316-17. [Google Scholar] [CrossRef] [PubMed]
  38. Deng, Z.; Liu, Z.; He, J.; Wang, J.; Yan, Y.; Wang, X.; Cui, Y.; Bi, Y.; Du, Z.; Song, Y.; et al. TyrR, the regulator of aromatic amino acid metabolism, is required for mice infection of Yersinia pestis. Front. Microbiol. 2015, 6, 110. [Google Scholar] [CrossRef]
  39. Coulson, T.J.D.; Patten, C.L. The TyrR Transcription Factor Regulates the Divergent akr-ipdC Operons of Enterobacter cloacae UW5. PLoS ONE 2015, 10, e0121241. [Google Scholar] [CrossRef]
  40. Cho, B.; Federowicz, S.; Park, Y.; Zengler, K.; Palsson, B.Ø. Deciphering the transcriptional regulatory logic of amino acid metabolism. Nat. Chem. Biol. 2011, 8, 65–71. [Google Scholar] [CrossRef]
  41. Bashiri, G.; Johnston, J.M.; Evans, G.L.; Bulloch, E.M.M.; Goldstone, D.C.; Jirgis, E.N.M.; Kleinboelting, S.; Castell, A.; Ramsay, R.J.; Manos-Turvey, A.; et al. Structure and inhibition of subunit I of the anthranilate synthase complex of Mycobacterium tuberculosis and expression of the active complex. Acta Crystallogr. Sect. D Biol. Crystallogr. 2015, 71, 2297–2308. [Google Scholar] [CrossRef]
  42. Lynch, J.H.; Dudareva, N. Aromatic amino acids: A complex network ripe for future exploration. Trends Plant Sci. 2020, 25, 670–681. [Google Scholar] [CrossRef] [PubMed]
  43. Kim, S.C.; Min, B.E.; Hwang, H.G.; Seo, S.W.; Jung, G.Y. Pathway optimization by re-design of untranslated regions for L-tyrosine production in Escherichia coli. Sci. Rep. 2015, 5, srep13853. [Google Scholar] [CrossRef]
  44. Revelles, O.; Millard, P.; Nougayrède, J.; Dobrindt, U.; Oswald, E.; Létisse, F.; Portais, J. The Carbon Storage Regulator (Csr) System Exerts a Nutrient-Specific Control over Central Metabolism in Escherichia coli Strain Nissle 1917. PLoS ONE 2013, 8, e66386. [Google Scholar] [CrossRef] [PubMed]
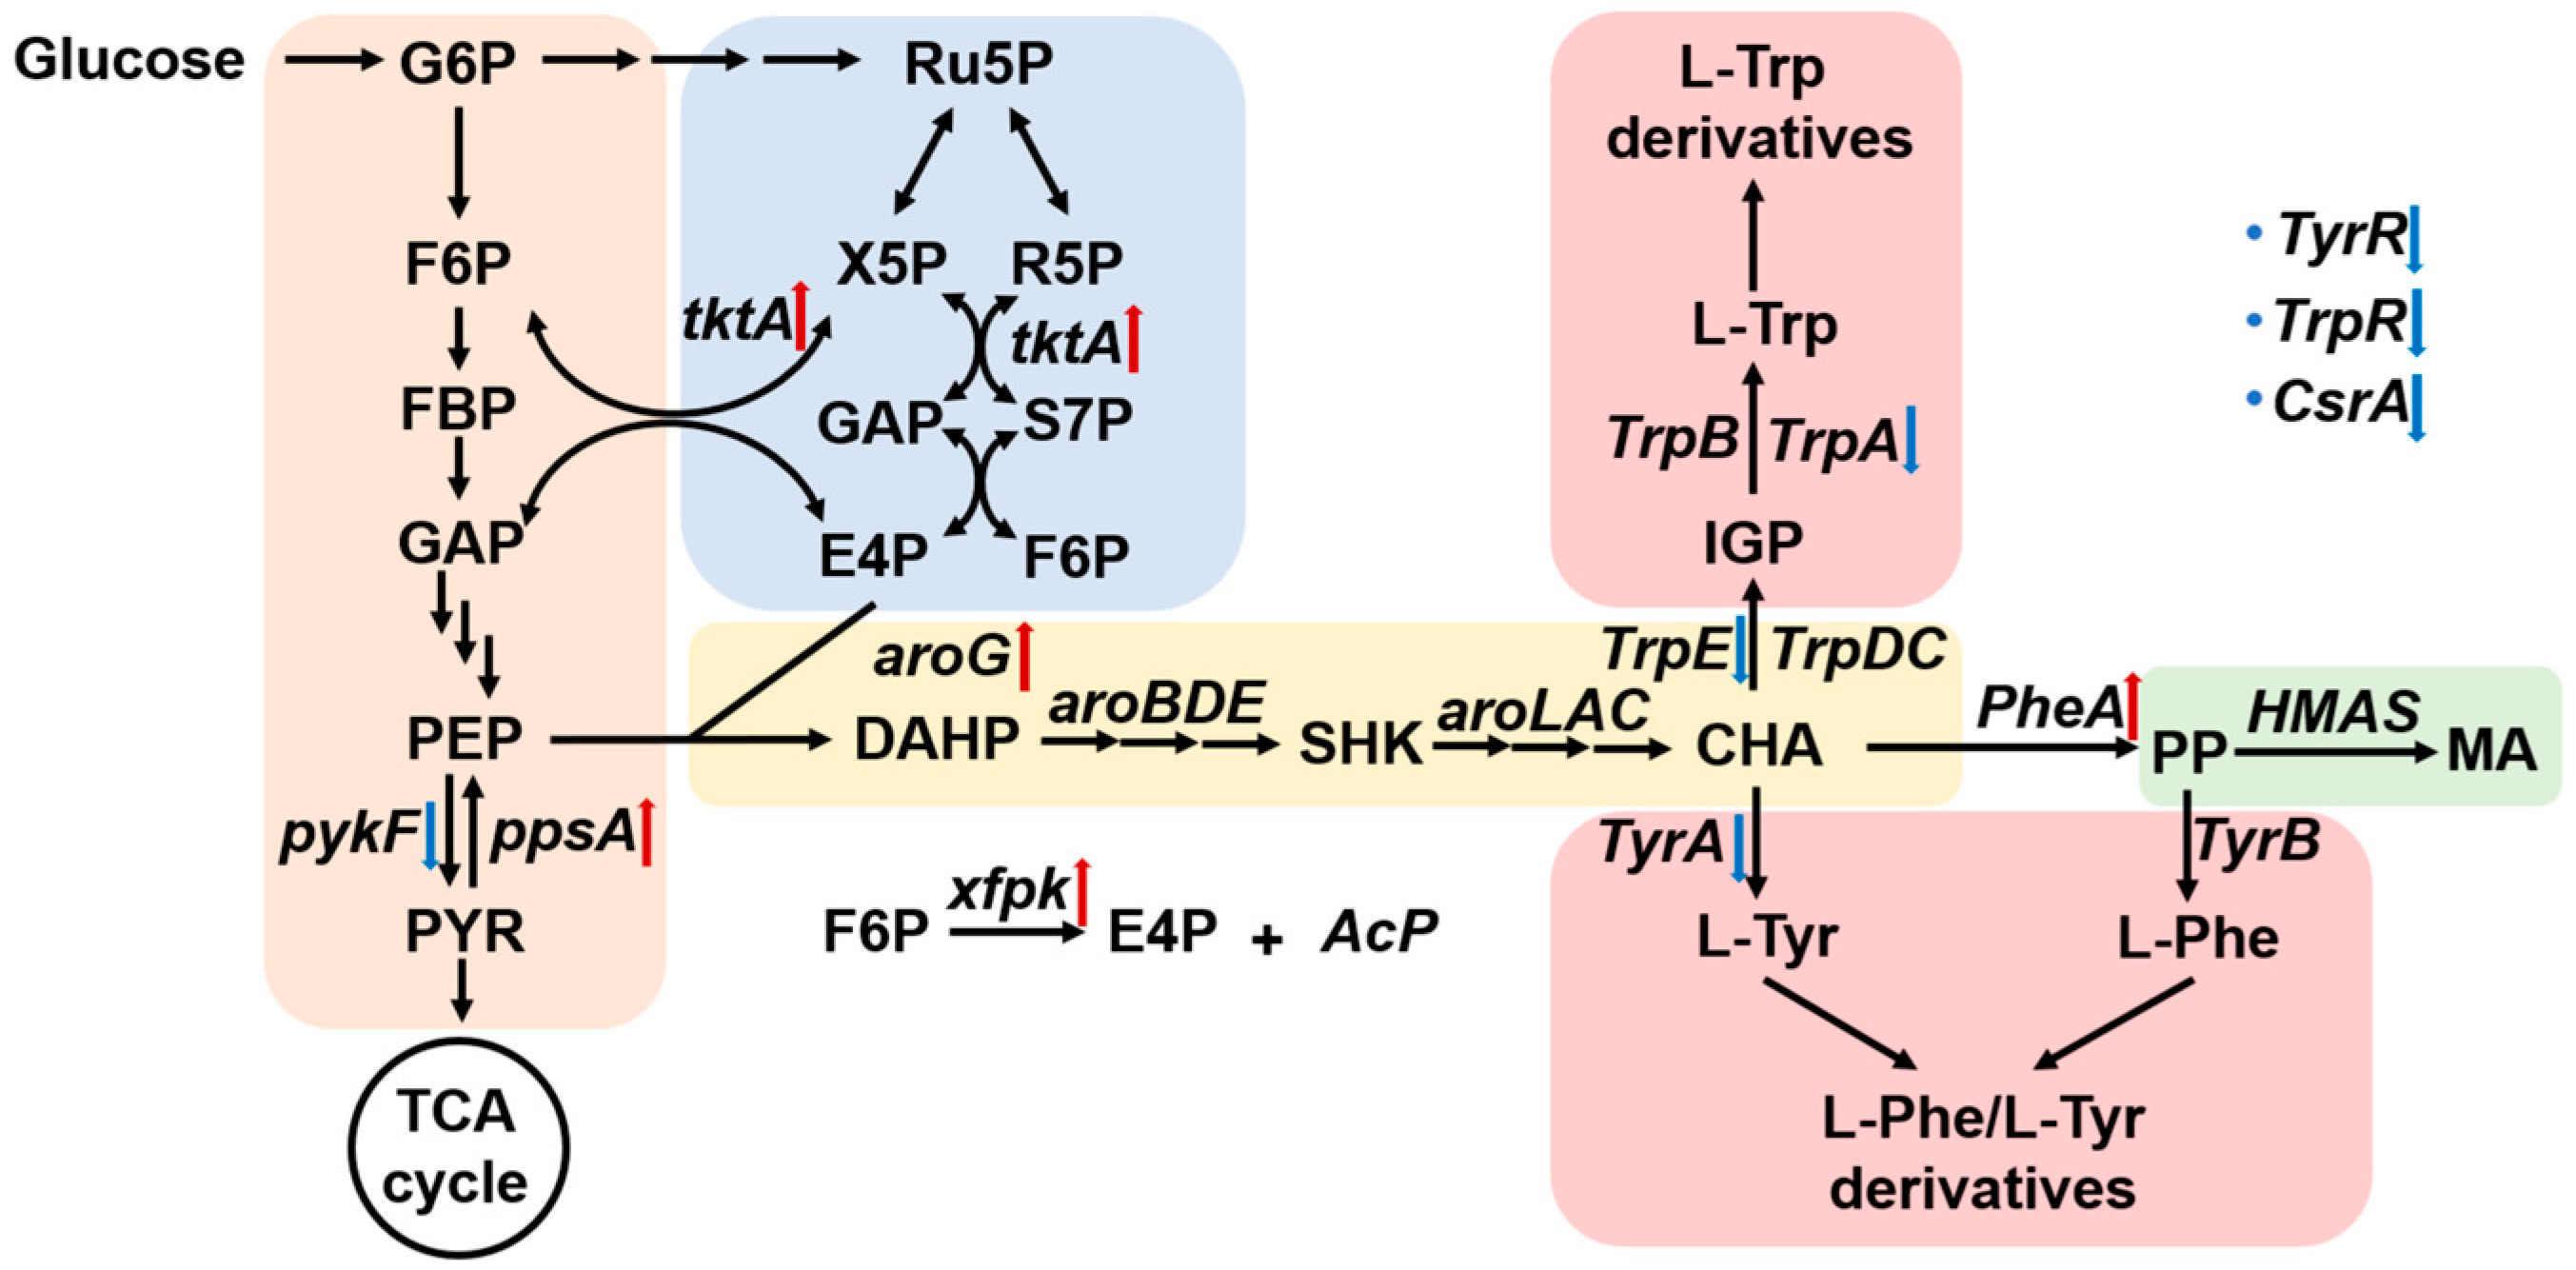
Figure 1. Metabolic engineering strategies for de novo biosynthesis of MA. Schematic representation of the engineered metabolic pathway for MA production from glucose. Red arrows indicate enhanced gene expression, while blue arrows represent downregulated genes. The orange section represents the glycolytic pathway, which provides precursors for central metabolism. The yellow section corresponds to the shikimate pathway, which plays a crucial role in aromatic amino acid biosynthesis. The blue section represents the pentose phosphate pathway (PPP), supplying essential precursors for aromatic compound formation. The pink section includes the L-tyrosine (L-Tyr) and L-tryptophan (L-Trp) biosynthesis pathways, which compete with MA biosynthesis. The green section highlights the final conversion of PP to MA catalyzed by HMAS.
Fermentation 11 00331 g001
Figure 2. SSN, catalytic activity, and protein expression analysis of HMAS homologs. (A) SSN constructed using EFI-EST based on HMAS1 and its homologous sequences. All homologous sequences were retrieved from UniProt and other public databases. Different node colors represent different taxonomic groups of HMAS enzymes: the green cluster (HMAS1–HMAS3) and the pink cluster (HMAS4) belong to Actinobacteria, while the blue cluster (HMAS5–HMAS6) belongs to Proteobacteria. The thickness of the connecting edges indicates the degree of sequence similarity. (B) Whole-cell catalytic performance of MA01–MA06 strains expressing HMAS1–HMAS6 in the conversion of PP to MA.
Fermentation 11 00331 g002
Figure 3. Overexpression of key endogenous genes and its impact on MA production. (A) Schematic representation of the expression constructs used for the overexpression of key metabolic genes in E. coli harboring heterologous expression of HMAS3. All genes were placed under the control of the PBAD promoter, ensuring inducible expression in the presence of L-arabinose. Individual overexpression strains were constructed for AroGfbr,PheAfbr, Xfpk, TktA, and PpsA, as well as two combinatorial overexpression strategies (AroGfbr + PheAfbr and AroGfbr + PheAfbr + Xfpk). (B) Changes in MA production upon overexpression of different genes. All strains heterologously expressed HMAS3 and were subjected to whole-cell biocatalysis assays using 10 g/L glucose as the carbon source, with MA titer quantified. The control strain expressed HMAS3 alone without additional overexpression of metabolic genes.
Fermentation 11 00331 g003
Figure 4. CRISPRi-mediated repression of competing pathways to enhance MA production. (A) Schematic diagram of the CRISPRi strategy. A CRISPRi system utilizing dCas9 protein was constructed in strains harboring heterologous expression of HMAS3 and overexpression of key endogenous genes (AroGfbr + PheAfbr + Xfpk). Specific sgRNAs were designed to target and repress endogenous genes involved in competing metabolic pathways. (B) Effect of CRISPRi-mediated gene repression on MA production. All engineered strains were evaluated by whole-cell biocatalysis assays using 10 g/L glucose as the carbon source. The Control represents strains without CRISPRi repression. Statistical significance: ns, no significant difference; * p < 0.05, ** p < 0.01, **** p < 0.0001. Data represent means ± SD (n = 3).
Fermentation 11 00331 g004
Figure 5. HCDC and MA production by the engineered strain in a 5 L bioreactor. (A) Photograph illustrating the fermentation of the engineered E. coli strain in a 5 L bioreactor. (B) Time-course profiles of cell growth OD600 and MA production during fermentation. Cultivation was initiated at 37 °C for rapid biomass accumulation. After 16 h, when the OD600 exceeded 30, the temperature was reduced to 30 °C, and gene expression was induced by adding sterile arabinose (final concentration 0.2%) and IPTG (final concentration 1 mM).
Fermentation 11 00331 g005
Disclaimer/Publisher’s Note: The statements, opinions and data contained in all publications are solely those of the individual author(s) and contributor(s) and not of MDPI and/or the editor(s). MDPI and/or the editor(s) disclaim responsibility for any injury to people or property resulting from any ideas, methods, instructions or products referred to in the content.