Article

Application of Transcriptome Analysis for the Exploration of the Mechanism of Methionine Promoting the Synthesis of Cephalosporin C in Acremonium chrysogenum by Employing a Chemically Defined Medium

1
State Key Laboratory of Bioreactor Engineering, Qingdao Innovation Institute, East China University of Science and Technology, Shanghai 200237, China
2
Sinopharm Weiqida Pharmaceutical Co., Ltd., Datong 037000, China
*
Authors to whom correspondence should be addressed.
Fermentation 2025, 11(6), 325; https://doi.org/10.3390/fermentation11060325
Submission received: 19 April 2025 / Revised: 2 June 2025 / Accepted: 4 June 2025 / Published: 6 June 2025

Abstract

To better analyze the biosynthesis mechanism of cephalosporin C (CPC) in Acremonium chrysogenum, single-factor omission experiments and Plackett–Burman (PB) experimental design were employed to identify key components in the chemically defined medium. Response surface methodology (RSM) was then applied to optimize the concentrations of critical factors, achieving a final CPC titer of 4.70 g/L, which reached 59.54% of the titer obtained with complex medium. Methionine was identified as the most significant amino acid influencing CPC production during medium optimization. On the basis of these findings, transcriptomic analysis was conducted to elucidate the regulatory role of methionine. The results revealed that methionine enhances CPC biosynthesis by upregulating cysteine metabolism-related genes and activating primary metabolic pathways to supply precursors and energy for secondary metabolism. Additionally, methionine promoted hyphal swelling and arthrospore formation, leading to the upregulated expression of genes in CPC biosynthetic gene clusters. By integrating medium optimization with transcriptomic analysis, we provided more reliable insights into the regulatory role of methionine in A. chrysogenum growth and CPC biosynthesis using a chemically defined medium, offering valuable guidance for fermentation process optimization and subsequent metabolic engineering strategies.

1. Introduction

As a cornerstone of β-lactam antibiotics, cephalosporins dominated 26.8–27.3% of the global anti-infective drug market, valued at USD 11.96–12.12 billion in 2024 with 5.5–6.1% annual growth [1,2]. Cephalosporin C (CPC), the critical precursor for cephalosporin antibiotics, holds strategic importance in pharmaceutical innovation. Recent studies on Acremonium chrysogenum (A. chrysogenum) have expanded CPC applications beyond antibiotics to molecular imaging and targeted therapies [3,4,5]. Although Saccharomyces cerevisiae achieved de novo CPC biosynthesis experimentally [6], A. chrysogenum remains the industrial production strain due to its optimized metabolic network. This network integrated L-cysteine (from reverse sulfur pathway), L-valine, and L-α-aminoadipic acid, processed sequentially using CPC synthase enzymes (expandase, hydroxylase, and acetyltransferase) [7,8].
Despite its great progress, the industrial titer of CPC (35.77 g/L [9]) lags far behind penicillin (87.65 g/L [10]). Modern optimization strategies have focused on carbon/nitrogen source engineering and chemically defined medium design. For carbon substitution, agricultural waste valorization reduced reliance on costly glucose/corn starch [11,12], while soybean oil optimized lipid metabolism [13]. Nitrogen source optimization, exemplified by ammonium sulfate to reduce methionine supplementation by 67% while achieving 33.21 g/L CPC [14], enhanced the sulfur metabolic flux. The chemically defined medium with clear components improves reproducibility and stability, enabling precise metabolic studies [15], since complex nitrogen sources like corn steep liquor introduce variability [16].
Transcriptomics has become a crucial tool in fungal research for elucidating the biosynthetic mechanisms of secondary metabolites. In A. chrysogenum, transcriptomic analysis revealed the regulatory network between methionine metabolism and CPC biosynthesis [17]. For instance, the dynamic expression of sulfur assimilation pathway genes, such as cystathionine γ-lyase (mecB), significantly impacted the supply of cysteine precursors. Additionally, the morphology of the mycelium is vital for the CPC titer. The formation of arthrospores greatly affected CPC production in A. chrysogenum [18]. Studies have shown that the addition of methionine simultaneously affects the formation of arthrospores. However, the detailed mechanisms and the relationship between morphology and titer is still unclear. Combining transcriptomics with morphological analysis can identify the gene modules associated with arthrospore formation, providing a molecular basis for optimizing mycelial morphology and metabolic balance.
In this study, we systematically optimized A. chrysogenum fermentation by replacing corn steep liquor with defined amino acids/carbon sources. Single-factor experiments identified 16 essential components, further refined via Plackett–Burman (PB) and Box–Behnken Design (BBD). DL-methionine appeared as a key regulatory factor, stimulating energy metabolism, reducing sulfate absorption, inducing joint spore differentiation, and achieving a final titer of 4.70 g/L in the chemically defined medium. These findings bridge medium optimization with systems biology, offering actionable insights for industrial CPC production and strain engineering.

2. Materials and Methods

2.1. Strains and Media

The industrial production strain FC3-5-23 was obtained from Sinopharm Weiqida Pharmaceutical Co., Ltd. (Datong, China). Ac-∆axl2::eGFP was a strain derived from FC3-5-23, in which the axl2 gene was knocked out and the eGFP fluorescent protein was expressed.
Shake flask seed medium (g/L): Corn steep liquor powder 30, DL-methionine 0.5, (NH4)2SO4 8, sucrose 35, soybean oil 5, CaCO3 5, and glucose 20. The pH was adjusted to 7.2.
Shake flask complex fermentation medium (g/L): Dextrin 30, corn starch 70, α-amylase 0.5 (v/v), KH2SO4 9, MgSO4·7H2O 6.14, soybean oil 10, DL-methionine 6, (NH4)2SO4 13, corn steep liquor powder 50, CaCO3 10, and trace elements 1% (v/v). The pH was adjusted to 6.5.
Trace elements (g/L): ZnSO4·7H2O 2, FeSO4·7H2O 8, CuSO4·5H2O 2, and MnSO4·H2O 2. The pH was adjusted to 1.0 with concentrated hydrochloric acid and stored at 4 °C for subsequent application.
Initial chemically defined medium (g/L): Glucose 10.66, maltose 29.64, DL-methionine 6, (NH4)2SO4 13, KH2SO4 9, MgSO4·7H2O 6.14, lactic acid 17.99, phytic acid 5.35, L-aspartic acid 1.98, L-threonine 0.96, L-serine 1.03, L-glutamate 3.45, L-glycine 1.25, L-alanine 2.11, L-cystine 0.43, L-valine 1.39, L-methionine 0.51, L-isoleucine 1.03, L-leucine 2.44, L-phenylalanine 1.14, L-lysine 1.13, L-histidine 0.73, L-arginine 1.26, L-proline 2.04, L-tyrosine 0.51, Biotin 0.00010, CaCO3 10, soybean oil 10, and trace elements 1% (v/v). The pH was adjusted to 6.50 and a tension spring was added to each shaking bottle. The concentrations of various substances in the initial chemically defined medium were calculated based on the main components of corn steep liquor powder and soybean oil in the complex fermentation medium (Table S1).
Corn steep liquor powder, lactic acid, dextrin, corn starch, α-amylase, biotin, and amino acids were provided by Shanghai Aladdin Biochemical Technology Co., Ltd., Shanghai, China. The reagents utilized for the configuration of trace elements were provided by Shanghai Lingfeng Chemical Reagents Co., Ltd., Shanghai, China. (NH4)2SO4, KH2SO4, MgSO4·7H2O, sucrose, glucose, and maltose were provided by Shanghai Titan Scientific Co., Ltd., Shanghai, China. Phytic acid and CaCO3 were provided by Shanghai Macklin Biochemical Co., Ltd., Shanghai, China. Soybean oil was provided by Yihai Kerry Arawana Holdings Co., Ltd., Shanghai, China.

2.2. Cultivation Methods

First, 5 mL of seed culture or two vials of preserved strain stock were transferred into the seed medium, followed by shaking incubation (incubator shaker, Zhichu Instrument, Shanghai, China) at 28 °C and 220 rpm for 72 h. Then, 5 mL of seed culture was added to the fermentation medium, maintaining initial conditions at 28 °C and 220 rpm for 72 h, after which the temperature was adjusted to 25 °C for 168 h.

2.3. Determination of CPC Titer

First, 1 mL of fermentation broth was centrifuged (high-speed refrigerated centrifuge, Thermo Fisher, New York, NY, USA) at 19,700× g for 5 min, and the supernatant was collected. The CPC concentrations were determined using high-performance liquid chromatography (HPLC, Agilent, Santa Clara, CA, USA). A calibration curve was constructed using CPC standards at concentrations of 0.2, 0.4, 0.6, 0.8, and 1.0 g/L. The supernatant from the fermentation samples was diluted within the linear range of the calibration curve, filtered through a 0.22 μm aqueous filter, and injected into HPLC analysis. The mobile phase was prepared by mixing 100 mL of acetonitrile (Aladdin, Shanghai, China), 1900 mL of ultrapure water, and 4.94 g of NaH2PO4 (Titan Scientific, Shanghai, China), followed by stirring until fully homogenized. The solution was then filtered through a 0.45 μm organic-phase filter membrane under vacuum and subjected to ultrasonic treatment for 30 min to remove bubbles. The mobile phase should be used immediately after preparation.
Chromatographic analysis was performed on an Elite E3614849 C18 column (4.6 × 150 mm, 5 μm, Elite, Dalian, China) under the following conditions: flow rate of 1 mL/min, detection wavelength of 254 nm, column temperature of 50 °C, injection volume of 10 μL, and a total run time of 15 min.

2.4. Data Analysis Method

In the process of medium concentration optimization, Design-Expert 13.0 was used to calculate the data. The main evaluation criteria were calculated as follows.
The p-value is used for significance testing. In the PB experiment of this study, the p-value was employed to assess the validity of the model, evaluate the independent effects of individual factors, and screen key substances influencing the CPC titer. In the BBD experiment, the p-value combined with the “lack of fit” was utilized to determine the model fitness, while also assessing the significance of linear terms, interaction terms, and quadratic terms.
The standardized effect is the t statistic, obtained by dividing the main effect by its standard error.
S t a n d a r d i z e d   E f f e c t = β j M S E n   .
where βj denotes the factor main effect (regression coefficient) calculated using the linear regression model; MSE refers to the mean square of error, which is obtained via ANOVA decomposition and reflects the variance of experimental error; and n is the number of experimental replicates or the effective sample size in the design matrix.
Contribution represented the relative contribution of a single factor to the total variation.
C o n t r i b u t i o n   ( % ) = ( S S j / f j S S t o t a l / f e ) × 100
where SSj refers to the sum of squares; fj represents the degree of freedom of the factor; SStotal is the sum of squares of the total deviations; and fe is the error degrees of freedom (total degrees of freedom minus model degrees of freedom). The standardized effects and contribution were used to analyze the impact of different factors on the titer of this component in PB experiments, and were the evaluation criteria for optimizing the concentration of the culture medium.
The coefficient estimate in BBD was calculated using the regression model, and was used to quantify the influence intensity of each factor and its interaction term on the response values. In the BBD of this study, the coefficient estimate was used to describe the quantitative impact of linear terms, interaction terms, and quadratic terms in the model on the response values (CPC).

2.5. Transcriptome Sequencing

Fermentation samples (1 mL) grown in the chemically defined medium were transferred to 2 mL sterile EP tubes and centrifuged at 19,700× g (0 °C) for 5 min. The supernatant was removed and stored at −20 °C. The cell pellet was washed 2–3 times with sterile DEPC-treated water, with residual liquid removed after the final wash. The pellet was flash-frozen in liquid nitrogen for 2–3 h and subsequently stored at −80 °C.
All samples were sequenced by Tsingke Biotechnology Co., Ltd. (Beijing, China) using the Illumina platform. The reference genome was A. chrysogenum ATCC 11550 (Taxonomy ID: 857340; genome assembly: GCA_000769265.1, available at NCBI Genome). Sample analysis names and comparative groups for differential expression analysis are detailed in Table S2.

3. Results

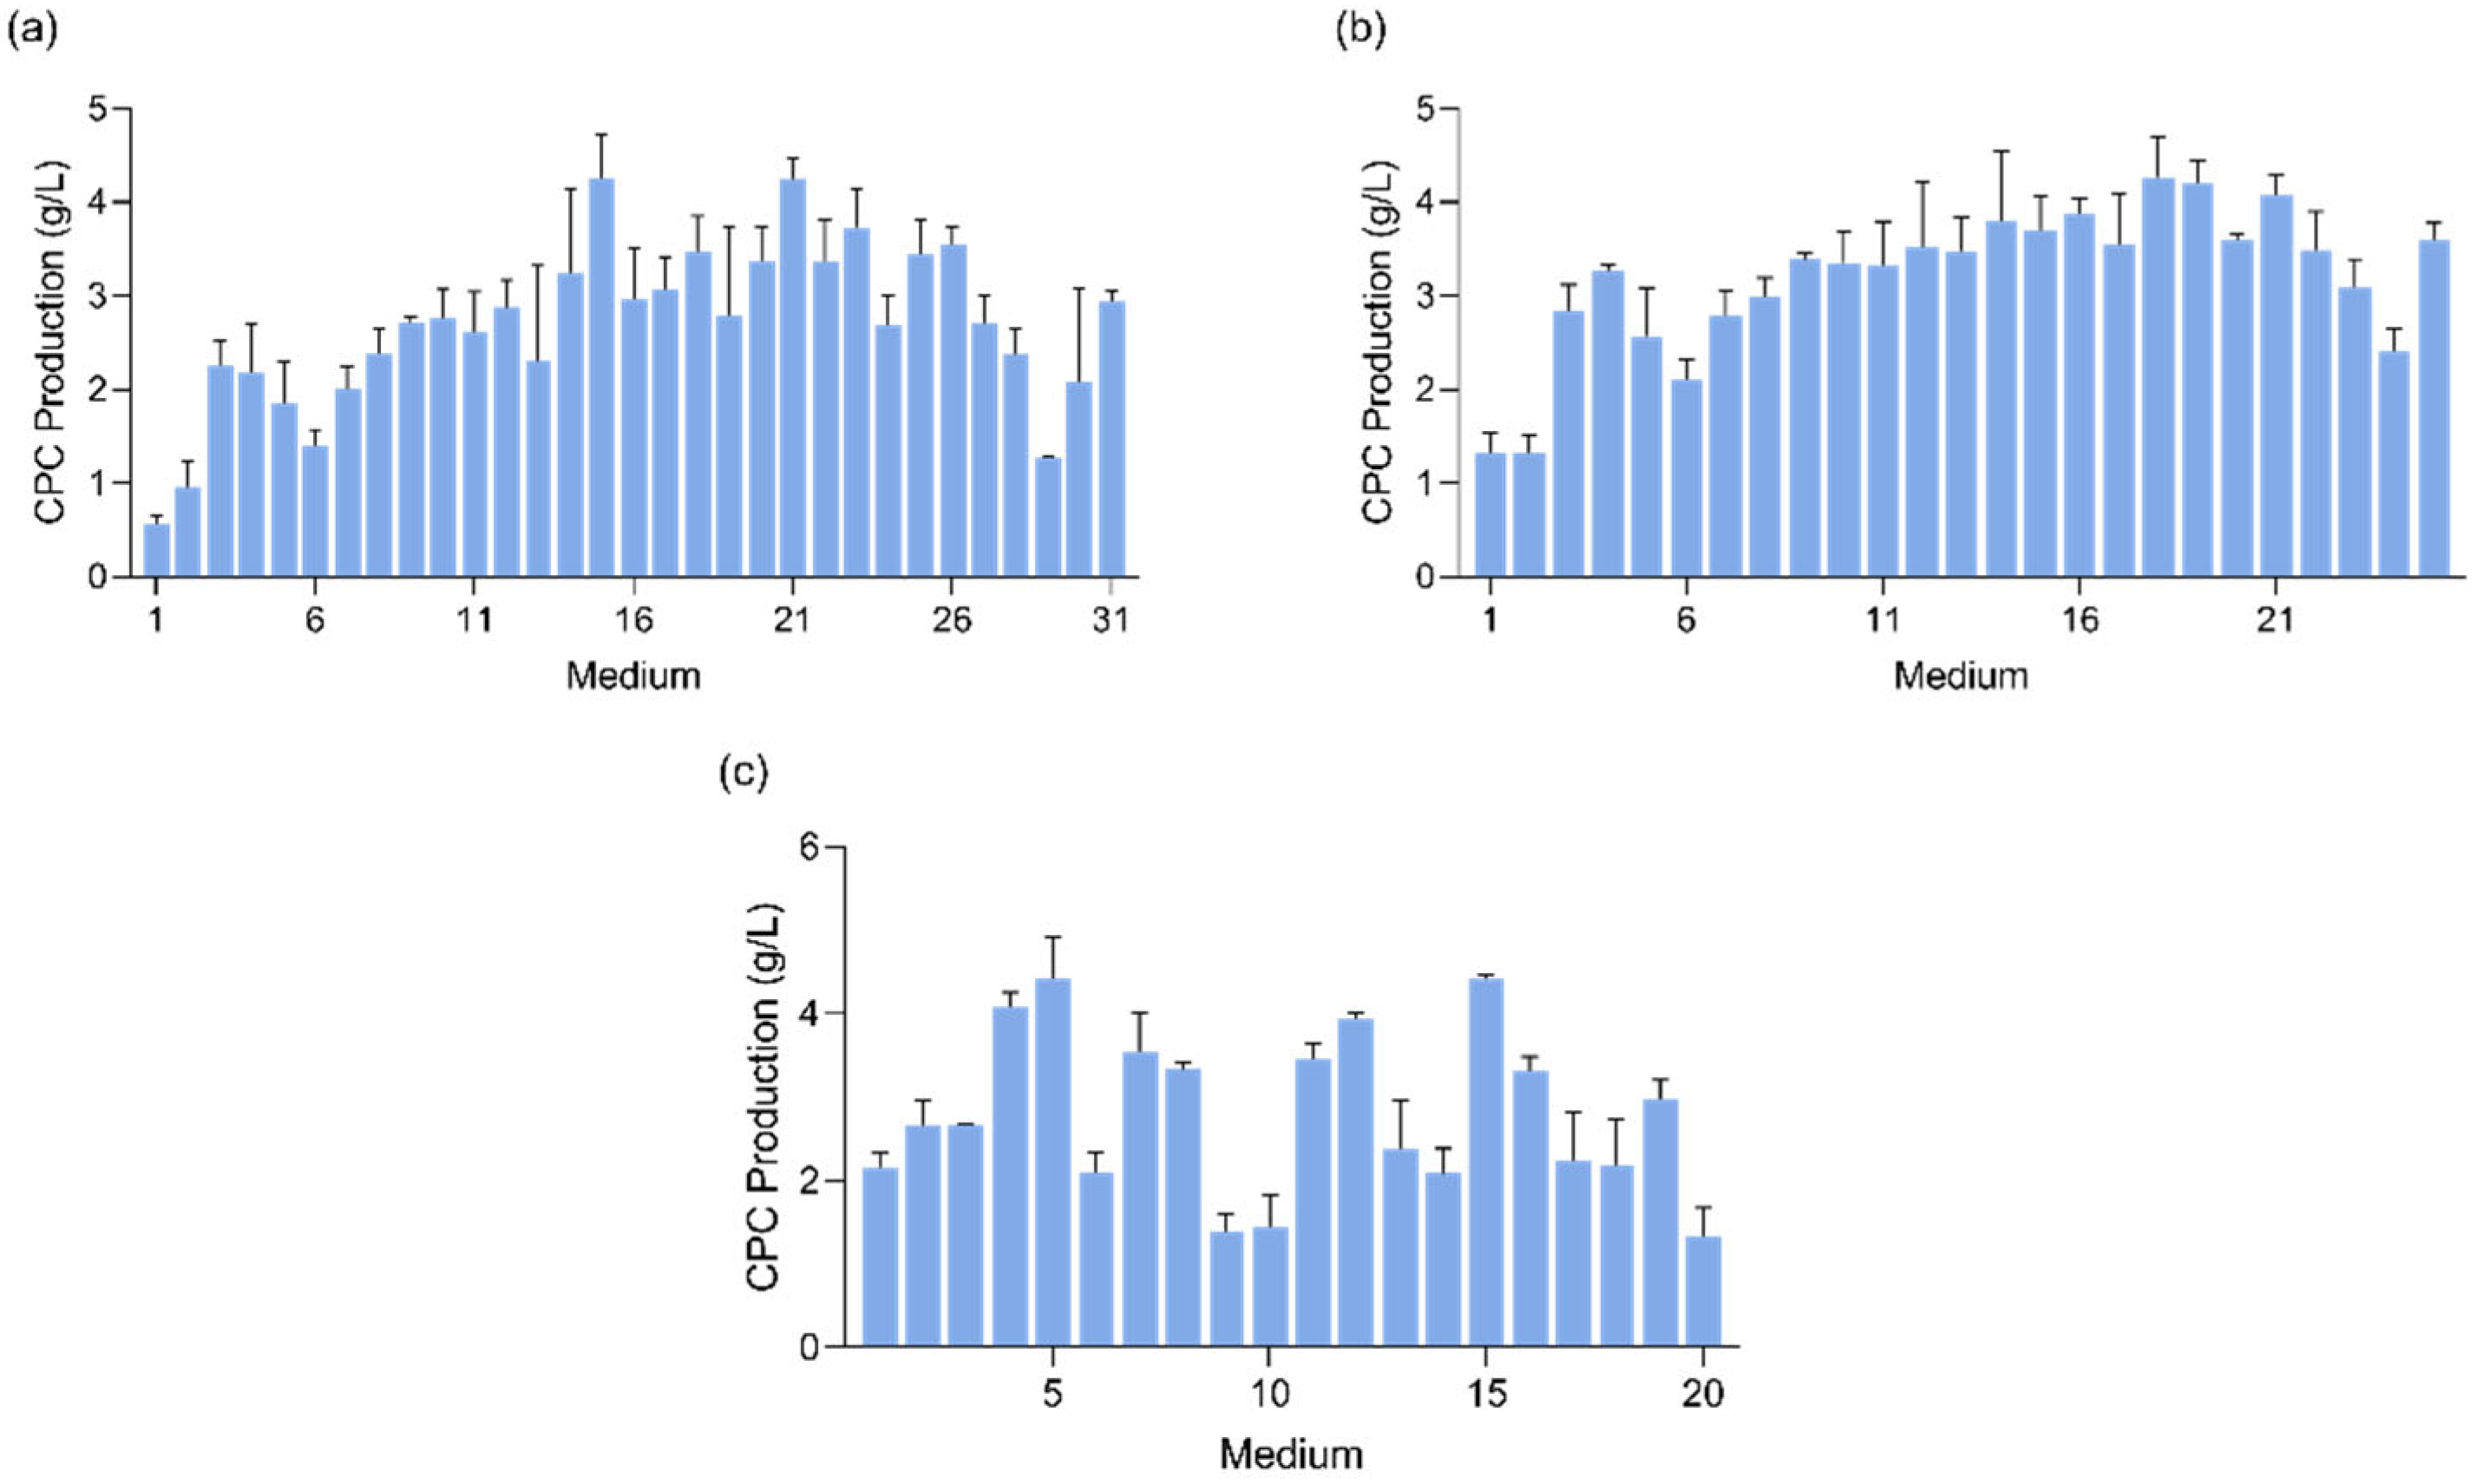
3.1. Single-Factor Omission Experiment

The initial formulations of the chemically defined medium were all derived from the complex medium, with substances in the complex medium replaced on an equal-quantity basis. The major natural components in the complex medium were replaced by their constituent components: the concentration of glucose and maltose was determined by detecting the content of the saccharification solution obtained by saccharifying dextrin and corn starch in the complex medium. Lactic acid, phytic acid, biotin, and various amino acids were major components of corn steep liquor and were calculated according to their proportions in corn steep liquor. All other substances, being chemically defined components, were added in equal amounts.
To optimize the initial medium, the single-factor omission experiment was first used to screen the essential substances in the medium. The single-factor omission method identified essential nutrients for A. chrysogenum growth and CPC biosynthesis by systematically comparing the CPC titer between a complete medium (containing all 30 selected nutrients) and 30 modified media, each lacking one specific component. Based on fundamental medium design principles, 30 nutritional components were initially selected to construct a chemically defined medium. Thirty-one media variants (30 omission media and complete control) were prepared in triplicate (Table S3), with each omission medium containing 29 components at their original concentrations.
The CPC titer in each omission medium was evaluated against the complete medium: A reduced CPC titer indicated that the omitted component was essential for biosynthesis; an increased CPC titer suggested that removing the component alleviated metabolic inhibition or redirected metabolic flux toward CPC biosynthesis. This exclusion approach enabled the rapid screening of critical precursors and regulatory metabolites in CPC biosynthesis pathways.
Following 168 h of fermentation, the CPC titers in culture supernatants were quantified (Figure 1a). Based on these results, the 30 medium components were classified into two categories: (1) essential nutrients (CPC production less than or close to control group): maltose, glucose, lactic acid, phytic acid, KH2PO4, (NH4)2SO4, MgSO4·7H2O, CaCO3, trace elements, DL-methionine, L-aspartate, L-threonine, L-serine, L-glutamate, L-alanine, L-cystine, L-methionine, L-isoleucine, L-phenylalanine, L-histidine, L-arginine, L-tyrosine, biotin, and soybean oil; (2) non-essential components (CPC production far greater than control group): L-glycine, L-valine, L-leucine, L-lysine, and L-proline, which were excluded from subsequent optimization. The raw ingredients in complex media like corn steep liquor powder have coarse particles but still even allow for fermentation. The substances in the chemically defined medium were all soluble in water. The hyphae were easy to agglomerate during the growth process, resulting in a sharp drop in the titer. Adding a tension spring could prevent hyphae from aggregating into clumps and increase the CPC titer, making it essential for later experiments using a chemically defined medium.
A secondary single-factor omission experiment was performed using 24 selected components. A total of 25 medium variants (24 omission medium and control) were designed (Table S4), each containing 23 components. The omitted nutrient, its original concentration, and the medium identification code were specified for the systematic evaluation of metabolic contributions.
As shown in Figure 1b, the CPC titer in the second round of single-factor omission experiments ranged from 1.33 to 4.27 g/L, demonstrating significant improvement on the first trial, and the second experiment involved fewer factors, facilitating clearer assessment of the impact of individual factors on the titer. Seven components (L-glutamate, L-alanine, L-cystine, L-isoleucine, L-phenylalanine, L-arginine, and L-histidine) exhibited a higher CPC titer than the control group and were excluded from subsequent optimization. Seventeen components were ultimately selected as the optimized medium formulation. In the process of medium optimization, it was found that if there was only one type of methionine in the medium and methionine type was the only dependent variable, the addition effect of DL-methionine was better than that of L-methionine (Figure S1), so in subsequent experiments, the methionine added to the medium was DL type. The exclusion of multiple amino acids indicated that excessive amino acid supplementation may inhibit CPC biosynthesis. This finding underscored the principle that medium complexity did not inherently enhance microbial growth or metabolite production, emphasizing the necessity of strain-specific and product-dependent medium design.

3.2. PB Design and Medium Optimization

Two rounds of single-factor omission experiments identified 16 essential medium components that satisfied the fundamental nutritional requirements while reducing compositional complexity, achieving higher CPC titers compared to the original 30-component medium. A PB design was applied to optimize component concentrations and quantify their effects. This efficient fractional factorial method identified critical factors with only 20 trials for 16 components, ensuring analytical reliability. High and low concentration levels were set at 1.25-fold differences to assess dose-dependent effects. In this study, there were 16 factors that require experimental design using PB, which did not correspond to the standard number of runs. Therefore, we chose to use the PB design with “Factors = 19 (i.e., Runs = 20)”; at this point, the 16 factors could be fully covered, and the remaining three degrees of freedom could be used to estimate experimental errors. The independent variable names of the PB experiment were shown in Table S5, the dependent variable was the CPC titer, and the medium design table was shown in Table S6. The PB design enabled the identification of concentration thresholds that maximize CPC biosynthesis efficiency while minimizing resource expenditure.
The CPC titers across the 20 experimental runs are demonstrated in Figure 1c. Analysis via Design-Expert (Table 1) revealed the standardized effects and contributions of each component. The absolute magnitude of the standardized effects value represents the degree of influence of the corresponding component on the CPC titer. The “+” sign preceding the value indicated that, within the concentration range, the response value associated with the high level of the factor was greater than that at the low level. Conversely, the “–” sign indicated that, within the concentration range, the response value associated with the low level of the factor was greater than that at the high level. Contribution represented the extent to which each factor contributed to the variation in the response value. The positive components (enhanced CPC titer at higher concentrations) were as follows: maltose, glucose, lactic acid, (NH4)2SO4, DL-methionine, L-aspartic acid, L-serine, L-tyrosine, MgSO4·7H2O, and biotin. The negative components (improved titer at lower concentrations) were as follows: phytic acid, KH2PO4, L-threonine, CaCO3, trace elements, and soybean oil.
The statistically significant model generated the predictive equation (R2 = 0.9870).
CPC (g/L) =0.12134 × Maltose + 0.28591 × Glucose + 0.10427 × Lactic acid − 0.60512 × Phytic acid − 0.032084 × KH2PO4 + 0.082368 × (NH4)2SO4 + 0.52408 × DL-methionine + 0.74576 × L-aspartic acid − 0.30507 × L-threonine + 0.83630 × L-serine + 1.40151 × L-tyrosine − 7058.38854 × Biotin + 0.20783 × MgSO4⋅7H2O − 0.087783 × CaCO3 − 0.055360 × Soybean oil − 0.11996 × Trace element.
Components with minimal impact (low standardized effects and contributions) were maintained at their reasonable concentrations: (NH4)2SO4 (13.00 g/L), L-aspartic acid (1.98 g/L), L-serine (1.03 g/L), L-tyrosine (0.51 g/L), biotin (0.00010 g/L), MgSO4·7H2O (6.14 g/L), KH2PO4 (9.00 g/L), L-threonine (0.96 g/L), CaCO3 (10 g/L), trace elements (1% (v/v)), and soybean oil (10 g/L). Components with moderate positive effects (glucose, lactic acid) were maximized to 13.32 g/L and 22.48 g/L. Three components exhibiting substantial influence, (|Standardized Effects| > 0.8), maltose, phytic acid, and DL-methionine, were prioritized for further optimization.

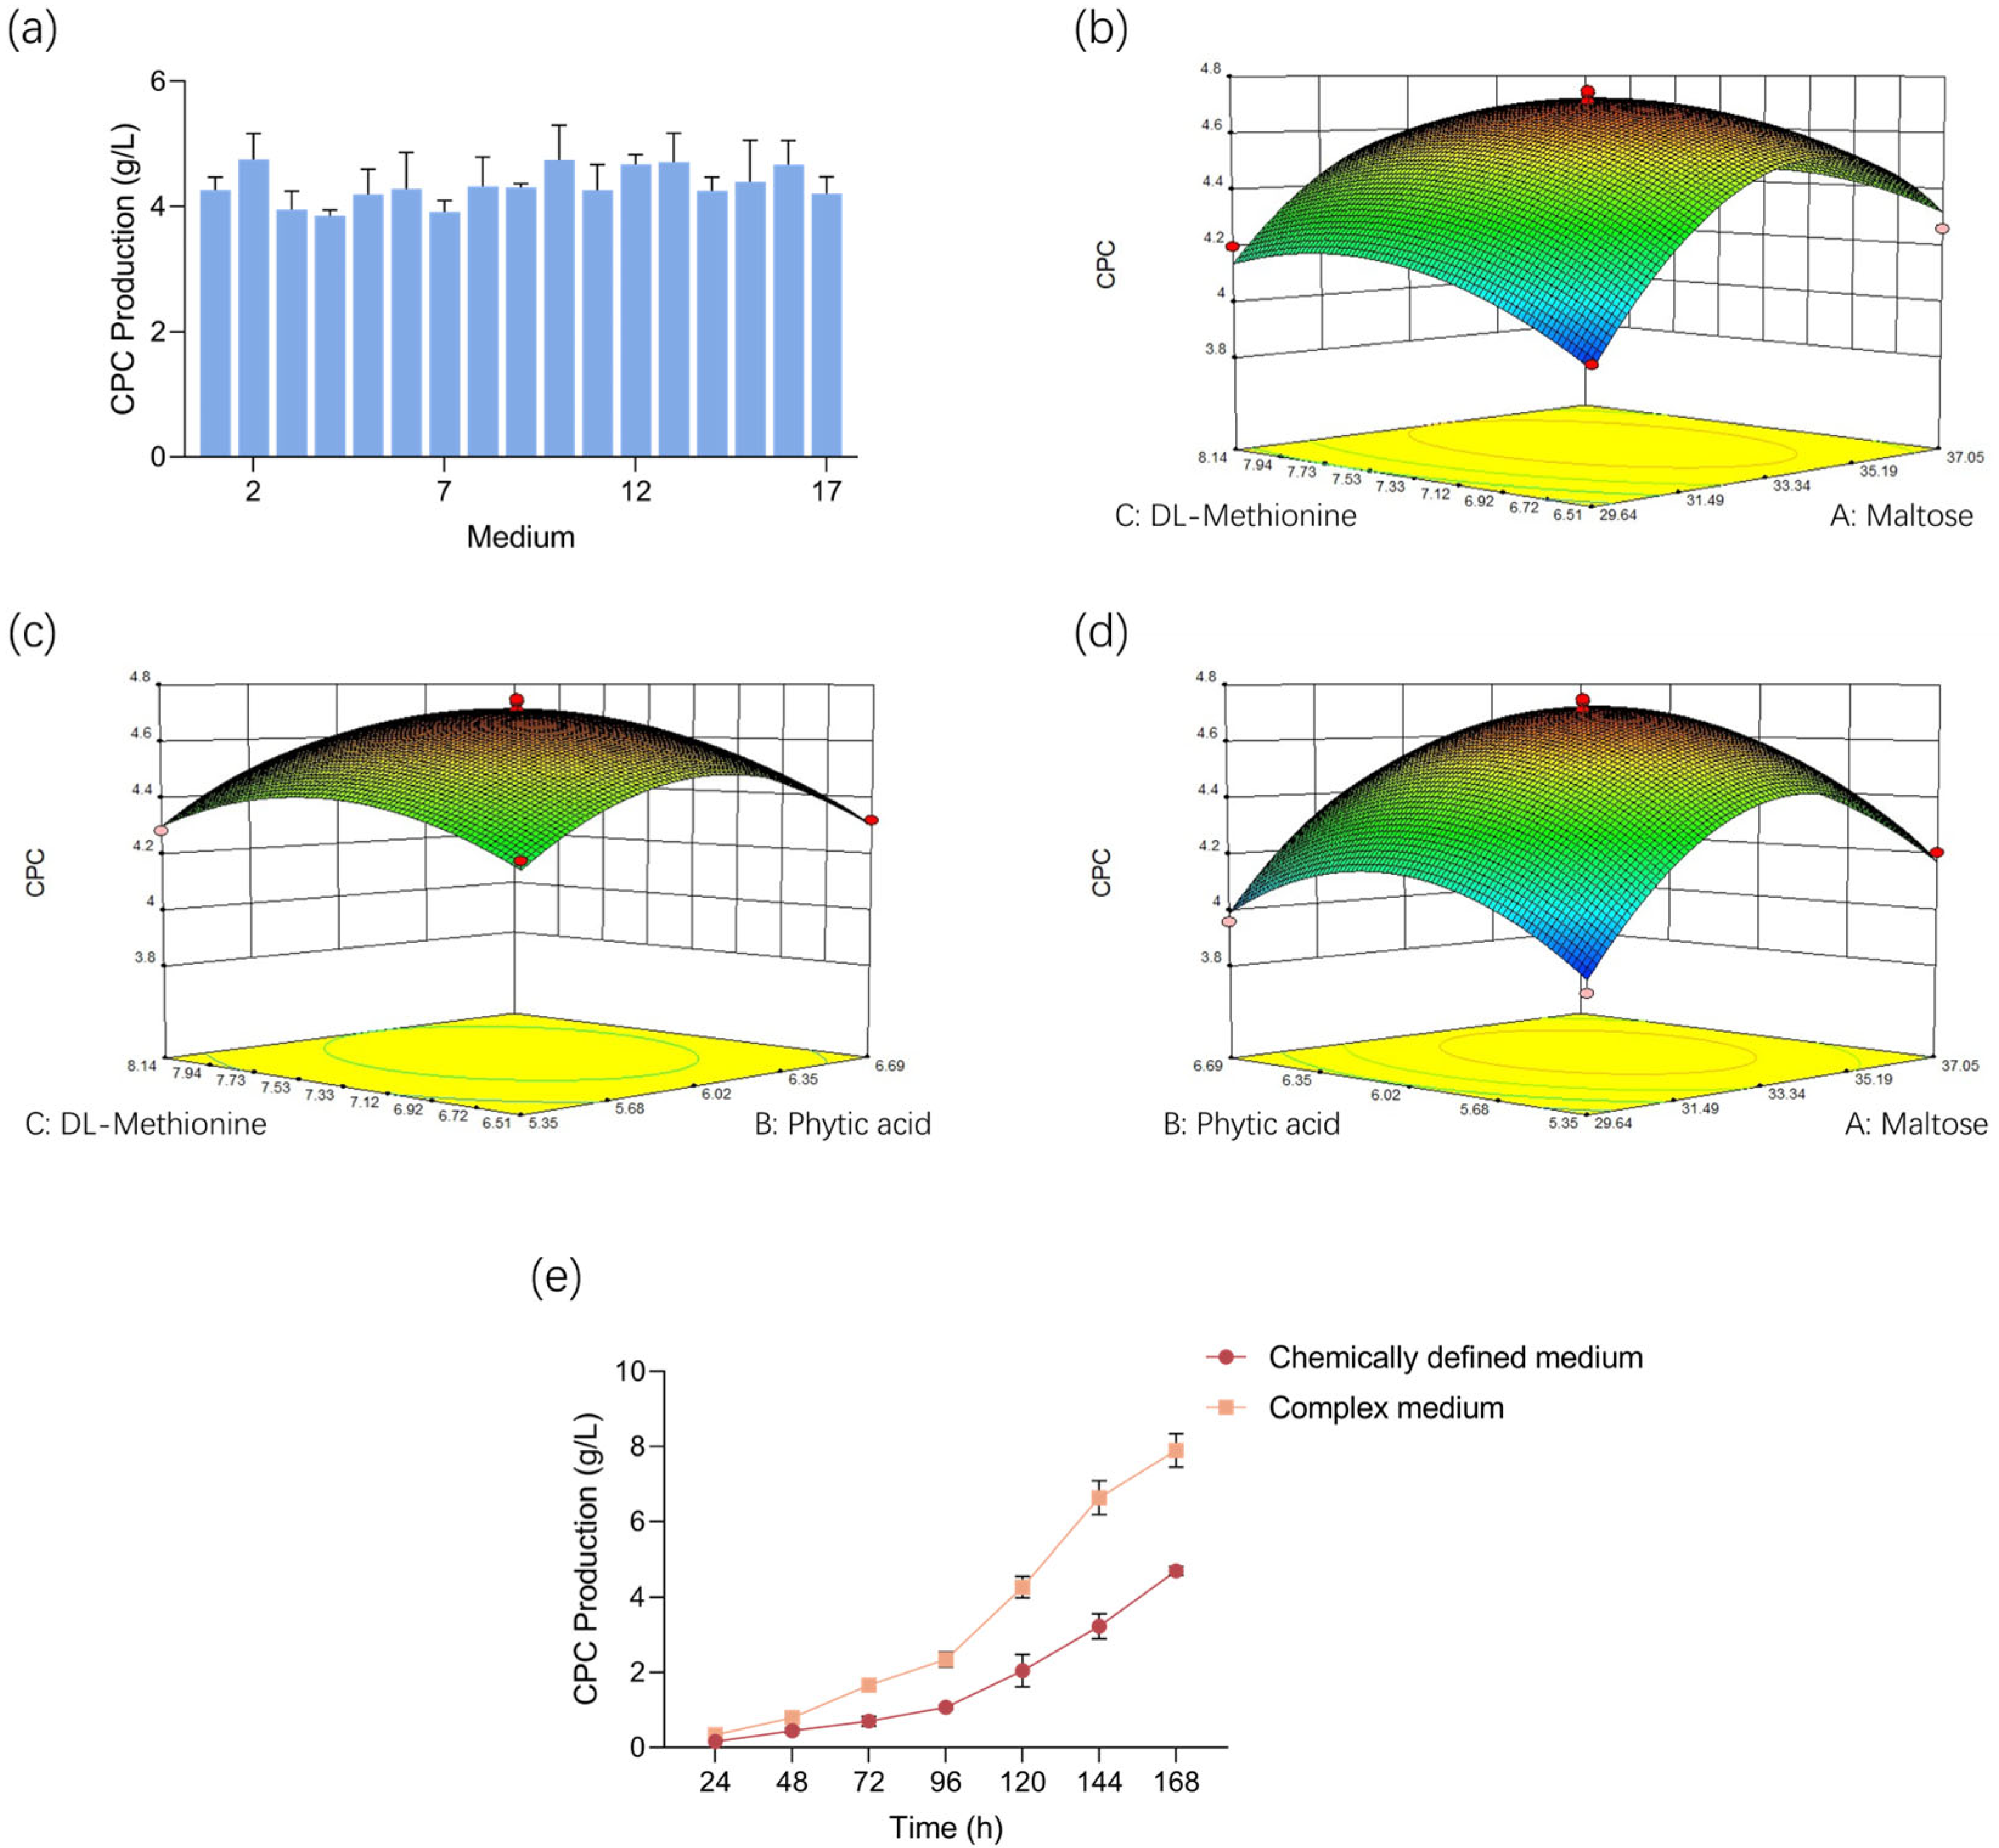
3.3. RSM for Optimal Concentration Determination

While PB design identifies the primary factors influencing the CPC titer, it cannot account for interaction effects or nonlinear relationships. To this end, RSM was employed to evaluate the significance of individual factors, analyze their interactions, and determine optimal concentrations. Among the RSM approaches, BBD was selected over Central Composite Design (CCD) due to its higher efficiency in identifying critical interactions through two-factor combinatorial testing. Three components (phytic acid, maltose, and DL-methionine) exhibited substantial influence in PB experiments, and were further optimized by employing BBD. The experimental run systematically varies these factors across defined concentration ranges, with the dependent variable designed as the CPC titer to simulate the quadratic relationship between the component concentration and the CPC titer (Table S7). In BBD experiments, center points are used to estimate experimental errors and detect quadratic terms in the model. The number of center points directly affects the precision of estimating quadratic coefficients. Sufficient center points enable the separation of pure errors from lack of fit errors in the model, but excessive center points increase the experimental costs. Typically, 3–5 center points are recommended for three-factor experiments. In this study, we selected five center points to reliably capture the curvature of the response surface without substantially increasing the experimental costs. This approach enabled the precise identification of synergistic or antagonistic effects between nutrients while minimizing experimental runs.
The CPC titers corresponding to various medium formulations are shown in Figure 2a. The larger the F-value and the smaller the p-value, the more significant the model is, which can effectively explain the changes in the experimental data. Data analysis confirmed the model’s statistical significance (p < 0.05) with non-significant lack of fit (p > 0.05), and the F-value was very high, validating its predictive capability (Table 2). The magnitude of coefficient estimates reflected the relative influence of each component: positive values indicate titer enhancement with increased concentration, while negative values denote suppression. Significant quadratic terms with negative coefficients for maltose, phytic acid, and DL-methionine revealed optimal concentration thresholds, beyond which CPC titer declined. For maltose, insufficient concentrations limited the energy supply and secondary metabolism, whereas excess levels induced organic acid accumulation, lowering the pH and inhibiting enzymatic activity. Phytic acid provided phosphate and chelated metal ions to mitigate toxicity, but excessive chelation inhibited enzymatic functions. DL-methionine enhanced CPC production by supplying precursors, yet over-supplementation disrupted the precursor balance, impairing the biosynthesis efficiency.
The p-values of “Phytic acid and DL-methionine” and “Maltose and Phytic acid” were greater than 0.05, and the F-value was low, indicating that the interaction terms were not significant and that there was no interaction between phytic acid and DL-methionine or maltose and phytic acid. The interaction analysis revealed a significant antagonism between maltose and DL-methionine, indicating that increasing both simultaneously reduced their individual efficacy and should be avoided in optimization strategies (Figure 2b–d). In the BBD experiment, adj-R2 reflects the goodness of fit of the model to the data. The closer its value is to 1, the stronger the model’s ability to explain the response values. Pred-R2 is typically recommended to be above 0.7, indicating the predictive power of the model. The difference between adj-R2 and pred-R2 should be kept within 0.2. In this study, the model exhibited the adj-R2 value of 0.9635 and the pred-R2 value of 0.8023, meeting the established criteria for model usability. The optimized concentrations predicted by the model were 33.95 g/L maltose, 6.09 g/L phytic acid, and 7.42 g/L DL-methionine, achieving a projected CPC titer of 4.72 g/L. This systematic integration of nutrient thresholds and interaction effects resolved conflicting metabolic demands while maximizing the CPC biosynthesis efficiency.
The statistically significant model generated the predictive equation (R2 = 0.9840).
CPC = −66.15235 + 2.13563 × Maltose + 6.23140 × Phytic acid + 4.22291 × DL-methionine − 0.000699728 × Maltose × Phytic acid − 0.024237 × Maltose × DL-methionine − 0.028744 × Maltose2 − 0.52516 × Phytic acid2 − 0.23949 × DL-methioine2.
Design-Expert predicted an optimized chemically defined medium capable of producing 4.72 g/L CPC, which was subsequently validated through shake flask experiments and benchmarked against a complex medium (Figure 2e). The complex medium demonstrated faster biomass growth and an earlier peak in the CPC production rate due to its nutrient-rich composition, achieving a final titer of 7.90 g/L. In contrast, the chemically defined medium produced 4.70 g/L CPC, closely matching the predicted value (4.72 g/L) and reaching 59.54% of the complex medium. This validation confirmed the robustness of the model and the suitability of the chemically defined medium for further mechanistic studies. The reproducibility of CPC production in the chemically defined medium (deviation < 0.5% from prediction) underscored its utility for further research on metabolic regulation and process optimization.

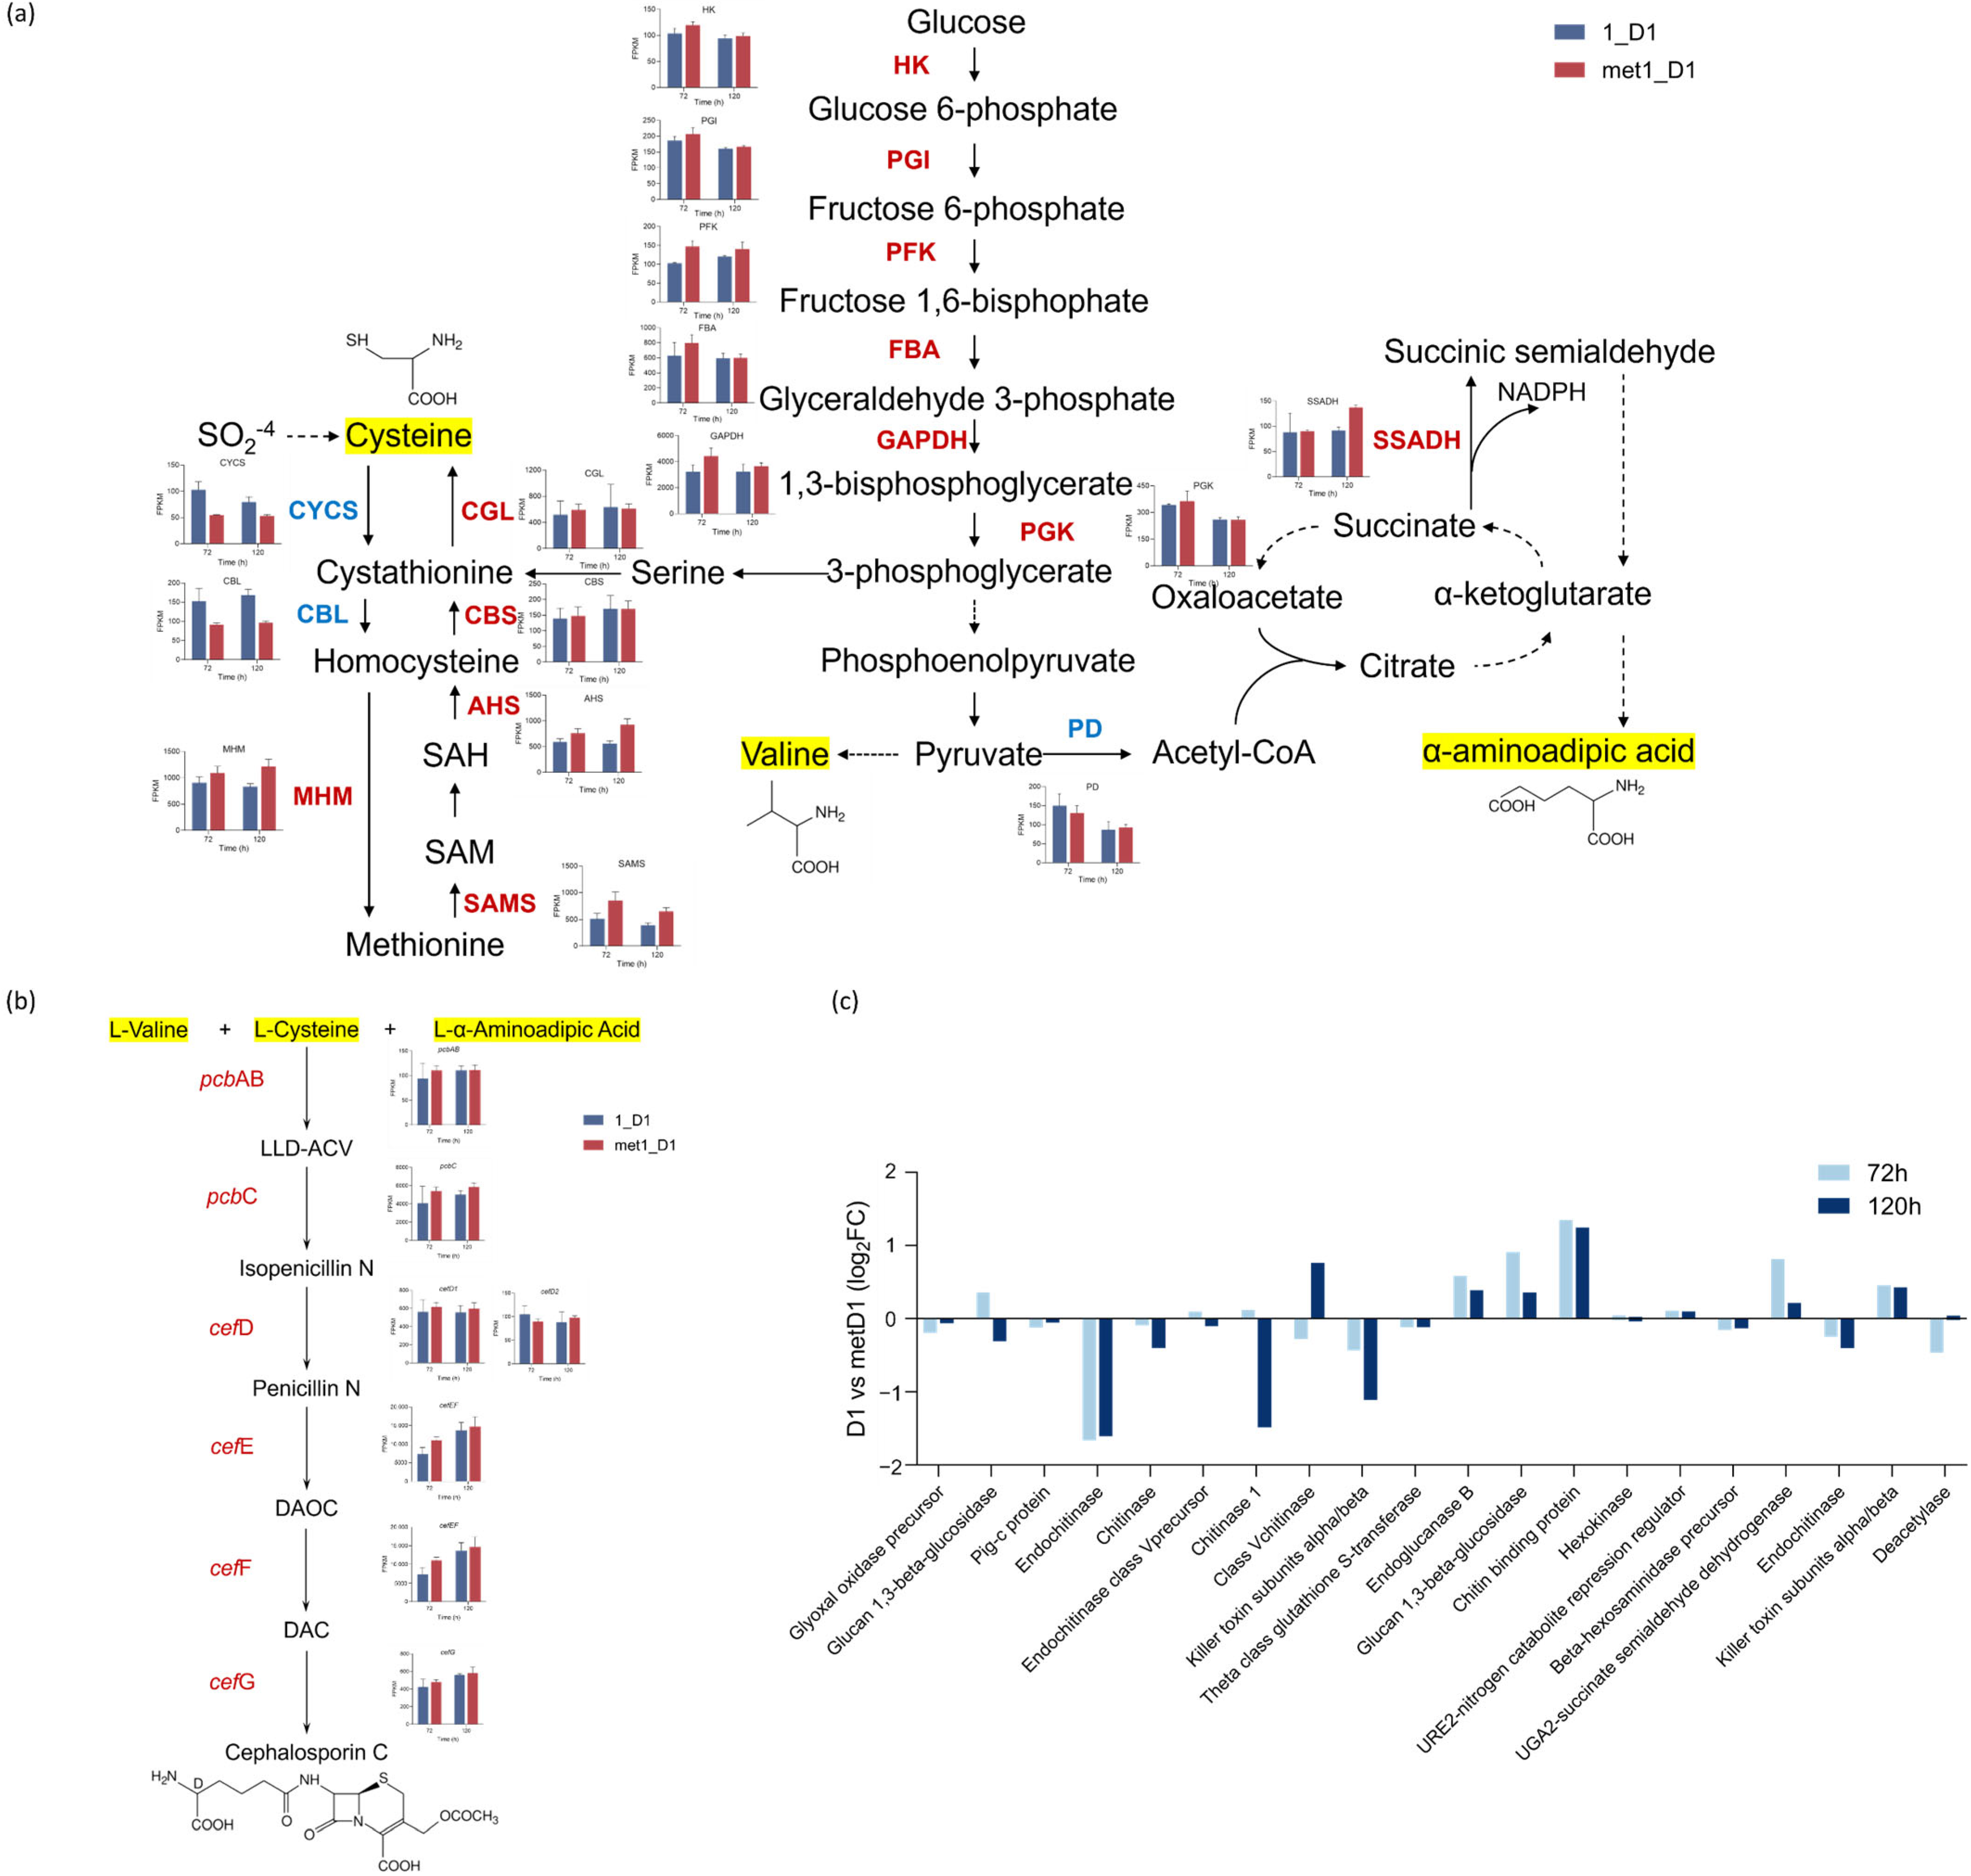
3.4. Transcriptomic Analysis of Methionine-Mediated CPC Biosynthesis Enhancement

Integrated qRT-PCR and transcriptomic profiling could identify key titer-associated genes in high- and low-producing strains [19,20,21]. The critical role of methionine in promoting CPC biosynthesis, as identified during medium optimization, was further investigated through comparative transcriptomic analysis. Two A. chrysogenum strains were evaluated: the industrial strain FC3-5-23 (designated 1-D1) and its axl2 gene-deletion mutant (Ac-Δaxl2::eGFP), with a methionine-free medium as the control. DL-methionine supplementation significantly enhanced CPC production, particularly in strain 1-D1, where a 24% titer increase was achieved (Figure 3a,b).
To elucidate the regulatory role of methionine in the CPC titer, comparative transcriptomic profiling was conducted between strains 1_D1 and met1_D1 at two critical phases: CPC initiation (72 h) and rapid biosynthesis (120 h). Transcriptomic sequencing identified differentially expressed genes (DEGs) using DESeq2 with a threshold of |log2FC| ≥ 0.1. Under methionine supplementation, significant transcriptional reprogramming was observed (Figure 3c,d). At 72 h, 210 DEGs were identified (159 upregulated, 51 downregulated), while 194 DEGs were detected at 120 h (122 upregulated, 72 downregulated).
GO enrichment analysis (Figure 3e,f) revealed distinct metabolic shifts across phases. During early fermentation (72 h), methionine availability suppressed sulfate uptake and sulfur assimilation pathways, evidenced by the downregulation of sulfate transporter and sulfur metabolism genes. This reflected methionine’s role in bypassing sulfate-dependent methionine biosynthesis. In the rapid production phase (120 h), DEGs were enriched in energy metabolism (e.g., ATP synthesis, NADH dehydrogenase activity) and cell wall remodeling processes, aligning with enhanced secondary metabolite synthesis and hyphal morphological adaptation. These results demonstrate that methionine exerts a stage-specific regulatory effect: it conserves metabolic resources by suppressing sulfate assimilation during early growth and remodels the cellular architecture during peak production to facilitate CPC biosynthesis.

3.5. Differential Expression of Genes in Key Metabolic Pathways Involved in CPC Biosynthesis

Comparative transcriptomic analysis between methionine-supplemented (metD1) and control cultures revealed the upregulated expression of key genes in central carbon and sulfur metabolism. In the EMP pathway, genes encoding hexokinase, glucose-6-phosphate isomerase, 6-phosphofructokinase, fructose-bisphosphate aldolase, glyceraldehyde-3-phosphate dehydrogenase, or phosphoglycerate kinase showed elevated transcription levels, indicating enhanced glycolytic flux. Methionine supplementation further activated cysteine biosynthesis genes (SAM synthase, adenosylhomocysteinase, cystathionine beta-synthase, and cystathionine gamma-lyase) in the trans-sulfuration pathway and succinic semialdehyde dehydrogenase, boosting the NADPH supply (Figure 4a). These transcriptional differences indicated that the addition of methionine can provide more precursors and energy supply for CPC biosynthesis. Most genes involved in CPC biosynthesis exhibited differences at the transcriptional level (especially pcbC and cefEF) (Figure 4b). The results demonstrated that methionine-mediated CPC enhancement operated through precursor enrichment and redox balance optimization rather than the direct regulation of CPC biosynthetic genes.
In addition, there were obvious differences in some protein-coding genes involved in the chitin binding and chitin activity (Figure 4c). The coding genes for chitinase (ACRE_049140) and endochitinase (ARCE_022700) were significantly downregulated, suggesting that adequate chitin was preserved for cell wall construction and repair during the critical stage of arthrospore formation. Abnormal chitinase activity at this stage may result in an incomplete cell wall structure, thereby compromising the mechanical strength and stress resistance of the arthrospores. Given that glucans constitute a primary component of fungal cell walls, the observed initial upregulation and subsequent downregulation of glucan 1,3-β-glucosidase genes may correspond to early hyphal swelling and division, followed by septum formation through the accumulation of cell wall precursors during arthrospore development. At present, the research on morphological changes and septum formation in filamentous fungi was mainly based on two models: the septation initiation network (SIN) and bud site selection system (BSSS) [22]. Axl1, Axl2, Bud3, and Bud4 are important components of BSSS; Mst1, SEPA, SEPH, SEPK, SEPL, SEPM, SIDB, SNAD, SPGA, and Rho4 are components of SIN. Notably, the analysis of the transcriptome results demonstrated that under the condition of methionine supplementation, the transcript levels of genes involved in these models were not much different (Figure S2). This indicated that the differentiation of arthrospores may occur at an earlier stage, such as the early stage of fermentation. It may also be due to the differences in the process of producing arthrospores in A. chrysogenum compared to SIN and BSSS, which is worth further investigation in the future.

4. Discussion

Cephalosporins and Penicillins are both types of β-lactam antibiotics. Cephalosporin C is the parent compound of cephalosporin antibiotics, and the core structure of CPC, which exhibits greater stability compared to penicillin’s 6-aminopenicillanic acid (6-APA), is called 7-aminocephalosporanic acid (7-ACA), and also demonstrates enhanced resistance to β-lactamases and acidic conditions, as well as a reduced likelihood of adverse reactions. A. chrysogenum possesses a complete biosynthetic pathway for CPC and is presently recognized as the primary strain utilized for the industrial production of CPC. This indicates that CPC synthesized by A. chrysogenum holds significant potential for various applications. Consequently, it is essential to investigate its metabolic pathways, enhance its fermentation processes, and implement metabolic engineering modifications.
In this study, we developed a chemically defined medium composed of well-characterized components that effectively supported CPC biosynthesis. During medium optimization, we discovered that DL-methionine exhibits a significant promoting effect on CPC biosynthesis. As early as 1956, methionine was found to enhance CPC production, and DL-methionine demonstrated superior efficacy compared to L-methionine [23]. This advantage may stem from the capacity of A. chrysogenum to transform DL-methionine into L-methionine. Its metabolic rate is lower than that of L-methionine, which may result in an extended retention time in the medium. Despite these observations, the mechanisms by which methionine enhances CPC biosynthesis in A. chrysogenum were not fully elucidated, with existing hypotheses primarily addressing isolated regulatory pathways.
Consequently, it is essential to investigate the multifaceted regulatory functions of methionine. We performed comparative transcriptomic analyses under conditions of methionine supplementation and deprivation at two distinct time points: the initiation of CPC (72 h) and the phase of rapid biosynthesis (120 h). The findings indicated an increased expression of genes associated with methionine–cysteine metabolic pathways, specifically MHM, AHS, and CBS, which contributed to the enhanced availability of methionine and facilitated the biosynthesis of cysteine. Notably, the disruption of the gene encoding cystathionine γ-lyase (CGL), mecB, adversely affected the growth of the mutant strain when cultured in media containing methionine or homocysteine as the exclusive sulfur source, leading to a significant decrease in the CPC titer [24]. In contrast, the overexpression of mecB resulted in a substantial increase in the CPC titer [25]. These findings underscore the importance of the reverse trans-sulfuration pathway in methionine metabolism and CPC biosynthesis. However, the specific functional roles of other genes involved in this pathway remain to be elucidated. Subsequent research may concentrate on the overexpression of upregulated genes to enhance the efficiency of methionine utilization and mitigate the reliance of A. chrysogenum on methionine. It is important to note that, although methionine contributes additional cysteine for CPC synthesis, its function cannot be solely ascribed to this role, as the administration of cysteine alone does not yield the same stimulatory effect [23]. This indicates that methionine functions not solely as a sulfur donor.
We also found that both the glycolytic pathway and the pentose phosphate pathway were active, while the transcription of PD associated with the TCA cycle was downregulated. This downregulation resulted in a reduced influx of pyruvate into the TCA cycle, facilitating the accumulation of valine and diminishing the production of intermediate metabolites. This observation aligned with the research conducted by Han [26], which demonstrated that the transcription of glycolysis-related genes was more active in high-yield strains compared to wild-type strains. This suggested an enhanced supply of NADPH, an increase in valine accumulation, and methionine contributing additional energy and precursors for CPC biosynthesis, ultimately fostering a higher titer. Methionine can also increase the expression of genes in CPC biosynthetic gene clusters, such as IPEN synthase and DCPC actyeltranferase expressed by pcbC and cefG [27]. In addition, the gene expression on other biosynthesis gene clusters also increased correspondingly, and the gene of cahB (CPC acetylhydrolase) was downregulated, which can reduce the degradation of CPC.
Previous studies indicated that nutrient limitation or methionine supplementation induced morphological transitions in A. chrysogenum, characterized by hyphal swelling and fragmentation into arthrospores [28]. This morphological change might be accompanied by a progressive increase in the CPC titer, peaking during arthrospore formation. Kluge et al. [22] studied the formation mechanism of arthrospores of A. chrysogenum. During the formation of arthrospores, the main mechanism was similar to that of BSSS and SIN. Studies have shown that the early stages of conidiation in A. chrysogenum are similar to those of BSSS in Saccharomyces cerevisiae, where the axial marker protein Axl2p localizes to the budding site, followed by the recruitment of septins and other proteins to form a ring. The combination of cortical actomyosin ring (CAR) contraction and inward membrane invagination leads to septum formation [29]. Subsequently, similar to the SIN in Aspergillus nidulans, actin rings and other protein rings are recruited at cortical dots to form the septation initiation network complex [30]. However, in this study, it was determined that methionine did not exert a significant influence on the genes associated with BSSS and SIN during the middle and late stages of fermentation. It was hypothesized that arthrospore formation predominantly occurred during the early fermentation phase, specifically between 36 h and 60 h [18]. To further investigate the impact of methionine on arthrospore formation, it is essential to examine the transcriptional alterations of key genes in BSSS and SIN during the initial stages of fermentation. Notably, we observed substantial changes in the genes related to glucan 1,3-beta-glucosidase, chitin binding, and chitinase activity throughout the fermentation process. These changes contributed to the accumulation of cell wall components and enhanced the mechanical strength of the cell wall, thereby facilitating the release of free arthrospores. These findings lent additional support to the hypothesis that the arthrospore-promoting effect of methionine was linked to its role in arthrospore formation. Nevertheless, the relationship between morphological differentiation and the induction of CPC synthetic gene clusters remains to be clarified.
Furthermore, this investigation identified notable transcriptional variations in the genes associated with oxidative stress processes. Long [31] examined the glrA gene, which encodes glutaredoxin reductase in A. chrysogenum. The study revealed that spore germination and hyphal growth in glrA-deficient mutants were significantly impaired in the MMC medium, and that the introduction of exogenous methionine was found to restore normal germination and growth in the mutants, while also enhancing the antioxidant capacity of both the mutants and wild-type strains. In conjunction with the transcriptome analysis conducted in our study, it was observed that the addition of methionine upregulates the genes related to the glutathione system (specifically glutathione reductase), thereby increasing the ratio of reduced glutathione/oxidized glutathione and facilitating a response to oxidative stress. Additionally, Nagy et al. [32] demonstrated that the exogenous supplementation of methionine in the medium elevated the total glutathione levels in A. chrysogenum ATCC 46117, suggesting that methionine enhanced the antioxidant capacity of A. chrysogenum and promoted the CPC titer through the regulation of redox balance and stress resistance.
However, some researchers have found that glutathione reductase did not directly participate in CPC biosynthesis. An alternative oxidative stress defense system, the thioredoxin system, particularly its thioredoxin reductase, effectively maintains intracellular levels of δ-(L-α-aminoadipoyl)-L-cysteinyl-D-valine (ACV), a critical intermediate in the initiation of β-lactam antibiotic synthesis [33]. Liu et al. [34] investigated the thioredoxin reductase-encoding gene (ActrxR1) in the thioredoxin system of A. chrysogenum. The disruption of ActrxR1 led to the transcriptional upregulation of glrA, disrupted spore morphology in LPE or TSA medium, and impaired CPC biosynthesis. In contrast, the disruption of glrA did not cause morphological changes in the mutant strains in LPE or TSA medium, indicating functional divergence between the two redox systems. Consistent with our observations, under methionine supplementation conditions, the glutathione system exhibited heightened activity, while genes in the thioredoxin system were downregulated. We hypothesized that GR encoded by glrA primarily counteracts high-intensity oxidative stress to maintain cellular homeostasis, whereas TrxR encoded by trxR1 mainly defends against low-intensity oxidative stress [31]. The transcriptional downregulation of trxR1 may subject A. chrysogenum to mild oxidative stress, which could be essential for triggering secondary metabolite biosynthesis in fungi [35]. Under varying oxidative stress conditions, distinct antioxidant systems may thus exert specialized roles. Further investigations are required to comparatively analyze the glutathione and thioredoxin systems and elucidate their interactive relationships with the CPC biosynthetic gene cluster.
In summary, we established a chemically defined medium optimized through PB and BBD, which enhanced the CPC titer in A. chrysogenum. Transcriptome sequencing analysis preliminarily elucidated the mechanism by which methionine promotes CPC production, primarily through the activation of primary metabolism, accumulation of CPC biosynthetic precursors and energy reserves, and improved arthroconidium formation. GO analysis combined with the pfam database revealed that certain unannotated genes may participate in pathways such as autophagy, plasma membrane organization, and cell cycle regulation. These findings provided a foundational basis for future metabolic engineering modifications of industrial A. chrysogenum strains and the optimization of fermentation processes aimed at CPC production.

Supplementary Materials

The following supporting information can be downloaded at: https://www.mdpi.com/article/10.3390/fermentation11060325/s1. Figure S1: The effect of adding different types of methionine; Figure S2: Transcriptional level of genes in BSSS and SIN components; Table S1: Component content of main composite components; Table S2: Sample analysis name and group for comparative analysis of differences; Table S3: Single-factor omission experiment 1; Table S4: Single-factor omission experiment 2; Table S5: The levels of variables used in Plackett–Burman design; Table S6: The design of Plackett–Burman experiment; Table S7: The Box–Behnken Design medium design table.

Author Contributions

Conceptualization, X.T., J.C., and Y.L.; methodology, Y.L.; software, Y.L. and W.H.; validation, Y.L. and W.H.; formal analysis, Y.L. and W.H.; investigation, Z.C.; resources, T.F.; data curation, Y.L. and W.H.; writing—original draft preparation, Y.L.; writing—review and editing, X.T. and J.C.; visualization, Y.L.; supervision, X.T. and J.C.; project administration, X.T. and J.C.; funding acquisition, X.T. and J.C. All authors have read and agreed to the published version of the manuscript.

Funding

This work was financially supported by the National Key Research and Development Program of China (2024YFA0917900), the Taishan Scholars Program of Shandong Province (NO.tsqn202312316), the Shanghai Pilot Program for Basic Research (22TQ1400100-14), the Shanghai Science and Technology Innovation Action Plan (24HC2810100), the Natural Science Foundation of Shanghai (23ZR1416500), the Fundamental Research Funds for the Central Universities (JKV01251708).

Institutional Review Board Statement

Not applicable.

Informed Consent Statement

Not applicable.

Data Availability Statement

Data are available upon reasonable request.

Acknowledgments

Thanks for the financial support from the Arawana Charity Foundation.

Conflicts of Interest

Author Tao Feng was employed by the company Sinopharm Weiqida Pharmaceutical Co., Ltd. The remaining authors declare that the research was conducted in the absence of any commercial or financial relationships that could be construed as a potential conflict of interest.

Abbreviations

The following abbreviations are used in this manuscript:
CPCCephalosporin C
PBPlackett–Burman
RSMResponse surface methodology
BBDBox–Behnken Design
SINSeptation initiation network
BSSSBud site selection system

References

  1. Li, X.; Wang, J.; Su, W.; Li, C.; Qu, G.; Yuan, B.; Sun, Z. Characterization and Engineering of Cephalosporin C Acylases to Produce 7-Aminocephalosporanic Acid. Mol. Catal. 2023, 550, 113595. [Google Scholar] [CrossRef]
  2. Grand View Research. Antibiotics Market Size, Share & Trends Analysis Report by Action Mechanism (Cell Wall Synthesis Inhibitors, RNA Synthesis Inhibitors), by Drug Class (Penicillin, Cephalosporin), by Type (Branded, Generic), and Segment Forecasts, 2024–2030; Grand View Research: San Francisco, CA, USA, 2023. [Google Scholar]
  3. Tan, Q.; Qiu, J.; Luo, X.; Zhang, Y.; Liu, Y.; Chen, Y.; Yuan, J.; Liao, W. Progress in One-Pot Bioconversion of Cephalosporin C to 7-Aminocephalosporanic Acid. Curr. Pharm. Biotechnol. 2018, 19, 30–32. [Google Scholar] [CrossRef]
  4. Gross, L.; Mohn, F.; Moll, N.; Meyer, G.; Ebel, R.; Abdel-Mageed, W.M.; Jaspars, M. Organic Structure Determination Using Atomic-Resolution Scanning Probe Microscopy. Nat. Chem. 2010, 2, 821–825. [Google Scholar] [CrossRef]
  5. Marín-Candón, A.; Rosso-Fernández, C.M.; Bustos de Godoy, N.; López-Cerero, L.; Gutiérrez-Gutiérrez, B.; López-Cortés, L.E.; Pulido, L.B.; Borreguero, I.B.; León, M.J.; Merino, V.; et al. Temocillin Versus Meropenem for the Targeted Treatment of Bacteraemia Due to Third-Generation Cephalosporin-Resistant Enterobacterales (ASTARTÉ): Protocol for a Randomised, Pragmatic Trial. BMJ Open 2021, 11, e049481. [Google Scholar] [CrossRef]
  6. Yang, Y.M.; Xia, J.Y.; Li, J.H.; Chu, J.; Li, L.; Wang, Y.H.; Zhuang, Y.P.; Zhang, S.L. A Novel Impeller Configuration to Improve Fungal Physiology Performance and Energy Conservation for Cephalosporin C Production. J. Biotechnol. 2012, 161, 250–256. [Google Scholar] [CrossRef] [PubMed]
  7. Martín, J.F. Transport Systems, Intracellular Traffic of Intermediates and Secretion of β-Lactam Antibiotics in Fungi. Fungal Biol. Biotechnol. 2020, 7, 6. [Google Scholar] [CrossRef]
  8. Zhgun, A.A. Fungal BGCs For Production of Secondary Metabolites: Main Types, Central Roles in Strain Improvement, and Regulation according to the Piano Principle. Int. J. Mol. Sci. 2023, 24, 11184. [Google Scholar] [CrossRef] [PubMed]
  9. Duan, S.B.; Yuan, G.Q.; Zhao, Y.L.; Ni, W.J.; Luo, H.Z.; Shi, Z.P.; Liu, F. Simulation of Computational Fluid Dynamics and Comparison of Cephalosporin C Fermentation Performance with Different Impeller Combinations. Korean J. Chem. Eng. 2013, 30, 1097–1104. [Google Scholar] [CrossRef]
  10. Wang, Z.J.; Wang, X.H.; Liu, C.; Hang, H.F.; Chu, J.; Guo, M.J.; Zhuang, Y.P. Method for Improving Penicillin Fermentation Production Unit. China Patent CN113388658A, 12 March 2020. [Google Scholar]
  11. Liu, J.J.; Liu, G. Advances in the Regulation of Cephalosporin C Biosynthesis—A Review. Acta Microbiol. Sin. 2016, 56, 461–470. [Google Scholar]
  12. Chen, J.; Yao, R.; Yu, W.; Zhan, J.; Zhu, H.; Wang, H. Optimization of Culture Medium for Cephalosporin C Production from Rice Straw by Cephalosporium acremonium Fermentation Using Response Surface Methodology. China Brew. 2020, 39, 131–136. [Google Scholar] [CrossRef]
  13. Kim, S.; Kim, H.R.; Oh, H.J.; Lee, K.; Um, Y.; Kim, D.W.; Seo, S.W.; Park, C.; Kim, S.W. Undefined Xylose Media Extracted from Biorefinery Waste for Enhanced and Eco-Friendly Production of Cephalosporin C By Acremonium chrysogenum M35. GCB Bioenergy 2023, 15, 731–742. [Google Scholar] [CrossRef]
  14. Li, J.; Meng, L.; Zhang, S.; Feng, T.; Yu, N. Optimization of Fermentation Medium for Cephalosporin C Production by Acremonium chrysogenum. Chem. Ent. Manag. 2024, 20, 131–135. [Google Scholar]
  15. Mapar, M.; Rydazk, T.; Groves, R.A.; Lewis, L.A. Biomarker Enrichment Medium: A Defined Medium for Metabolomic Analysis of Microbial Pathogens. Front. Microbiol. 2022, 13, 957158. [Google Scholar] [CrossRef]
  16. Harris, D.M.; van der Krogt, Z.A.; van Guilk, W.M.; van Dijken, J.P.; Pronk, J.T. Formate as an Auxiliary Substrate for Glucose-Limited Cultivation of Penicillium chrysogenum: Impact on Penicillin G Production and Biomass Yield. Appl. Environ. Microbiol. 2007, 73, 5020–5025. [Google Scholar] [CrossRef]
  17. Jami, M.S.; Barreiro, C.; García-Estrada, C.; Martín, J.F. Proteome Analysis of the Penicillin Producer Penicillium chrysogenum: Characterization of Protein Changes During the Industrial Strain Improvement. Mol. Cell. Proteom. 2010, 9, 1182–1198. [Google Scholar] [CrossRef] [PubMed]
  18. Xu, Y.; Liu, L.; Chen, Z.; Tian, X.W.; Chu, J. The Arthrospore-Related Gene Acaxl2 is Involved in Cephalosporin C Production in Industrial Acremonium chrysogenum by the Regulatory Factors AcFKH1 and CPCR1. J. Biotechnol. 2021, 347, 26–39. [Google Scholar] [CrossRef]
  19. Liu, Y.; Xie, L.P.; Gong, G.H.; Zhang, W.; Zhu, B.Q.; Hu, Y.J. De Novo Comparative Transcriptome Analysis of Acremonium chrysogenum: High-Yield and Wild-Type Strains of Cephalosporin C Producer. PLoS ONE 2014, 9, e104542. [Google Scholar] [CrossRef]
  20. López-Calleja, A.C.; Cuadra, T.; Barrios-González, J.; Fierro, F.; Fernández, F.J. Solid-State and Submerged Fermentations Show Different Gene Expression Profiles in Cephalosporin C Production by Acremonium chrysogenum. J. Mol. Microbiol. Biotechnol. 2012, 22, 126–134. [Google Scholar] [CrossRef] [PubMed]
  21. Dumina, M.V.; Zhgun, A.A.; Novak, M.I.; Domratcheva, A.G.; Petukhov, D.V.; Dzhavakhiya, V.V.; Eldarov, M.A.; Bartoshevitch, I.E. Comparative Gene Expression Profiling Reveals Key Changes in Expression Levels of Cephalosporin C Biosynthesis and Transport Genes Between Low and High-Producing Strains of Acremonium chrysogenum. World J. Microbiol. Biotechnol. 2014, 30, 2933–2941. [Google Scholar] [CrossRef]
  22. Kluge, J.; Kück, U. AcAxl2 and AcMst1 Regulate Arthrospore Development and Stress Resistance in the Cephalosporin C Producer Acremonium chrysogenum. Curr. Genet. 2018, 64, 713–727. [Google Scholar] [CrossRef]
  23. Matsumura, M.; Liu, L.Y. Regulatory Effects of Endogenous Methionine on Cephalosporin C Production in Acremonium chrysogenum. Foreign Pharm. (Antibiot. Sect.) 1981, 2, 22–29. [Google Scholar] [CrossRef]
  24. Kern, B.A.; Inamine, E. Cystathionine γ-Lyase Activity in the Cephamycin C Producer Streptomyces Lactamdurans. J. Antibiot. 1981, 34, 583–589. [Google Scholar] [CrossRef] [PubMed]
  25. Kosalková, K.; García-Estrada, C.; Ullán, R.V.; Martín, J.F. A Moderate Amplification of the mecB Gene Encoding Cystathionine-γ-Lyase Stimulates Cephalosporin Biosynthesis in Acremonium chrysogenum. J. Ind. Microbiol. Biotechnol. 2001, 27, 252–258. [Google Scholar] [CrossRef]
  26. Han, S.; Liu, Y.; Xie, L.P.; Zhu, B.Q.; Hu, Y.J. Comparative Expression Profiling of Genes Involved in Primary Metabolism in High-Yield and Wild-Type Strains of Acremonium chrysogenum. Antonie Van Leeuwenhoek 2016, 109, 357–369. [Google Scholar] [CrossRef] [PubMed]
  27. Velasco, J.; Gutiérrez, S.; Fernández, F.J.; Marcos, A.T.; Martín, J.F. Exogenous Methionine Increases Levels of mRNAs Transcribed from pcbAB, pcbC, and cefEF Genes, Encoding Enzymes of the Cephalosporin Biosynthetic Pathway, in Acremonium chrysogenum. J. Bacteriol. 1994, 176, 985–991. [Google Scholar] [CrossRef]
  28. Demain, A.L.; Zhang, J. Cephalosporin C Production by Cephalosporium acremonium: The Methionine Story. Crit. Rev. Biotechnol. 1998, 18, 283–294. [Google Scholar] [CrossRef]
  29. Seiler, S.; Justa-Schuch, D. Conserved Components, But Distinct Mechanisms for the Placement and Assembly of the Cell Division Machinery in Unicellular and Filamentous Ascomycetes. Mol. Microbiol. 2010, 78, 1058–1076. [Google Scholar] [CrossRef]
  30. Harris, S.D. Septum Formation in Aspergillus nidulans. Curr. Opin. Microbiol. 2002, 4, 736–739. [Google Scholar] [CrossRef] [PubMed]
  31. Long, L.; Yang, J.; An, Y.; Liu, G. Disruption of a Glutathione Reductase Encoding Gene in Acremonium chrysogenum Leads to Reduction of its Growth, Cephalosporin Production and Antioxidative Ability which is Recovered by Exogenous Methionine. Fungal Genet. Biol. 2012, 49, 114–122. [Google Scholar] [CrossRef]
  32. Nagy, M.A.; Emri, T.; Fekete, E.; Sándor, E.; Springael, J.Y.; Penninckx, M.J.; Pócsi, I. Glutathione Metabolism of Acremonium chrysogenum in Relation to Cephalosporin C Production: Is γ-glutamyltransferase in the Center? Folia Microbiol. 2003, 48, 149–155. [Google Scholar] [CrossRef]
  33. Cohen, G.; Argaman, A.; Schreiber, R.; Mislovati, M.; Aharonowitz, Y. The Thioredoxin System of Penicillium chrysogenum and its Possible Role in Penicillin Biosysnthesis. J. Bacteriol. 1994, 176, 973–984. [Google Scholar] [CrossRef] [PubMed]
  34. Liu, L.; Long, L.K.; An, Y.; Yang, J.; Xu, X.; Hu, C.; Liu, G. The Thioredoxin Reductase-encoding Gene ActrxR1 is Involved in the Cephalosporin C Production of Acremonium chrysogenum in Methionine-supplemented Medium. Appl. Microbiol. Biotechnol. 2013, 97, 2551–2562. [Google Scholar] [CrossRef] [PubMed]
  35. Narasaiah, K.W.; Sashidhar, R.B.; Subramanyam, C. Biochemical Analysis of Oxidative Stress in the Production of Aflatoxin and its Precursor Intermediates. Mycopathologia 2006, 162, 179–189. [Google Scholar] [CrossRef] [PubMed]
Figure 1. The results of single-factor omission and PB experiments. (a) The CPC titer of each culture medium product in the first single-factor omission experiment; (b) the CPC titer of each culture medium product in the second single-factor omission experiment; and (c) the CPC titer of PB experiments. Using CPC titer as the response value in the PB experiment. Data represent the average values and standard deviations from three replicates.
Fermentation 11 00325 g001
Figure 2. The experimental results of BBD. (a) The concentration of each culture medium product in BBD; (b) the response surface three-dimensional figure of Maltose and DL-Methionine; (c) the response surface three-dimensional figure of DL-Methionine and Phytic acid; (d) the response surface three-dimensional figure of Maltose and Phytic acid; and (e) Titer curves of complex medium and optimized chemically defined medium. Data represented the average values and standard deviations from three replicates. The color on the three-dimensional surface transitions from blue to red, directly mapping the response values from low to high. The yellow region at the bottom represents the two-dimensional contour projection of the response surface onto the factor plane, consistent with the color gradient logic of the three-dimensional surface above.
Fermentation 11 00325 g002
Figure 3. The effect of methionine addition on CPC biosynthesis and differential expression analysis in transcriptome. (a) The effect of methionine on Ac-∆axl2::eGFP; (b) the effect of methionine on 1-D1. (c) Differential gene volcano diagram of D1_72 vs. metD1_72; (d) differential gene volcano diagram of D1_120 vs. metD1_120; (e) differential gene set GO annotation enrichment bubble map of D1_72 vs. metD1_72; and (f) differential gene set GO annotation enrichment bubble map of D1_120 vs. metD1_120. Data represent the average values and standard deviations from three replicates, using a ratio of expression levels greater than or equal to (|log2FC| ≥ 1) as the criterion for significant differences.
Fermentation 11 00325 g003
Figure 4. Transcriptional levels of metabolic genes. (a) Primary metabolism; (b) CPC biosynthesis gene clusters; and (c) chitin binding and chitin activity. HK: hexokinase; PGI: glucose-6-phosphate isomerase; PFK: 6-phosphofructokinase; FBA: fructose-bisphosphate aldolase; GAPDH: glyceraldehyde-3-phosphate dehydrogenase; PGK: phosphoglycerate kinase; SSADH: succinate-semialdehyde dehydrogenase; PD: Pyruvate dehydrogenase; CYCS: Cysteine synthase; CBL: Cystathionine beta-lyase; MHM: homocysteine methyltransferase; SAMS: SAM synthase; AHS: adenosylhomocysteinase; CBS: cystathionine beta-synthase; CGL: cystathionine gamma-lyase; red font: upregulated genes; blue: downregulated genes; and yellow highlight: precursors of CPC biosynthesis. Data represent the average values and standard deviations from three replicates.
Fermentation 11 00325 g004
Table 1. The analysis of PB design.
VariableStandardized EffectsContributionp-Value
Model 0.0251significant
Maltose0.899122.290.0056
Glucose0.761716.000.0090
Lactic acid0.46886.060.0335
Phytic acid−0.809318.060.0076
KH2PO4−0.07220.140.6056
(NH4)2SO40.26771.980.1227
DL-Methionine0.853320.080.0065
L-Aspartic acid0.36823.740.0608
L-Threonine−0.07340.150.5998
L-Serine0.21431.270.1863
L-Tyrosine0.17960.890.2480
Biotin0.18130.910.2444
MgSO4·7H2O0.31892.800.0847
CaCO3−0.21951.330.1788
Soybean oil−0.13840.530.3508
Trace element−0.29992.480.0968
Table 2. The analysis of BBD.
Coefficient EstimateF-Valuep-Value
Model 47.87<0.0001significant
A-Maltose0.137450.120.0002
B-Phytic acid0.04695.840.0464
C-DL-Methionine0.04595.600.0499
AB−0.00170.00400.9514
AC−0.07317.100.0323
BC0.01360.250.6342
A2−0.3945217.55<0.0001
B2−0.234977.11<0.0001
C2−0.158735.210.0006
Lack of Fit 3.960.1085not significant
Disclaimer/Publisher’s Note: The statements, opinions and data contained in all publications are solely those of the individual author(s) and contributor(s) and not of MDPI and/or the editor(s). MDPI and/or the editor(s) disclaim responsibility for any injury to people or property resulting from any ideas, methods, instructions or products referred to in the content.

