Article

Improving Biogas Production and Organic Matter Degradation in Anaerobic Co-Digestion Using Spent Coffee Grounds: A Kinetic and Operational Study

by
Khalideh Al bkoor Alrawashdeh
1,
La’aly A. Al-Samrraie
2,*,
Rebhi A. Damseh
1,
Abeer Al Bsoul
3 and
Eid Gul
4,*
1
Mechanical Engineering Department, Al-Huson University College, Al-Balqa’ Applied University, P.O. Box 50, Al-Huson, Irbid 19117, Jordan
2
Water and Environmental Engineering Department, Al-Huson University College, Al-Balqa’ Applied University, P.O. Box 50, Al-Huson, Irbid 19117, Jordan
3
Chemical Engineering Department, Al-Huson University College, Al-Balqa’ Applied University, P.O. Box 50, Al-Huson, Irbid 19117, Jordan
4
Department of Mechanical Engineering, Northern Illinois University, DeKalb, IL 60115, USA
*
Authors to whom correspondence should be addressed.
Fermentation 2025, 11(6), 295; https://doi.org/10.3390/fermentation11060295
Submission received: 16 April 2025 / Revised: 17 May 2025 / Accepted: 19 May 2025 / Published: 22 May 2025
(This article belongs to the Special Issue Anaerobic Digestion: Waste to Energy: 2nd Edition)

Abstract

:
This study evaluates the potential of spent coffee grounds (SCGs) as a co-substrate to improve anaerobic co-digestion (AcD) performance, with a focus on biogas yield, methane (CH4) content, and the removal of volatile solids (VS) and total chemical oxygen demand (TCOD). Biochemical methane potential (BMP) tests were conducted in two stages. In Stage I, SCGs were blended with active sludge (AS) and the organic fraction of municipal solid waste (OFMSW) at varying ratios. The addition of 25% SCGs increased biogas production by 24.47% (AS) and 20.95% (OFMSW), while the AS50 mixture yielded the highest methane yield (0.302 Nm3/kg VS, 66.42%). However, SCG concentrations of 75% or higher reduced process stability. In Stage II, we evaluated the impact of mixing. The AS25 configuration maintained stable biogas under varying mixing conditions, showing system resilience, whereas OFMSW25 showed slight improvement. Biogas production kinetics were modeled using modified Gompertz, logistic, and first-order equations, all of which demonstrated high predictive accuracy (R2 > 0.97), with the modified Gompertz model offering the best fit. Overall, SCGs show promise as a sustainable co-substrate for the improvement of methane recovery and organic matter degradation in AcD systems when applied at optimized concentrations.

1. Introduction

The annual consumption of coffee in Jordan is approximately 3.3 kg per person, an amount that has been constantly rising [1,2]. In light of this, the amount of spent coffee grounds (SCGs), the solid residue that remains after brewing, has steadily increased. Around eight million tons of SCGs are produced annually worldwide, according to estimates [3]. Due to the high oxygen consumption during the breakdown of this readily degradable organic matter and the possible release of leftover polyphenols and tannins, improper management of SCG might result in significant pollution [3,4,5,6]. SCG management has therefore also become more challenging. The majority of SCGs are now thrown away as refuse, while some countries use them as a mushroom cultivation medium [5] or as boiler fuel after drying [3]. Anaerobic digestion (AD) has been used to methanize biowaste such as wastewater [7,8], animal manure [9], olive mill wastewater [10,11,12], organic fraction municipal solid waste [13], and SCGs under various operating conditions [14,15,16,17,18]. However, the mono-substrate AD of SCG, in early investigations, was thought to have a restriction in terms of its long-term stability [19]. These early investigations also supplemented the reactors with heavy metals and nutrients such as phosphorus and nitrogen to improve AD stabilization [20]. A recent solution to this issue has been shown to be co-digestion with various substrates, including organic waste, manure waste, agro-waste, and sewage sludge, with varying operating conditions [19,20,21].
According to previous studies [15,16,17,18], co-digestion performs better than mono-digestion. SCG mono-digestion tends to fail, even when nutrients and alkalinity are utilized [19,21]. By addressing the trace element shortage, reducing the buffering capacity and the inhibitory parameters, and adjusting the C/N ratio as required by the AD process, a co-digestion technology can improve the process’s potential and stability [14,22]. Selecting the optimal co-substrate and mixing ratio is crucial for maximizing AD performance [7,9,23]. In methods that do not require additional additives and nutrients [12,13], which are beneficial for field applications in terms of operational convenience, this is especially problematic.
Sossa [24] achieved 0.81 m3/kg VS (68% CH4) using a mixture of 3% washing water, 7% pulp, and 90% mucilage for semi-continuous AD. CH4 yields of 294.5 and 244.7 L/kg VS were reported by Chala et al. [25] from mucilage and pulp coffee, respectively. Selvamurugan et al. [26] created an integrated system that uses aeration and bio methanation to treat wastewater from coffee. Using an up-flow anaerobic hybrid reactor and choosing 18 h as the optimal duration of HRT, a 490 L biogas/kg DVS (61% v/v CH4) was obtained with a biogas generation of 1.335 L/L d. Qiao et al. [6] attempted to ferment coffee waste in a continuous manner and under thermophilic conditions. Initially, a high biogas production of 1.5 L/L d was achieved, with 60% of CH4. Then, as a result of the formation of VFA in the reaction medium and the deficiency of nitrogen in the substrates of coffee waste, the process performance declined. In order to solve this issue, Hernandez et al. [27] mixed coffee waste with swine manure to increase the AD stability for hydrogen (H2) production. This resulted in a high H2 generation of roughly 3.8 L H2/L d and an ideal C/N ratio of 60. Additionally, Abouelenien et al. [28] used chicken manure and other agricultural residues to digitate with the addition of coffee waste. When compared with control fermentation, the CH4-produced results were found to be improved two fold.
The most frequently used kinetic models for illustrating the formation of CH4 from biomass in AD are the modified Gompertz and logistic equations [29,30,31]. To fit experimental datasets from vinasse [32], cattle manure [33], municipal solid waste [34], and active sludge [23], a number of studies used the modified Gompertz model. Similarly, several substrates have also been used with modified logistic models [30,31]. Kim et al. [29] used the Gompertz model to study the yield of biogas and CH4 from the co-digestion of SCG with different types of bio-waste. Food waste had the highest CH4 yield (0.355 L CH4/g VS), according to the study, while waste-activated sludge (WAS) had the lowest because of its poor biodegradability.
According to Li et al. [30], CH4 production was increased by 1.5 times at thermophilic digestion (55 °C) as compared with mesophilic digestion (35 °C). For WAS, CH4 yields rose by 35.8–48.2%, whereas for SCGs, they fell by 57.9–76.3%. In thermophilic digestion, acetogenesis was a limitation process; in mesophilic digestion, rates were restricted by acidogenesis and hydrolysis. At temperatures of 21 °C, 30 °C, and 37 °C, Chala et al. [31] assessed the CH4 production from coffee husk, pulp, and mucilage. The mixture had the largest specific CH4 yields at 37 °C, with 159.4, 244.7, and 294.5 L/kg VS, respectively. Two kinetic models to estimate CH4 yield for temperatures between 21 °C and 37 °C were provided by the modified Gompertz model and the modified logistic model, which both correctly estimated CH4 yields (R2 > 0.987). Before AD, Atelge et al. [35] investigated the extraction of oil as a pre-treatment for SCG and assessed co-digestion with glycerin, macroalgae, and spent tea waste. The maximum CH4 yield (336 ± 7 mL CH4/g VS) was obtained by the mono-digestion of extracted SCG, and this yield increased as the SCG ratios in co-digestion increased. The highest removal rates for TS (32.1%) and VS (35.5%) were observed in extracted SCG. Mixing extracted SCG and spent tea waste produced better yield than other mixtures, according to a regression model. A BMP determination for organic waste is important [36,37,38,39,40,41,42,43,44,45], as substrate characteristics greatly affect AD. The ratio of substrate to inoculum (S/I) for various organic wastes has been studied specifically. This ratio can be expressed as VS in substrate per VS or volatile suspended solids (VSS) in inoculum. According to Sharma and Jain [45], the optimum S/I ratio in terms of CH4 production is 1:1 for the AcD of different biowastes.
This study assesses the potential of SCGs in various ratios using AcD with co-substrates of the organic fraction of municipal solid waste (OFMW) and active sludge (AS) through biochemical methane potential (BMP). The AcD with SCG was performed in previous studies without identifying the optimum mixing ratio in terms of AcD stability and reduction efficiency of VS and TCOD in BMP. Additionally, these studies investigated the optimum mixing rate with the optimum mixing ratio of substrate. Moreover, three different kinetic models were used to predict biogas yield—modified Gompertz, logistic, and first-order models—combining SCG with AS and OFMSW as co-substrates. Prediction accuracy was also determined using statistical parameters and model coefficients.

2. Materials and Methods

2.1. Substrates

The OFMSW was created using synthetic household waste, which was prepared (moist manner) as the following: 50% of fruit and vegetable waste, with the remaining portion comprising 10% pasta and bread, 10% paper, 10% meat and fish, 10% rice and biscuit, and 10% spent tea grounds [13]. According to OFMSW characterization investigations, the appropriate substrate was created with a VS/TS ratio of 74.34%, which is identical to the optimum ratio needed by AD microorganisms [13,36,37].
Active sludge (AS) was extracted from the secondary sludge of a wastewater treatment plant (WWTP) in central Irbid, which is located northwest of Irbid. The plant was constructed with a flow rate of 11,300 m3/day. The plant’s exterior hydraulic load was 8276.9 m3/d, whereas its actual load was roughly 8635.1 m3/d. Until it was prepared for use, the AS was kept at 4 °C. An inoculum from an earlier experiment was digested and employed in this procedure [23].
The SCGs were collected in equal proportions from Turkish coffee leftovers (home-brewed), espresso coffee, and Turkish coffee from a coffee shop. An amount of 100 g of SCGs (65% wet basis) was mixed with 30 mL of water in order to achieve more than 90% wet basis.

2.2. Analytical Methods

As stated in UNI 5667–13/2000 [46], the substrates of SCGs, OFMSW, and AS were prepared in accordance with the methodology described by Alrawashdeh et al. [7] in order to perform AD testing. The ultimate and proximate analysis of the substrates were assessed using a thermogravimetric analyzer (TGA 701, LECO, St. Joseph, MI, USA). According to [38,39], the proximate analyses included total solid (TS); fixed carbon (F.C.); ash, which displays the free carbon remains; humidity (U), achieved by heating to 100 °C; and volatile solid (VS), upon heating to 550 °C. In compliance with ASTM D5373 [24,47], a Leco TruSpec CHN analyzer (LECO CR-412, Joseph, MI, USA) was used to conduct the final analysis of total carbon, hydrogen, and nitrogen. Calorimetric measurements based on the 4500-P, C technique was used to determine the phosphorus concentration [39].
The standard method 4500-NH3 was used to determine the sample’s concentration of ammonia (NH3). A process of reaction utilizing 2,6-dimethylphenol was performed on the undigested substance to determine its initial nitrate level. Next, a particular equation, as follows, was used to determine the total amount of Kjeldahl nitrogen:
Total Kjeldahl Nitrogen= (TN) − (Nitrate + Nitrite)
Table 1 reveals the substrates’ properties. The co-digestion of SCGs with OFMSW and AS substrates at a certain ratio can assist in achieving the appropriate C/N ratio, which is in the range of 20 to 30 [40]. Methods 2320B, 4500, 3125, and 4500-P from the standard methods for the analysis of wastewater [41] were used to estimate the phosphorus contents, and method 6420 was used to detect phenol concentration. The substrate was mixed using a magnetic stirrer in accordance with Alraashdehet al. [42]. APHA standard methods were used to measure COD for both soluble COD (SCOD) and total COD (TCOD) [43]. A thermos reactor, AL125-AQUALYTIC (AQUALYTIC, a division of Tintometer GmbH, Dortmund, Germany), was used to quantify TCOD.
Gas chromatography (GC) was utilized to quantify volatile fatty acids (VFAs). A 25-m long, 0.25 mm diameter ChrompackTM CPSIL-5CB column (Agilent Technologies, Santa Clara, CA, USA) was used for the GC analysis. Injection of 0.5 L of the screened sample with 10% (v/v) formic acid (PanreacTM) was carried out using an injector that was set to 300 °C. The makeup gases were nitrogen and helium, the carrier gases. The temperature program that was used started at 70 °C for one minute and increased to 100 °C for two minutes at a rate of 20 °C per minute. The temperature was then raised to 140 °C, where it was maintained for three minutes at a rate of 10 °C per minute. This process was carried out in accordance with the methods outlined by Beo et al. [44].
The Agilent 490 Micro gas chromatograph (Agilent Technologies Inc., Santa Clara, CA, USA) was used to evaluate the biogas sample in compliance with described protocols [7]. Excess biogas was frequently evacuated during the analysis procedure to maintain safety and avoid any possible pressure-related errors. Utilizing a portable pH meter (Model HI9819, Hanna Instruments, Woonsocket, RI, USA) with double connection pH electrodes, the samples’ pH levels were determined in accordance with accepted standard practices [11].

2.3. Experimental Setup

2.3.1. Biochemical Methane Potential (BMP) Test: Optimum Mixing Ratio

In the first set, the substrate was employed in several mixing ratios (wt%, wet base), including SCG to OFMSW, which were 75:25 (OFMSW25), 50:50 (OFMSW50), and 25:75 (OFMSW75), respectively. As reported in Table 2, the VS/TS ratio for all tests was higher than 74% and the humidity was more than 90%, as required by the AcD process. During the second set, the mixture of SCG and AS was performed in the following mixing ratios (wt%, wet base): 75:25 (AS25), 50:50 (AS50), and 25:75 (AS75). The inoculum to co-substrate was implemented at 1:1 g VS inoculum/g VS for all tests to provide sufficient bacteria during the startup of BMP tests, as recommended by Sharma and Jain [45].
Up to 20% of the volume of each BMP test was filled with different mixing ratios in addition to the inoculum, as recommended by Alrawashdeh et al. [7]. Additionally, control tests were carried out with 100% AS and 100% OFMSW to assess the performance of SCG as a co-substrate. For increased precision and reliability, a triplicate of each experiment was conducted to ensure accuracy and reliability. The tests of BMP were carried out in a one-liter vessel conducted with two subside holes: one for pH measurement and adjustment and one for sample collection. Biogas flows through the main hole via a tube that passes through the rubber stopper, which is tightly sealed. All digesters were sealed after being filled with nitrogen gas (N2) to eliminate any air from the headspace. After that, each reactor was put in an incubator that was regulated to 38 ± 0.2 °C (mesophilic condition). As stated in [23], a 0.5 L gas-collecting bag attached to a thermocouple and a pressure gauge was fixed into the main opening of each BMP test vessel. For all tests, a manual shake was performed once a day for 1 min to ensure mixing and prevent creation of an insulating layer. This mixing level was adopted to simulate the simple mixing conditions recommended by previous studies, such as that of Kariyama et al. [48], which indicated 28 rpm as a low mixing model, with a frequency of approximately 60–70 hand movements per minute (equivalent to a frequency of approximately 1–1.2 Hz), and a gentle mixing force of approximately 0.5–1 N per mixing batch.
Several factors were investigated in order to determine the optimum mixing ratio with respect to the stability of the AcD process, retention time, reduction efficiency of VS, VFA and TCOD, biogas generation, and CH4 concentration. The amount of biogas produced each day was estimated utilizing temperature and pressure values.
The inoculum and mixture for co-digestion occupied about 20% of the volume of each reactor [49]. Following vessel loading, the substrates were first adjusted to a pH range of around 7.0 ± 1.0. A controlled dose of KOH was added to each vessel every three days to counteract the impact of the increased acidity. It took at least 30 days for the biogas generated to drop below 1% of the total biogas accumulation, per Alrawashdeh et al. [50].

2.3.2. Biochemical Methane Potential (BMP) Test: Optimum Mixing Rate

The ideal mixing ratio was applied with an optimum mixing ratio of co-substrate at this stage. Six 3 L BMP tests, utilizing the same configuration as that of the 1 L test described in the previous section, were used to investigate the effect of the mixing mode. The mixing rates were implemented using magnetic stirrers. The digester filled up to 20% of the vessel volume and the optimum mixing ratio was performed given an S/I ratio of 1:1.
Two mixing modes were performed: a low mixing rate of 24 rpm, as recommended by Kariyama et al. [48], and a high mixing rate of 60 rpm, as recommended by Singh et al. [51]. The inoculum-to-mixture ratio was the same as implemented in the previous section.
Four parameters were assessed to evaluate digester performance: removal efficiency of TS, removal efficiency of VS, CH4 concentration, and biogas production. A mesophilic temperature of 38 °C was implemented for all bio-reactions.

2.4. Kinetic Study

In this form of study, the kinetic modeling of CH4 and biogas yield production from an experimental assessment of biomasses is becoming increasingly common [29,30,31,32,51,52]. AD has been well described with a number of kinetic models. For this research, modified Gompertz, first-order, and logistic models were chosen to simulate the production of biogas and CH4 in the BMP-MM biodigester. According to [14,51,52,53], Equations (2)–(4) depict these models. These models were also utilized to assess the kinetic parameters (S, Rm, λ, K, t, e) that were applied to the AcD process. Kinetic models (such as Gompertz, first-order, and logistic) represent the different biological phases within anaerobic digestion, including the lag phase, exponential bacterial growth, and production rate limits resulting from substrate saturation, thus mathematically reflecting the relationship between the rate of biodegradation and the rate of biogas production.
Modified Gompertz (Equation (2)), first-order (Equation (3)), and logistic (Equation (4)) models were developed to reflect a microorganism’s growth rate and are the most commonly used models for assessing the kinetics of CH4 production [54]. The modified Gompertz equation is typically used to determine the decomposition of substrates of organic material [55].
S ( t ) = S   e e ( e   R m S λ t + 1 )
S ( t ) = [ 1 e ( k t ) ]
S ( t ) = S 1 + e ( 4 R m λ t S + 2 )
where S(t) is the accumulative of biogas/CH4 production (Nm3/kg VS); S is the biogas/CH4 potential of the substrate (Nm3/kg VS); Rm is the maximum biogas/CH4 production rate (Nm3/kg VS); k is the constant of the first-order disintegration rate; λ is the lag phase; and t is the time (day).
To determine kinetic parameters for each test, the results of experiments on the cumulative production of biogas and substance concentration in Equations (2)–(4) were fitted with a non-linear curve that fits the MATLAB toolbox (R2012a). Based on this investigation, the statistical parameters coefficient of determination (R2) and root mean square error (RMSE) were computed. Additionally, AdjR2 and sum square error (SSE) were calculated simultaneously to determine the correlation between the experimental data and models, according to Equations (5)–(8) [17,56].
R M S E = i = 1 N ( S e x p , i S m o d , i ) 2 N
S S E = i = 1 N ( S e x p , i S m o d , i ) 2
R 2 = 1 i = 1 N ( S e x p , i S m o d , i ) 2 i = 1 N ( S e x p , i m e a n ( S e x p ) 2 )
A d j u s t e d   R 2 = 1 ( 1 R 2 )   ( n p n p 1 )

3. Results and Discussion

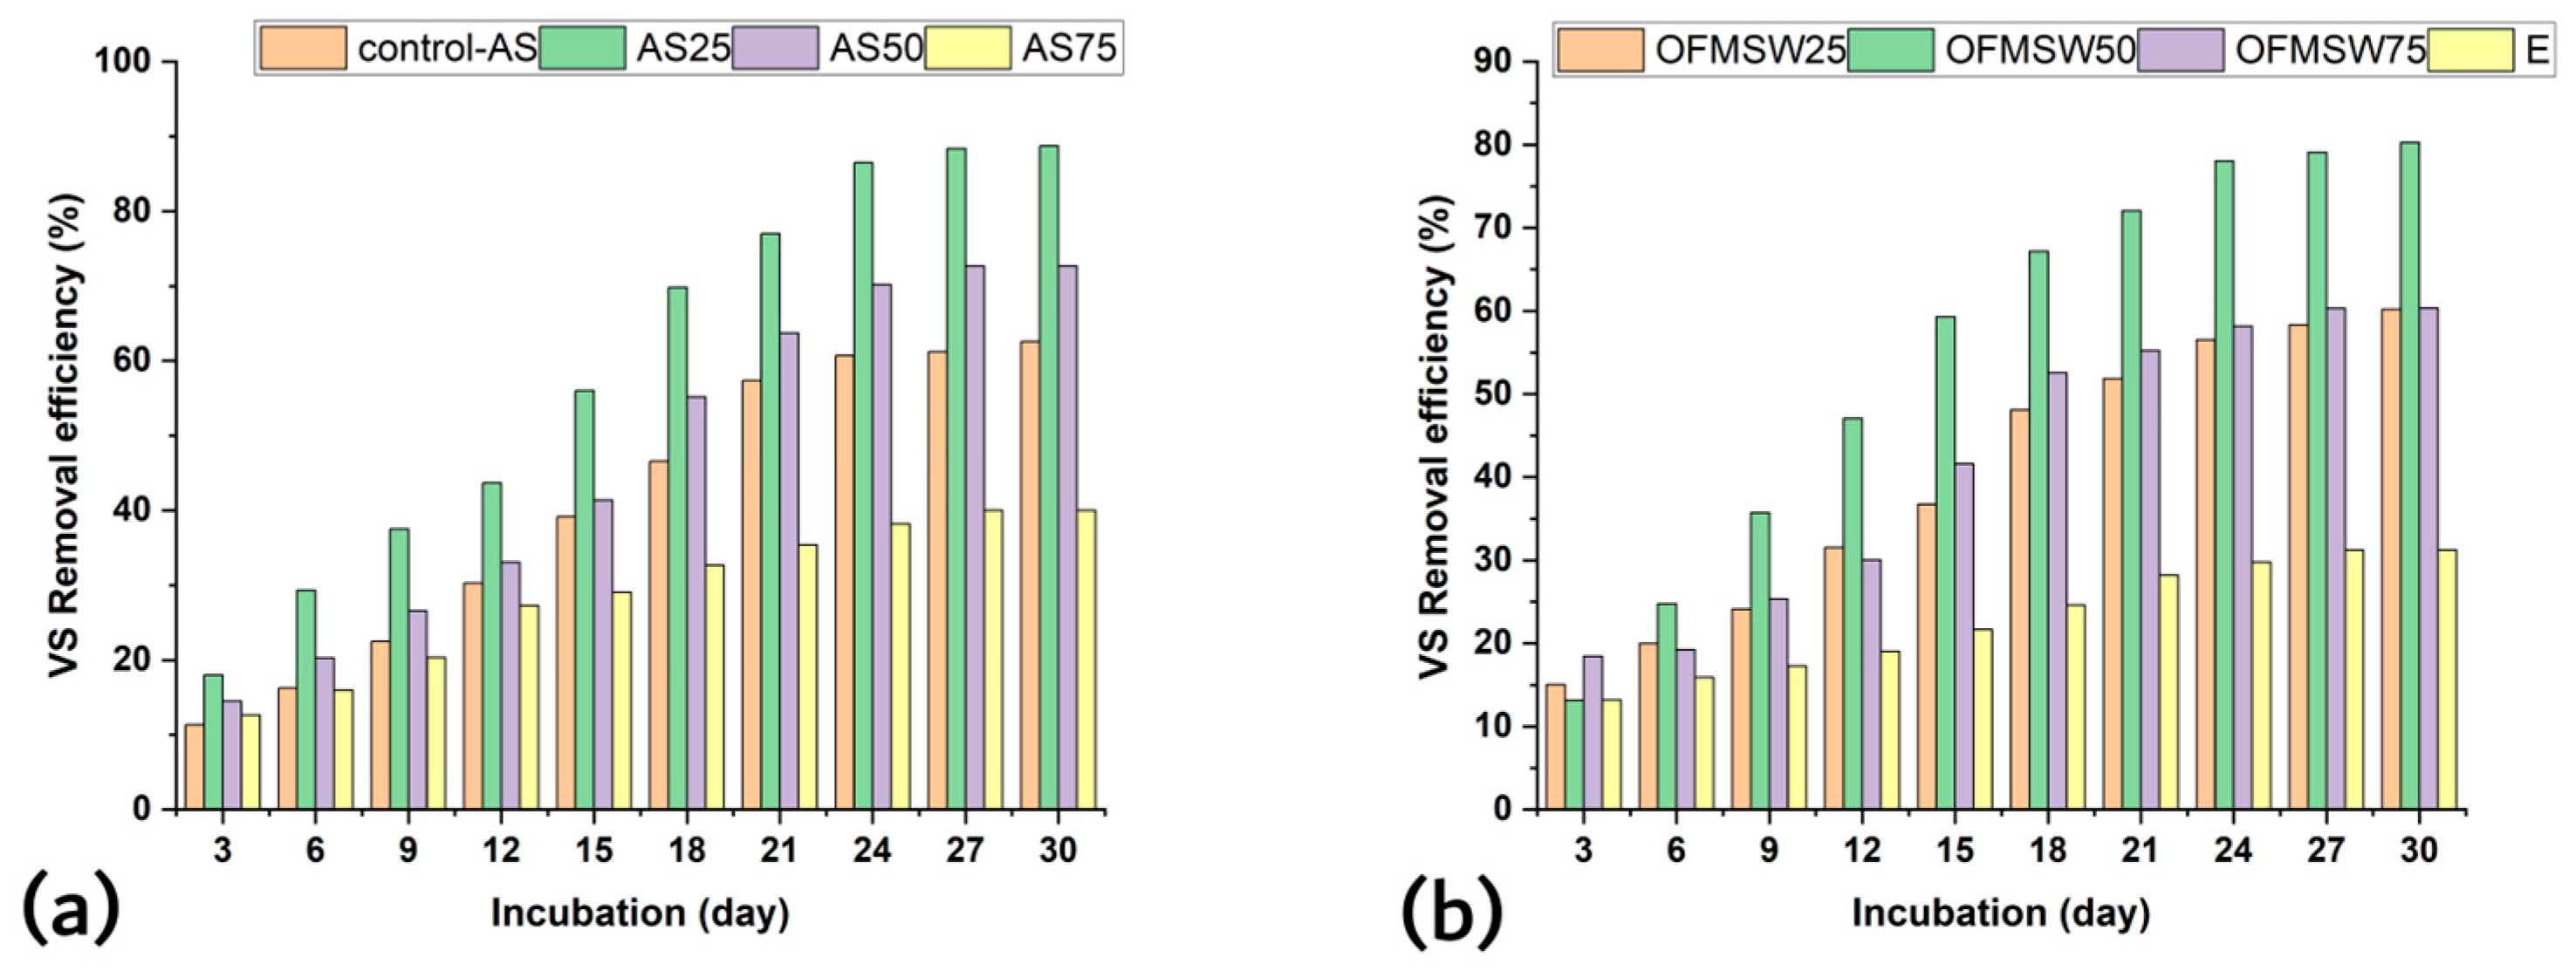
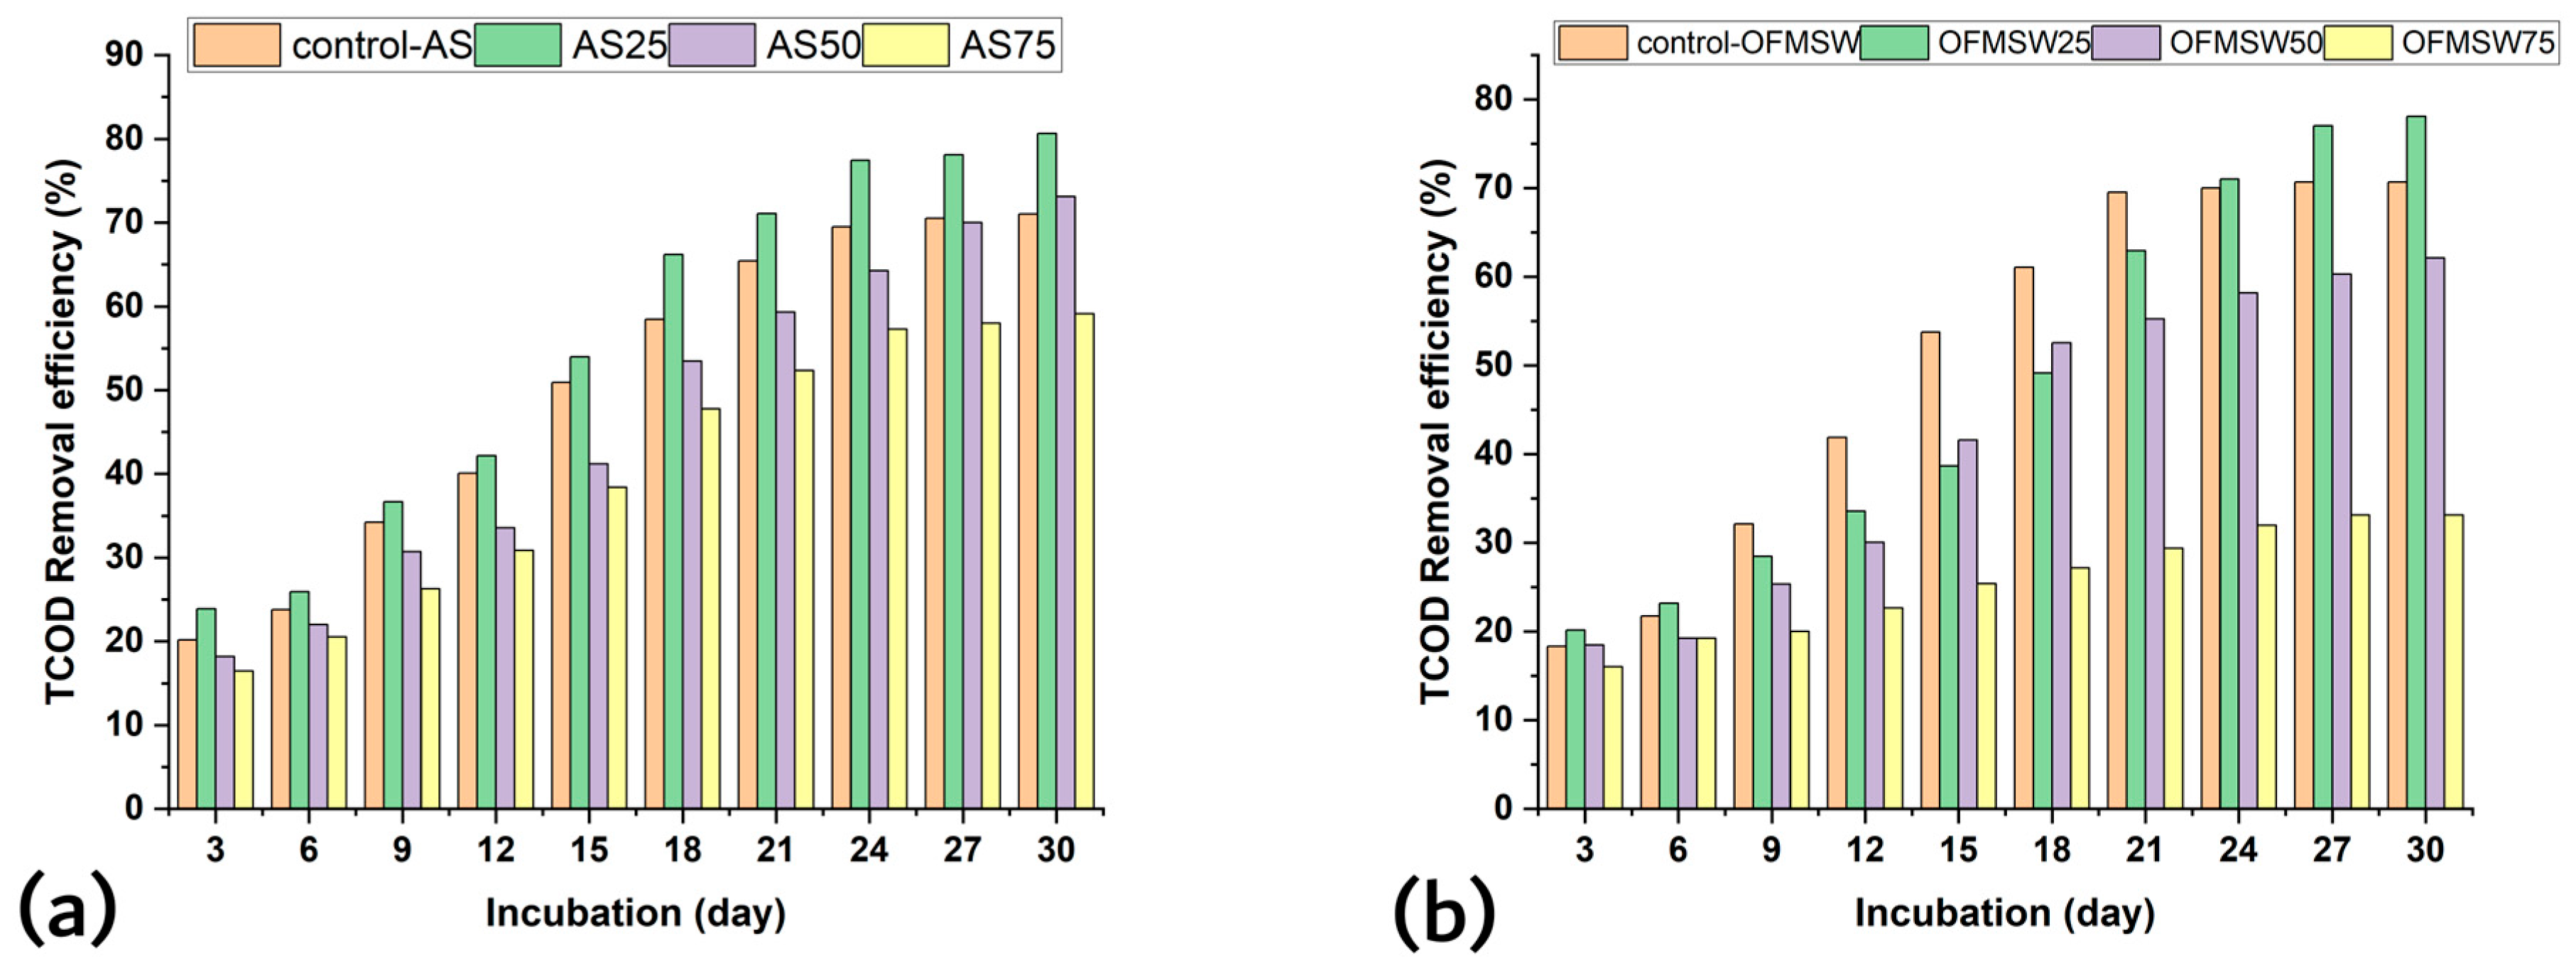
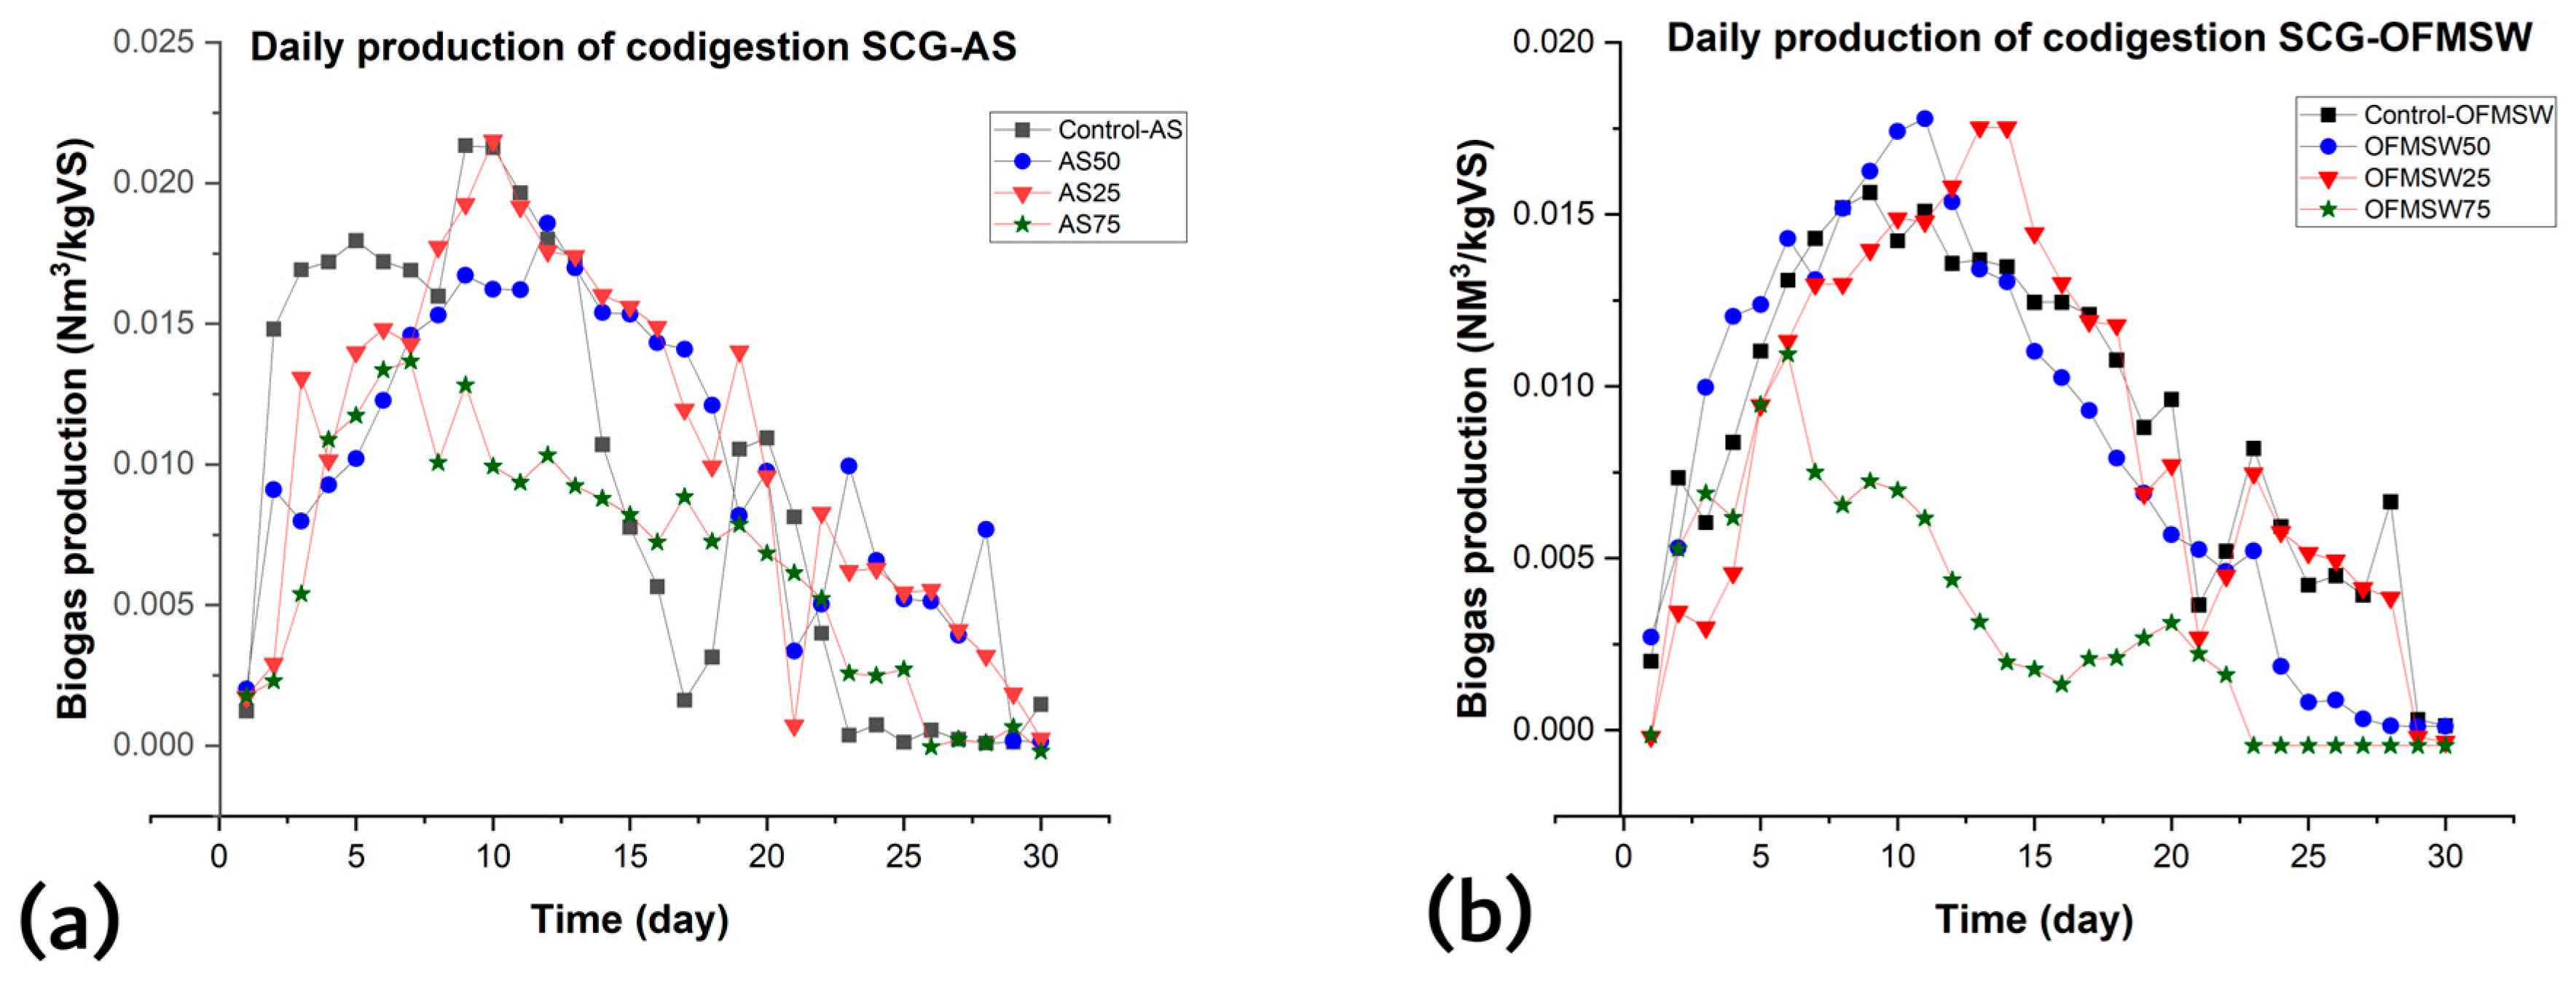
3.1. Experimental Performance of BMP Test: Effect of SCGs as Co-Substrates

All substrate mixtures had a VS/TS with more than a 72% fit for the range that has been recommended by the literature [57,58]. A high concentration of contaminants may prevent degradation of the AS and OFMS substrates, where the phenol concentrations were 7.943 ± 0.73 mg/L and 6.748 ± 0.66 mg/L, respectively. Of all of the mixtures, only the C:N ratios of AS25 and OFMSW25 fell within the range typically suggested to be optimal in the literature [14,22].
The BMP-MM test results for SCGs as co-substratum with AS and OFMSW in varying mixing ratios are shown in Figure 1. When compared with the AS and OFMSW control test, co-digestion of AS25 and OFMS25 produced biogas with the greatest CH4 content and a maximum removal efficiency of VS (%). The removal efficiency of VS was 88.68%, 72.63%, 40%, 80.26%, 60.20%, and 31.23% for AS25, AS50, AS75, OFMSW25, OFMS50, and OFMSW75, respectively.
These findings match the ideal amounts required by the AcD process, as determined by VS/TS (%) and C:N. In general, applying 25% SCGs and 50% SCGs to the substrate improved the performance of BMP testing. In contrast, OFMSW75 had the worst performance, followed by AS75.
The results reveal that AS25 achieved 26.12 increments in VS (%) removal with respect to AS control test and that 20.6 was achieved by OFMS25 when compared with OFMSW control test. This indicates that adding 25% SCG as a co-substrate increased the rates at which volatile solids were degraded, improving the decomposition of organic waste. Nevertheless, the removal efficiency was comparatively reduced at high SCG concentrations, which may indicate bacterial inhibition or system saturation at higher concentrations [30]. Additionally, inhibiting substances were observed such as accumulated volatile fatty acids (VFAs). The same results have been observed by Kim et al. [29]. According to Figure 1, the VS was considerably decreased during digestion when the SCG ratio was higher than 50%.
Based on the results obtained in the study, it can be concluded that the inhibition resulting from the accumulation of organic matter in the digestive system was most pronounced when the SCG content was 75%. Volatile fatty acids (VFAs) accumulated in the system at levels as high as 4000 mg/L, resulting in a pH drop below 6.0, negatively impacting the microbial activity of methanogenic bacteria. Furthermore, the accumulation of phenolic compounds, such as the caffeine and tannins in SCG, which can reach 0.4% of the dry weight of the residue, inhibited bacterial growth, reducing the effectiveness of anaerobic digestion. Furthermore, when the SCG content exceeded 50%, the accumulation of soluble organic matter (SCOD) reached 5000 mg/L, causing digestion failure and negatively impacting process efficiency. Increased concentrations of these compounds interact with other organic compounds and affect the nutrient balance required by bacteria, including the carbon to nitrogen (C:N) balance. In this context, when the optimal C:N ratio exceeds the range of 20:1 to 30:1, this can cause biogenic nitrogen deficiency, inhibiting the growth of methanogenic microorganisms and leading to reduced digestive system performance.
As shown in Figure 2, a vital metric for measuring AD effectiveness is TCOD removal efficiency, which measures the degree of organic matter decomposition into biogas [14,34]. AcD’s performance with respect to SCG potential was evaluated by comparing its removal efficiency with controls (control-OFMSW and control-AS). The removal efficiency of TCOD was 80.65%, 73.09%, 59.1%, 78.09%, 62.12%, and 33.12% for AS25, AS50, AS75, OFMSW25, OFMS50, and OFMSW75, respectively. Across the majority of incubation durations, the data show that the highest TCOD removal efficiencies and SCOD conversion, when compared with control tests, were achieved by AS25 (increment of 9.63) and OFMSW25 (increment of 7.39). Given their improved performance, AS25 and OFMSW25 appear to have offered the best possible compromise between substrate availability, minimized inhibitory effects, and improved microbial activity. TCOD removal efficiencies showed a substantial increase in the first 15 days across all configurations, followed by a plateau phase. This is indicative of the rapid breakdown of easily degradable organics during the hydrolysis and acidogenesis phases. Methanogenesis plateaus at the slowest step when complex molecules are broken down into CO2 and CH4 [10,27,29,30,31,32]. In AS25 and OFMSW25, higher TCOD removal efficiency is associated with greater biogas output because organic matter is effectively degraded. Insufficient removal efficiency, such as 75% of SCGs, might result in decreased CH4 production due to acidic pH levels or bacterial inhibition. In contrast to 25% of SCGs, which show underloading, AS75 and OFMSW75 show high substrate loading, which might lead to system imbalance.
According to Figure 3, which depicts the concentration and conversion of SCOD during the test period, all tests showed an increase in concentration prior to day 9, peaking among days 9 and 12. While SCOD continued to rise without decreasing for the higher SCG concentrations, it started to fall for the lower SCG concentrations. This trend implies that the rate of hydrolysis peaked on day 9 at lower SCG concentrations, after which the production of CH4 increased. On the other hand, high SCG concentrations showed VFA accumulation, unstable CH4 generation, and low performance [32]. The obtained results agree with previous literature [30,36].
It was observed that, for the AcD of the SCG-AS mixture, among all mixing ratios, AS25 had the highest biogas recorded in the BMP digester. Similarly, the lowest performance in all BMP occurred during AS75. For AS50, biogas production was enhanced but at a low rate. As illustrated in Figure 4, the same trends were observed for the AcD process of SCG-OFMSW co-digestion: OFMSW25 had the highest production, and the lowest resulted from OFMS75. For AS50, biogas production was enhanced but at a low rate.
Figure 4a shows that the control test had two production peaks during the test and that it had high production. However, CH4 concentrations were modest prior to day 9. After day 9, test AS25 was the most productive, but after day 12, it started to show irregularities. On day 20, it reached its lowest productivity. Following a brief recovery, substrate stabilization caused it to drop. Test AS75 performed well until day 8, at which point production dropped, indicating a decline in bacterial activity and the appearance of intolerable ammonia concentrations. Co-digestion SCG-OFMSW tests, on the other hand, showed an increase in production in every test up to day 21 at different rates. Following that, a dramatic drop was noted, and tests OFMSW50 and OFMSW75 showed signs of digestive failure as shown in Figure 4b.
These results suggest that lower SCG (co-substrate) addition positively impacted AcD performance. As revealed in the biogas yields (% CH4) achieved by control AS, AS25, AS50, and AS75 were 0.282 Nm3/kg VS (65.03%), 0.351 Nm3/kg VS (68.53%), 0.302 Nm3/kg VS (66.42%), and 0.22 Nm3/kg VS (60.21%), respectively. The AcD performance was enhanced by 24.46%, with 6.74% achieved by the AS25 test and AS50, while AS75 caused a performance decrease of 21.19%, reflecting a failure in digestion, which can be attributed to multiple reasons: insufficient C:N ratio and VFA accumulation, which resulted in SCOD concentration and high load of SCG.
The potential of SCG-OFMSW co-digestion was 0.272 Nm3/kg VS (64.38%), 0.329 Nm3/kg VS (67.19%), 0.249 Nm3/kg VS (54.98%), and 0.134 Nm3/kg VS (45.00%). OFMSW25 improves biogas and CH4 by 20.96% and 4.36%, respectively, compared with the control test. The substrate potential of OFMS50 and OFMS75 led to a decrease in biogas production of 8.46% and 50.74%, respectively. This failure can be attributed to several factors, including an insufficient C:N ratio; an accumulation of VFA, resulting in a high SCOD concentration; and an excessive load of SCG.
SCG is regarded as an abundant lipid. Lipids are organic contaminants that can slow the AD process, but which may also contribute to an increase in CH4 yield [59]. According to Kampioti et al. [17], the co-digestion of coffee waste (CW) with AS increased biogas production by 12%, and CW alone had a negative impact on the AD process. Also, the study suggested that the highest yield of biogas was achieved at the lowest CW concentration, and these results are in line with this study’s results. Kim et al. [60] tested co-digestion SCG with food waste; their results reveal that SCG caused performance decline when added at a 10:1 ratio. Conversely, Vítěz et al. [61] investigated the AD of SCG alone, showing its potential for the management of waste and biogas production by producing CH4 in a range of 0.271 to 0.325 m3/kg dry organic matter.

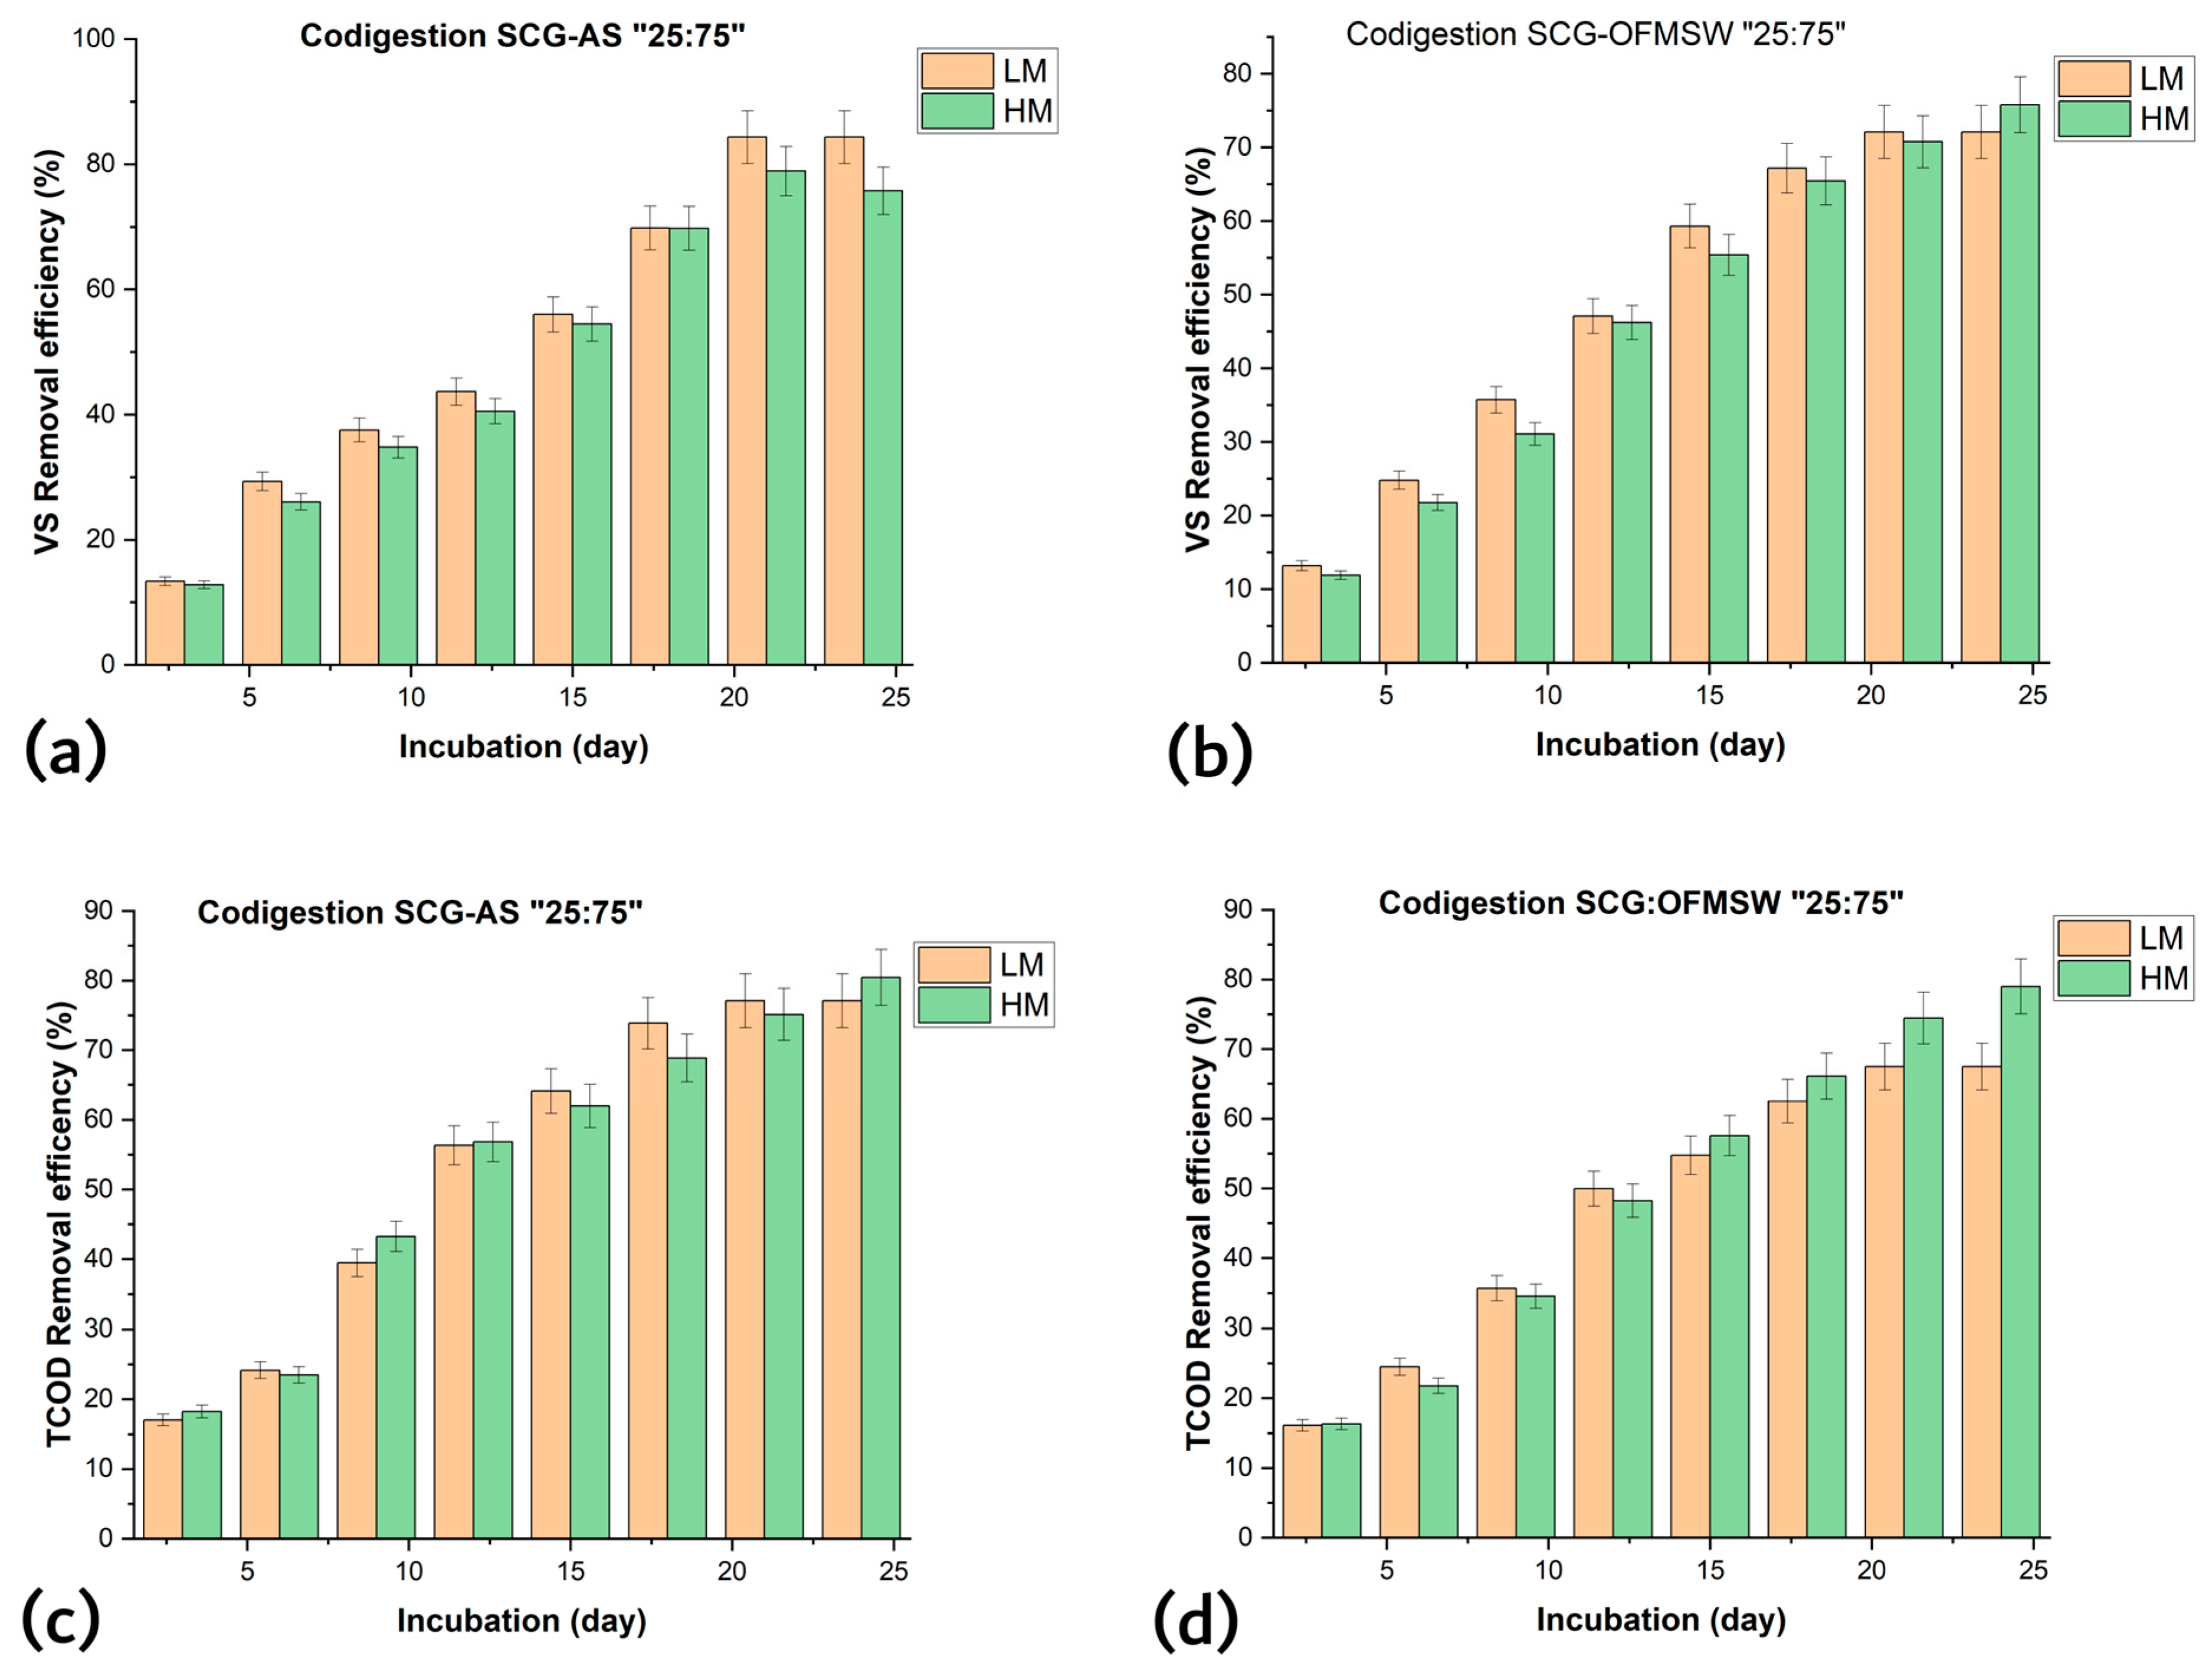
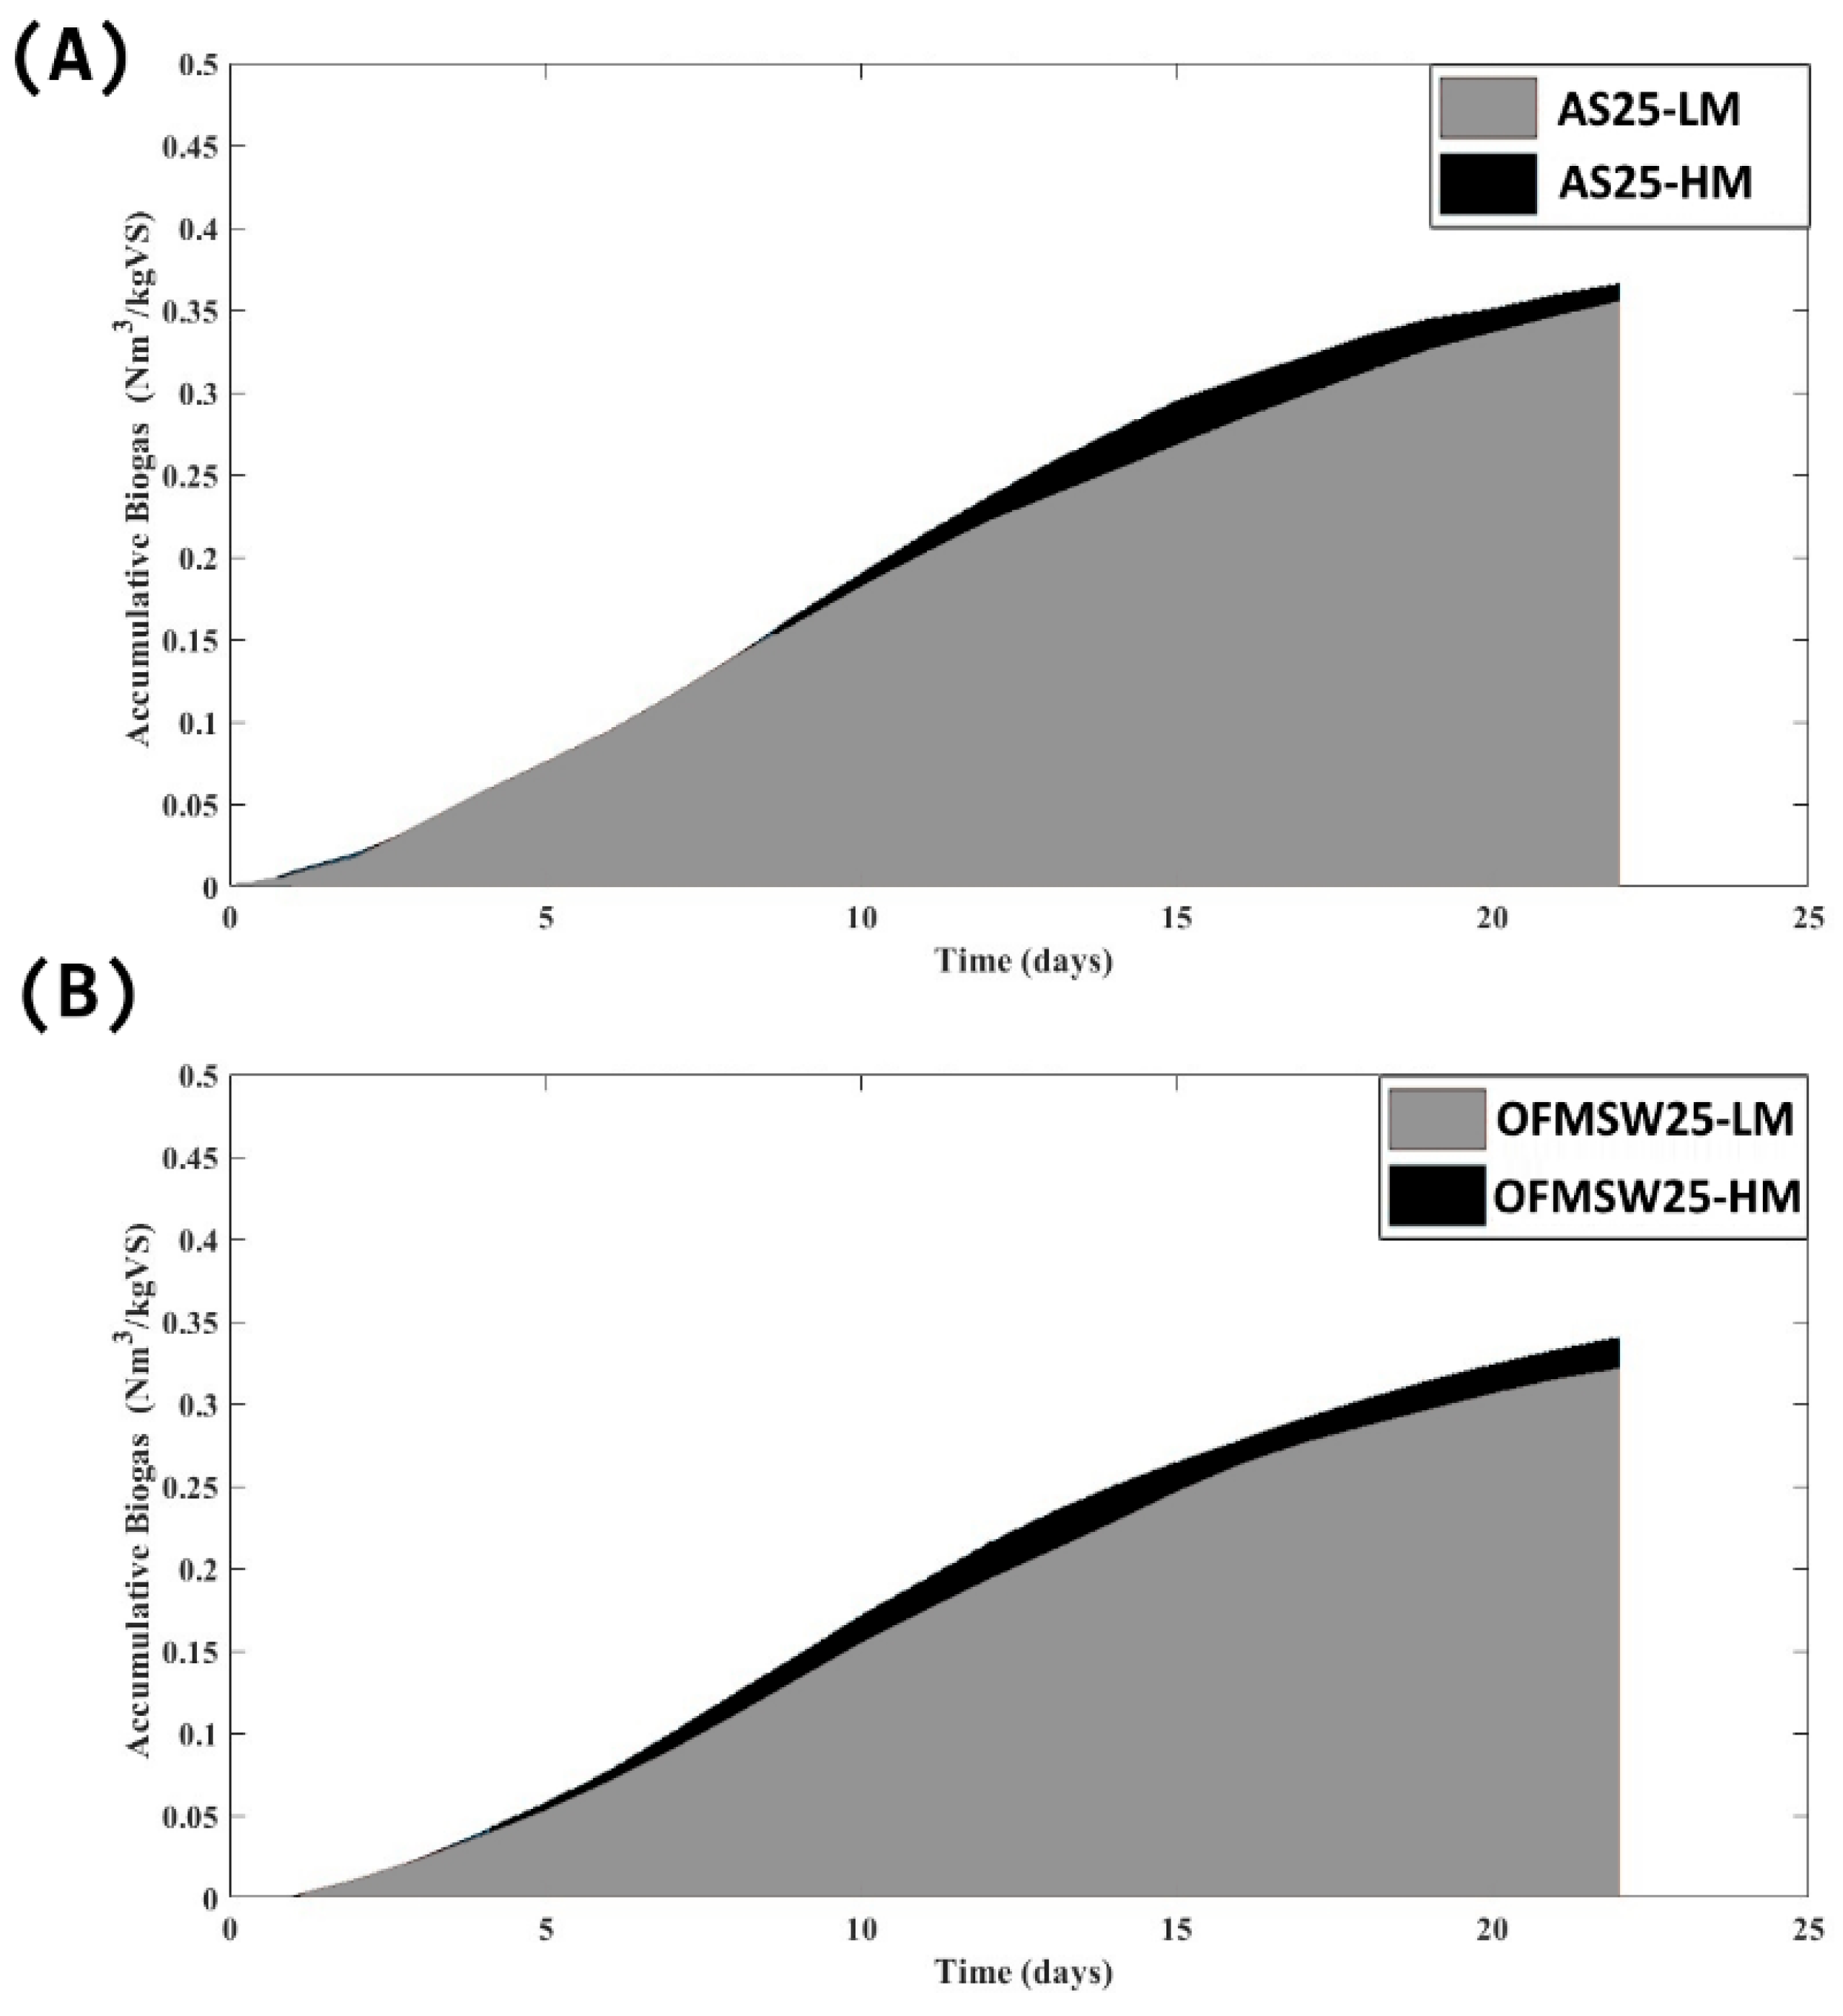
3.2. Effect of Mixing Mode on Co-Digestion Potential

The results indicate that AS25 and OFMSW25 were the optimal mixing ratios. In order to determine the ideal mixing mode, BMP automatic mixing (BMP-AM) experiments were used in the second stage of the substrate inquiry experiment. Low mixing (LM) and high mixing (HM) rates were the two mixing modes used during the AcD of SCG-AS and SCG-OFMSW.
The BMP-AM bioreactors required 22 days to incubate SCG-AS digestion and 24 days to incubate SCG-OFMSW. This is due to the required time for bacterial activity to stop and the process to stabilize. Due to the nature of the substrate and its ability to recover after each pH adjustment, it is evident that the OFMSW substrate required a longer incubation period when compared with the SCG-AS substrate [62]. As revealed in Figure 5 for AS and OFMSW, the VS removal efficiency during incubation was 78.89% and 75.775% through HM mode testing and 84.34% and 72.06% through LM mode testing, respectively. In general, as shown in Figure 5a–d the co-digestion SCG-OFMS showed the highest performance with respect to the removal efficiency of VS and TCOD and a higher performance in SCOD conversation rate. On the other hand, co-digestion showed a high and acceptable removal efficiency of VS and OFMS but at levels that are nevertheless lower than SCG-AS co-digestion.
For LM mode, the highest biogas (0.365 Nm3/kg VS) and CH4 production (0.256 Nm3/kg VS) were achieved by the AS25. As shown in Figure 6, the biogas yield increased during the test period, reaching 0.0254 Nm3/kg VS on the ninth day. Then, production stayed mostly stable until day fifteen; after that, it started to decline until the last day of the experiment, incubation, and finally stabilized. The amount of 0.339 Nm3/kg VS resulted from OFMSW25, which achieved a highest CH4 concentration of 0.72% (0.245 Nm3/kg VS). Both co-digestion processes showed high biogas production rates, but with different values. AS25 achieved the highest rate of 0.0243 Nm3/kg VS on day 10 with a peak production lasting from day 8 to day 11, while OFMSW25 produced about 0.0240 Nm3/kg VS with a peak lasting from day 7 to day 12. Figure 6 shows the differences between the performances of BMP-AM when operating under the HM and LM systems for SCG-AS and SCG-OFMS co-digestions with 25% SCG. The area of co-digestion for SCG-AS was 0.20, indicating good performance, minimal differences in production, process stability, and bacterial activity across all four phases. A slight difference was observed in the digestion of SCG-OFMSW, with an area of 0.27, reflecting some differences in stability, production phases, and bacterial growth rate. The results indicate that substrate AS is the best choice to serve as a co-substrate for SCG. Furthermore, mixing mode did not affect SCG-AS digestive performance.
The results of the HM and LM modes were similar, with minor variations favoring the HM mode. Biogas production for SCG-AS was 0.37 Nm3/kg VS, whereas CH4 production was 0.253 Nm3/kg VS (69.32% biogas). The methane (CH4) and biohydrogen (biogas) production from the SCG-OFMSW mixture was about 0.222 Nm3/kg VS (67.77% biogas) and 0.328 Nm3/kg VS, respectively. The findings show that, whereas peak production for SCG-OFMSW only lasted three days during digestion, it lasted five days for SCG-AS. Stable output was seen for the remaining days. Only days 6 and 15 showed signs of pH correction. It is evident from the BMP-AM tests that both mixing modes operated similarly, with only little variation, and that co-digestion SCG-AS continued to perform better in terms of production and stability during digestion. The most noticeable difference was the time it took to complete digestion, amounting to an additional two days in the BMP-MM tests. According to the comparison of the first and second stages, the AS25 test showed an increase in production and performance when mixing, whether at HM or LM, whereas the OFMSW25 test produced a significant decrease in production when mixing with the optimal mixture. Mixing may not be appropriate for digestion of this specific OFMSW25 mixture and requires a minimal mixing velocity that is lower than LM. This requires more investigation to understand performance when utilizing a mixed range that is lower than 20 rpm.
This decreased performance when mixed with OFMSW25 could be explained by analyzing the microbial inhibition mechanisms resulting from increased mixing intensity. Although moderate mixing enhances substrate transfer to the microbes and prevents the accumulation of inhibitory substances such as volatile fatty acids (VFAs), high mixing intensity can disrupt the biocompatibility of anaerobic microbial communities, particularly methanogenic bacteria, reducing their digestion efficiency. Previous studies, such as those of Vavilin et al. [62] and Dalkılıc et al. [63] have indicated that high mixing intensity increases microorganisms’ susceptibility to mechanical stress, leading to decreased microbial activity rates and potentially causing the decomposition of some sensitive bacterial communities. In addition, excessive mixing can fragment microbial communities, hindering the intermicrobial cooperation necessary for integrated digestion. Therefore, the explanation for the low performance of OFMSW25 is related to the imbalance of the microbial community resulting from over-mixing. This requires more detailed studies of microbial community composition data in order to understand the underlying biological mechanisms more deeply.
One of the most important elements in achieving optimal digestion is the consistent environment that adequate mixing gives anaerobic organisms [3,14]. These results demonstrate the stability and growth of microorganisms during the digestion process with an appropriate mixing rate, where the organic load and substrate nutritional balance, which are necessary for bacterial activity, boost co-digestion. These results are consistent with those of earlier research [62,63]. Overall, the co-digestion process through BMP-AM showed resistance to shock loads. Additionally, it demonstrated that biogas production increased when the digester’s selected organic load fell within the appropriate range [64].

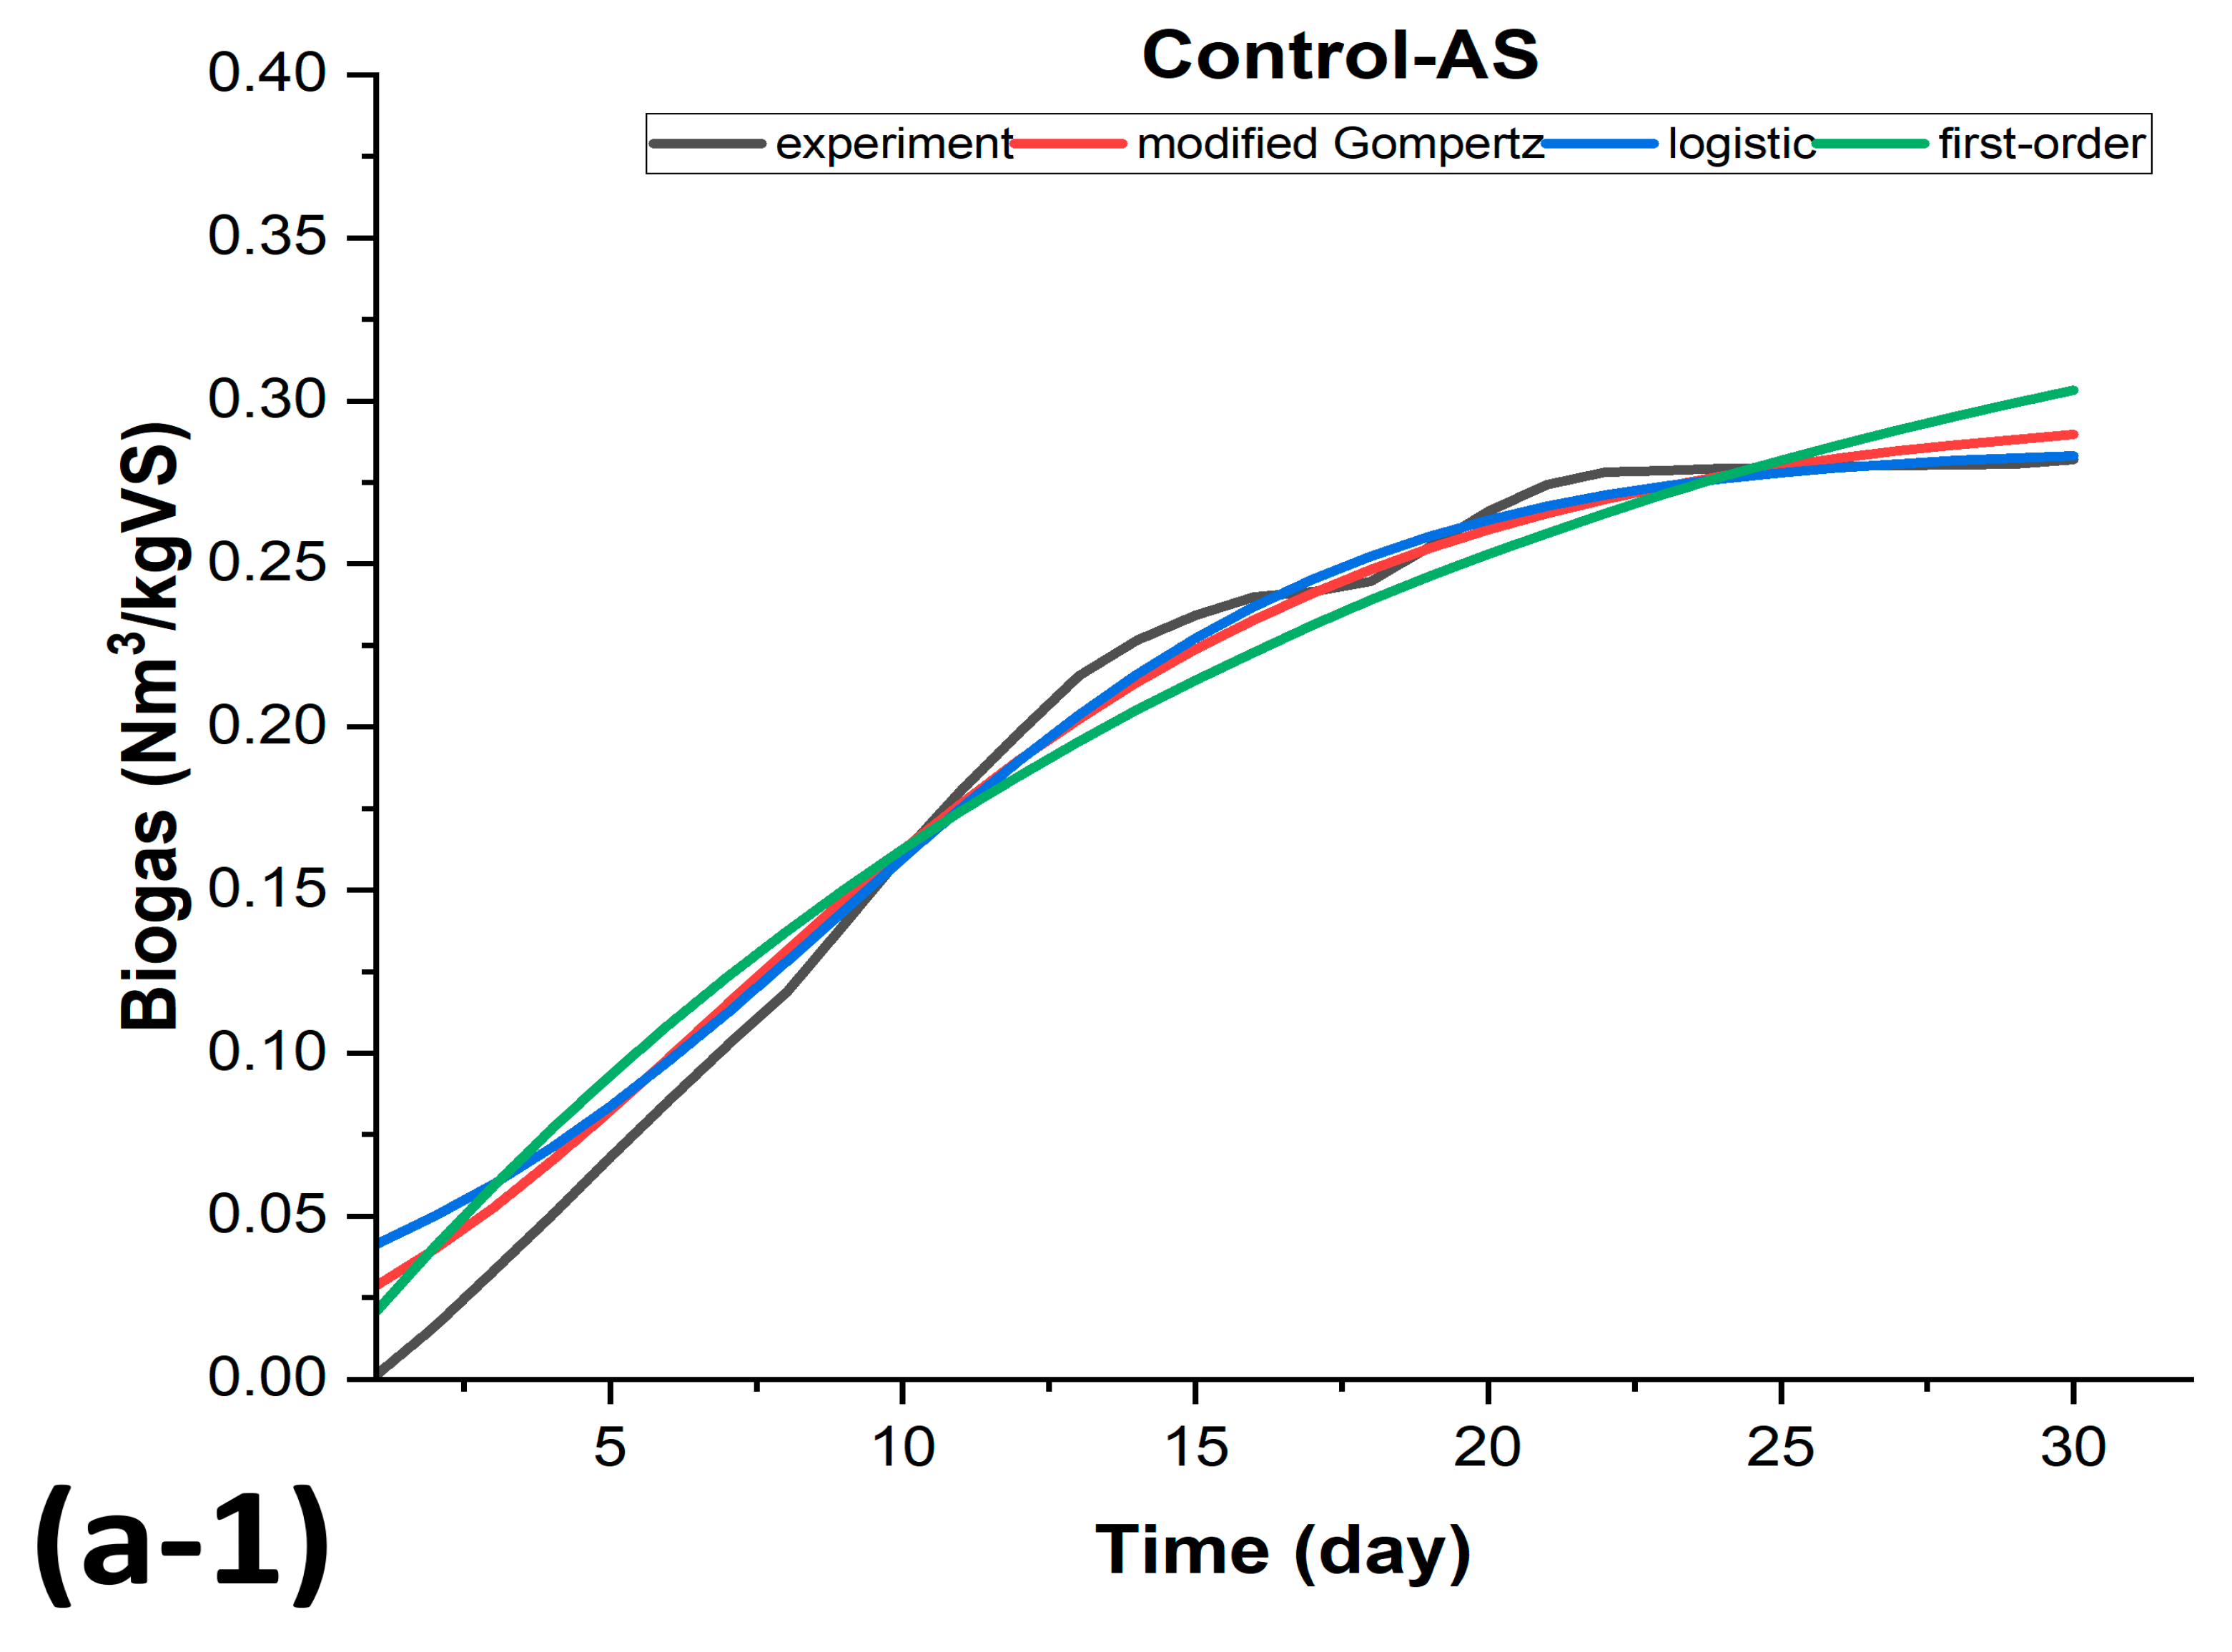
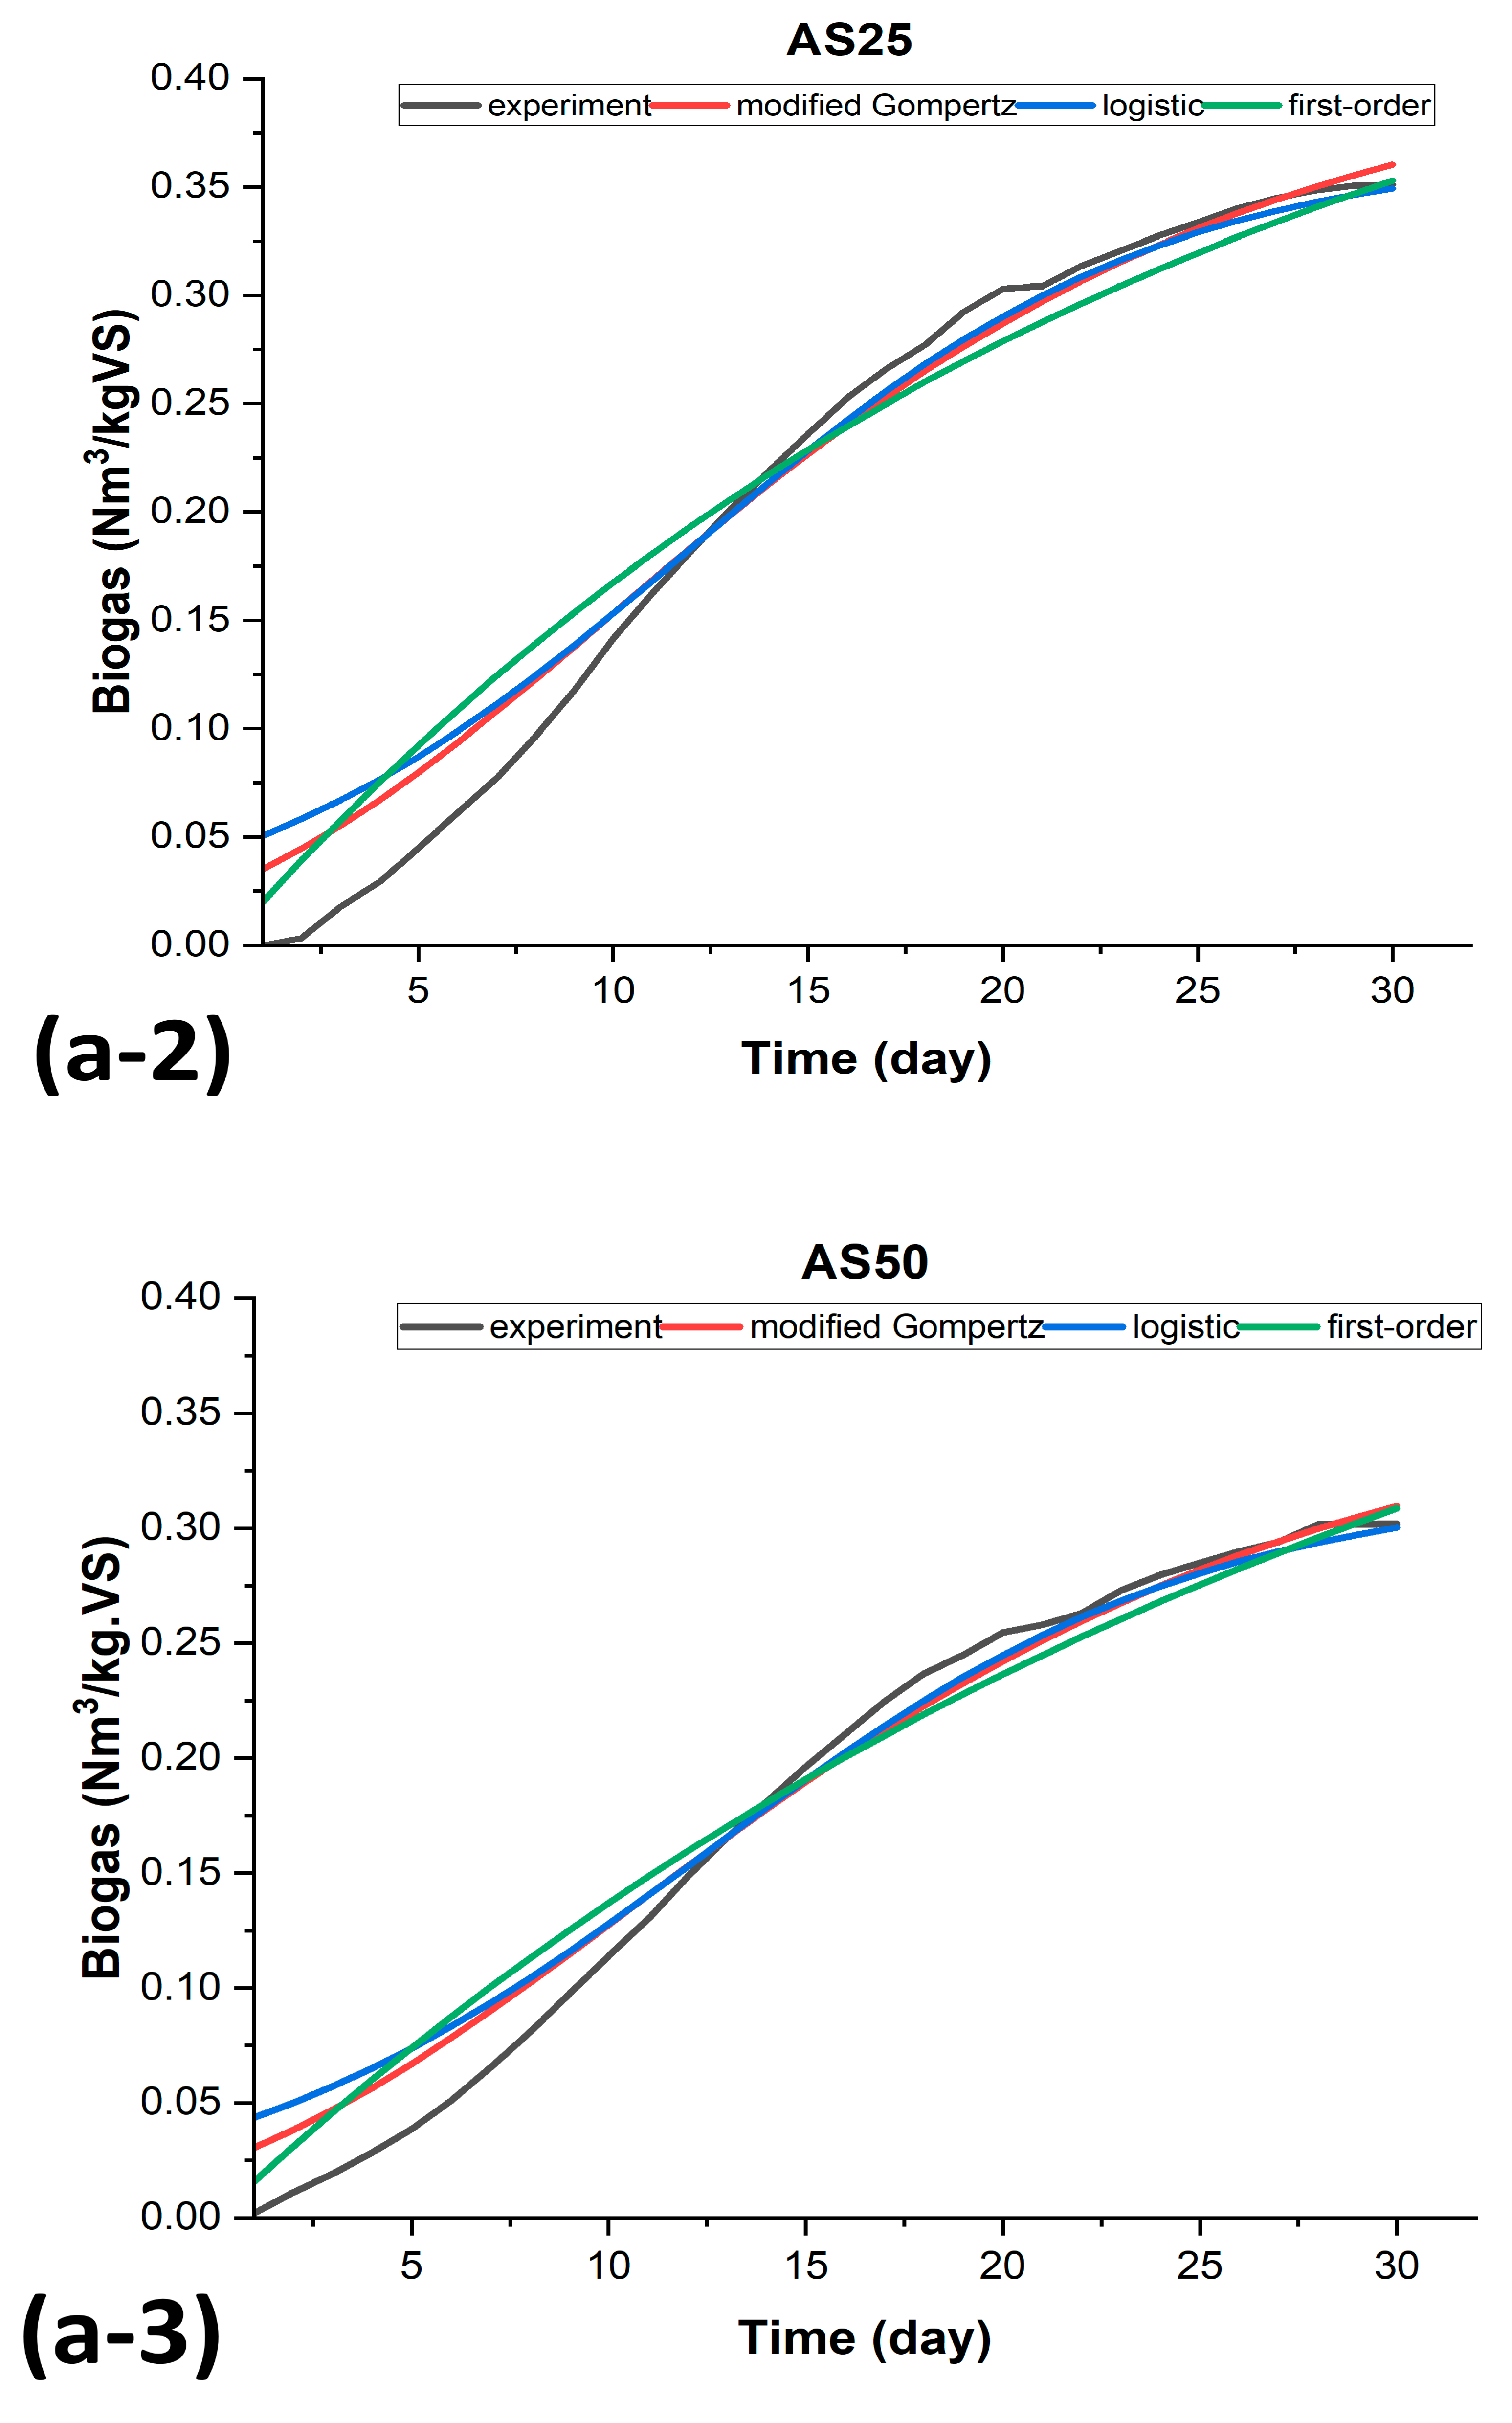
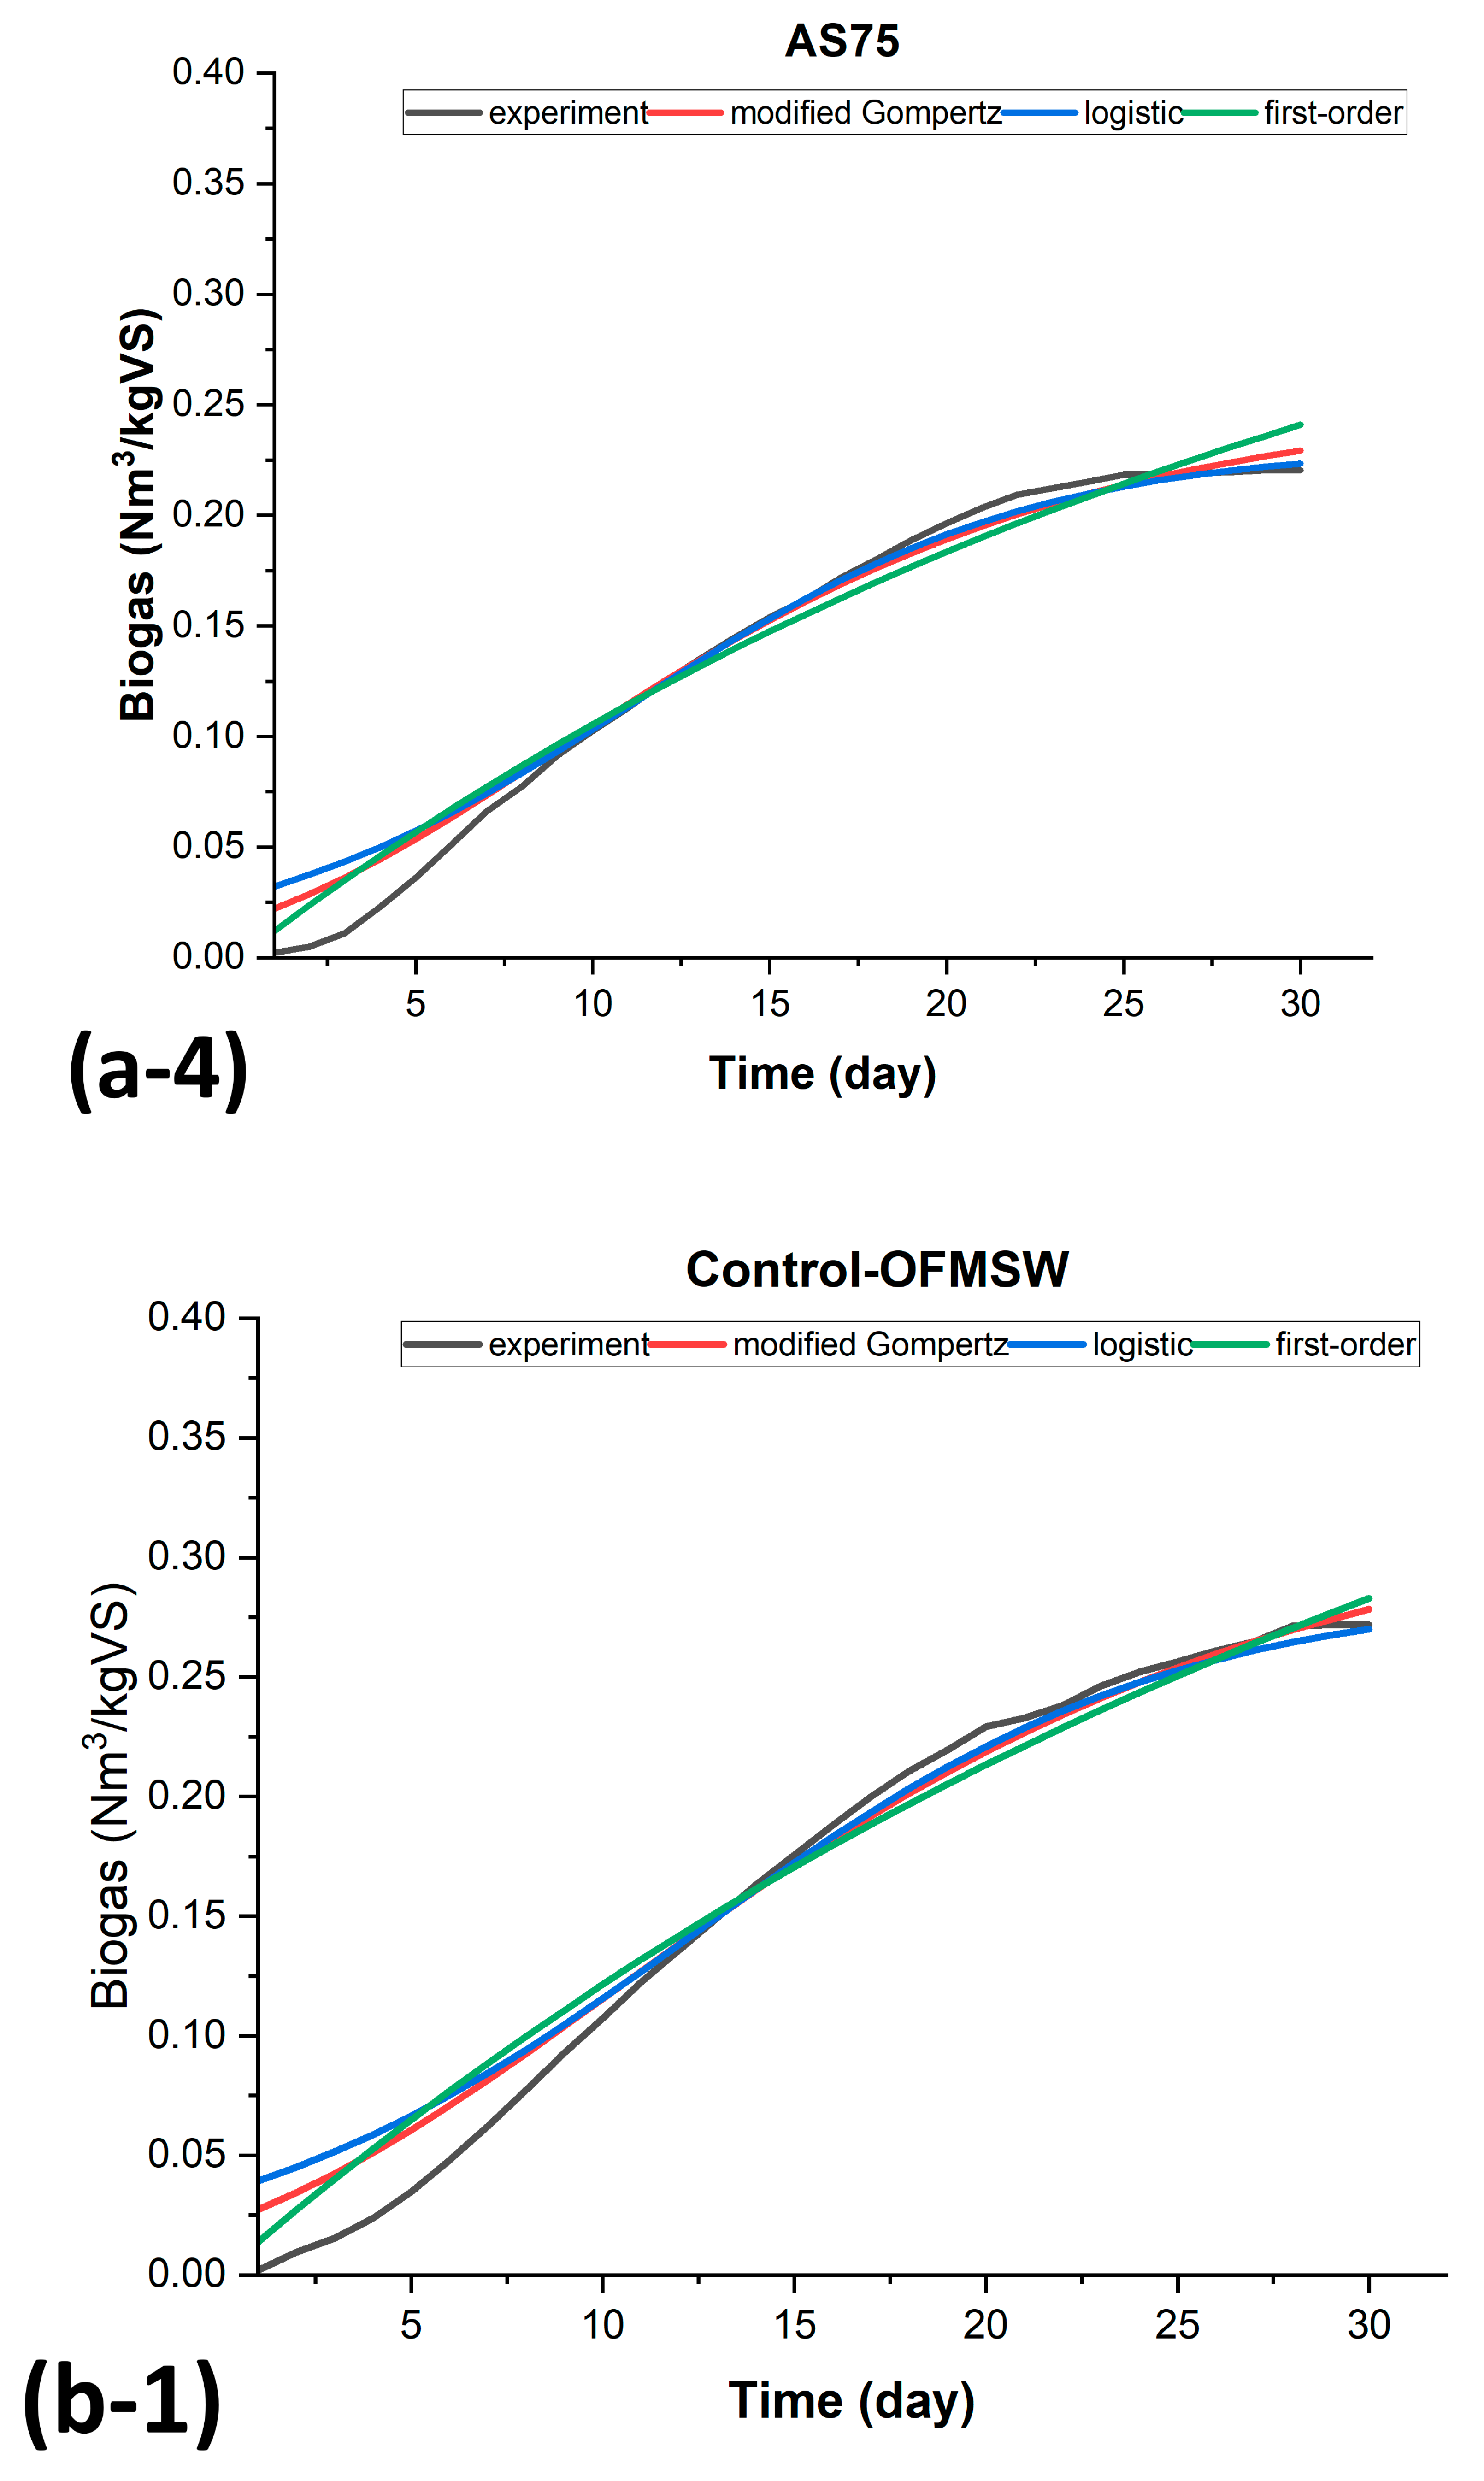
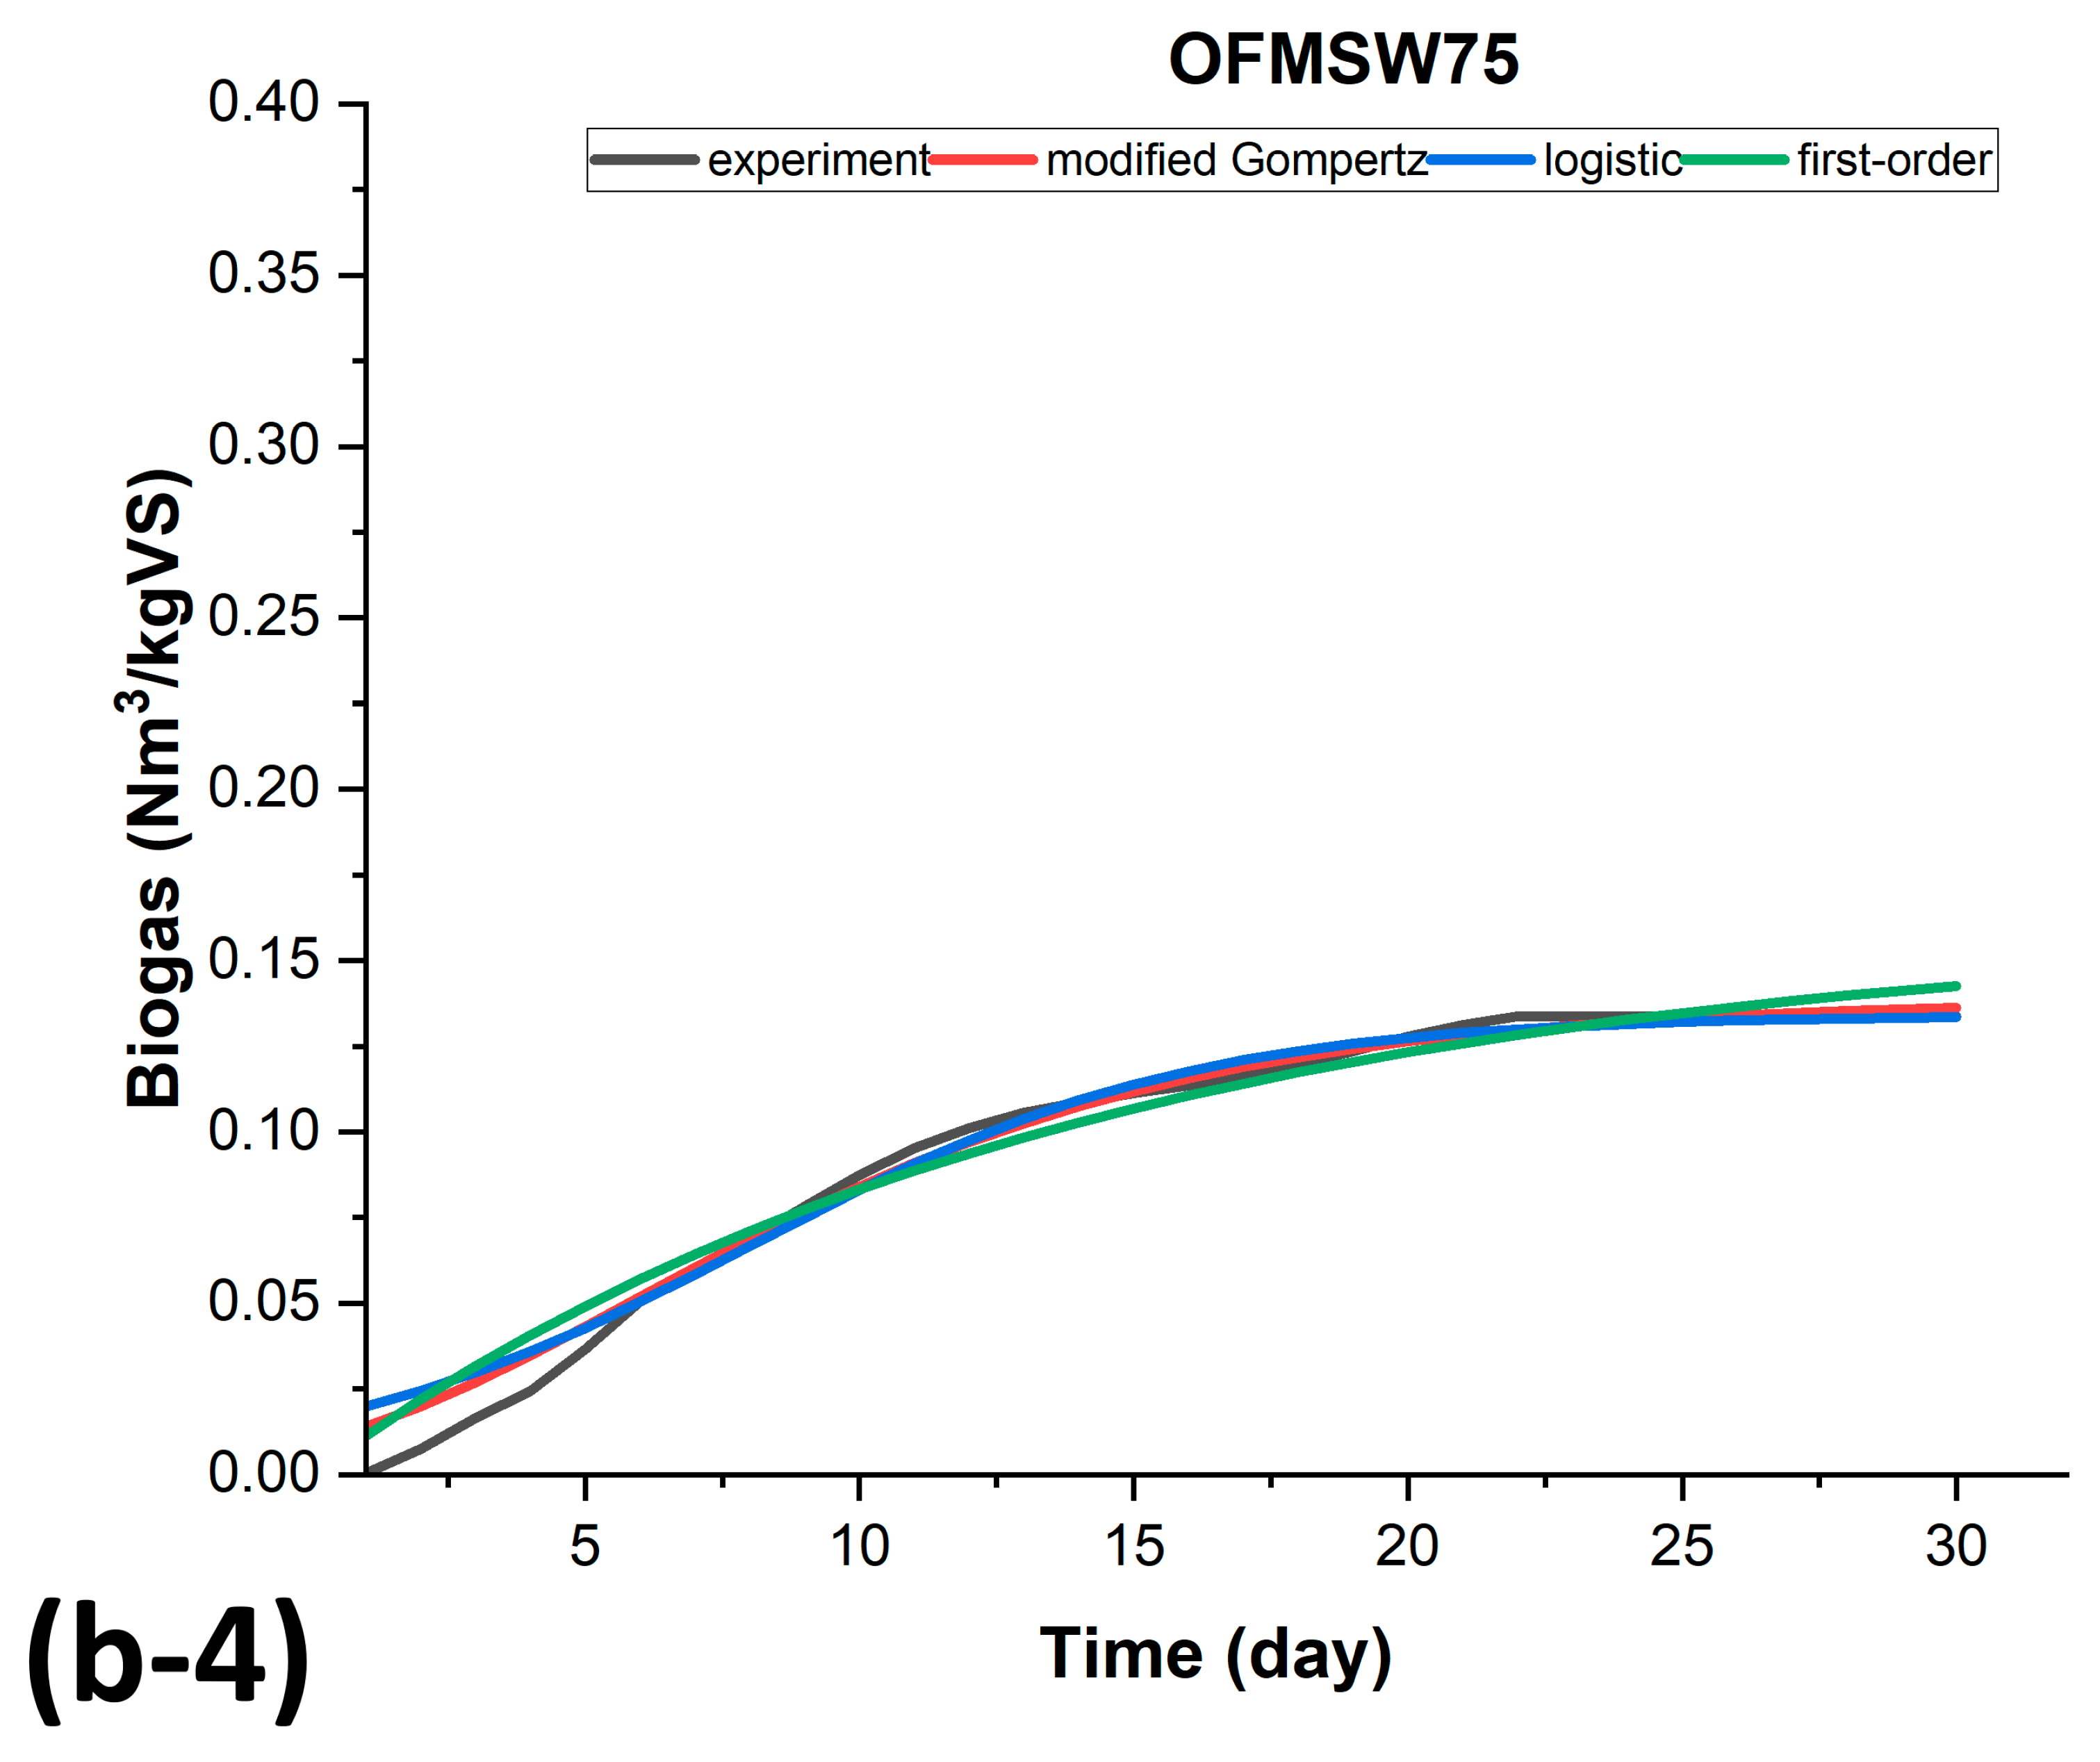
3.3. Kinetic Modeling of Biogas Production for BMP-MM Tests

Using the nonlinear regression model, the biogas yields were predicted by the models (modified Gompertz (Equation (2)), first-order (Equation (3)), and logistic (Equation (4)) model) and were compared with those obtained by BMP experiments, as shown in Figure 7(a-1–b-4). The coefficient parameters for the best fitting of the estimated data were determined using MATLAB (R2021a) software, along with an interval of confidence of 95% [17,51,53].
The results of the fitting experimental test are presented in Table 3, and all of the BMP runs displayed strong regression coefficients (R2 > 0.973 for SCG-AS and R2 > 0.959 for SCG-OFMSW). As presented in Table 3. The three models demonstrated a strong relationship between model parameters and experimental data in AD simulations, as seen by their low RMSE and high correlation coefficient values (R2). With a higher R2 of 0.981 (AS75) than the logistic (0.971) and first-order (0.972) models; however, the modified Gompertz model showed a better match in the simulation of the data as it could faithfully depict the curves in the SCG-AS plots. According to the prediction of OFMSW75, the modified Gompertz, logistics, and first-order models for SCG-OFMSW co-digestion produced R2 values of 0.985, 0.977, and 0.970, respectively. The lowest RMSE was 0.010, 0.013, and 0.012, resulting from the modified Gompertz, first-order, and logistics models for AS75 among all test results with co-digestion of SCG-AS, while the RMSE was 0.005, 0.006, and 0.007 of the modified Gompertz, logistics, and first-order models for SCG-OFMSW, respectively.
The results show that the logistic model is ideal for systems with a rapid rate of production; for SCG-AS, it has the best Rm value (0.010317 compared with 0.0104643 for the modified Gompertz model) for the AS75 test. For the SCG-OFMSW tests, the best Rm (0.008636) was achieved by the logistic model for OFMSW75. Meanwhile, k is the coefficient parameter of the first-order model. The best k value resulted from OFMSW25 (0.025380) and AS25 (0.0303355) compared with AS75 (0.040764) and OFMS75 (0.0729643). These results highlight that a first-order model with a slight variation in the value of k does not provide a clear representation of a production simulation. The logistic model provides nearly identical lag phase time λ values (≈0.00099), identical for all tests. These same trends also result from the modified Gompertz model (0.00999). This clearly indicates that all tests started production in a short period and that logistics is the best model to predict the production time phase. These results agree with those of Elagroudy et al. [65].
This implies that the reduced degradation of SCG most likely had a negative impact on the substrate consumption rate and, consequently, the biogas production rate. Notably, a large percentage of AS and OFMSW in the substrate mixture caused S to decrease while Rm increased. Given the low S content in SCG, this finding might indicate that the addition of sulfur-rich AS and OFMSW boosts bacterial activity in the early stages, while the overproduction of toxic H2S in the final stages inhibits growth.
Considering the results of the three models, it can be concluded that the first-order model, followed by the modified Gompertz model, is the most accurate model for representing cumulative biogas production from co-digestion. The logistic model had the least accurate prediction of cumulative biogas production from co-digestion. Additionally, the first-order model proved to be the most effective at depicting the formation of mono-substrate digestion, as seen in Figure 7(a-1–b-4), for both control tests of AS and OFMSW. These results align with those in the literature [17,30,66,67,68] but contradict other studies that show the logistic model as being the best for representing production.
The findings show that the minimal addition of SCG in the co-digestion tests may have had a beneficial effect on the digestion of AS and OMSW. Because AS is one of the most often used co-digestion compounds with SCG co-substrates (Kim et al., [29], Li et al., [30], Li et al., [66]), the observed negative impact warrants attention for a successful co-digestion process [69]. Ejimofor et al. [69] found that the logistic model’s R2 = 0.997 was greater than the modified Gompertz model’s (R2 = 0.64) when applied to biogas production kinetics from wastewater digestion.

4. Conclusions

A batch BMP test was conducted to examine the feasibility of the AcD of SCG with AS and OFMSW at various substrate mixing ratios. Digestion performance was clearly influenced by the composition and characteristics of substrate ratio. When SCG concentrations were high, both methane yield and production rate were adversely affected. AS25 and OFMSW25 tests confirmed that the reactor performed better at the lowest concentration of SCG, leading to an increase in biogas production, VS and TCOD removal efficiency, and CH4 content. As compared with the control test, the AS25 test showed superior performance and the highest biogas production at 0.351 Nm3/kg VS (68.53% CH4) with a +24.47% improvement, while OFMSW25 showed 0.329 Nm3/kg VS (67.19% CH4) with a +20.96 percent improvement compared with the control test. With high concentrations of SCG in AS50, AS75, OFMSW50, and OFMSW75, 0.32 Nm3/kg VS (+7.09%), 0.22 Nm3/kg VS (−21.98%), 0.224 Nm3/kg VS (−8.82%), and 0.134 Nm3/kg VS (−51.10%) were produced, respectively.
Three models (modified Gompertz, logistic, and first-order) were used to investigate biogas, and the best model to forecast the production of biogas was identified by determining the kinetic evaluation parameters. The modified Gompertz for AS and OFMSW co-digestion was shown to be the best-fit model for biogas prediction for BMP at all mixing ratios, whereas the best model for production rate and present best coefficient parameter is the first-order model.
The optimal concentration for both substance AS25 and substance OFMSW25 was used in the BMP-AM reactor to compare two mixing types: high mixing mode at 60 rpm and low mixing mode at 24 rpm. The results show that the best mixing mode for substance OFMSW25 was HM, while for substance AS25 there was only a very slight difference in performance, as mixing had little effect on the substrate. Overall, substance AS25 demonstrated superior performance in terms of production rate, residence time, bacterial activity efficiency, and the production of 0.256 Nm3/kg VS of CH4 (HM), 0.253 Nm3/kg VS of CH4 (LM) and biogas 0.365 Nm3/kg VS of biogas (HM and LM).

Author Contributions

The author was K.A.b.A.; the executor and designer of the campaign was K.A.b.A.; R.A.D. and A.A.B., wrote the paper and elaborated on the data and biogas process; L.A.A.-S. and E.G. created the models and analyzed the behavior modeling. K.A.b.A., R.A.D. and A.A.B. conducted experiments and prepared the framework. All authors have read and agreed to the published version of the manuscript.

Funding

This research was funded by the European Union under the ENI CBC Mediterranean Sea Basin Program, Project B_A.2.1_0088_MED-QUAD. Additional support, including provision of necessary equipment for specimen testing, was provided by the living lab “Smart Water Use Applications (SWUAP)”.

Institutional Review Board Statement

Not applicable.

Informed Consent Statement

Not applicable.

Data Availability Statement

The original contributions presented in this study are included in the article. Further inquiries can be directed to the corresponding authors.

Acknowledgments

The authors would like to express their sincere gratitude to the European Union under the ENI CBC Mediterranean Sea Basin Program, Project B_A.2.1_0088_MED-QUAD for their support. Additionally, we extend our appreciation to the living lab “Smart Water Use Applications (SWUAP)” for providing the necessary equipment to conduct the specimen tests.

Conflicts of Interest

The authors declare there are no conflicts of interest.

References

  1. Jordan. Food Balance Sheet. Available online: http://www.dos.gov.jo/dos_home_e/main/agriculture/food_budget/index.htm (accessed on 9 December 2019).
  2. Al-Dalain, S.Y.; Haddad, M.A.; Parisi, S.; Al-Tarawneh, M.A.; Qaralleh, H. Determination of Macroelements, Transition Elements, and Anionic Contents of Commercial Roasted Ground Coffee Available in Jordanian Markets. Beverages 2020, 6, 16. [Google Scholar] [CrossRef]
  3. Vardon, D.R.; Moser, B.R.; Zheng, W.; Witkin, K.; Evangelista, R.L.; Strathmann, T.J.; Rajagopalan, K.; Sharma, B.K. Complete Utilization of Spent Coffee Grounds To Produce Biodiesel, Bio-Oil, and Biochar. ACS Sustain. Chem. Eng. 2013, 1, 1286–1294. [Google Scholar] [CrossRef]
  4. Silva, M.A.; Nebra, S.A.; Machado Silva, M.J.; Sanchez, C.G. The use of biomass residues in the brazilian soluble coffee industry. Biomass Bioenergy 1998, 14, 457–467. [Google Scholar] [CrossRef]
  5. Chang, S. Overview of Mushroom Cultivation and Utilization as Functional Foods. In Mushrooms as Functional Foods; John Wiley & Sons: Hoboken, NJ, USA, 2009; pp. 1–33. [Google Scholar] [CrossRef]
  6. Qiao, W.; Takayanagi, K.; Niu, Q.; Shofie, M.; Li, Y.Y. Long-term stability of thermophilic co-digestion submerged anaerobic membrane reactor encountering high organic loading rate, persistent propionate and detectable hydrogen in biogas. Bioresour. Technol. 2013, 149, 92–102. [Google Scholar] [CrossRef] [PubMed]
  7. Al bkoor Alrawashdeh, K.; Pugliese, A.; Slopiecka, K.; Pistolesi, V.; Massoli, S.; Bartocci, P.; Bidini, G.; Fantozzi, F. Codigestion of Untreated and Treated Sewage Sludge with the Organic Fraction of Municipal Solid Wastes. Fermentation 2017, 3, 35. [Google Scholar] [CrossRef]
  8. Alrawashdeh, K.A.B.; Al-Zboon, K.K.; Al Rabadi, S.; Gul, E.; Al-Samrraie, L.A.; Ali, R.; Al-Tabbal, J.A. Impact of Iron oxide nanoparticles on sustainable production of biogas through anaerobic co-digestion of chicken waste and wastewater. Front. Chem. Eng. 2022, 4, 974546. [Google Scholar] [CrossRef]
  9. Bkoor, A.; Al-Zboon, K.K.; Al-Tabbal, J.A.; Al-Samrraie, L.A.; Al Bsoul, A.; Damseh, R.A.; Khasawneh, A.; Dessouky, Y.; Tonbol, K.; Ali, B.M.; et al. The Effects of Nanoparticles- Zerovalent Iron on Sustainable Biomethane Production through Co-Digestion of Olive Mill Wastewater and Chicken Manure. Fermentation 2023, 9, 183. [Google Scholar] [CrossRef]
  10. Alrawashdeh, K.A.B.; Gul, E.; Yang, Q.; Yang, H.; Bartocci, P.; Fantozzi, F. Effect of Heavy Metals in the Performance of Anaerobic Digestion of Olive Mill Waste. Processes 2020, 8, 1146. [Google Scholar] [CrossRef]
  11. Alrawashdeh, K.A.B.; Al-Essa, A.H. Anaerobic Co-digestion Mill Wastewater—Activated Sludge Effect of Aerobic Pretreatment on the Performance of OMW Anaerobic Digestion. Waste Biomass Valorization 2020, 11, 4781–4788. [Google Scholar] [CrossRef]
  12. Alrawashdeh, K.A.B.; Al-Samrraie, L.A.; Al Issa, H.A.; Qasem, I.; Hussien, A.A.; Al-Zboon, K.K.; Damseh, R.A.; Gul, E. Prediction and Optimization of Biogas Production from OMW Digestion Using Fenton Pre-Treatment Process with Particle Swarm Optimization. Int. J. Des. Nat. Ecodyn. 2022, 17, 157–168. [Google Scholar] [CrossRef]
  13. Boulanger, A.; Pinet, E.; Bouix, M.; Bouchez, T.; Mansour, A.A. Théodore Bouchez, Alicia A. Mansour, Effect of inoculum to substrate ratio (I/S) on municipal solid waste anaerobic degradation kinetics and potential. Waste Manag. 2012, 32, 2258–2265. [Google Scholar] [CrossRef] [PubMed]
  14. Usack, J.G.; Angenent, L.T. Comparing the inhibitory thresholds of dairy manure co-digesters after prolonged acclimation periods: Part 1–Performance and operating limits. Water Res. 2015, 87, 446–457. [Google Scholar] [CrossRef] [PubMed]
  15. Valero, D.; Montes, J.A.; Rico, J.L.; Rico, C. Influence of headspace pressure on methane production in Biochemical Methane Potential (BMP) tests. Waste Manag. 2016, 48, 193–198. [Google Scholar] [CrossRef] [PubMed]
  16. Luz, F.C.; Cordiner, S.; Manni, A.; Mulone, V.; Rocco, V. Anaerobic digestion of coffee grounds soluble fraction at laboratory scale: Evaluation of the biomethane potential. Appl. Energy 2017, 207, 166–175. [Google Scholar] [CrossRef]
  17. Kampioti, A.; Komilis, D. Anaerobic co-digestion of coffee waste with other organic substrates: A mixture experimental design. Chemosphere 2022, 297, 134124. [Google Scholar] [CrossRef]
  18. Lahcen, S.A.L.; Ibn Ahmed, S.; Lahboubi, N.; El Bari, H. Energetic Potential of Coffee Waste from Anaerobic Digestion and Combustion. Ecol. Eng. Environ. Technol. 2023, 24, 138–145. [Google Scholar] [CrossRef]
  19. Gil-Gómez, J.A.; Florez-Pardo, L.M.; Leguizamón-Vargas, Y.C. Valorization of coffee by-products in the industry, a vision towards circular economy. Discov. Appl. Sci. 2024, 6, 1–16. [Google Scholar] [CrossRef]
  20. Garcia-Freites, S.; Röder, M.; Thornley, P. Environmental trade-offs associated with bioenergy from agri-residues in sub-tropical regions: A case study of the Colombian coffee sector. Biomass Bioenergy 2020, 140, 105581. [Google Scholar] [CrossRef]
  21. Campos, R.C.; Pinto, V.R.A.; Melo, L.F.; da Rocha, S.J.S.S.; Coimbra, J.S. New sustainable perspectives for “Coffee Wastewater” and other by-products: A critical review. Futur. Foods 2021, 4, 100058. [Google Scholar] [CrossRef]
  22. Fonoll, X.; Astals, S.; Dosta, J.; Mata-Alvarez, J. Anaerobic co-digestion of sewage sludge and fruit wastes: Evaluation of the transitory states when the co-substrate is changed. Chem. Eng. J. 2015, 262, 1268–1274. [Google Scholar] [CrossRef]
  23. Alrawashdeh, K.A.B.; Al-Sameraie, L.; Al Bsoul, A.; Khasawneh, A.; Al-Tabbal, J. Correlation between kinetic parameters, reactor performance, and biogas and methane potential of co-digestion and mono-digestion of active sludge and olive mill wastewater. Int. J. Low-Carbon Technol. 2024, 19, 1501–1515. [Google Scholar] [CrossRef]
  24. Sossa, J.P.R. Evaluación de La Producción de Biogás Por Medio de La Biodigestión Anaerobia Semicontinua Utilizando Residuos Del Beneficiado Del Café Como Substrato. Ph.D. Thesis, Universidad de Costa Rica, San Pedro, Costa Rica, 2015. Available online: https://repositorio.sibdi.ucr.ac.cr/items/95f25706-4af8-4378-9fd8-bc50877be362/full (accessed on 18 May 2025).
  25. Chala, B.; Oechsner, H.; Latif, S.; Müller, J. Biogas Potential of Coffee Processing Waste in Ethiopia. Sustainability 2018, 10, 2678. [Google Scholar] [CrossRef]
  26. Selvamurugan, M.; Doraisamy, P.; Maheswari, M. An integrated treatment system for coffee processing wastewater using anaerobic and aerobic process. Ecol. Eng. 2010, 36, 1686–1690. [Google Scholar] [CrossRef]
  27. Hernández, M.A.; Rodríguez Susa, M.; Andres, Y. Use of coffee mucilage as a new substrate for hydrogen production in anaerobic co-digestion with swine manure. Bioresour. Technol. 2014, 168, 112–118. [Google Scholar] [CrossRef]
  28. Abouelenien, F.; Namba, Y.; Kosseva, M.R.; Nishio, N.; Nakashimada, Y. Enhancement of methane production from co-digestion of chicken manure with agricultural wastes. Bioresour. Technol. 2014, 159, 80–87. [Google Scholar] [CrossRef] [PubMed]
  29. Kim, J.; Kim, H.; Baek, G.; Lee, C. Anaerobic co-digestion of spent coffee grounds with different waste feedstocks for biogas production. Waste Manag. 2017, 60, 322–328. [Google Scholar] [CrossRef]
  30. Li, Q.; Qiao, W.; Wang, X.; Takayanagi, K.; Shofie, M.; Li, Y.-Y. Kinetic characterization of thermophilic and mesophilic anaerobic digestion for coffee grounds and waste activated sludge. Waste Manag. 2015, 36, 77–85. [Google Scholar] [CrossRef] [PubMed]
  31. Chala, B.; Oechsner, H.; Müller, J. Introducing Temperature as Variable Parameter into Kinetic Models for Anaerobic Fermentation of Coffee Husk, Pulp and Mucilage. Appl. Sci. 2019, 9, 412. [Google Scholar] [CrossRef]
  32. Syaichurrozi, I.; Budiyono; Sumardiono, S. Predicting kinetic model of biogas production and biodegradability organic materials: Biogas production from vinasse at variation of COD/N ratio. Bioresour. Technol. 2013, 149, 390–397. [Google Scholar] [CrossRef]
  33. Budiyono; Widiasa, I.N.; Johari, S.; Sunarso. The Kinetic of Biogas Production Rate from Cattle Manure in Batch Mode. World Acad. Sci. Eng. Technol. Int. J. Chem. Mol. Nucl. Mater. Metall. Eng. 2010, 4, 75–80. [Google Scholar] [CrossRef]
  34. Zhu, B.; Gikas, P.; Zhang, R.; Lord, J.; Jenkins, B.; Li, X. Characteristics and biogas production potential of municipal solid wastes pretreated with a rotary drum reactor. Bioresour. Technol. 2009, 100, 1122–1129. [Google Scholar] [CrossRef] [PubMed]
  35. Atelge, M.R.; Atabani, A.E.; Abut, S.; Kaya, M.; Eskicioglu, C.; Semaan, G.; Lee, C.; Yildiz, Y.; Unalan, S.; Mohanasundaram, R.; et al. Anaerobic co-digestion of oil-extracted spent coffee grounds with various wastes: Experimental and kinetic modeling studies. Bioresour. Technol. 2021, 322, 124470. [Google Scholar] [CrossRef]
  36. Semaan, G. Optimization of the Inoculum-to-Substrate Ratio in Solid-State Spent Coffee Grounds Anaerobic Digestion Biorefineries Using Anaerobic Sludge for Maximal Bio-CH4 Production; Handle.net. 2020. Available online: https://hdl.handle.net/11250/2683881 (accessed on 18 May 2025).
  37. Zhang, S.; Ren, Y.; Ma, X.; Guan, W.; Gao, M.; Li, Y.-Y.; Wang, Q.; Wu, C. Effect of zero-valent iron addition on the biogas fermentation of food waste after anaerobic preservation. J. Environ. Chem. Eng. 2021, 9, 106013. [Google Scholar] [CrossRef]
  38. Alrawashdeh, K.A.B.; Slopiecka, K.; Alshorman, A.A.; Bartocci, P.; Fantozzi, F. Pyrolytic Degradation of Olive Waste Residue (OWR) by TGA: Thermal Decomposition Behavior and Kinetic Study. J. Energy Power Eng. 2017, 11, 497–510. [Google Scholar] [CrossRef]
  39. Alrawashdeh, K.A.B. Anaerobic Co-digestion efficiency under the stress exerted by different heavy metals concentration: An energy nexus analysis. Energy Nexus 2022, 7, 100099. [Google Scholar] [CrossRef]
  40. Puyuelo, B.; Ponsá, S.; Gea, T.; Sánchez, A. Determining C/N ratios for typical organic wastes using biodegradable fractions. Chemosphere 2011, 85, 653–659. [Google Scholar] [CrossRef] [PubMed]
  41. Joint Statement of American Water Works Association and American Public Health Association on Procedure For Issuing “Standard Methods for the Examination of Water and Sewage”. J. Am. Water Work. Assoc. 1932, 24, 1609–1612. [CrossRef]
  42. Alrawashdeh, K.A.B. Improving Anaerobic Co-digestion of Sewage Sludge with Thermal Dried Olive Mill Wastewater. Waste Biomass Valorization 2018, 10, 2213–2219. [Google Scholar] [CrossRef]
  43. APHA. Standard Methods Committee of the American Public Health Association, American Water Works Association, and Water Environment Federation. 4500-p phosphorus. In Standard Methods For the Examination of Water and Wastewater; Lipps, W.C., Baxter, T.E., Braun-Howland, E., Eds.; APHA Press: Washington, DC, USA, 2018. [Google Scholar]
  44. Boe, K.; Batstone, D.J.; Angelidaki, I. An innovative online VFA monitoring system for the anerobic process, based on headspace gas chromatography. Biotechnol. Bioeng. 2007, 96, 712–721. [Google Scholar] [CrossRef]
  45. Sharma, K.D.; Jain, S. Effect of different inoculum and substrate inoculum ratios on biogas yield for anaerobic digestion of organic fraction of solid waste. Glob. NEST J. 2023, 25, 15–24. [Google Scholar] [CrossRef]
  46. UNI 5667–13; Water quality—Sampling—Part 13: Guidance on sampling of sludges. Ente Nazionale Italiano di Unificazione (UNI): Milano, Italy, 2000.
  47. ASTM D5373-16; Standard test methods for instrumental determination of carbon, hydrogen, and nitrogen in laboratory samples of coal and coke. ASTM International: West Conshohocken, PA, USA, 2016. [CrossRef]
  48. Kariyama, I.D.; Zhai, X.; Wu, B. Influence of mixing on anaerobic digestion efficiency in stirred tank digesters: A review. Water Res. 2018, 143, 503–517. [Google Scholar] [CrossRef] [PubMed]
  49. Lindmark, J.; Thorin, E.; Bel Fdhila, R.; Dahlquist, E. Effects of mixing on the result of anaerobic digestion: Review. Renew. Sustain. Energy Rev. 2014, 40, 1030–1047. [Google Scholar] [CrossRef]
  50. Alrawashdeh, K.A.B.; A Al-Tabbal, J.; A Al-Samrraie, L.; Al Bsoul, A.; Al Zboon, K.K. Enhancing residue degradation and methane production from active sludge: The role of conductive nanoparticles in anaerobic digestion systems. Int. J. Low-Carbon Technol. 2023, 18, 1307–1317. [Google Scholar] [CrossRef]
  51. Singh, B.; Kovács, K.L.; Bagi, Z.; Nyári, J.; Szepesi, G.L.; Petrik, M.; Siménfalvi, Z.; Szamosi, Z. Enhancing Efficiency of Anaerobic Digestion by Optimization of Mixing Regimes Using Helical Ribbon Impeller. Fermentation 2021, 7, 251. [Google Scholar] [CrossRef]
  52. Gnaoui, Y.E.; Sounni, F.; Bakraoui, M.; Karouach, F.; Benlemlih, M.; Barz, M.; El Bari, H. Anaerobic co-digestion assessment of olive mill wastewater and food waste: Effect of mixture ratio on methane production and process stability. J. Environ. Chem. Eng. 2020, 8, 103874. [Google Scholar] [CrossRef]
  53. Parra-Orobio, B.A.; Donoso-Bravo, A.; Torres-Lozada, P. Digestión anaerobia de residuos de alimentos. Predicción de la producción de metano mediante la comparación de modelos cinéticos. Ing. Y Compet. 2017, 19, 210. [Google Scholar] [CrossRef]
  54. Donoso-Bravo, A.; Pérez-Elvira, S.; Fdz-Polanco, F. Application of simplified models for anaerobic biodegradability tests. Evaluation of pre-treatment processes. Chem. Eng. J. 2010, 160, 607–614. [Google Scholar] [CrossRef]
  55. Li, L.; He, Q.; Zhao, X.; Wu, D.; Wang, X.; Peng, X. Anaerobic digestion of food waste: Correlation of kinetic parameters with operational conditions and process performance. Biochem. Eng. J. 2018, 130, 1–9. [Google Scholar] [CrossRef]
  56. Zhu, J. Development of General Gompertz Models and Their Simplified Two-Parameter Forms Based on Specific Microbial Growth Rate for Microbial Growth, Bio-Products and Substrate Consumption. Adv. Biotechnol. Microbiol. 2017, 4, 555640. [Google Scholar] [CrossRef]
  57. Lizama, A.C.; Figueiras, C.C.; Gaviria, L.A.; Pedreguera, A.Z.; Espinoza, J.E.R. Nanoferrosonication: A novel strategy for intensifying the methanogenic process in sewage sludge. Bioresour. Technol. 2019, 276, 318–324. [Google Scholar] [CrossRef]
  58. Pan, X.; Lv, N.; Cai, G.; Zhou, M.; Wang, R.; Li, C.; Ning, J.; Li, J.; Li, Y.; Ye, Z.; et al. Carbon- and metal-based mediators modulate anaerobic methanogenesis and phenol removal: Focusing on stimulatory and inhibitory mechanism. J. Hazard. Mater. 2021, 420, 126615. [Google Scholar] [CrossRef] [PubMed]
  59. Rasit, N.; Idris, A.; Harun, R.; Ghani, W.A.W.A.K. Effects of lipid inhibition on biogas production of anaerobic digestion from oily effluents and sludges: An overview. Sustain. Energy Rev. 2015, 45, 351–358. [Google Scholar] [CrossRef]
  60. Kim, D.; Kim, H.; Kim, J.; Lee, C. Co-feeding spent coffee grounds in anaerobic food waste digesters: Effects of co-substrate and stabilization strategy. Bioresour. Technol. 2019, 288, 121594. [Google Scholar] [CrossRef] [PubMed]
  61. Vítěz, T.; Koutný, T.; Šotnar, M.; Chovanec, J. On the Spent Coffee Grounds Biogas Production. Acta Univ. Agric. et Silvic. Mendel. Brun. 2016, 64, 1279–1282. [Google Scholar] [CrossRef]
  62. Vavilin, V.; Angelidaki, I. Anaerobic degradation of solid material: Importance of initiation centers for methanogenesis, mixing intensity, and 2D distributed model. Biotechnol. Bioeng. 2004, 89, 113–122. [Google Scholar] [CrossRef]
  63. Dalkılıc, K.; Ugurlu, A. Biogas production from chicken manure at different organic loading rates in a mesophilic-thermopilic two stage anaerobic system. J. Biosci. Bioeng. 2015, 120, 315–322. [Google Scholar] [CrossRef]
  64. Deepanraj, B.; Sivasubramanian, V.; Jayaraj, S. Experimental and kinetic study on anaerobic digestion of food waste: The effect of total solids and pH. J. Renew. Sustain. Energy 2015, 7, 063104. [Google Scholar] [CrossRef]
  65. Elagroudy, S.; Radwan, A.; Banadda, N.; Mostafa, N.G.; Owusu, P.; Janajreh, I. Mathematical models comparison of biogas production from anaerobic digestion of microwave pretreated mixed sludge. Renew. Energy 2020, 155, 1009–1020. [Google Scholar] [CrossRef]
  66. Li, Q.; Li, Y.-Y.; Qiao, W.; Wang, X.; Takayanagi, K. Sulfate addition as an effective method to improve methane fermentation performance and propionate degradation in thermophilic anaerobic co-digestion of coffee grounds, milk and waste activated sludge with AnMBR. Bioresour. Technol. 2015, 185, 308–315. [Google Scholar] [CrossRef]
  67. Zhong, B.; An, X.; Shen, F.; An, W.; Zhang, Q. Anaerobic Co-digestion of Rice Straw and Pig Manure Pretreated With a Cellulolytic Microflora: Methane Yield Evaluation and Kinetics Analysis. Front. Bioeng. Biotechnol. 2021, 8, 579405. [Google Scholar] [CrossRef]
  68. Mohammadianroshanfekr, M.; Pazoki, M.; Pejman, M.B.; Ghasemzadeh, R.; Pazoki, A. Kinetic modeling and optimization of biogas production from food waste and cow manure co-digestion. Results Eng. 2024, 24, 103477. [Google Scholar] [CrossRef]
  69. Ejimofor, M.I.; Ezemagu, I.G.; Menkiti, M.C. Biogas production using coagulation sludge obtained from paint wastewater decontamination: Characterization and anaerobic digestion kinetics. Curr. Res. Green Sustain. Chem. 2020, 3, 100024. [Google Scholar] [CrossRef]
Figure 1. The removal of VS (%) during incubation: BMP tests for (a) SCG-AS and (b) SCG-OFMSW.
Fermentation 11 00295 g001
Figure 2. The TCOD removal efficiency during incubation tests. (a) BMP tests of SCG-AS and (b) BMP tests of SCG-OFMSW.
Fermentation 11 00295 g002
Figure 3. The SCOD concentrations during incubation tests. (a) BMP tests of SCG-AS and (b) BMP tests of SCG-OFMSW.
Fermentation 11 00295 g003
Figure 4. Daily biogas production obtained from the BMP-MM test of (a) SCG-AS and (b) SCG-OFMSW.
Fermentation 11 00295 g004
Figure 5. Removal efficiency of VS and TCOD during incubation of BMP-AM tests (ad).
Fermentation 11 00295 g005
Figure 6. Accumulative biogas production through BMP-AM tests. (A) AS25 digestion and (B) OFMSW25 digestion.
Fermentation 11 00295 g006
Figure 7. (a-1) Model predictions compared with BMP-MM for control AS tests. (a-2) Model predictions compared with BMP-MM for AS25 tests. (a-3) Model predictions compared with BMP-MM for AS50 tests. (a-4) Model predictions compared with BMP-MM for AS75 tests. (b-1) Model predictions compared with BMP-MM for control OFMSW tests. (b-2) Model predictions compared with BMP-MM for OFMS25 tests. (b-3) Model predictions compared with BMP-MM for OFMSW50 tests. (b-4) Model predictions compared with BMP-MM for OFMSW75 tests.
Fermentation 11 00295 g007aFermentation 11 00295 g007bFermentation 11 00295 g007cFermentation 11 00295 g007dFermentation 11 00295 g007e
Table 1. Characteristics of SCG, OFMSW, AS, and inoculum.
ParameterUnitSCGOFMSWASInoculum
Total solid “TS”g/L13.26 ± 1.2017.84 ± 3.924.12.1 ± 0.524.05 ± 0.23
Volatile solid “VS”g/L11.02 ± 0.8613.54 ± 1.383.150 ± 0.303.00 ± 0.03
Humidity “U”%86.74 ± 8.9082.16 ± 4.6095.88 ± 4.0896.0 ± 2.59
Fixed carbon “F.C”g/L1.81 ± 1.802.9 ± 1.030.02 ± 0.010.53 ± 0.13
Ashg/L0.43 ± 0.052.31 ± 0.800.95 ± 0.230.52 ± 0.09
TCODg/L18.93 ± 2.4615.35 ± 3.1716.62 ± 1.6014.5 ± 3.67
SCODg/L4.78 ± 1.317.87 ± 0.203.87 ± 0.293.80 ± 1.22
Ammonia nitrogen NH3-Nmg/L15.2 ± 3.093.20 ± 1.0346 ± 4.3420.24 ± 4.52
Alkalinitymg/CaCO3/L38.75 ± 4.791100 ± 16.34230 ± 17.45200 ± 10.58
pH 7.9 ± 1.226.06 ± 0.506.8 ± 0.47.2 ± 1
Cumg/L0.65 ± 0.110.03 ± 0.010.32 ± 0.130.27 ± 0.04
Znmg/L3.26 ± 0.190.29 ± 0.016.38 ± 1.324.78 ± 1.23
Almg/L1.54 ± 0.340.08 ± 0.0276.3 ± 11.1716.09 ± 2.53
C/N%25.18 ± 2.5415.29 ± 1.6113.05 ± 1.2717.33 ± 3.07
H%7.35 ± 2.046.54 ± 0.335.481 ± 0.912.06 ± 0.75
Table 2. The characteristics and compositions of all tests on the substrate.
TestSubstrate (g)VS/TS (%)U (%)C/N
25:75
SCG: AS
22 g SCG77.394.9419.74
66 g AS
112 g inoculum
50:50
SCG: AS
37.8 g SCG78.394.2318.22
37.8 g AS
124.4 g inoculum
75:25
SCG: AS
48.9 g SCG78.8493.7316.71
16.3 g AS
134.8 g inoculum
25:75
SCG: OFMSW
10 g SCG74.1793.4617.54
30 g OFMSW
160 g inoculum
50:50
SCG: OFMSW
21 g SCG75.4293.5818.78
21 g OFMSW
158 g inoculum
75:25
SCG: OFMSW
33 g SCG76.8793.7120.02
11 g OFMSW
156 g inoculum
Table 3. Predicted kinetics characteristics of three models (BMP-MM experiments of SCG-AS and SCG-OFMSW co-digestion) that were acquired upon fitting for biogas production.
Control-ASControl-OFMSW
M.GempertzLogisticFirst-Order M.GempertzLogisticFirst-Order
SSE0.003723240.005150.0082598SSE0.0053070.008340.0069553
R20.9853010360.979630.9673910R20.9787640.966600.9721720
AdjR20.9842122240.978900.9662264AdjR20.9771910.965410.9711782
RMSE0.0117430.013570.017175RMSE0.0140210.017260.015761
AS25OFMS25
M.GempertzLogisticFirst-Order M.GempertzLogisticFirst-Order
SSE0.0116170.016880.019899SSE0.0165950.022480.0257040
R20.9731750.961010.954053R20.9590860.944560.936631
AdjR20.9711880.959620.954053AdjR20.9576250.942580.936631
RMSE0.0207430.024550.026195RMSE0.0243450.028330.029772
AS50OFMS50
M.GempertzLogisticFirst-Order M.GempertzLogisticFirst-Order
SSE0.0073360.011040.011045SSE0.0049130.006490.008294
R20.9764790.964580.964588R20.9775550.970340.962112
AdjR20.9747370.963320.963323AdjR20.9767530.969280.960759
RMSE0.0164830.019860.019861RMSE0.0132470.015220.017211
AS75OFMS75
M.GempertzLogisticFirst-Order M.GempertzLogisticFirst-Order
SSE0.0031170.004770.0044705SSE0.00072970.001190.0015854
R20.9813150.971390.973203R20.9865120.977920.970696
AdjR20.9806480.970370.972246AdjR20.9855130.977140.969649
RMSE0.0105510.013050.012636RMSE0.0051990.006530.007525
AS25 and OFMSW25 showed the best performance for biogas production, while AS75 and OFMSW75 recorded the lowest estimated values in SCG digestion with AS and OFMSW, respectively. Across all SCG-OFMSW experiments, the first-order model consistently predicts the greatest values of S; the S for OFMSW25 is 0.499999 (first-order), compared with 0.4014768 (modified Gompertz) and 0.350332 (logistic). While the highest S value is 0.499999 (first-order) compared with 0.409639 (modified Gompertz) and 0.366723 (logistic) for the AS25 test. This shows that the best model for estimating cumulative biogas production is the first-order model, which is most suitable for predicting biogas production in the co-digestion process with the lowest SCG ratio.
Disclaimer/Publisher’s Note: The statements, opinions and data contained in all publications are solely those of the individual author(s) and contributor(s) and not of MDPI and/or the editor(s). MDPI and/or the editor(s) disclaim responsibility for any injury to people or property resulting from any ideas, methods, instructions or products referred to in the content.

