
Time Course Evaluation of Biochemical Contents and Biocatalytic Activities of Jiaosu from Fruit Wastes During One-Year Natural Fermentation

Abstract
1. Introduction
2. Materials and Methods
2.1. Materials
2.2. Collection of Fruit Waste
2.3. Jiaosu Preparation and Sampling
2.4. Proteins and Biocatalytic Characterization
2.4.1. Total Protein Concentration
2.4.2. Amylase Activity
2.4.3. Protease Activity
2.4.4. Lipase Activity
2.5. Total Phenolic Concentration
2.6. Total Carbohydrate Concentration
2.7. Total Alcohol Concentration
2.8. Organic Acid Content
2.9. Data Analysis
3. Results
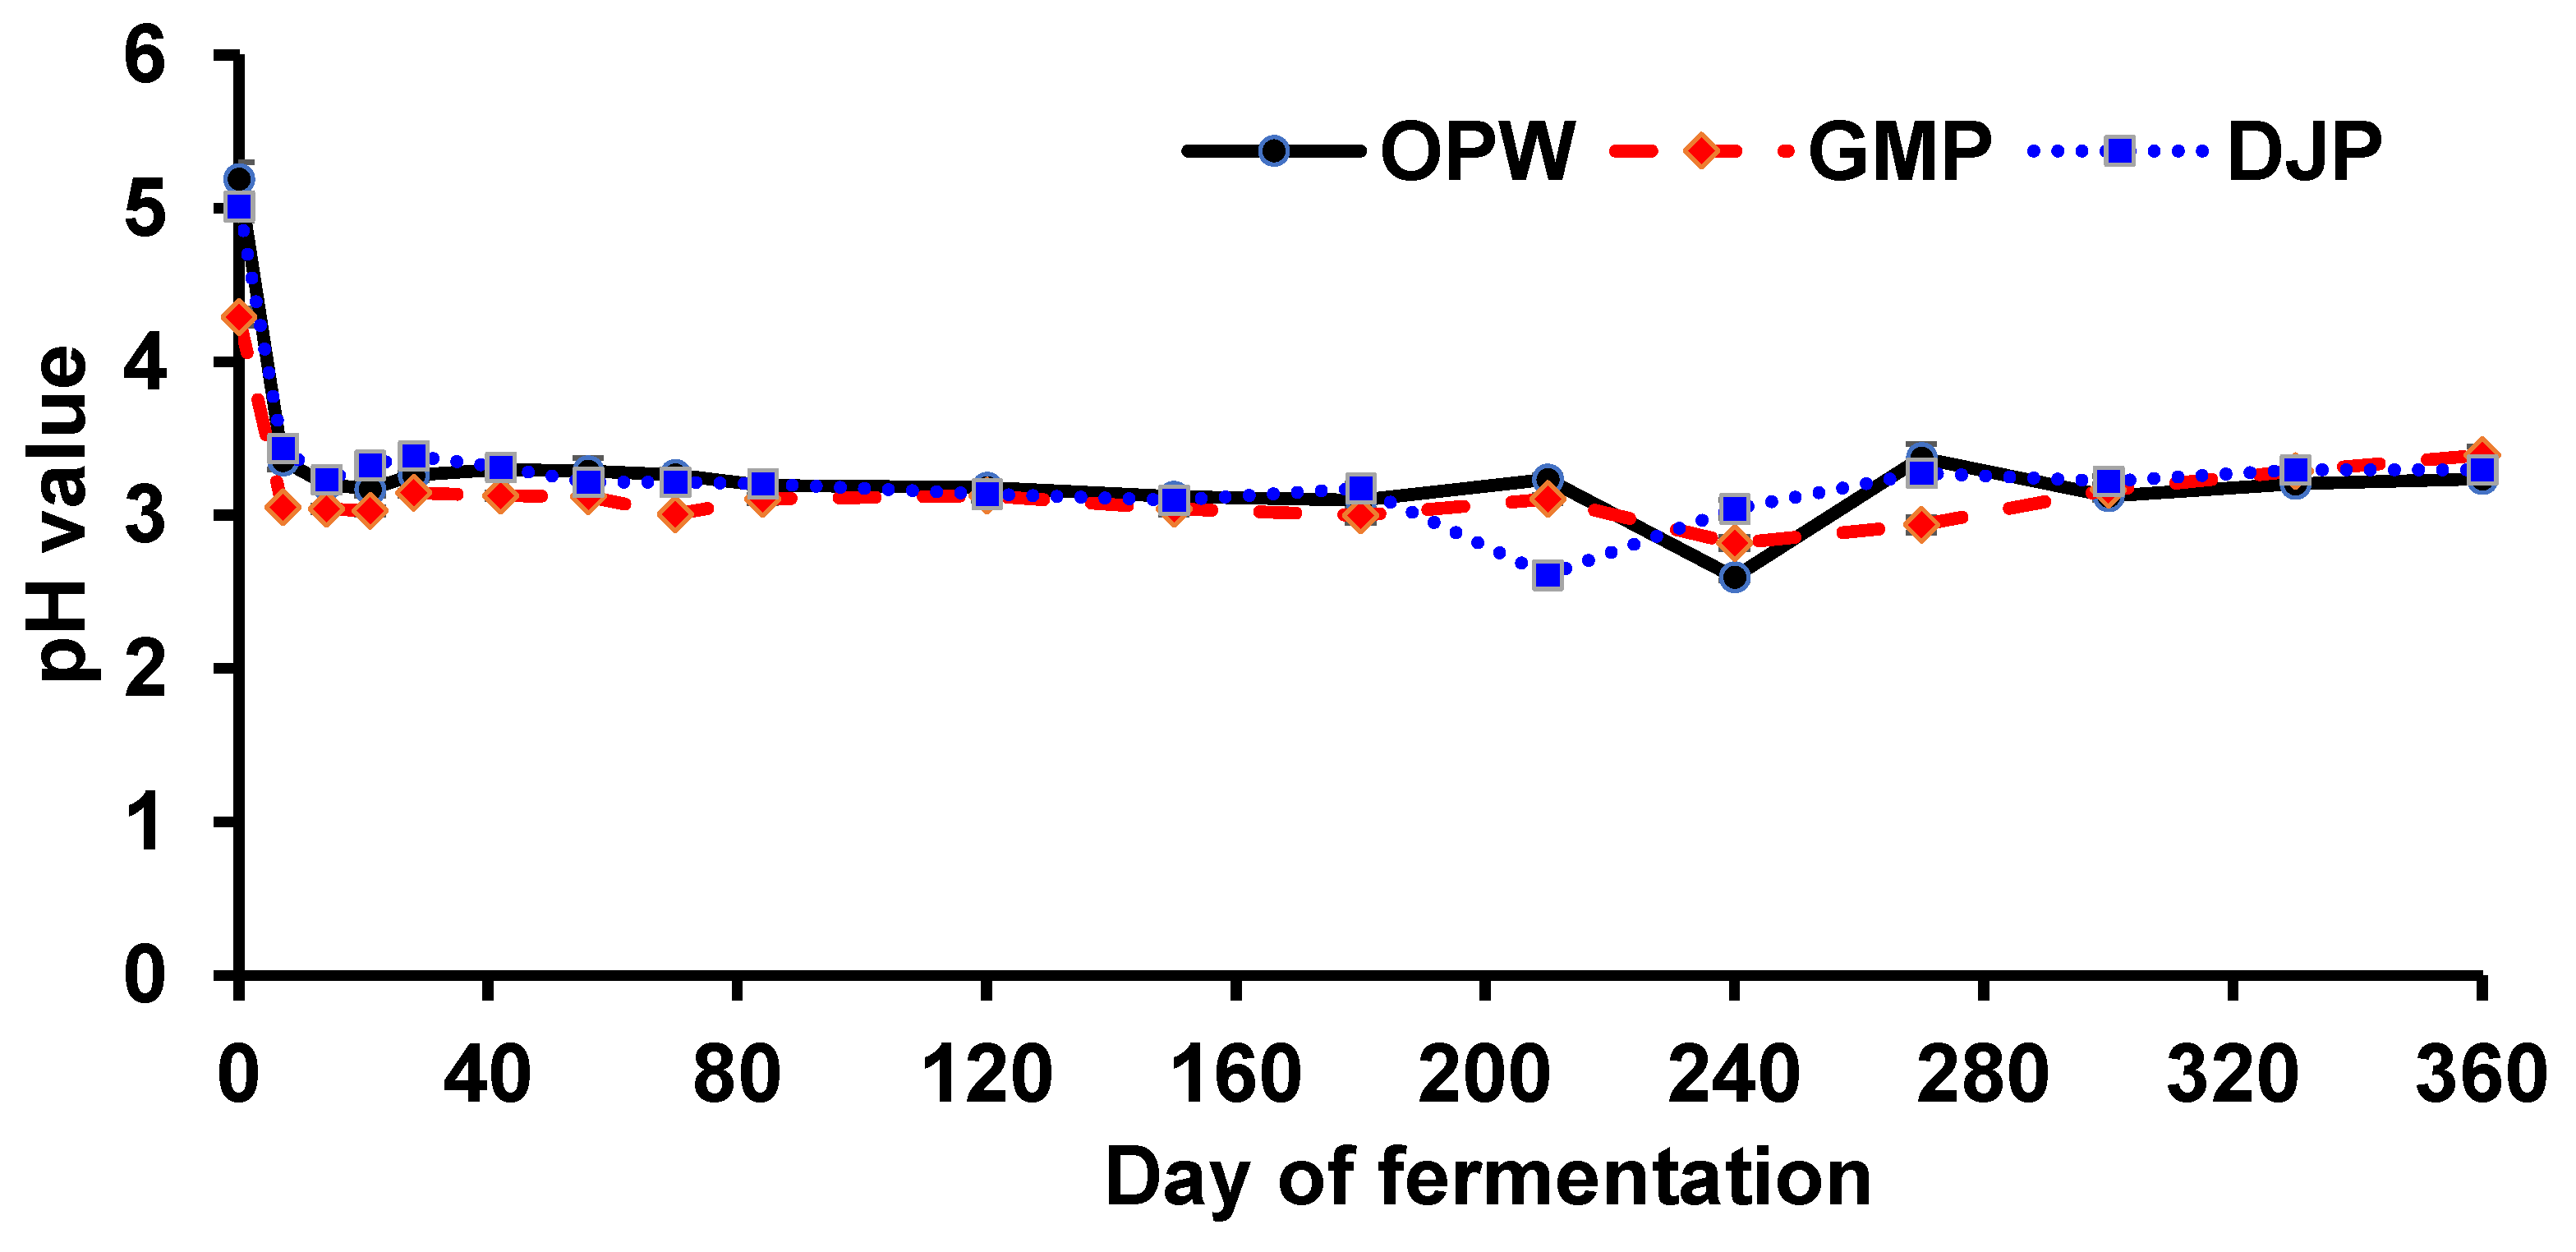
3.1. pH Values
3.2. Proteins and Biocatalytic Characterization
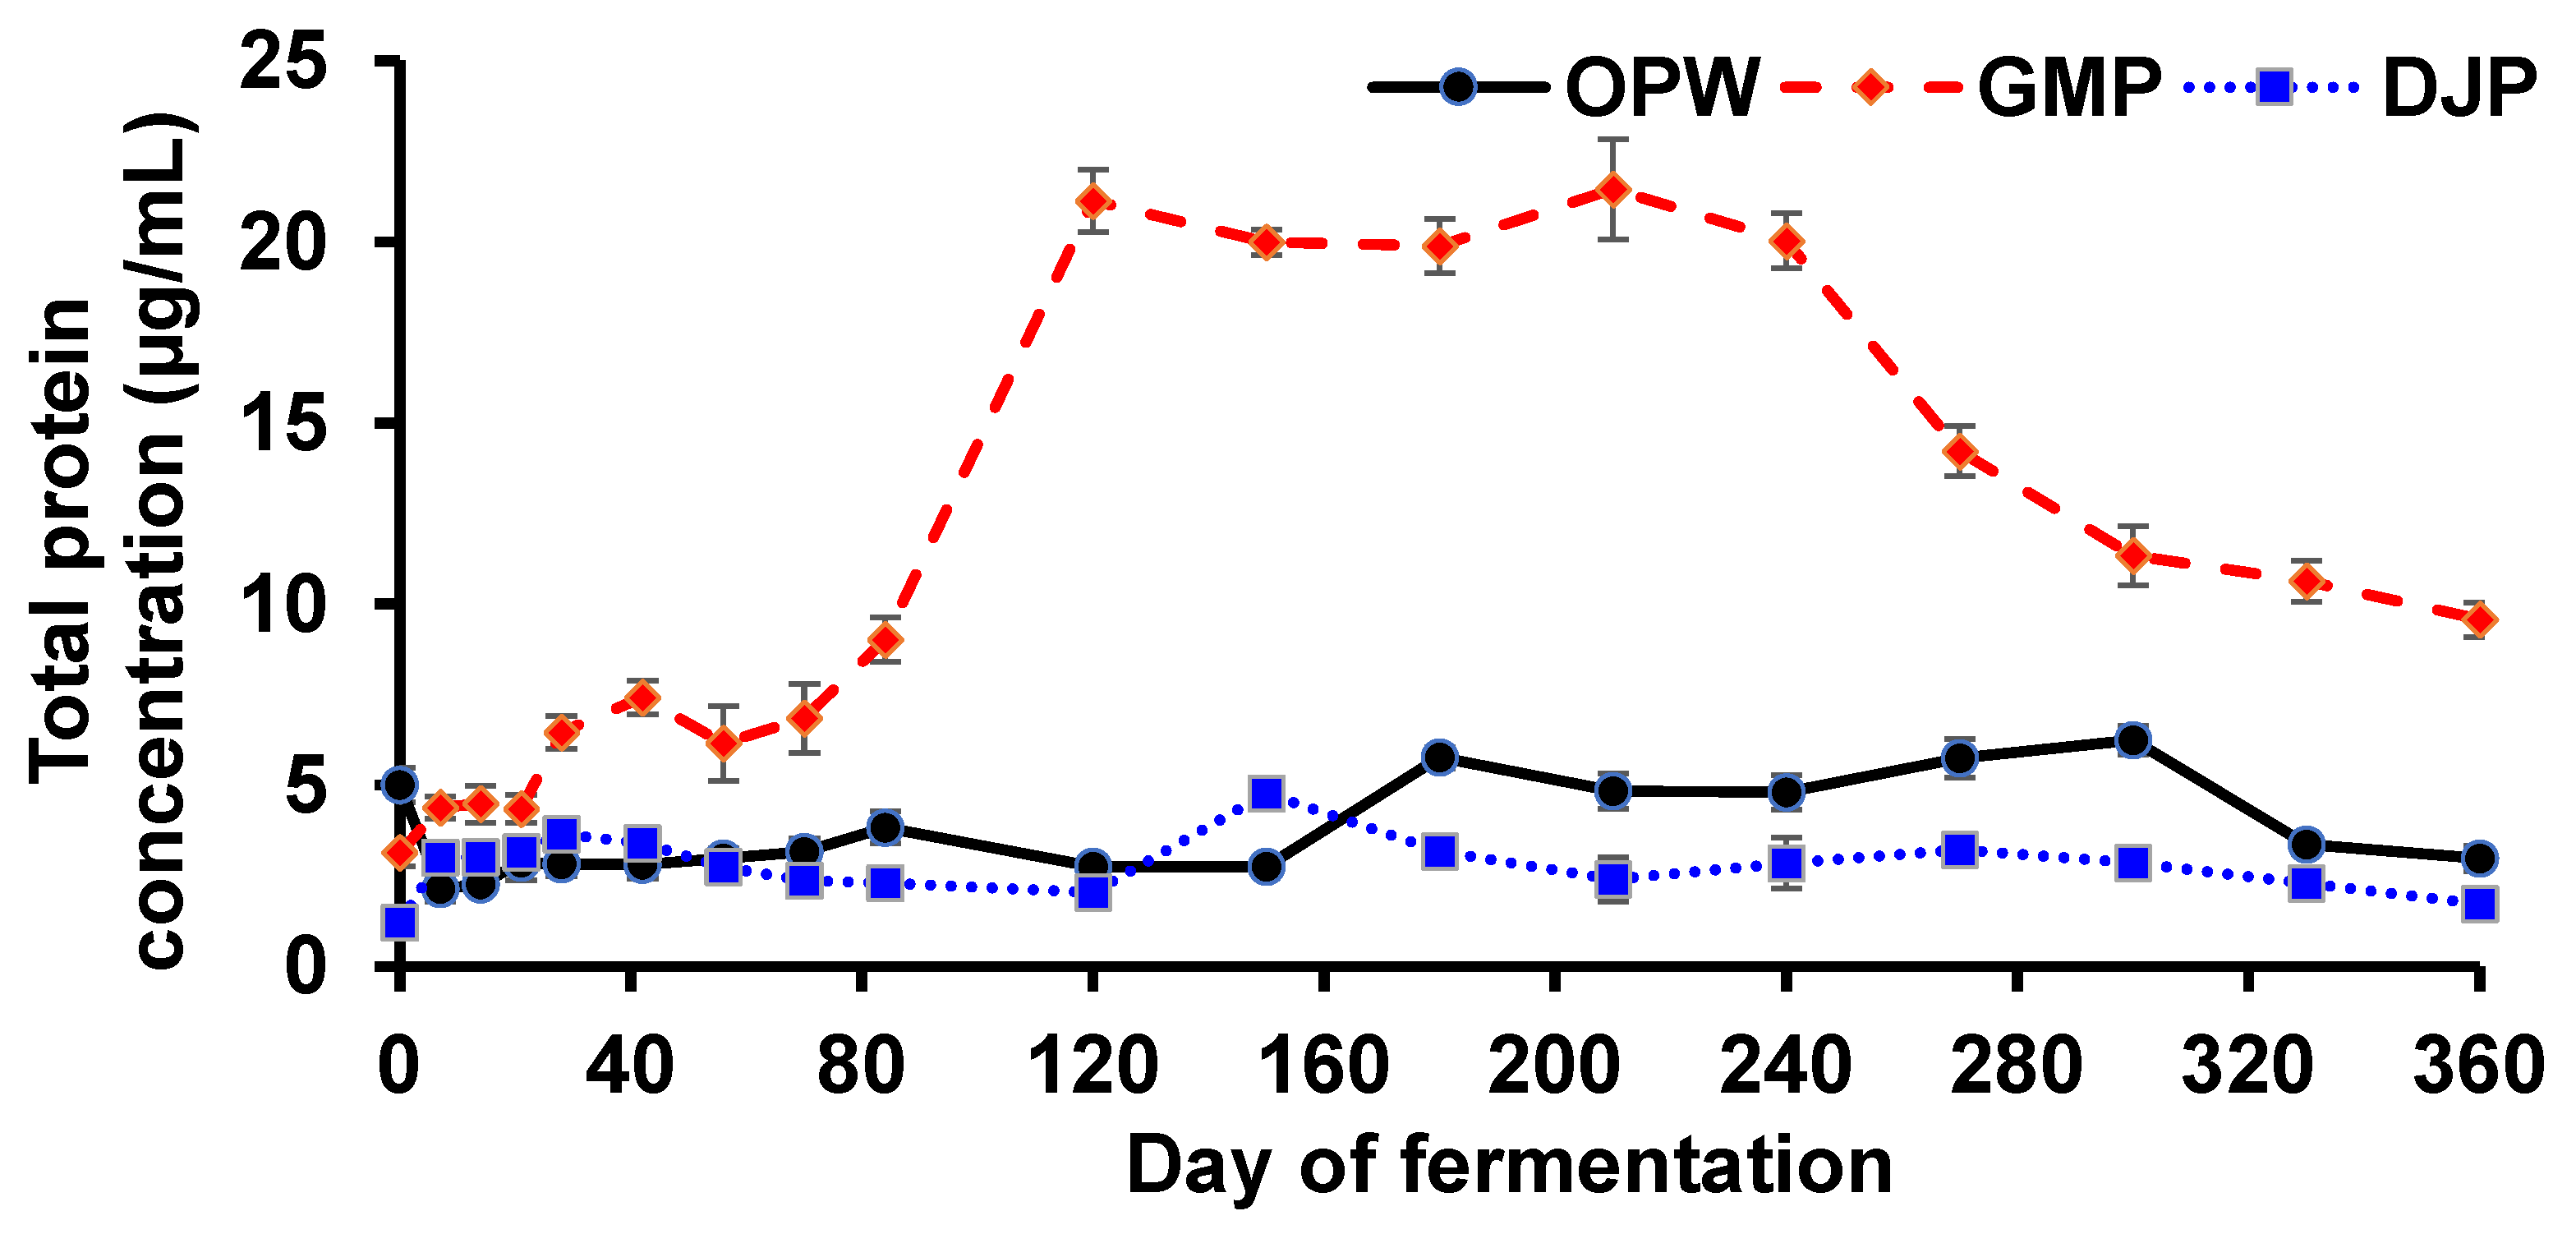
3.2.1. Total Protein Concentration
3.2.2. Amylase Activity
3.2.3. Protease Activity
3.2.4. Lipase Activity
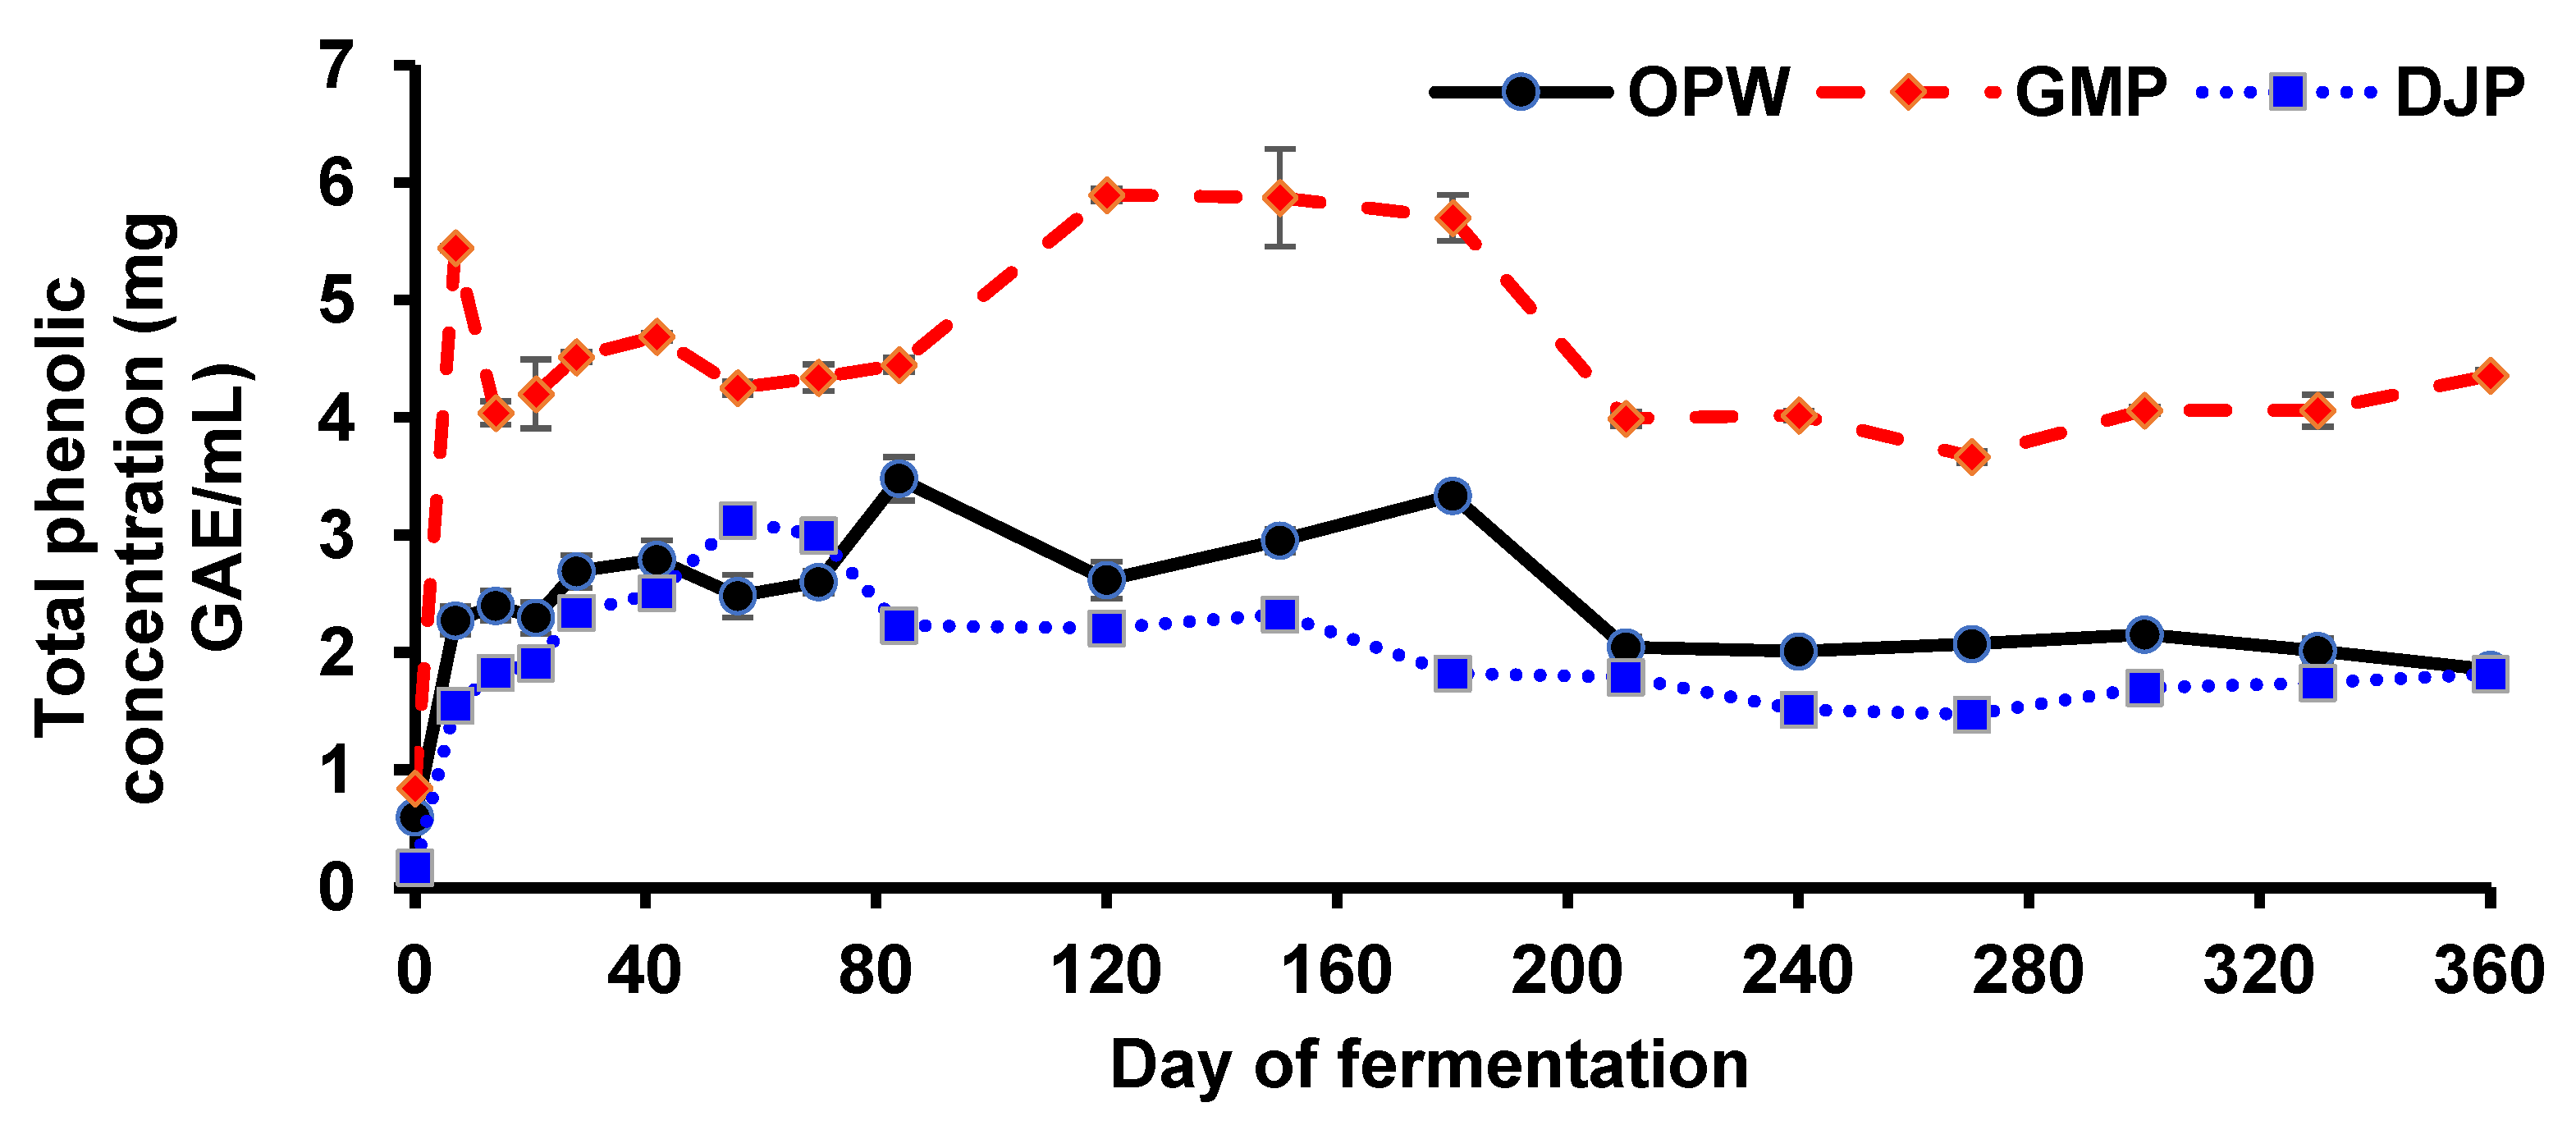
3.3. Total Phenolic Concentration
3.4. Total Carbohydrate Concentration
3.5. Total Alcohol Concentration
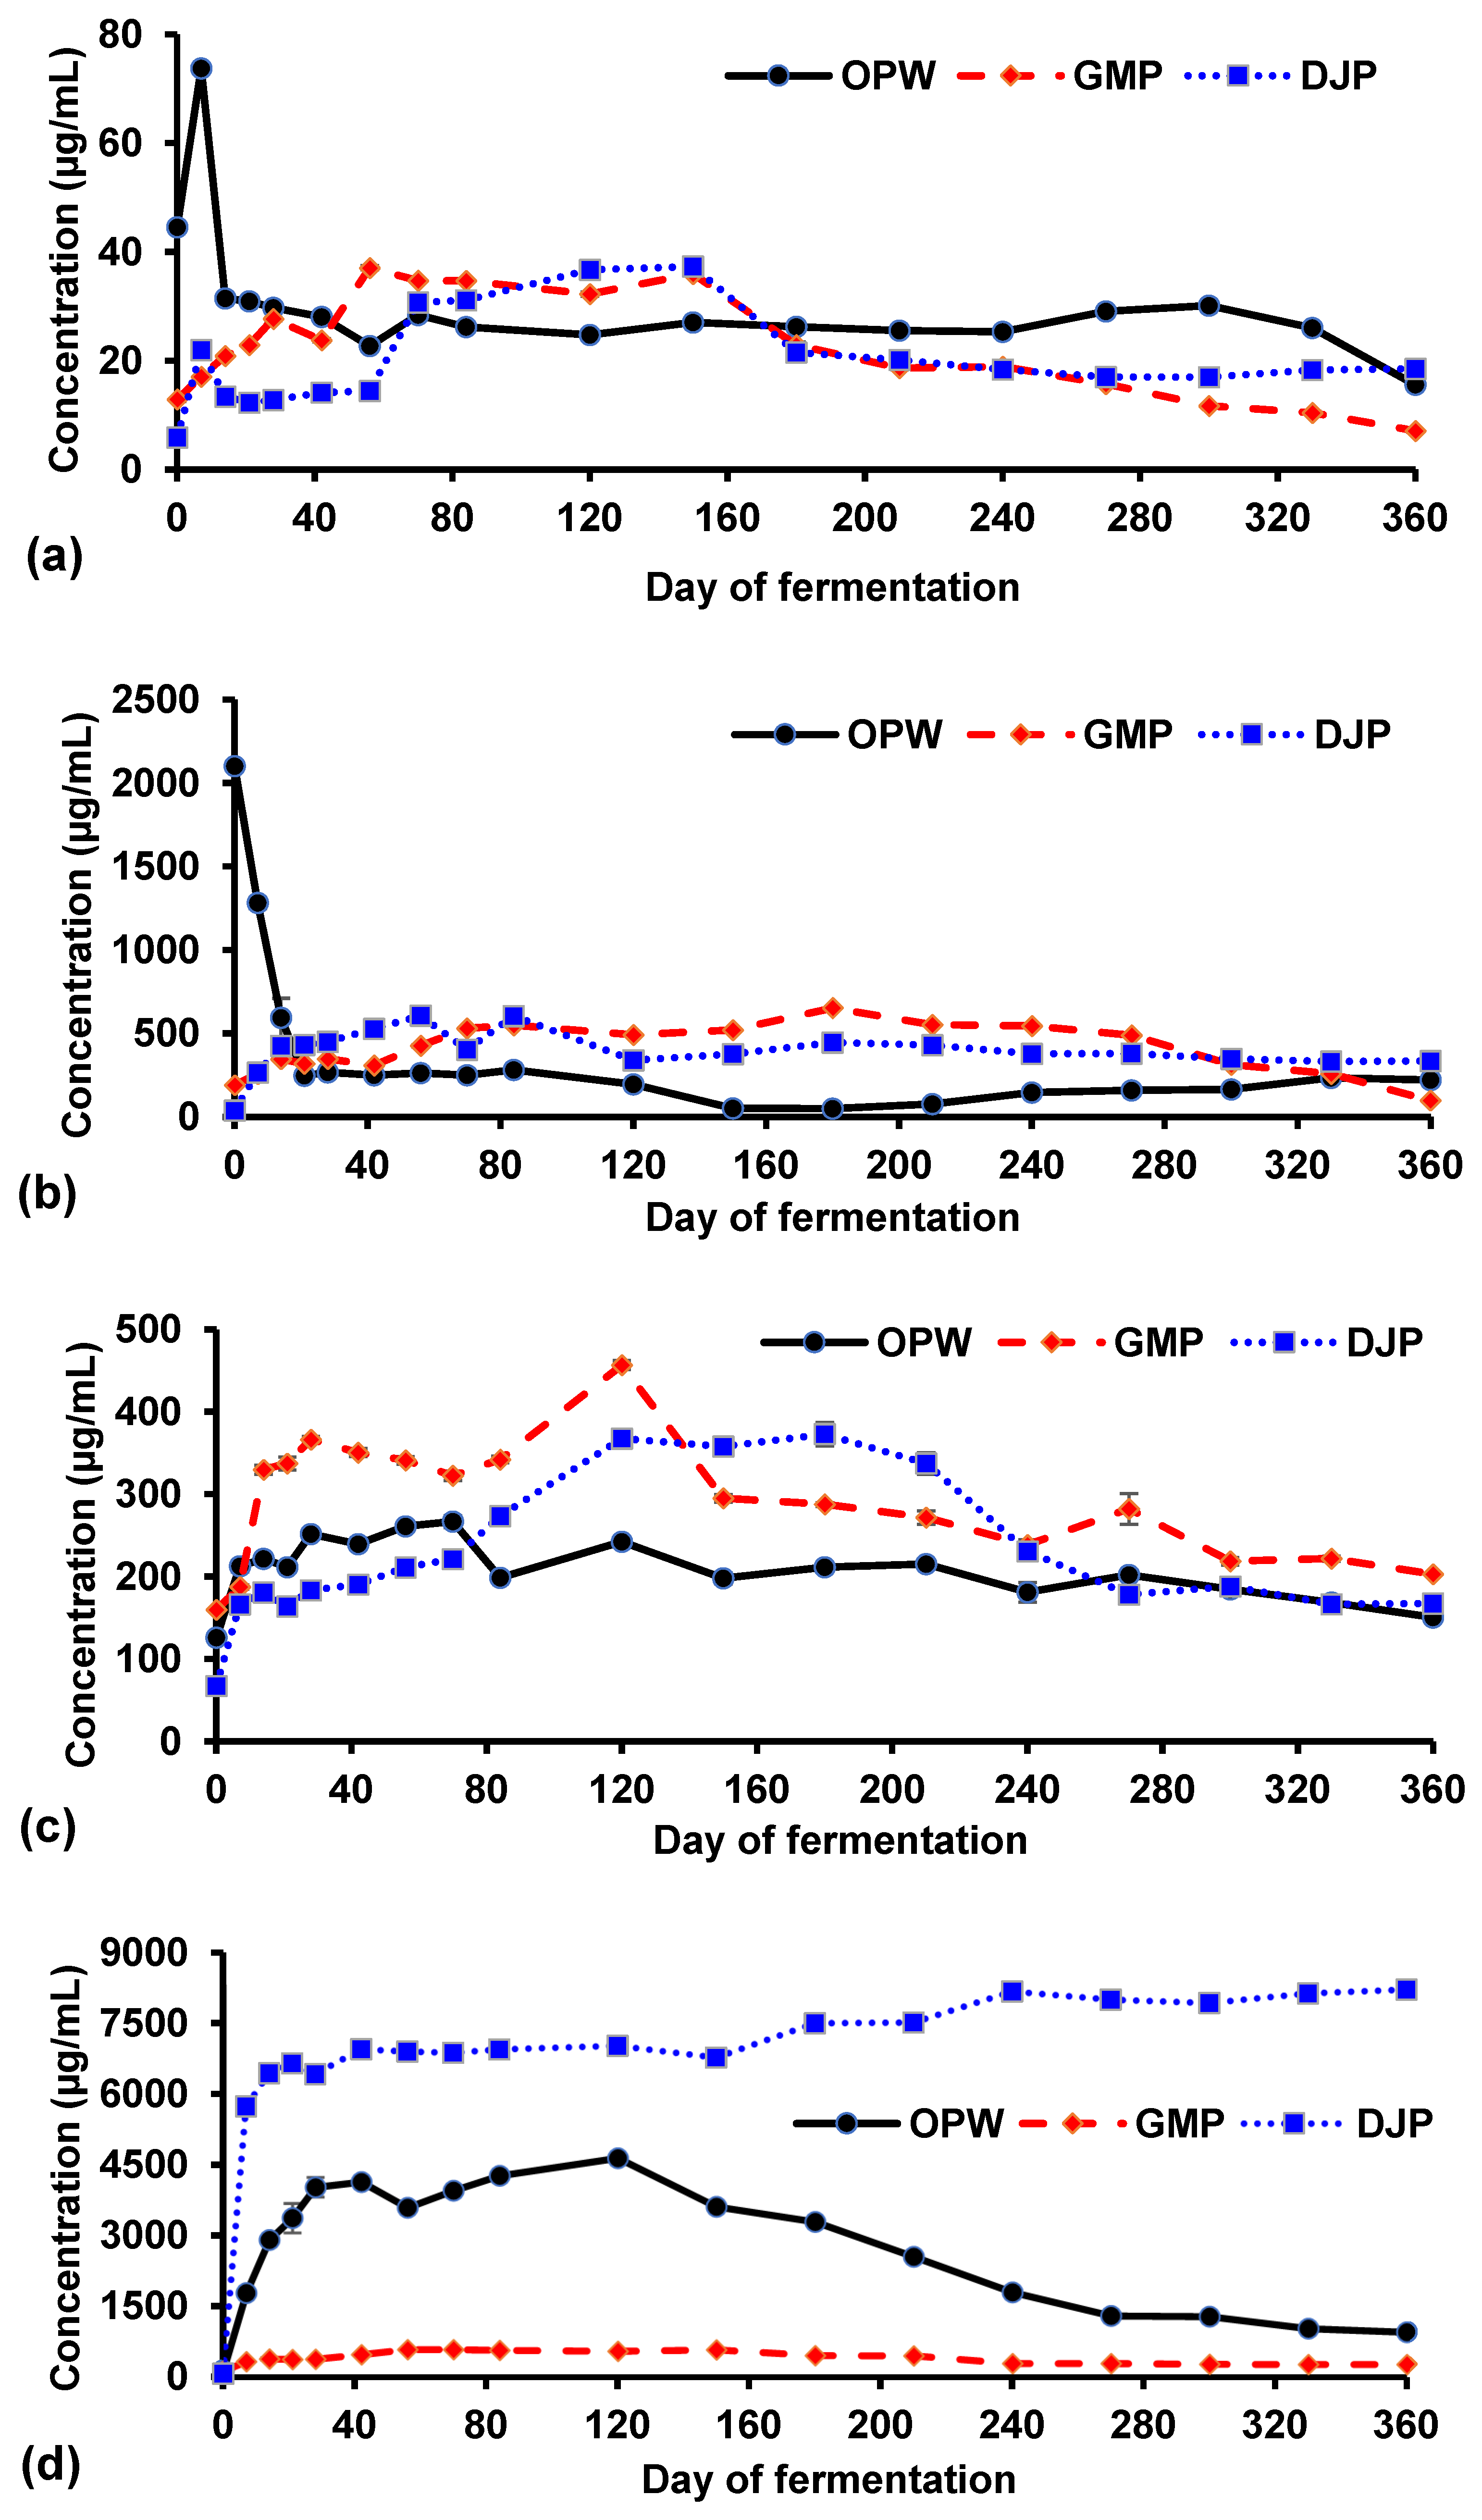
3.6. Organic Acid Content
4. Discussion
5. Conclusions
Supplementary Materials
Author Contributions
Funding
Institutional Review Board Statement
Informed Consent Statement
Data Availability Statement
Acknowledgments
Conflicts of Interest
Abbreviations
| OPW | Orange–papaya–watermelon |
| GMP | Grapefruit–mango–pineapple |
| DJP | Durian–jackfruit–passion fruit |
| GAE | Gallic acid equivalent |
| DNSA | 3,5-Dinitrosalicylic acid |
| 4-NPP | 4-nitrophenyl palmitate |
References
- Zainal, F. Daily Food Waste Staggering. TheStar. Available online: https://www.thestar.com.my/news/nation/2021/05/20/daily-food-waste-staggering (accessed on 22 September 2023).
- Lytras, G.; Lytras, C.; Mathioudakis, D.; Papadopoulou, K.; Lyberatos, G. Food Waste Valorisation Based on Anaerobic Digestion. Waste Biomass Valorization 2021, 12, 1677–1697. [Google Scholar] [CrossRef]
- Sánchez, M.; Laca, A.; Laca, A.; Díaz, M. Value-added Products from Fruit and Vegetable Wastes: A review. Clean-Soil Air Water 2021, 49, 2000376. [Google Scholar] [CrossRef]
- Ho, Y.M.; Ling, L.K.; Manaf, L.A. Garbage Enzyme as A Solution to Waste Minimization. In From Sources to Solution; Aris, A., Tengku Ismail, T., Harun, R., Abdullah, A., Ishak, M., Eds.; Springer: Singapore, 2014; pp. 347–350. [Google Scholar] [CrossRef]
- Arun, C.; Sivashanmugam, P. Investigation of Biocatalytic Potential of Garbage Enzyme and Its Influence on Stabilization of Industrial Waste Activated Sludge. Process Saf. Environ. Prot. 2015, 94, 471–478. [Google Scholar] [CrossRef]
- Rusdianasari, R.; Syakdani, A.; Zaman, M.; Sari, F.F.; Nasyta, N.P.; Amalia, R. Utilization of Eco-Enzymes from Fruit Skin Waste as Hand Sanitizer. Asian J. Appl. Res. Comm. Dev. Emp. 2021, 5, 23–27. [Google Scholar] [CrossRef]
- Xu, S.; Gu, X.; Wu, Q.; Gao, Y.; Cai, Y.; Ma, S.; Zheng, Z.; Wang, X. An Ecological and Economic Approach to Enhancing the Agronomic Quality of Anaerobic Digestate: Effects of Adding Agricultural Jiaosu on Metabolism and the Microbial Community. Chem. Eng. J. 2023, 468, 143648. [Google Scholar] [CrossRef]
- Zhang, Y.; Gao, Y.; Zheng, Z.; Meng, X.; Cai, Y.; Liu, J.; Hu, Y.; Yan, S.; Wang, X. A Microbial Ecosystem: Agricultural Jiaosu Achieves Effective and Lasting Antifungal Activity Against Botrytis cinerea. AMB Express 2020, 10, 216. [Google Scholar] [CrossRef]
- Bulai, I.S.; Adamu, H.; Umar, Y.A.; Sabo, A. Biocatalytic Remediation of Used Motor Oil-Contaminated Soil by Fruit Garbage Enzymes. J. Environ. Chem. Eng. 2021, 9, 105465. [Google Scholar] [CrossRef]
- Punniamoorthy, R.; Lee, W.S.; Loh, Q.P.; Goh, Y.; Tay, K.X.; Wong, K.H.; Ho, L.Y.; Sit, N.W. Biochemical Content, Antimicrobial, and Larvicidal Activities of Jiaosu Derived from Different Combinations of Fruit Wastes. Waste Biomass Valorization 2024, 15, 6927–6939. [Google Scholar] [CrossRef]
- Ernst, O.; Zor, T. Linearization of the Bradford Protein Assay. J. Vis. Exp. 2010, 38, e1918. [Google Scholar] [CrossRef]
- Bezerra, R.P.; Borba, F.K.S.L.; Moreira, K.A.; Lima-Filho, J.L.; Porto, A.L.F.; Chaves, A.C. Extraction of Amylase from Fermentation Broth in Poly (Ethylene Glycol) Salt Aqueous Two-Phase System. Braz. Arch. Biol. Technol. 2006, 49, 547–555. [Google Scholar] [CrossRef]
- Cupp-Enyard, C. Sigma’s Non-Specific Protease Activity Assay-Casein as a Substrate. J. Vis. Exp. 2008, 19, e899. [Google Scholar] [CrossRef]
- Ha, J.; Park, J.Y.; Choi, Y.; Chang, P.S.; Park, K.M. Comparative Analysis of Universal Protein Extraction Methodologies for Screening of Lipase Activity from Agricultural Products. Catalysts 2021, 11, 816. [Google Scholar] [CrossRef]
- Go, H.C.; Low, J.A.; Khoo, K.S.; Sit, N.W. Nutritional Composition, Biological Activities, and Cytotoxicity of the Underutilized Fruit of Eleiodoxa conferta. J. Food Meas. Charact. 2021, 15, 3962–3972. [Google Scholar] [CrossRef]
- Masuko, T.; Minami, A.; Iwasaki, N.; Majima, T.; Nishimura, S.I.; Lee, Y.C. Carbohydrate Analysis by a Phenol-Sulfuric Acid Method in Microplate Format. Anal. Biochem. 2005, 339, 69–72. [Google Scholar] [CrossRef] [PubMed]
- Zhang, P.; Hai, H.; Sun, D.; Yuan, W.; Liu, W.; Ding, R.; Teng, M.; Ma, L.; Tian, J.; Chen, C. A High Throughput Method for Total Alcohol Determination in Fermentation Broths. BMC Biotechnol. 2019, 19, 30. [Google Scholar] [CrossRef] [PubMed]
- Lee, S.W.; Yoon, S.R.; Kim, G.R.; Woo, S.M.; Jeong, Y.J.; Yeo, S.H.; Kim, K.S.; Kwon, J.H. Effect of Nuruk and Fermentation Method on Organic Acid and Volatile Compounds in Brown Rice Vinegar. Food Sci. Biotechnol. 2012, 21, 453–460. [Google Scholar] [CrossRef]
- Nkhata, S.G.; Ayua, E.; Kamau, E.H.; Shingiro, J.B. Fermentation and Germination Improve Nutritional Value of Cereals and Legumes Through Activation of Endogenous Enzymes. Food Sci. Nutr. 2018, 6, 2446–2458. [Google Scholar] [CrossRef]
- Chadha, R. Wealth from Waste: A Review of Garbage Enzyme. Int. Res. J. Eng. Technol. 2023, 10, 952–956. [Google Scholar]
- Nalladiyil, A.; Prakash, P.; Babu, G.S. Garbage Enzyme-Mediated Treatment of Landfill Leachate: A Sustainable Approach. Bioresour. Technol. 2023, 385, 129361. [Google Scholar] [CrossRef]
- Samriti; Sarabhai, S.; Arya, A. Garbage Enzyme: A Study on Compositional Analysis of Kitchen Waste Ferments. Pharma Innov. 2019, 8, 1193–1197. [Google Scholar]
- Garg, N.; Singh, B.; Vaish, S.; Kumar, S. Enzyme Production from Different Fruit and Vegetable Waste Using Lactic Acid Fermentation. J. Eco-Friendly Agric. 2021, 16, 74–76. [Google Scholar] [CrossRef]
- Chin, Y.Y.; Goeting, R.; Alas, Y.B.; Shivanand, P. From Fruit Waste to Enzymes. Sci. Bruneiana 2018, 17, 1–12. [Google Scholar] [CrossRef]
- Selvakumar, P.; Sivashanmugam, P. Optimization of Lipase Production from Organic Solid Waste by Anaerobic Digestion and Its Application in Biodiesel Production. Fuel Process. Technol. 2017, 165, 1–8. [Google Scholar] [CrossRef]
- Wang, C.Y.; Wu, S.J.; Shyu, Y.T. Antioxidant Properties of Certain Cereals as Affected by Food-Grade Bacteria Fermentation. J. Biosci. Bioeng. 2014, 117, 449–456. [Google Scholar] [CrossRef] [PubMed]
- Rusdianasari; Syakdani, A.; Zaman, M.; Sari, F.F.; Nasyta, N.P.; Amalia, R. Production of Disinfectant by Utilizing Eco-enzyme from Fruit Peels Waste. Int. J. Res. Vocat. Stud. 2021, 1, 1–7. [Google Scholar] [CrossRef]
- Balasundram, N.; Sundram, K.; Samman, S. Phenolic Compounds in Plants and Agri-Industrial By-Products: Antioxidant Activity, Occurrence, and Potential Uses. Food Chem. 2006, 99, 191–203. [Google Scholar] [CrossRef]
- Li, Y.; Guo, C.; Yang, J.; Wei, J.; Xu, J.; Cheng, S. Evaluation of Antioxidant Properties of Pomegranate Peel Extract in Comparison with Pomegranate Pulp Extract. Food Chem. 2006, 96, 254–260. [Google Scholar] [CrossRef]
- Singh, A.K.; Rath, S.; Kumar, Y.; Masih, H.; Peter, J.K.; Benjamin, J.C.; Singh, P.K.; Dipuraj; Singh, P. Bio-ethanol Production from Banana Peel by Simultaneous Saccharification and Fermentation Process Using Cocultures Aspergillus niger and Saccharomyces cerevisiae. Int. J. Curr. Microbiol. Appl. Sci. 2014, 3, 84–96. [Google Scholar]
- Bhat, S.V.; Akhtar, R.; Amin, T. An Overview on the Biological Production of Vinegar. Int. J. Fermented Foods 2014, 3, 139–155. [Google Scholar] [CrossRef]
- Zhang, L.; Tu, Z.C.; Xie, X.; Wang, H.; Wang, H.; Wang, Z.X.; Sha, X.M.; Lu, Y. Jackfruit (Artocarpus heterophyllus Lam.) Peel: A Better Source of Antioxidants and A-Glucosidase Inhibitors Than Pulp, Flake and Seed, and Phytochemical Profile by HPLC-QTOF-MS/MS. Food Chem. 2017, 234, 303–313. [Google Scholar] [CrossRef]
- Liew, S.S.; Ho, W.Y.; Yeap, S.K.; Bin Sharifudin, S.A. Phytochemical Composition and In Vitro Antioxidant Activities of Citrus sinensis Peel Extracts. PeerJ 2018, 2018, e5331. [Google Scholar] [CrossRef]
- Koffi, L.E.; Ekissi, G.S.E.; Konan, H.K.; Gbotognon, J.O.; Kouadio, J.P.N. Composition of Organic Acids and Anti-Nutritional Factors of Papaya (Carica papaya L. var solo 8) at Different Stages of Maturity. World J. Pharm. Med. Res. 2020, 6, 5–10. [Google Scholar]
- Tomasik, P.; Horton, D. Enzymatic Conversions of Starch. Adv. Carbohydr. Chem. Biochem. 2012, 68, 59–436. [Google Scholar] [CrossRef]
- Arun, C.; Sivashanmugam, P. Identification and Optimization of Parameters for the Semi-Continuous Production of Garbage Enzyme from Pre-Consumer Organic Waste by Green RP-HPLC Method. Waste Manag. 2015, 44, 28–33. [Google Scholar] [CrossRef] [PubMed]
- Mudaliyar, P.; Sharma, L.; Kulkarni, C. Food Waste Management—Lactic Acid Production by Lactobacillus Species. Int. J. Adv. Biol. Res. 2011, 1, 52–56. [Google Scholar]
- Cui, F.; Li, Y.; Wan, C. Lactic Acid Production from Corn Stover Using Mixed Cultures of Lactobacillus rhamnosus and Lactobacillus brevis. Bioresour. Technol. 2011, 102, 1831–1836. [Google Scholar] [CrossRef] [PubMed]
- Zain, N.A.M.; Aziman, S.N.; Suhaimi, M.S.; Idris, A. Optimization of L(+) Lactic Acid Production from Solid Pineapple Waste (SPW) by Rhizopus oryzae NRRL 395. J. Polym. Environ. 2021, 29, 230–249. [Google Scholar] [CrossRef]
- Angumeenal, A.R.; Venkappayya, D. An Overview of Citric Acid Production. LWT-Food Sci. Technol. 2013, 50, 367–370. [Google Scholar] [CrossRef]
- Woo, W.X.; Nasoha, N.Z.B.; Luthfi, A.A.I.; Yeap, S.K.; Hui, Y.W.; Bukhari, N.A.; Manaf, S.F.A.; Tan, J.P. Bio-based Succinic Acid Production from Durian Husk: A Rising Southeast Asia Agricultural Waste. Ind. Crops Prod. 2023, 206, 117624. [Google Scholar] [CrossRef]
- Zhang, H.; Zhou, F.; Ji, B.; Nout, R.M.; Fang, Q.; Yang, Z. Determination of Organic Acids Evolution During Apple Cider Fermentation Using an Improved HPLC Analysis Method. Eur. Food Res. Technol. 2008, 227, 1183–1190. [Google Scholar] [CrossRef]
- Dutta, A.; Sahoo, S.; Mishra, R.R.; Pradhan, B.; Das, A.; Behera, B.C. A Comparative Study of Citric Acid Production from Different Agro-Industrial Wastes by Aspergillus niger Isolated from Mangrove Forest Soil. Environ. Exp. Biol. 2019, 17, 115–122. [Google Scholar] [CrossRef]
- Ayeni, A.O.; Daramola, M.O.; Taiwo, O.; Olanrewaju, O.; Oyekunle, D.T.; Sekoai, P.T.; Elehinafe, F.B. Production of Citric Acid from the Fermentation of Pineapple Waste by Aspergillus niger. Open Chem. Eng. J. 2019, 13, 88–96. [Google Scholar] [CrossRef]
- Yao, P.; Zhao, S.; Cheng, L.; Zhao, C. Effects of Different Fermentation Methods on Chemical Composition, Antioxidant Activity, and Enzymatic Inhibition of Fermented Fig Juice. CyTA-J. Food 2024, 22, 2326299. [Google Scholar] [CrossRef]
- Wu, N.; Zhang, J.; Chen, Y.; Xu, Q.; Song, P.; Li, Y.; Li, K.; Liu, H. Recent Advances in Microbial Production of L-Malic Acid. Appl. Microbiol. Biotechnol. 2022, 106, 7973–7992. [Google Scholar] [CrossRef]
- Suto, M.; Kawashima, H. Discrimination for Sake Brewing Methods by Compound Specific Isotope Analysis and Formation Mechanism of Organic Acids in Sake. Food Chem. 2022, 381, 132295. [Google Scholar] [CrossRef] [PubMed]
- Fu, H.X.; Zhang, L.L.; He, B.; Yue, P.X.; Gao, X.L. Analysis of Organic Acids in Blueberry Juice and Its Fermented Wine by High Performance Liquid Chromatography. Adv. J. Food Sci. Technol. 2015, 9, 127–134. [Google Scholar] [CrossRef]
- He, Y.; Zhu, Y.; Lv, J.; Gu, Y.; Wang, T.; Chen, J. Effects of Lactic Acid Bacteria Fermentation on the Bioactive Composition, Volatile Compounds and Antioxidant Activity of Huyou (Citrus aurantium ‘Changshan-huyou’) Peel and Pomace. Food Qual. Saf. 2023, 7, fyad003. [Google Scholar] [CrossRef]
- Jantwal, A.; Durgapal, S.; Upadhyay, J.; Joshi, T.; Kumar, A. Tartaric acid. In Antioxidants Effects in Health: The Bright and the Dark Side; Nabavi, S.M., Silva, A.S., Eds.; Elsevier: Amsterdam, The Netherland, 2022; pp. 485–492. [Google Scholar]
- Zheng, Z.; Wei, L.; Zhu, M.; Qian, Z.; Liu, J.; Zhang, L.; Xu, Y. Effect of Lactic Acid Bacteria Co-Fermentation on Antioxidant Activity and Metabolomic Profiles of a Juice Made from Wolfberry and Longan. Food Res. Int. 2023, 174, 113547. [Google Scholar] [CrossRef]


Disclaimer/Publisher’s Note: The statements, opinions and data contained in all publications are solely those of the individual author(s) and contributor(s) and not of MDPI and/or the editor(s). MDPI and/or the editor(s) disclaim responsibility for any injury to people or property resulting from any ideas, methods, instructions or products referred to in the content. |
© 2025 by the authors. Licensee MDPI, Basel, Switzerland. This article is an open access article distributed under the terms and conditions of the Creative Commons Attribution (CC BY) license (https://creativecommons.org/licenses/by/4.0/).
Share and Cite
Punniamoorthy, R.; Wong, K.H.; Looi, S.Y.; Sit, N.W. Time Course Evaluation of Biochemical Contents and Biocatalytic Activities of Jiaosu from Fruit Wastes During One-Year Natural Fermentation. Fermentation 2025, 11, 254. https://doi.org/10.3390/fermentation11050254
Punniamoorthy R, Wong KH, Looi SY, Sit NW. Time Course Evaluation of Biochemical Contents and Biocatalytic Activities of Jiaosu from Fruit Wastes During One-Year Natural Fermentation. Fermentation. 2025; 11(5):254. https://doi.org/10.3390/fermentation11050254
Chicago/Turabian StylePunniamoorthy, Rhupinee, Kam Huei Wong, Sing Yan Looi, and Nam Weng Sit. 2025. "Time Course Evaluation of Biochemical Contents and Biocatalytic Activities of Jiaosu from Fruit Wastes During One-Year Natural Fermentation" Fermentation 11, no. 5: 254. https://doi.org/10.3390/fermentation11050254
APA StylePunniamoorthy, R., Wong, K. H., Looi, S. Y., & Sit, N. W. (2025). Time Course Evaluation of Biochemical Contents and Biocatalytic Activities of Jiaosu from Fruit Wastes During One-Year Natural Fermentation. Fermentation, 11(5), 254. https://doi.org/10.3390/fermentation11050254