Article

Oxidative, Inflammatory, and Constipation Stress Modulation by a Heteropolysaccharide from Lacticaseibacillus rhamnosus CRL75

by
René Emanuel Lobo
1,2,3,†,
Ana Magdalena Ávila
1,†,
Jonathan Laiño
1,
Verónica Molina
1,
Diego Navarro
4,
María Inés Gómez
5,
María Inés Torino
1,* and
María Pía Taranto
1
1
Laboratory of Technology and Development, Reference Centre for Lactobacilli (CERELA–CONICET CCT NOA Sur), Batalla de Chacabuco 145, San Miguel de Tucumán, Tucumán T4000, Argentina
2
Institute of Analytical Chemistry (Cátedra de Química Analítica III and Cátedra de Química Tecnológica), Faculty of Biochemistry, Chemistry and Pharmacy, National University of Tucumán, Batalla de Ayacucho 471, San Miguel de Tucumán, Tucumán T4000, Argentina
3
Institute of Chemistry Physics (Cátedra de Fisicoquímica II), Faculty of Biochemistry, Chemistry and Pharmacy, National University of Tucumán, Combate de San Lorenzo 456, San Miguel de Tucumán, Tucumán T4000, Argentina
4
Department of Organic Chemistry (CIHIDECAR–CONICET), Pabellón 2, Faculty of Exact and Natural Sciences, University of Buenos Aires, Ciudad Universitaria, Buenos Aires C1428, Argentina
5
Institute of Inorganic Chemistry, Faculty of Biochemistry, Chemistry and Pharmacy, National University of Tucumán, Batalla de Ayacucho 471, San Miguel de Tucuman, Tucumán T4000, Argentina
*
Author to whom correspondence should be addressed.
These authors contributed equally to this work.
Fermentation 2025, 11(4), 224; https://doi.org/10.3390/fermentation11040224
Submission received: 25 February 2025 / Revised: 23 March 2025 / Accepted: 29 March 2025 / Published: 17 April 2025
(This article belongs to the Special Issue Applications of Lactic Acid Bacteria in Fermented Foods and Beverages)

Abstract

:
Lacticaseibacillus (L.) rhamnosus CRL75 is a lactic acid bacterium (LAB) isolated from local dairy products, demonstrating significant adaptation in skimmed milk (FM75). In this context, CRL75 exhibited high microbial growth (3.63 ± 0.18 log CFU·mL−1), strong acidification (9.20 ± 0.10 g·L−1 lactic acid, and 2.40 ± 0.10 pH units), and increased viscosity in FM75 after 16 h of fermentation. Additionally, this LAB strain produces both capsular polysaccharides (CPS+) and extracellular polysaccharides (EPS75), contributing to a ropy phenotype (>10 cm). The purified EPS75 (70.70 ± 3.25 mg·L−1) displayed low molecular weight (12.7 kDa), with galactose and glucose as its primary monomers in a 4:1 ratio. In aqueous environments, EPS75 exhibited an extended size (147 nm), a random coil structure, and macromolecular aggregation. Furthermore, vibrational spectroscopy confirmed the presence of a neutral EPS with high thermal stability. Additionally, EPS75 exhibited dose-dependent antioxidant activity, effectively reducing metal ions (Fe3+, Mo6+, and Mn7+) and stabilizing radicals (ABTS•+, HO, O2•−, and HOO). The biopolymer also demonstrated immunostimulatory and anti-inflammatory effects in RAW 264.7 cells. In vivo assays using Balb/c mice indicated that both EPS75 and FM75 prevented constipation, suggesting their potential as natural and safe agents for constipation-related disorders. Due to its viscosifying and health-promoting attributes, CRL75 offers promising applications for functional dairy products.

1. Introduction

Certain lactic acid bacteria (LAB) strains synthesize extracellular polysaccharides that are secreted beyond the cell wall, either remaining attached as capsular polysaccharides (CPSs) or being released as free, slime-like material (EPS). Based on their chemical composition, EPSs can be classified as homopolysaccharides (HoPSs), consisting of a single monosaccharide (e.g., D-glucopyranose or D-fructofuranose), or heteropolysaccharides (HePSs), composed of two or more monosaccharides. The structural and functional properties of LAB HePSs vary significantly, influencing their composition, linkage types, molecular weight, and biological function [1].
The physiological role of EPSs in their native environments remains incompletely understood. However, EPSs are proposed to act as energy reserves, protective barriers against cytotoxic agents (e.g., bacteriophages; antibiotics; toxins; or extreme pH, temperature, and osmotic stress), and adhesion factors facilitating bacterial attachment to surfaces (e.g., fermented foods; and symbiotic microbial cultures, like kefir grains or kombucha) and host tissues (e.g., mucosal epithelial cells). Due to their physicochemical and biological properties, LAB-derived EPSs have generated increasing interest in industrial applications, particularly in agrifood technology, pharmaceutical development, and the creation of novel biomaterials [2,3].
In the dairy industry, LAB strains used in fermented milk production (e.g., yogurt, kefir, sour milk, cultured cream, and cheese) synthesize EPSs, enhancing the rheological and textural properties of the final products. During milk fermentation, EPSs interact with casein curds, promoting water retention and inhibiting syneresis in fermented dairy drinks. Additionally, their interaction with proteins strengthens the casein network, improving the viscosity, smoothness, and stability of yogurt gels and other dairy products [3,4]. The extent of these modifications depends on the chemical structure of the EPS, including molecular weight, glycosidic linkages, and the presence of side chains. Beyond their technological applications, LAB-derived EPS shows several biological properties, including antioxidant, immune-stimulating, antitumor, gastroprotective, and antiviral activities. Understanding the structure–function relationship of EPS is crucial for tailoring their properties through chemical, enzymatic, or genetic modifications for specific applications in fermented dairy products [5].
Certain LAB strains, particularly those belonging to the Lactobacillus genus, have been recognized for their probiotic potential, which is defined as “live microorganisms that, when administered in adequate amounts, confer a health benefit to the host” [6]. While many lactobacilli have been extensively studied for their probiotic attributes, their functional properties vary depending on strain-specific characteristics and application contexts. Large-scale genomic studies have highlighted the diversity of gene clusters involved in EPS biosynthesis among lactobacilli, suggesting that EPS may play key roles in bacterial aggregation, biofilm formation, interactions with intestinal epithelial cells, immune modulation, and the dynamics of the gut microbiota [6,7,8].
Among the EPS-producing LAB, some strains of Lacticaseibacillus (L.) rhamnosus are known to produce EPS with varying biotechnological and biological functions, such as anti-tumoral, cholesterol-reducing, anti-UVB irradiation, prebiotic, immunostimulatory, antibiofilm, and antidiabetic activities [9]. These specific bioactivities can be influenced by several factors, including the isolation source. Consequently, the physicochemical characterization of new EPSs is critical for determining potential applications. This study presents a partial structural characterization of EPS75, an exopolysaccharide isolated from milk fermented by L. rhamnosus CRL75 and explores its antioxidant, anti-inflammatory, and intestinal transit-regulating properties—findings that have not been previously reported.

2. Materials and Methods

2.1. Milk Fermentation and EPS Isolation

The EPS-producing strain Lacticaseibacillus (L.) rhamnosus CRL75 was maintained in the CERELA culture collection. Stock cultures were stored at −80 °C in sterile reconstituted skim milk (10% m·v−1, RSM) supplemented with 20% (v·v−1) glycerol as a cryoprotectant. Prior to experimentation, CRL75 was activated in De Man, Rogosa, and Sharpe (MRS) broth at 37 °C for 16 h. EPS production was carried out using RSM medium, sterilized at 121 °C for 15 min. Fermentation was conducted in Schott flasks containing 1 L of RSM medium, inoculated with 2% (v·v−1) of the bacterial culture, and incubated at 37 °C under aerobic and static conditions for 16 h.
Phenotypic traits such as capsular polysaccharide formation, mucoid appearance, or ropy culture morphology (observed on MRS agar and RSM agar) were assessed following the methodology described by Mozzi et al. [10]. Viscosity measurements were performed using a digital viscometer NDJ–8ST (Biotraza, Buenos Aires, Argentina). Bacterial growth (log CFU·mL−1), pH measurements, and titratable acidity of FM75 were determined according to Lobo et al. [11]. Meanwhile, the maximum growth rates (μmax·BG, log CFU·mL−1·h−1) and maximum acidification rate (μmax·pH, pH units·h−1) were calculated as follows:
μmax·pH = (pH(16h) − pH(0h))/(t16h − t0h)
μmax·BG = (CFU·mL−1(16h) − CFU·mL−1(0h))/(t16h − t0h)
where μmax·pH and μmax·BG denote the maximum acidification and bacterial growth rates, respectively; the parameters pH(0h) and pH(16h) correspond to the pH measurements recorded at 0 and 16 h; and CFU·mL−1(0h) and CFU·mL−1(16h) represent the bacterial counts determined at these respective time points.
EPS isolation was performed by treating FM75 with 12% (w·v−1) trichloroacetic acid for 2 h at 4 °C. The mixture was then centrifuged (9500× g, 12 min, 4 °C) to remove bacterial cells and coagulated proteins. The clear supernatant was precipitated by adding three volumes of chilled 96% ethanol and incubated at −20 °C for 48 h. The precipitate was collected via centrifugation (20,000× g, 30 min, 4 °C), dialyzed (cellulose membrane, MWCO 10,000, Thermo Scientific Inc., Waltham, MA, USA) against distilled water at 4 °C for 48 h to remove small molecules and ions, and subsequently freeze-dried. The yield (mg·L−1) was determined by weight, and purity was assessed following standardized protocols [11].

2.2. Partial Characterization

2.2.1. Molecular Weight and Monomer Composition

The molecular weight (Mw) of purified EPS75 was determined by size-exclusion high-performance liquid chromatography (SEC–HPLC, Knauer Wellchrom System, Berlin, Germany) equipped with an UltrahydrogelTM linear column (300 × 7.8 mm, Waters, Milford, MA, USA). A 20 μL sample solution was injected and eluted with 0.1 M NaNO3 at a flow rate of 0.6 mL·min−1. A calibration curve was generated using dextran standards (Sigma Aldrich, St. Louis, MO, USA, 39.1 kDa, 73 kDa, 515 kDa, 2000 kDa, and 4900 kDa).
For monomer analysis, 10 mg of pure, freeze-dried EPS was dissolved in 0.5 mL of ultra-pure water. After the addition of an equal volume of 6 N trifluoroacetic acid, acid hydrolysis was performed at 100 °C for 3 h [12]. After TFA removal via evaporation, the hydrolyzed EPS was freeze-dried and redissolved in ultra-pure water at a concentration of 100 μg·mL−1. The hydrolyzed sugars were quantified by HPLC using a Knauer Chromatograph (Knauer Wissenschaftliche Geräte GmbH, Berlin, Germany) equipped with a Rezex RPM-Monosaccharide Pb2+ (300 × 7.8 mm) column and a refractive-index detector. The sample (20 μL) was analyzed alongside five standard sugars: glucose, galactose, fructose, rhamnose, and glucosamine.

2.2.2. Fourier-Transform Infrared and Raman Spectroscopies

Fourier-transform infrared (FTIR) and Fourier-transform Raman (FTR) spectroscopies of EPS75 were acquired from solid samples using an FTIR spectrophotometer (FTIR GX1, Perkin Elmer, Waltham, MA, USA) and a DXR Raman microscope (Thermo Fisher Scientific, Waltham, MA, USA), respectively, according to previously established protocols [13,14]. OMNIC Series Software v.8 (Thermo Scientific, Waltham, MA, USA) was used for spectral processing. Spectra acquired for EPS75 were baseline-corrected and subsequently averaged using the Savitzky–Golay algorithm to produce a representative spectrum.

2.2.3. Refractive Index Increment (dn/dC) and Particle Size

The refractive index increment (dn/dC) of purified EPS75 was determined using a Brice-Phoenix BP-2000-V differential refractometer (Phoenix Precision Instrument Company, Butler, WI, USA). Analyses were performed using EPS solutions (0–1.70 mg·mL−1) in Milli-Q® water as the solvent.
The hydrodynamic diameter (Dh) was measured using a Zetasizer Nano ZS (Malvern Panalytical Ltd., Malvern, UK) with a scattering angle of 173°. Samples (0.1 mg·mL−1) were prepared in Milli-Q® water at pH 5.7 and filtered through a 0.22 μm Millipore® filter (Sigma Aldrich, USA).

2.2.4. Conformational Analysis: Congo Red Test

EPS75 solutions (2 mg⋅mL−1) were prepared in NaOH solutions at varying concentrations (0–0.5 M) holding 0.35 μM Congo red. After 3 h of incubation at room temperature, maximum visible absorption shifts (λmax, 400–600 nm) were recorded using a UV–visible spectrophotometer (Synergy HT–Biotek, Winooski, VT, USA). Milli-Q® water was used as a negative control.

2.3. Chromatic Parameter Evaluation

The colorimetric properties of purified EPS75 (5 g) were assessed using a Hunter Lab Colour Flex instrument A60-1012-312 (Hunter Associates Laboratory, Reston, VA, USA). Lightness (L*), redness (a*), and yellowness (b*) values were measured, and chroma (C*), hue angle (°H), whiteness index (WI), and yellowness index (YI) were calculated according to established protocols [15,16].

2.4. Thermal Properties Analysis

Thermal properties of EPS75 were analyzed via thermogravimetric analysis (TGA), differential thermal analysis (DTA), and differential scanning calorimetry (DSC). TGA and DTA assays were conducted using a Shimadzu TGA–DTA 50 (Nakagyō-ku, Kyoto, Japan) over a temperature range of 25–600 °C. Samples were placed in platinum crucibles and heated at 10 °C·min−1 under a nitrogen flow. DSC analysis was performed using a Perkin Elmer DSC 6 (Perkin Elmer, USA) with a nitrogen gas purge. Samples were heated in alumina crucibles at a rate of 10 °C·min−1, from 10 to 350 °C, and changes in enthalpy and melting points were recorded.

2.5. Biological Properties

2.5.1. Antioxidant Capacity

Antioxidant activity was assessed using the ABTS•+ radical scavenging, Fe3+/2+ reducing power, and Mo6+/5+ reducing power assays, as described by Lobo et al. [11]. Hydroxyl (HO), hydrogen peroxide (H2O2), and superoxide (O2•−) scavenging activities were determined according to Yang et al. [17], Rajoka et al. [18], and Wang et al. [19], respectively. The reducing power of Mn7+/4+ was analyzed as described by Hanchi et al. [20]. Ascorbic acid (VC) was used as a reference standard, and results were expressed as VC equivalents (eq.).

2.5.2. Anti-Inflammatory Activity

Cell culture: The murine monocyte cell line RAW 264.7 was cultured in RPMI 1640 medium supplemented with 25 mM HEPES, 2 mM L-glutamine (Sigma Aldrich, USA), 10% (v·v−1) fetal bovine serum (FBS, Natacor, Córdoba, Argentina), and 1% (m·v−1) penicillin–streptomycin–amphotericin B (Biological Industries, Israel). Cells were maintained at 37 °C in a humidified atmosphere containing 5% CO2. For stimulation assays, cells were seeded in 24-well plates at a density of 2 × 10⁵ cells·well−1 in 1 mL of culture medium and allowed to rest for 2 h before treatment.
EPS treatment: RAW 264.7 cells (2 × 10⁵ cells·well−1) were incubated in the aforementioned culture medium supplemented with varying concentrations of EPS75 (25, 50, 100, 200, and 400 ng·mL−1) for 18 h at 37 °C and 5% CO2. To assess the anti-inflammatory effects, cells were pretreated with EPS75 for 4 h, after which the medium was replaced with fresh medium containing LPS and incubated for an additional 14 h under the same conditions. Unstimulated cells served as a negative control, while cells treated with LPS alone were used as a positive control. Culture supernatants were collected and stored at −80 °C for cytokine analysis.
Cell proliferation and cytotoxicity: RAW 264.7 cells were seeded in 96-well plates at a density of 1.2 × 10⁴ cells·well−1 in 300 μL of culture medium and stimulated with EPS or LPS as described above. Cell viability was assessed using the MTT assay (Sigma Aldrich, USA). Briefly, following stimulation, the culture medium was replaced with 100 μL of fresh medium, and 50 μL of MTT stock solution (5 mg·mL−1 in sterile PBS) was added. After 4 h of incubation at 37 °C, 25 μL of the medium was removed, and 50 μL of DMSO was added to dissolve the formazan crystals. After 10 min of incubation at 37 °C, absorbance was measured at 540 nm. Results were expressed as a percentage of cell viability.
Cell damage and membrane permeability: Lactate dehydrogenase (LDH) release was used as an indicator of cell membrane integrity. LDH activity was quantified in culture supernatants following stimulation with LPS or EPS75, using an LDH-P UV kit (Wiener Lab, Rosario, Argentina) according to the manufacturer’s protocol.
Cytokine quantification: Pro-inflammatory (TNF-α, IL-1β, and IL-6) and anti-inflammatory (IL-10) cytokine levels were measured using in-house sandwich ELISA assays. Briefly, 96-well microplates were coated overnight at 4 °C with purified capture antibodies (eBioscience, Thermo Fisher Scientific, Waltham, MA, USA) and subsequently blocked with 5% bovine serum albumin (BSA, Sigma Aldrich, USA). Plates were washed three times and incubated overnight at 4 °C with 50 μL of culture supernatant or serial dilutions of recombinant murine cytokine standards (PeproTech, Rocky Hill, NJ, USA). After washing, plates were incubated for 4 h with biotin-conjugated detection antibodies (IL-10, IL-1β, IL-6, and TNF-α, all from eBioscience, Thermo Fisher Scientific, Waltham, MA, USA), followed by streptavidin–HRP (BD Biosciences, Heidelberg, Germany). After additional washes, the plates were developed with TMB substrate (Sigma Aldrich, USA) for 15–30 min, and the reaction was stopped with 0.1 M sulfuric acid (Ciccarelli, Santa Fe, Argentina). Absorbance was measured at 450 nm using a VersaMax microplate reader (Molecular Devices, San Jose, CA, USA). Results were expressed as pg·mL−1.

2.5.3. Laxative Activity in Mice

Animals: Six-week-old male and female Balb/c mice were obtained from the closed breeding colony at the CERELA Institute (San Miguel de Tucumán, Argentina). Throughout the 7-day experiment, animals were housed in cages under a 12 h light/dark cycle at room temperature (22 ± 2 °C), with ad libitum access to food and water.
Experimental protocol: The laxative effect was evaluated using a constipation mouse model (Supplementary Figure S1). Thirty-six mice were randomly assigned to six groups as follows:
G1 (normal control, n = 6): Mice received a standard diet and water ad libitum for 7 days.
G2 (non-fermented milk control, n = 6): Mice were administered non-fermented milk for 7 consecutive days.
G3 (loperamide-induced constipation, n = 6): Mice received loperamide solution (Regulane, Finadiet SACIFI, Buenos Aires, Argentina) from day 3 to day 7.
G4 (non-fermented milk + loperamide, n = 6): Mice received non-fermented milk (10% v·v−1) for 7 days, along with loperamide from day 3 to day 7.
G5 (CRL75 fermented milk + loperamide, n = 6): Mice received milk fermented with L. rhamnosus CRL75 (final concentration 2.4 × 10⁹ CFU·mL−1) for 7 days, along with loperamide from day 3 to day 7.
G6 (EPS75 + loperamide, n = 6): Mice received EPS75 in non-fermented milk (0.3 g·day−1·mouse−1) for 7 days, along with loperamide from day 3 to day 7.
Constipation was induced by administering loperamide solution via gavage at a daily dose of 2 mg·kg−1 body weight from day 3 to day 7.
Gastrointestinal transit of charcoal: Gastrointestinal transit (GIT) was evaluated using a charcoal marker method, adapted from Wang et al. [21]. On day 8, mice were administered a charcoal suspension (5% m·v−1 charcoal + 0.2% m·v−1 guar gum) via gavage and sacrificed 20 min later by cervical dislocation. The small intestine was excised, and the distance traveled by the charcoal front was measured relative to the total length of the intestine. GIT was calculated as follows:
GITcharcoal (%) = (distance traveled by charcoal/total small intestine length) × 100
Clinical observations: Throughout the experiment, animals were monitored daily for food intake; body weight; general appearance; behavior; and signs of gastrointestinal distress, including the presence of blood in feces (assessed via visual inspection).
Bacterial translocation assay: Liver and spleen samples were aseptically collected, homogenized, and plated on McConkey and LAPTG agar plates. Plates were incubated at 37 °C for 48 h to assess bacterial translocation. Animal experiments were conducted in strict accordance with the recommendations of the Guide for the Care and Use of Laboratory Animals from the CERELA (the Animal Care and Use Committee approved the animal experiment under the CRL-CICUAL-TD-2023/3A protocol).

2.6. Statistical Analysis

All experiments were performed in duplicate (n = 2). Statistical significance was assessed using one-way ANOVA, followed by Tukey’s HSD post hoc test (p < 0.05), using Infostat software version 2017.1.2 (Córdoba, Argentina).

3. Results

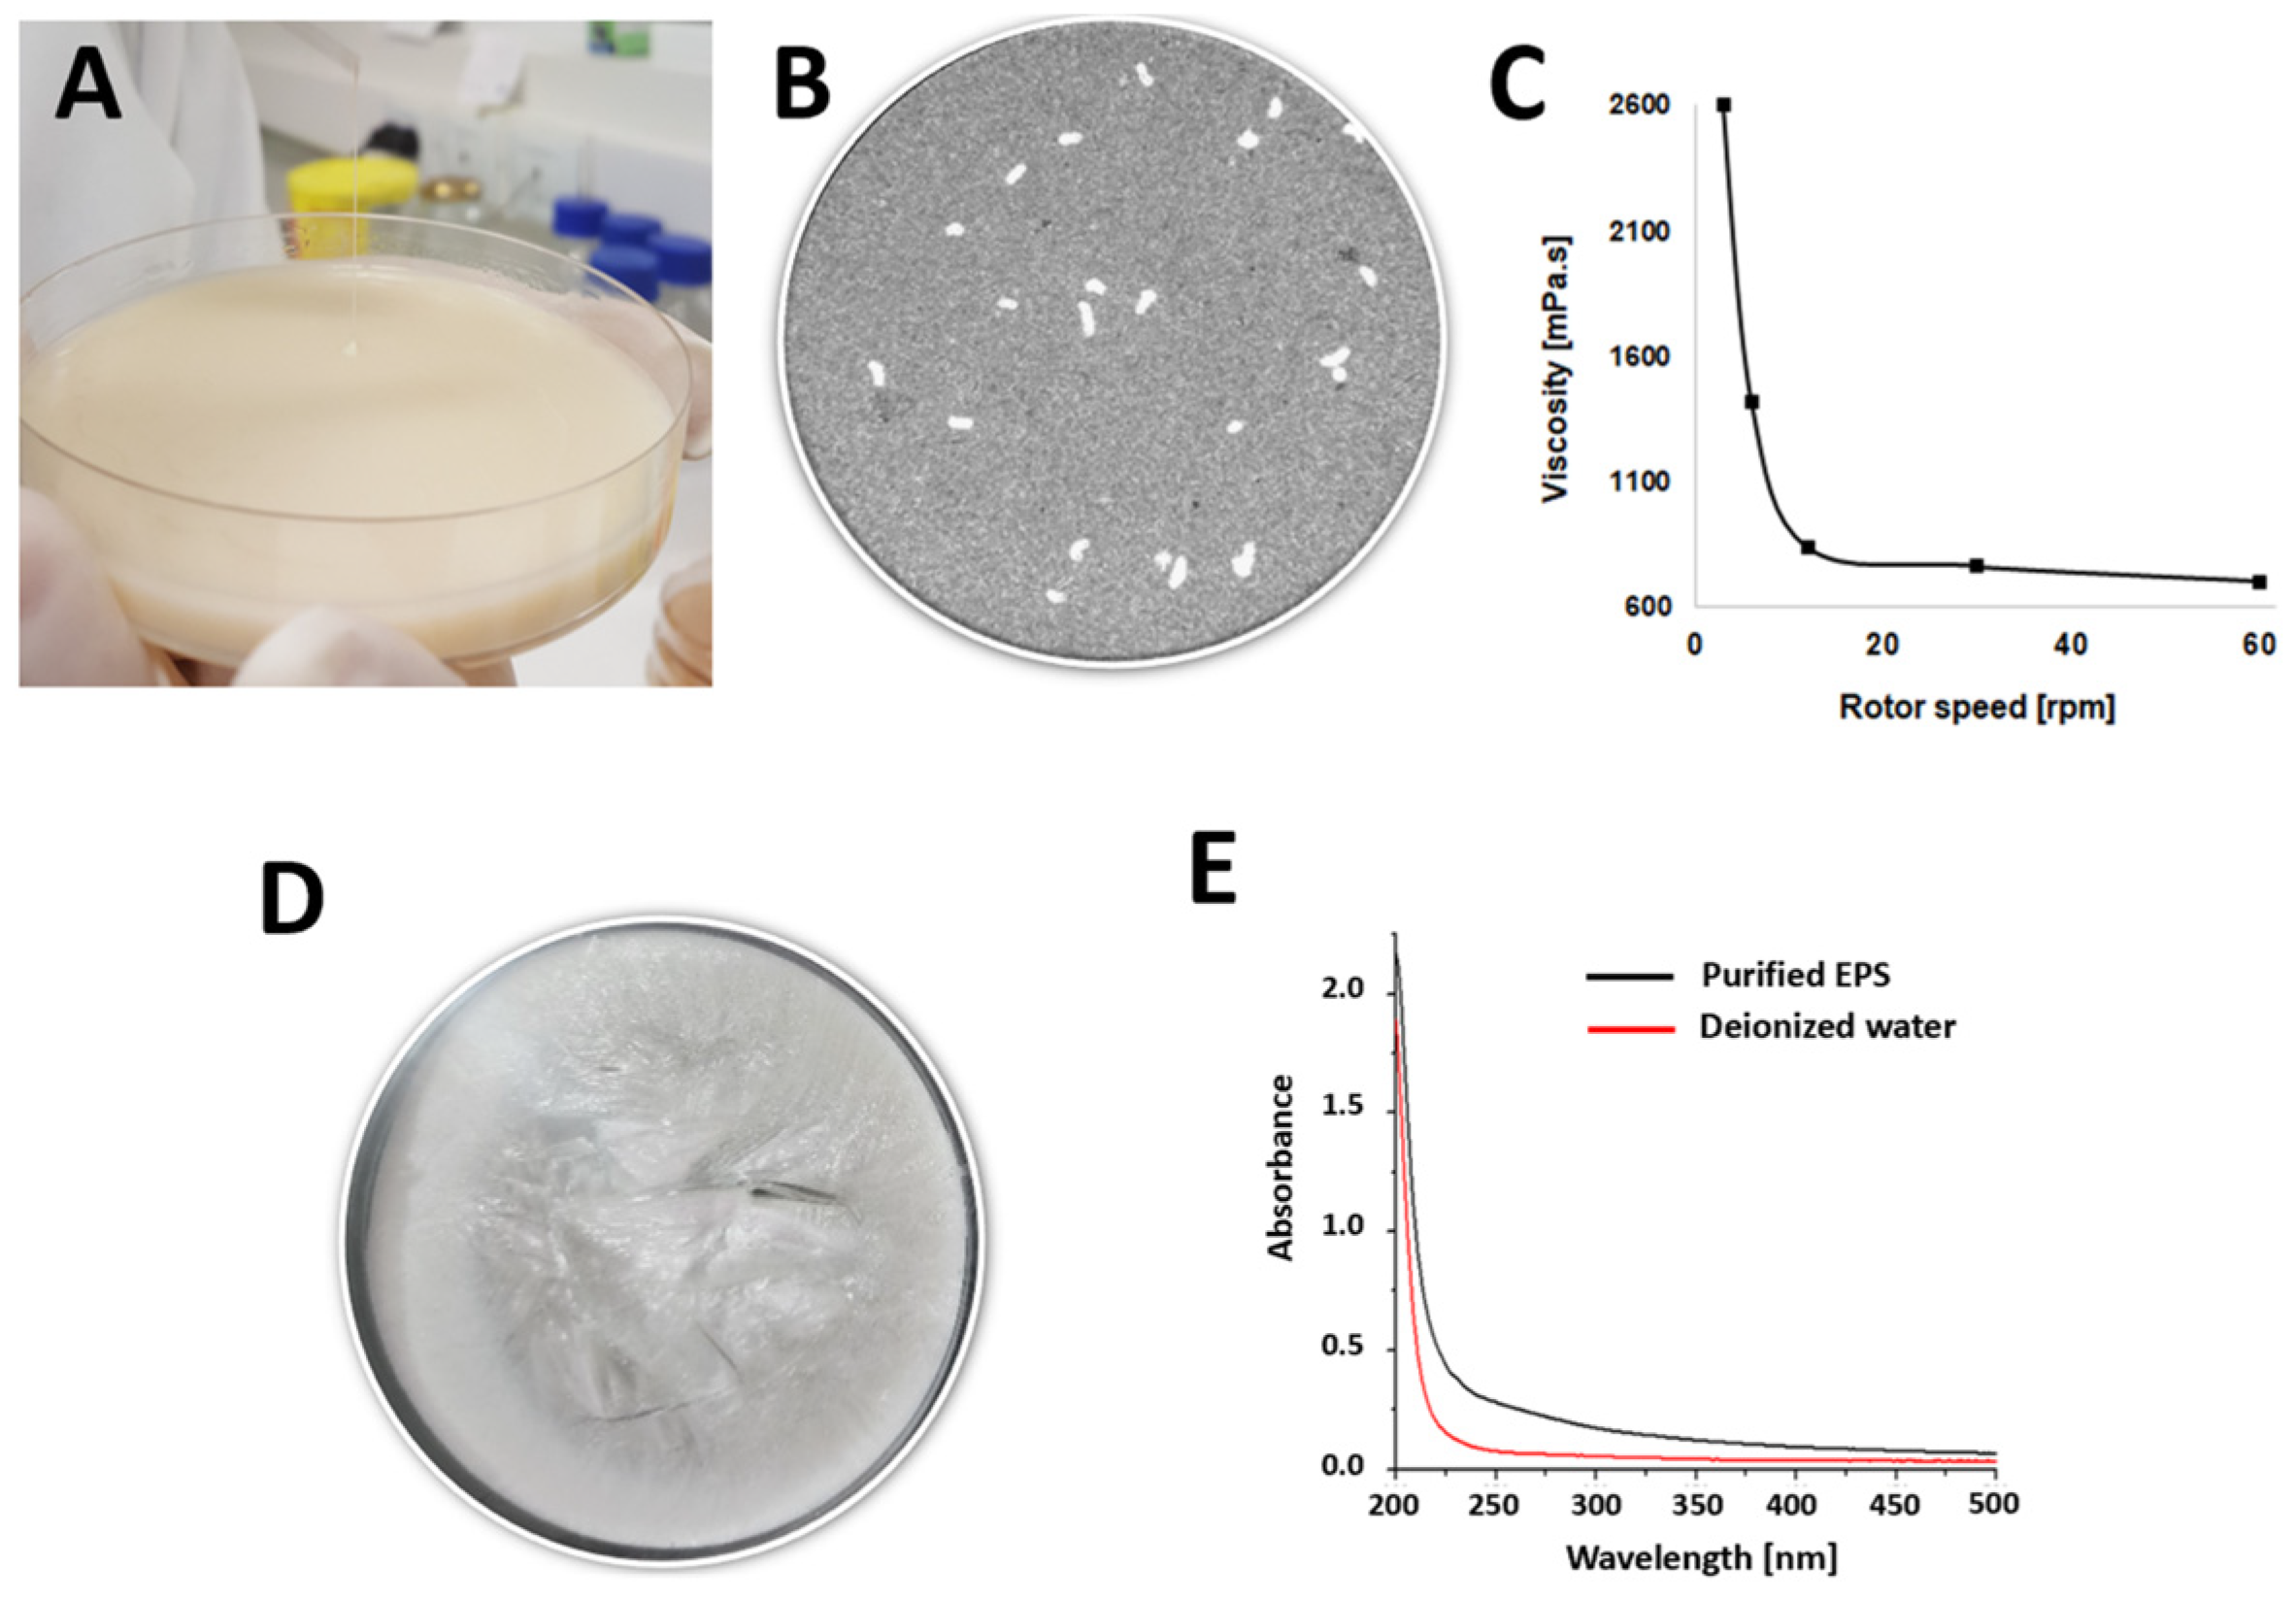
3.1. Milk Fermentation and EPS Isolation

Lacticaseibacillus (L.) rhamnosus CRL75, isolated from locally fermented homemade milk, was evaluated for its ability to produce EPS in skimmed milk. Phenotypic screening on agar plates containing two complex media, RSM and MRS, fermented by CRL75, revealed ropy colonies that formed extensive filamentous strands (>10 cm) in a loop extension assay (Figure 1A and Supplementary Figure S2A). Additionally, the bacterial culture exhibited a capsular polysaccharide phenotype (CPS+), confirmed by Indian Ink negative staining of washed cells from both fermentation media (Figure 1B and Supplementary Figure S2B). These findings suggest a correlation between ropiness and CPS production by the LAB strain in a dairy matrix. Furthermore, the polysaccharide content in cell-free samples was confirmed via the PAS colorimetric method (A550 nm~0.3).
By the end of RSM fermentation (16 h, FM75), significant microbial growth of 3.63 ± 0.18 Log CFU·mL−1 (0.23 Log CFU·mL−1·h−1) was observed, accompanied by an increase in acidity (9.20 ± 0.10 g·L−1 lactic acid) and a pH reduction of 2.40 ± 0.10 units (0.15 pH·h−1), indicating active microbial fermentation. The viscosity of FM75 (Figure 1C) decreased markedly with increasing rotational frequency, characteristic of shear-thinning behavior. At 3 rpm, the viscosity was 2595 mPa·s, while at 60 rpm, it dropped to 700 mPa·s. EPS production by CRL75 at 16 h reached 70.00 ± 3.25 mg·L−1, exhibiting high purity (Figure 1D). No precipitate was observed following the centrifugation of a cold EPS solution (5 mg·mL−1), and the Bradford assay confirmed the absence of protein. The UV spectrum exhibited a single absorption peak between 190 and 210 nm, characteristic of carbohydrate molecules (Figure 1E), with no detectable signals at 260, 280, and 400 nm, confirming the absence of proteins, nucleic acids, and pigments, respectively [22].

3.2. EPS Partial Characterization Approaches

3.2.1. Composition Analysis and MW

Monosaccharide composition analysis of purified EPS75 from skimmed milk (Figure 2A) classified the biopolymer as a heteropolysaccharide (HePS). The polymer backbone primarily consisted of galactose and glucose in a 4:1 ratio. Size-exclusion chromatography coupled with high-performance liquid chromatography (SEC-HPLC) (Figure 2B) revealed a single symmetrical peak, corresponding to an average molecular weight (Mw) of 1.27 × 10⁴ Da, calculated using dextran standards under ionic conditions to minimize polymer interactions.

3.2.2. Hydrodynamic Analysis

The hydrodynamic properties of EPS75 were analyzed to investigate its structural conformation in aqueous media, as such a measure is relevant to both food processing and biological applications. Static light scattering (SLS) and dynamic light scattering (DLS) were employed to assess polymer interactions. The specific refractive index increment (dn/dc) was determined as 0.131 mL⋅g−1, aligning with typical polysaccharide values (~0.14 Ml·g−1) [23]. The Zimm plot (Supplementary Figure S3A) revealed a positive second virial coefficient (A2 = 2.48 × 10⁻³ mL·mol·g−2), showing favorable polymer–water interactions and an aggregation Mw of 7.55 × 10⁴ Da [14].
DLS analysis (Figure 2C and Supplementary Figure S3B,C) revealed a symmetric particle size distribution (~147 nm) with a polydispersity index of 0.56, indicating EPS self-association, which reduces Brownian motion fluctuations [24]. Congo red binding assays further assessed EPS chain conformation (Figure 2D), with significant λmax shifts between 0.15 and 0.25 M NaOH, indicative of stable helicoidal structures. A bathochromic shift of 21 nm (from 499 to 507 nm) was observed at 0.15 M NaOH, stabilizing at 0.25 M NaOH (Supplementary Figure S3D). Beyond 0.45 M NaOH, λmax shifts plateaued, suggesting disruption of hydrogen bonding and a transition from multi-helix to single-helix and random coil conformations [25].

3.2.3. Vibrational Spectroscopies Analysis

The FTIR and FTR spectra were performed to investigate the molecular structure, linkage types, and functional groups of purified EPS from L. rhamnosus CRL75 (Figure 3A). The assignments of vibration bands are presented in Supplementary Table S1. In the FTIR spectra, the broad, intense band near 3385 cm−1 originates from the O–H asymmetric stretching vibrations, which overlap with the intramolecular hydrogen bonds of the polymer structure. The band around 2947 cm−1 in both spectra corresponds to the C–H stretching vibration mode. No signals were observed between 1700 and 1775 cm−1, thus discarding the existence of glucuronic acid and diacyl ester groups in their structures, confirming their neutral structure [13,26,27]. The water solvation layer incorporated into the polymer structures resulted in an IR absorption peak at 1648 cm−1 [28]. Signals between 1550 and 1200 cm−1 cover bending vibrations of CH, CH2, and OH groups, while signals between 1200 and 950 cm−1 comprise the fingerprint region for polysaccharides: stretching vibrations of pyranose rings and glycosidic linkages (C–O–C) [14,29]. The Raman bands around 1080–1150 cm−1 are characteristic of C–O–C asymmetric and symmetric stretching vibrations. It has been reported that galactose showed the most robust IR band at 1078 cm−1, glucose at 1035 cm−1, and α-linked glucose at 1026 cm−1 [30,31]. Furthermore, the anomeric region (950–700 cm−1) helps characterize the polymer structure, which contains information on vibrational modes and the linkage type (α or β) between carbohydrates [32]. The diagnostic IR absorption peaks at 915, 835, and 760 cm−1 suggest the presence of glucosyl residues with an α-bond, while the presence of Raman signals at 890 and 815 cm−1 suggests β-configuration linkages in the EPS structure produced by L. rhamnosus CRL75 [13,14,33]. Vibrations below 700 cm−1 are distinctive for many polysaccharides, and these are often sensitive to the deformation of skeletal modes of pyranose rings, dihedral angles of the glycosidic linkages, and the nonplanar bending of −OH groups [34,35].

3.3. Physical Properties

3.3.1. Chromatic Characterization

The chromatic parameters of purified EPS75 are summarized in Table 1. Luminosity is represented by the parameter L*, where a maximum value of 100 corresponds to white (each color is positioned on a grayscale continuum from black to white). The biopolymer powder exhibited an L value of 78.29, indicating a high degree of lightness. Additionally, the hue angle (°H ≈ 86) reflects a significant contrast between the EPS appearance and a neutral gray of equivalent lightness. In this context, the whiteness index (WI) of the powdered material was 78.19, consistent with the highly pure white polysaccharides isolated from skimmed milk. The quantitative color attributes—chroma (C*), redness (a*), yellowness (b*), and yellowness index (YI)—exhibited low values, indicating a decolorized system with minimal reddish and yellowish components (~0), characteristic of slight color intensity [36].

3.3.2. Thermal Properties

The purified EPS75 underwent dynamic thermogravimetric analysis (TGA) to evaluate weight loss as a function of temperature (Figure 3B). The thermogram reveals that EPS decomposition occurs primarily in two stages. The initial weight loss of 13% was observed between 25 and 150 °C and was associated with endothermic signals corresponding to the dehydration of water bound to polysaccharide structures [11]. The hydration layer exhibited a vibrational mode at 1648 cm−1 in the FTIR spectrum (Figure 3A). In the differential thermal analysis (DTA) profile, this mass loss was marked by an endothermic peak at 100 °C (Supplementary Figure S4). Additionally, the EPS structure remained thermally stable up to approximately 220 °C, identified as the critical temperature (TC), a crucial parameter for industrial food-manufacturing processes that involve high-temperature conditions [11].
The subsequent degradation stage, corresponding to a 73.50% weight loss, was attributed to the depolymerization of EPS75. This phase involves the cleavage of C–O and C–C bonds within the monomer units, leading to the release of CO, CO2, and H2O [37]. The degradation temperature (TD) was determined to be 341 °C from the derivative TGA, indicating the most rapid depolymerization phase of the entire process. Moreover, this stage exhibited an exothermic event, during which the polymer backbone released significant energy (Supplementary Figure S4). At the end of the thermal process, a residual solid content of 13.5% of the initial weight persisted up to 600 °C. During this phase, the formation of polynuclear aromatic structures and graphitic carbon was suggested as the temperature increased [11].
Differential scanning calorimetry (DSC) was employed to analyze phase transitions and potential alterations in the crystalline structure associated with heat absorption and emission in purified EPS75 (Figure 3C). The melting temperature (TM) was identified as an endothermic peak occurring between 205 and 215 °C. The enthalpy change (ΔH) needed to melt 1 g of EPS was determined to be 1.43 J.

3.4. Biological Properties
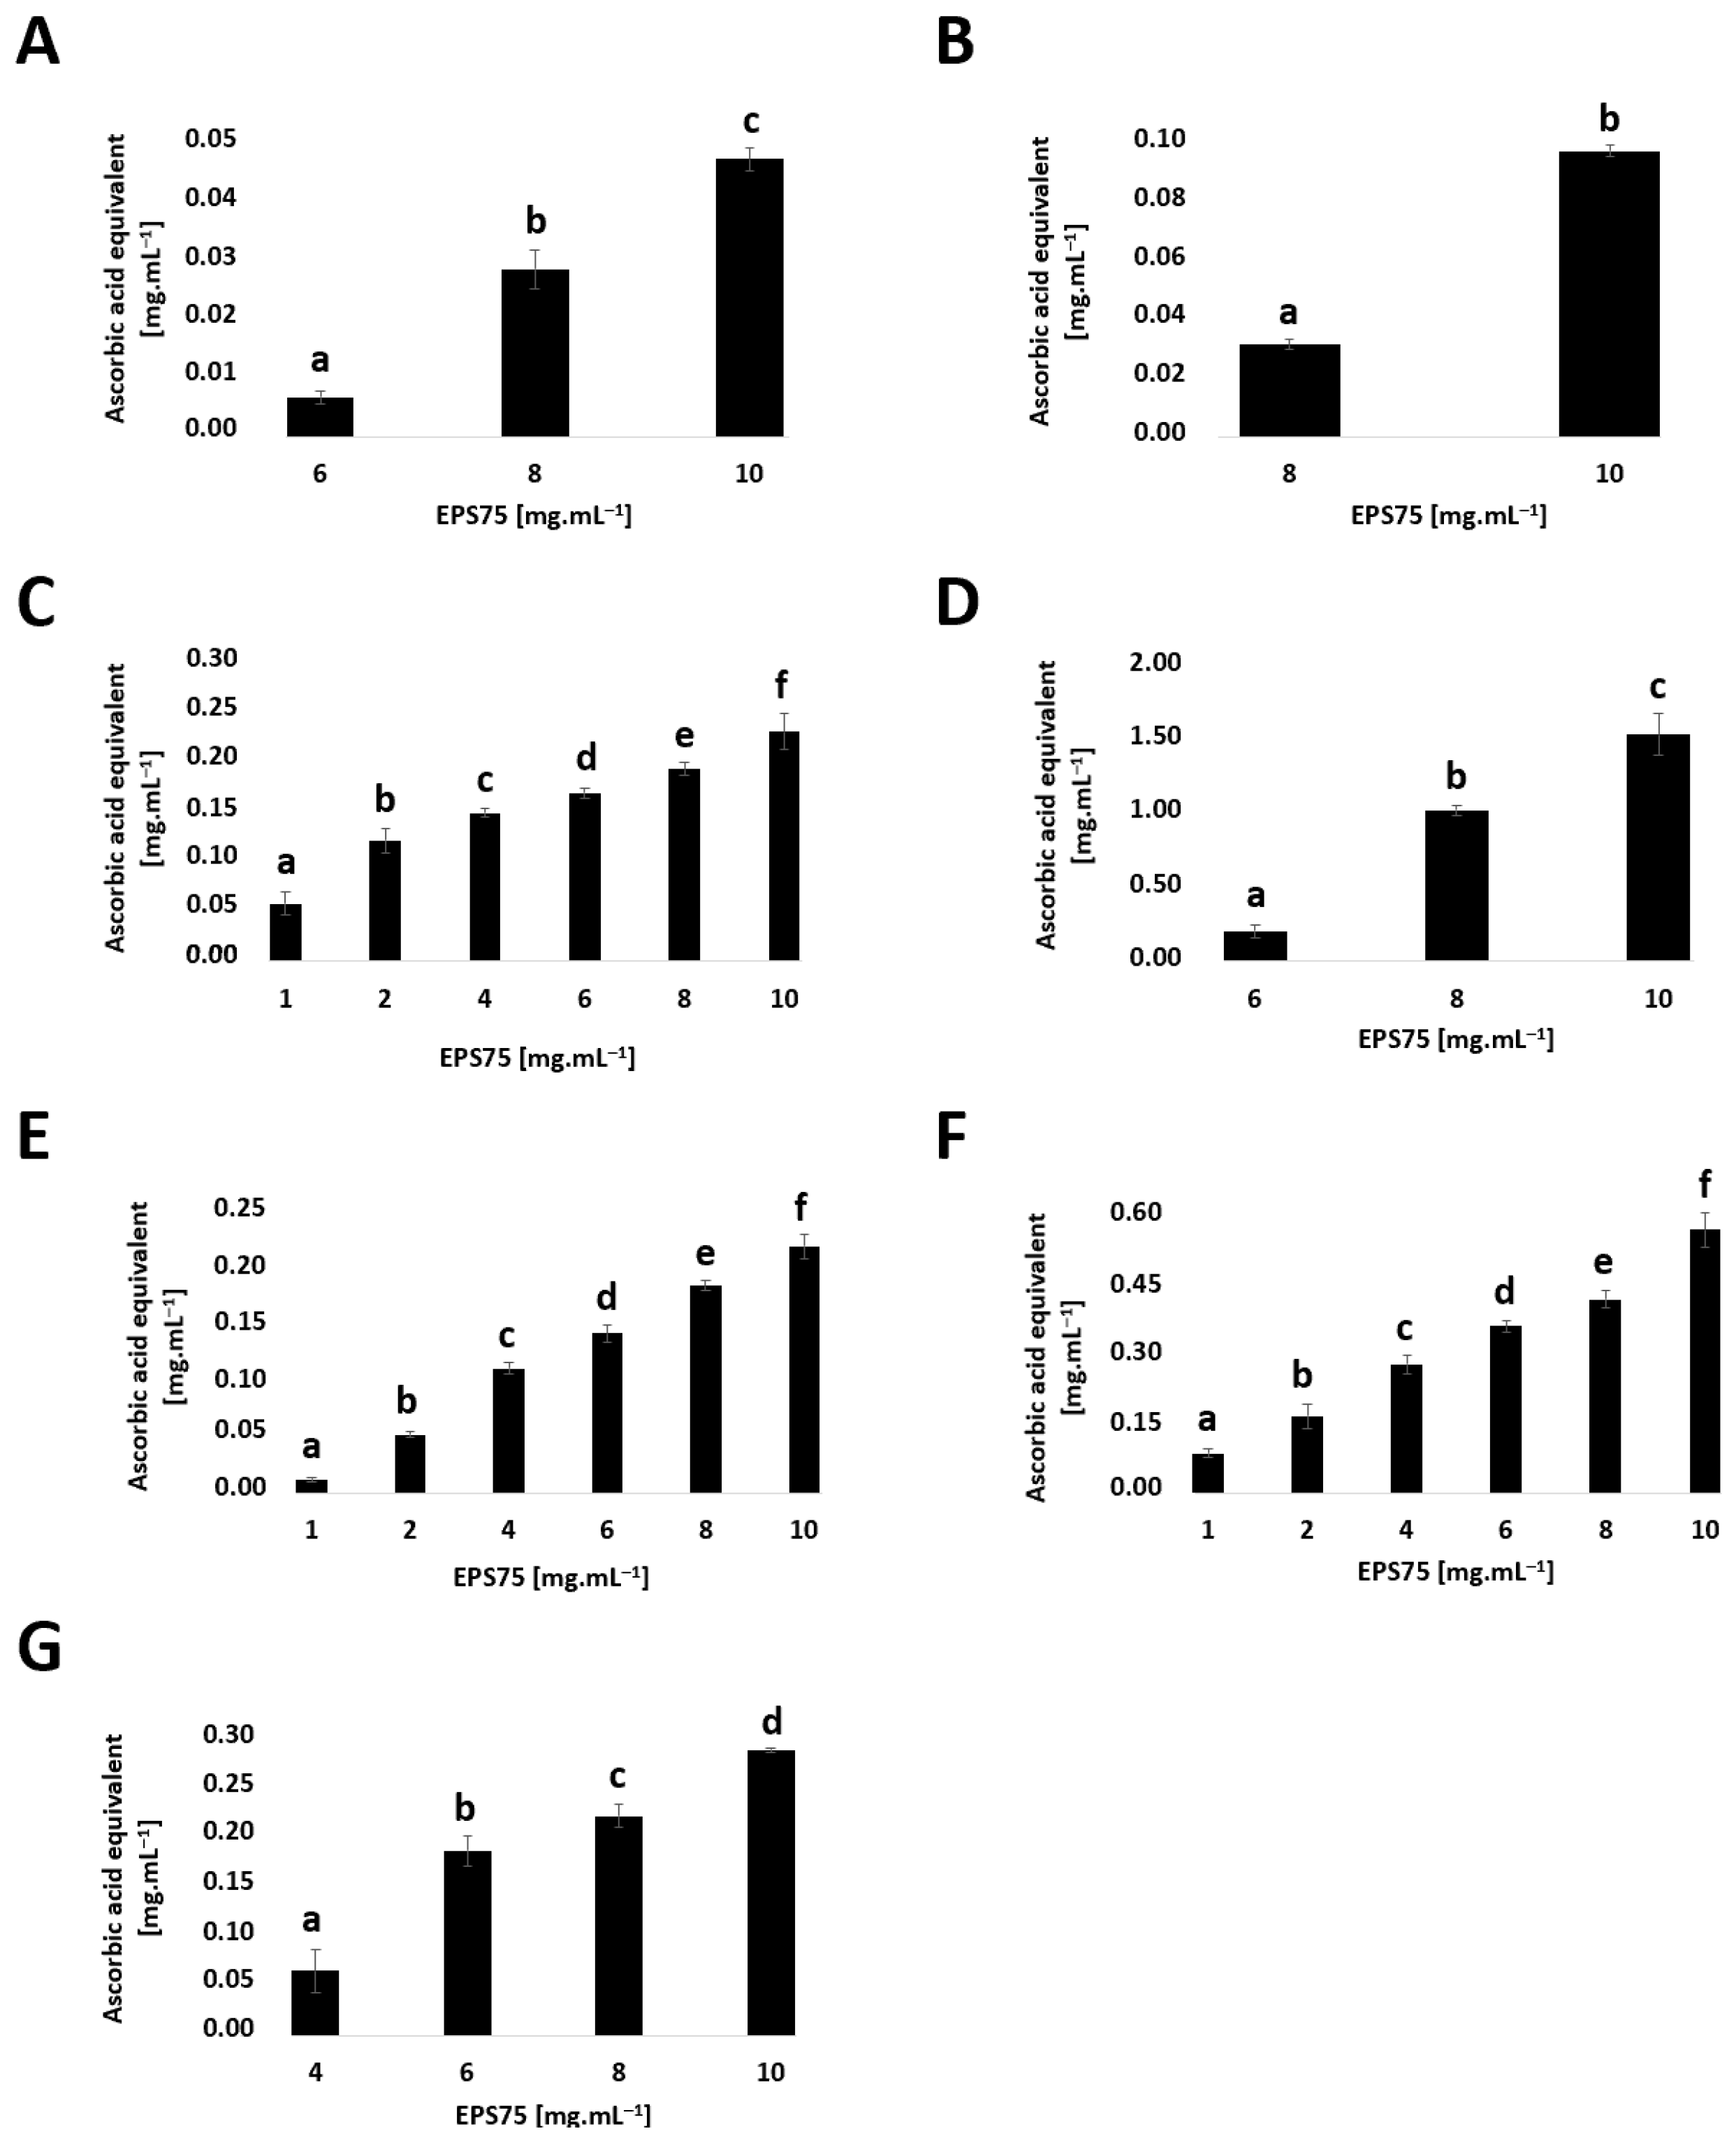
3.4.1. Antioxidant

In vitro assays were performed to evaluate the antioxidant capacity of purified EPS75, including the scavenging of oxidative compounds (ABTS•+, HO, H2O2, and O2•−) and the reducing power (Fe3+/2+, Mo6+/5+, and Mn7+/4+) (Figure 4). All experiments demonstrated that biopolymer activity increased in a dose-dependent relation, reaching maximum antioxidant capacity at 10 mg mL−1. At this concentration, the highest antioxidant activities were observed for H2O2 stabilization (1.60 VC eq.) and O2•− scavenging (0.25 VC eq.). Conversely, no activity was detected for ABTS•+ and H2O2 scavenging within the 0–6 mg mL−1 range or for HO scavenging up to 8 mg mL−1. However, EPS75 exhibited O2•− scavenging activity at all tested concentrations.
The reducing power of EPS75 increased in a dose-dependent manner across all evaluated concentrations (1–10 mg·mL−1). Notably, Mn7+/4+ reduction was only significant between 4 and 10 mg mL−1. At 10 mg mL−1, EPS75 reduced Fe3+/2+ by 0.6 VC eq., whereas Mo6+/5+ and Mn7+/4+ were decreased by 0.25 VC eq. The absence of −COOH groups or conjugated bonds in the biopolymer structure (Figure 3A), which could donate electrons for free radical stabilization, supports the hypothesis that its antioxidant potential is attributed to its neutral structure and macromolecular aggregation. Nonetheless, all antioxidant activities of purified EPS75 were lower than those of VC used as a standard at equivalent concentrations (0–10 mg mL−1), in agreement with the literature reports [38,39].

3.4.2. Cytotoxicity and Immunostimulatory Capacity

A cytotoxicity assay was performed to assess changes in cell proliferation in response to different EPS75 concentrations (Figure 5). EPS75 did not substantially affect cell viability or proliferation, with only a slight reduction (~10%) observed between 25 and 400 ng mL−1, suggesting a non-cytotoxic nature. Only cells treated with lipopolysaccharide (LPS, positive control) exhibited a significant reduction in viability (~40%) (Figure 5A). Regarding cell membrane integrity, EPS75 did not induce cell damage or increase permeability, showing no significant differences compared to unstimulated cells. In contrast, LPS-treated cells displayed a notable increase in LDH activity (Figure 5B).
Therefore, the quantification of key pro-inflammatory cytokines (TNF-α, IL-1β, and IL-6) and anti-inflammatory cytokine (IL-10) serves as a crucial approach to assessing the immunomodulatory activity of EPS75 (Figure 6). Murine RAW264.7 macrophages were exposed to varying concentrations of EPS75 for 18 h to evaluate its immunostimulatory potential. Cytokine profiling revealed a dose-dependent increase in the levels of the pro-inflammatory cytokines TNF-α and IL-6. In contrast, IL-1β production in RAW264.7 macrophages exhibited a marked reduction (≥50%) across all tested EPS75 concentrations (25–400 ng·mL−1). Meanwhile, IL-10 levels significantly increased only at the highest EPS75 concentrations (200–400 ng·mL−1).

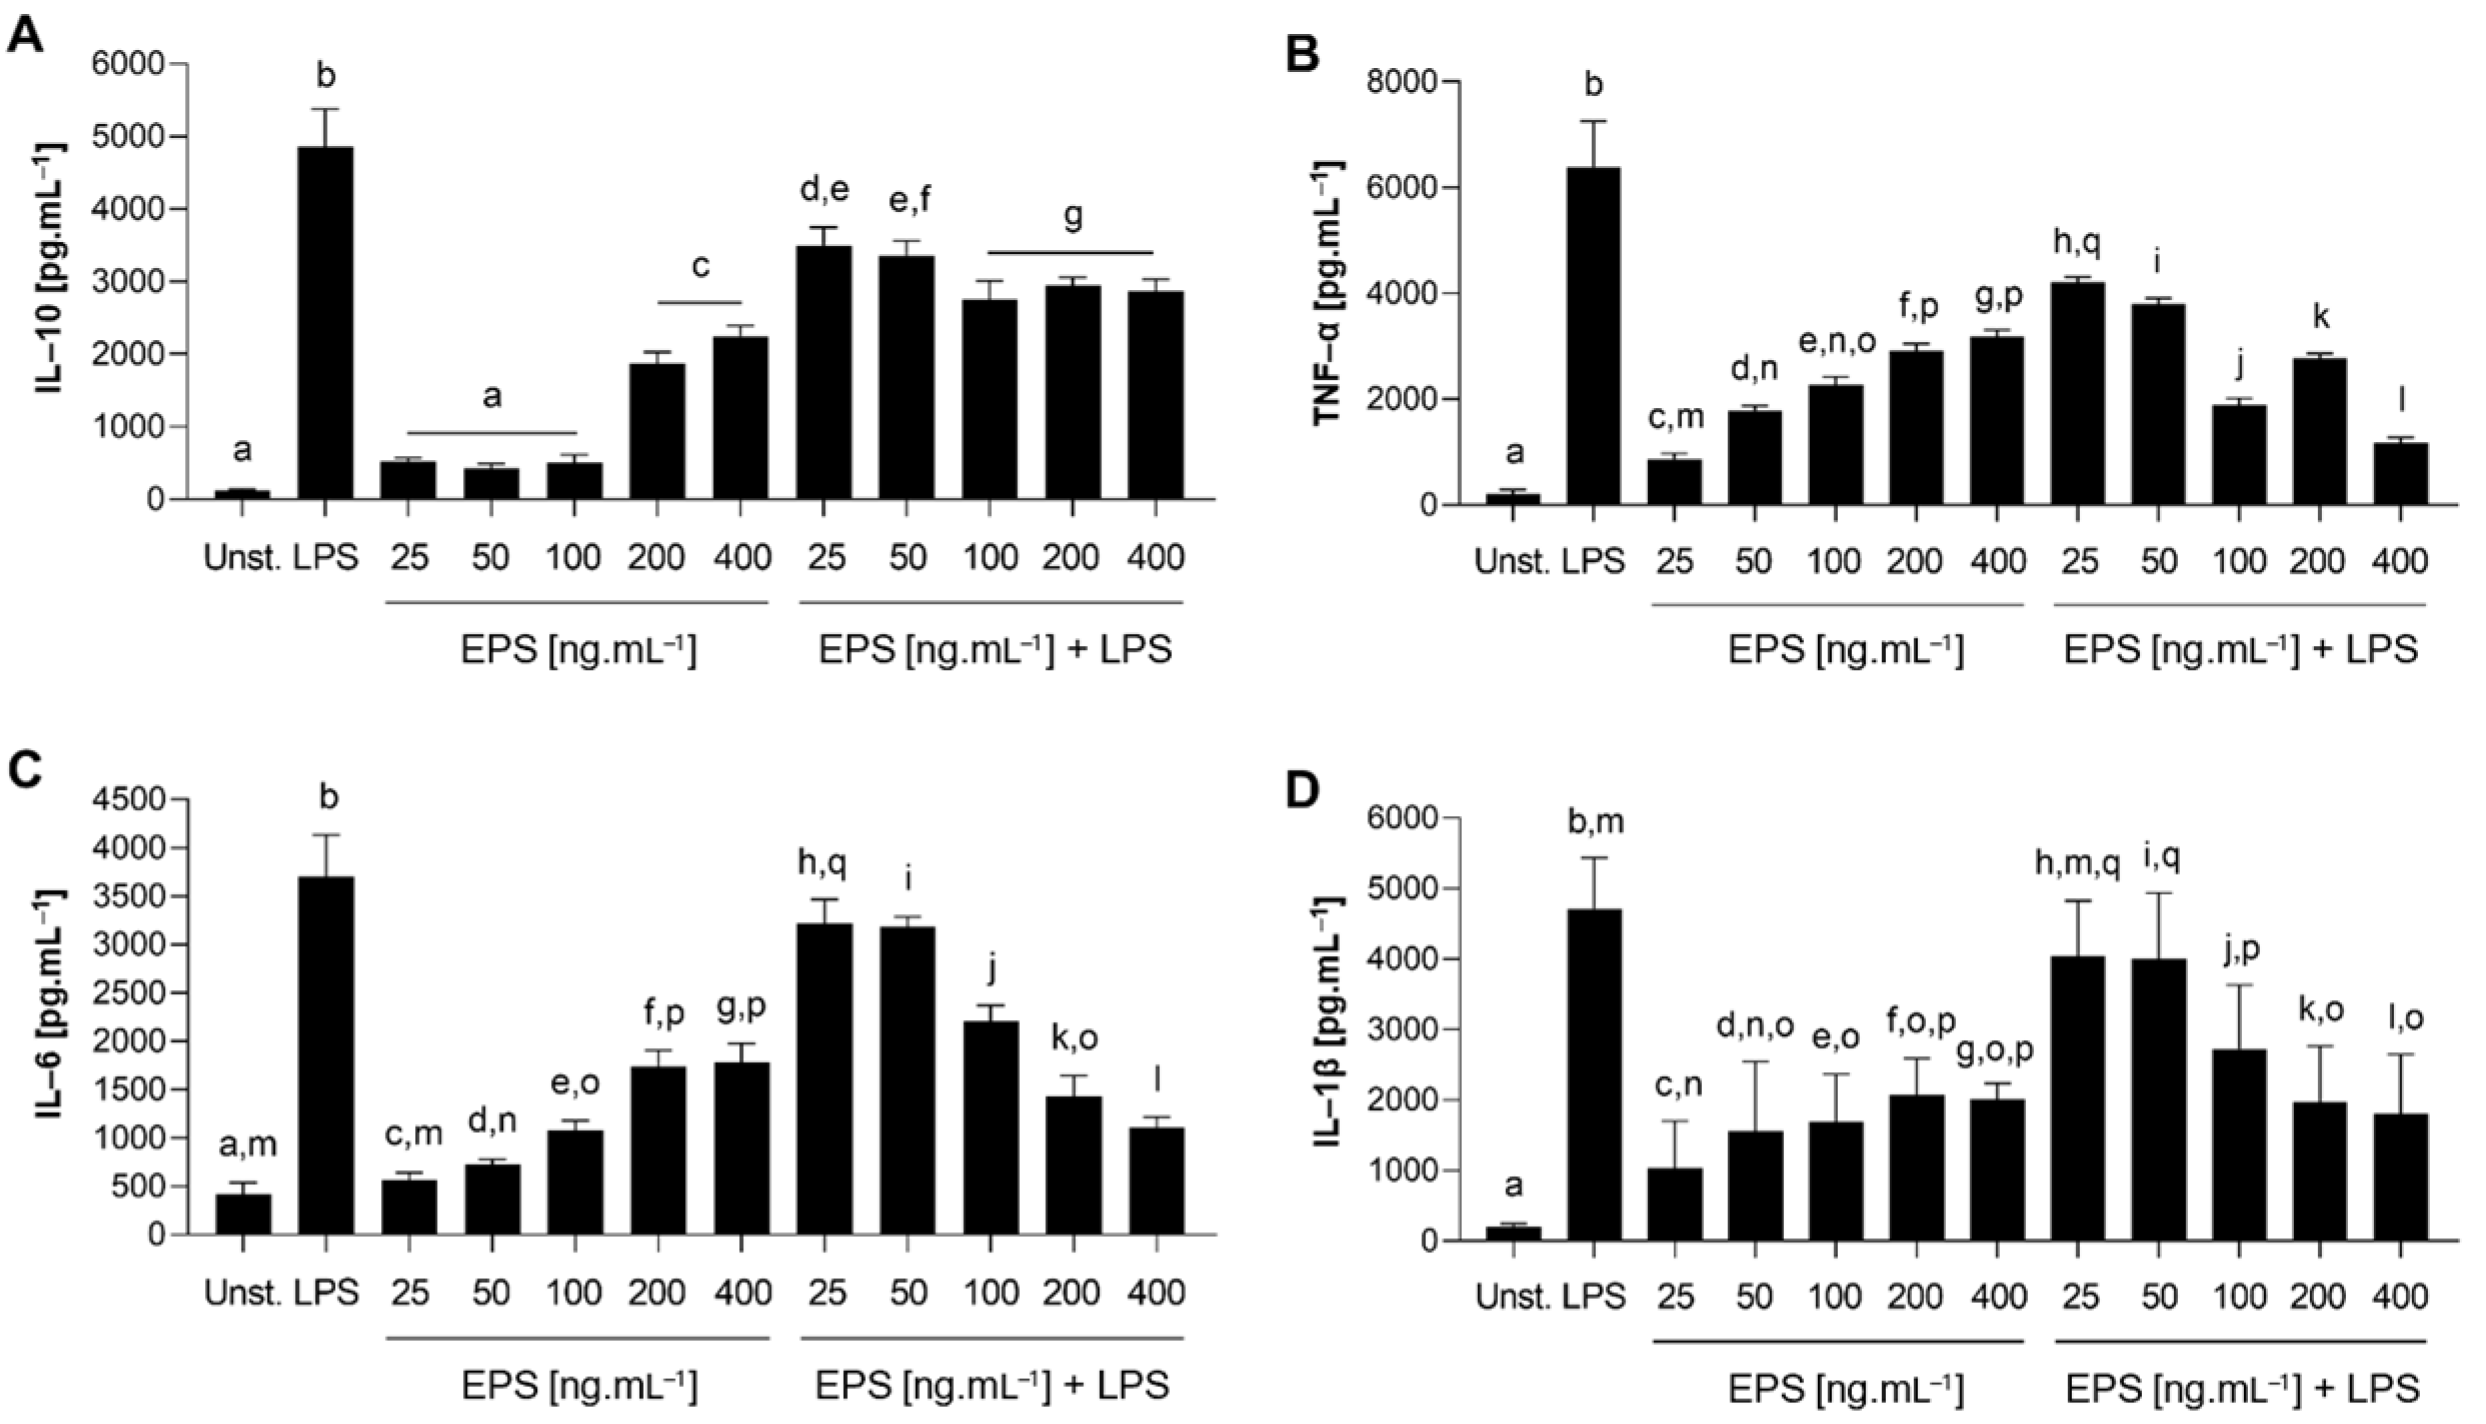
3.4.3. Anti-Inflammatory Capacity

The anti-inflammatory potential of EPS75 was evaluated based on its ability to mitigate pro-inflammatory stimulation induced by LPS (Figure 5 and Figure 6). Pretreatment of macrophages with EPS75 preserved cell viability, even in the presence of LPS, with significant differences compared to positive control cells (Figure 5A). Additionally, EPS75 protected cell membranes, as evidenced by significantly lower LDH activity compared to LPS-treated cells (Figure 5B). Cytokine profiling revealed that EPS75-pretreated cells exhibited significantly reduced levels of TNF-α (Figure 6B), IL-6 (Figure 6C), and IL-1β (Figure 6D) compared to LPS-stimulated cells. The most pronounced effects were observed at concentrations of 100, 200, and 400 ng mL−1. In contrast, IL-10 levels significantly increased in EPS75-pretreated cells, albeit to a lesser extent than in the LPS group (Figure 6A). These results indicate that EPS75 modulates pro-inflammatory responses, with the highest concentrations exhibiting the most substantial modulatory effects.

3.4.4. Laxative Property

The laxative properties of EPS75 and FM75 were evaluated using an in vivo model of loperamide-induced constipation with Balb/c mice (Figure 7). The results demonstrated that both EPS75 and FM75 were effective in preventing constipation. Gastrointestinal transit (GIT) of charcoal (%) indicated that FM75 administration (G5) restored normal intestinal motility, exhibiting significantly higher values compared to the untreated loperamide control groups (G1 and G2). While EPS75 functioned as a moderate laxative, it restored 10% of GIT, accounting for approximately 25% recovery relative to the loperamide group (G3). Furthermore, EPS75 prevented body weight loss and improved food intake (Supplementary Figure S5). No bacterial translocation or alterations in overall health status were observed. These findings highlight the biological potential of EPS75 and the fermented food matrix FM75, demonstrating their promising application in the food industry.

4. Discussion

Fermented dairy products are widely consumed worldwide and have experienced substantial growth in recent years. This increasing consumer interest is attributed to their nutritional and health benefits, as well as their positive impact on intestinal microbiota, contributing to increased life expectancy [40]. EPS-producing LABs are of particular interest in the dairy industry due to their contributions to both the rheological and health-promoting properties of fermented products. The identification of potential new starter cultures requires the selection of EPS-producing strains and quantification of their polymer production in fermented milk [41]. In this context, Lacticaseibacillus (L.) rhamnosus CRL75 demonstrated the ability to grow (0.23 Log CFU·mL−1·h−1), acidify (0.15 pH·h−1 and 9.20 g·L−1 of lactic acid), and rapidly increase viscosity in reconstituted skim milk during 16 h of fermentation. The skim milk fermentation by the Streptococcus thermophilus CRL1190 strain, isolated from homemade fermented milk, yielded similar results (0.20 Log CFU·mL−1·h−1, 0.14 pH·h−1, and 8.5 g·L−1 of lactic acid) [11]. Also, the CRL75 strain is capable of producing both capsular polysaccharides (CPSs+) and a novel extracellular polysaccharide (EPS75) with key techno-functional properties associated with the ropy+ phenotype in fermented dairy matrices. These unique characteristics make it an attractive candidate as a starter microorganism.
The high number of highly energetic chemical bonds (glycosidic linkages), degrees of polymerization, branching, and hydroxyl groups contribute to strong intra- and intermolecular interactions, resulting in high intrinsic viscosity and favorable rheological properties [42]. Viscosity is a crucial parameter in assessing the sensory attributes of fermented milk, as it describes the resistance to flow (Figure 1C). The interactions between EPS75 and milk proteins form a dense network structure with enhanced elasticity facilitated by Van der Waals forces and electrostatic repulsion [22]. Initially, water was homogeneously dispersed within the viscous network structure of FM75 (~2600 mPa·s), but as rotational frequency increased, the gel’s ability to retain water molecules decreased (~700 mPa·s) [43].
Moreover, the CRL75 strain produced 70 mg·L−1 of highly viscous EPS75 in skim milk. Although Hamet, Piermaria, and Abraham [41] reported EPS production ranging between 145.2 and 234.9 mg·L−1 from several Lacticaseibacillus genus strains under similar conditions, Han et al. [9] quantified 241.684 mg·L−1 of the EPS produced L. rhamnosus B6 using the phenol-sulfuric acid method.
EPS75 was isolated with high purity and classified as a HePS, characterized by a 4:1 galactose-to-glucose ratio and a low Mw of 1.27 × 10⁴ Da. Similar results (1.01–2.47 × 10⁴ Da) were reported for HePSs produced by L. rhamnosus ZFM231 in MRS, while L. rhamnosus B6 exhibited a substantially higher Mw of 1.577 × 10⁶ Da in a dairy medium [9]. In an aqueous environment, EPS75 displayed a hydrodynamic size of 147 nm, accompanied by an increased Mw (7.55 × 10⁴ Da), resulting from biopolymer aggregation facilitated by hydrogen bonding between hydroxyl groups and water molecules, as well as intrapolymeric interactions [24]. Lobo et al. [14] reported a similar effect for an unbranched dextran with high Mw (7.67 × 10⁶ Da) produced by Weissella cibaria FMy 2-21-1, exhibiting an extended hydrodynamic size in water (214 nm).
Many polysaccharides can form complexes with Congo red in a helical conformation, resulting in a bathochromic shift in the maximum absorption wavelength (λmax) compared to the Congo red-negative control [44]. The EPS75 backbone exhibited a natural helicoidal conformation, enabling complex formation with Congo red, similar to EPSs produced by Lactobacillus helveticus MB2-1 and Limosilactobacillus fermentum S1 [45,46].
Both FTR and FTIR spectroscopy serve as complementary techniques for elucidating the structure of polysaccharides. While both methods analyze molecular vibrations and structural features, they provide distinct types of information. FTIR spectroscopy detects vibrations associated with changes in electrical polarizability, while Raman spectroscopy identifies vibrations related to changes in molecular polarizability [47]. The vibrational patterns of EPS75 (Figure 3A) confirmed its neutral polysaccharide structure, exhibiting characteristic vibrational modes of glucose and galactose, as well as α- and β-glycosidic linkages.
The color profile of biopolymers plays a crucial role in consumer acceptance and the visual appeal of food and biomaterials [36]. The purified EPS75 exhibited high lightness and whiteness indexes, comparable to kefiran polysaccharide and galactan EPS from Weissella confusa KR780676, as reported by Hasheminya and Dehghannya [15], and Kavitake et al. [16], respectively.
Thermal stability is a key parameter for determining the applicability of polysaccharides, particularly in dairy-food processing [11]. EPS75, produced by L. rhamnosus CRL75, exhibited a thermal-degradation onset temperature (TC) of approximately 220 °C, with a preceding melting transition (TM) occurring between 205 and 215 °C. This TM value was lower than TC, consistent with findings reported by Lobo et al. [13] for HoPS produced by Leuconostoc and Weissella strains. In contrast, Bhat and Bajaj [48] reported a significantly lower TM of 53.4 °C for the HePS produced by L. paracasei M7.
Oxidative molecules (e.g., HO, H2O2, and HOO, among others) within human cells can damage essential biomolecules such as DNA, proteins, and lipids, leading to oxidative stress, inflammation, functional exhaustion, or apoptosis. This oxidative damage is often associated with the onset of various chronic diseases and cancer development. In this context, antioxidant agents, including specific enzymes such as superoxide dismutase, catalase, and glutathione peroxidase, play a crucial role in stabilizing oxidative chemical structures, thereby preventing or delaying cellular damage [38,48].
Our results prove that the antioxidant capacity of EPS75 increases in a dose-dependent manner. The highest effect was observed at concentrations of 8 and 10 mg·mL−1, particularly in stabilizing oxidative attacks from H2O2 (1.60 VC eq.) and O2•− (0.25 VC eq.), both of which are common reactive species in biological environments [49]. The scavenging of free radicals is attributed solely to the −OH polarizable groups present in EPS75, as purity analyses confirmed the absence of potential contaminant molecules (Figure 1D) [11]. Reducing power assay is commonly employed as an indicator of electron-donating activity, which is essential for understanding the antioxidant mechanism of EPS75 [50]. In this regard, the neutral structure of EPS75 exhibited the ability to reduce three studied redox systems: Fe3+/2+, Mo6+/5+, and Mn7+/4+, albeit at relatively low levels (~0.25 VC eq.). Xiao et al. [39], Shankar et al. [51] and Kıray and Raheel [52] reported comparable reducing power and free radical scavenging activities in EPS extracted from L. paracasei ZY-1, BSSF and M7, respectively. Nevertheless, HePS produced in milk by L. delbrueckii LB3 and L. rhamnosus MLB3 possess significant antioxidant properties which were related to the composition of the EPSs along with Mw and functional groups [53].
RAW264.7 cells are widely used in research on polysaccharide immune activity due to their critical role in initiating innate immune responses and combating infections and inflammation by promoting proliferation, phagocytosis, nitric oxide (NO) production, and cytokine secretion [54]. Purified EPS75 demonstrated biocompatibility, promoting macrophage proliferation and preventing cellular damage. These effects were associated with a significant reduction in the pro-inflammatory cytokines TNF-α, IL-1β, and IL-6, alongside an increase in the anti-inflammatory cytokine IL-10 at the highest tested concentrations (200–400 ng·mL−1), even in the presence of LPS-induced inflammation. Similar results were reported by Gao et al. [8] and Wang et al. [54] for HePS derived from L. paracasei VL8 and L. paracasei GL1, respectively, confirming the safety of these bacterial compounds. Furthermore, Wang et al. [54] demonstrated that EPS GL1-E2 from L. paracasei GL1 could downregulate TNF-α and IL-1β expression levels (2.69 and 8.27 relative units, respectively) in RAW264.7 cells at 400 μg·mL−1.
Constipation is a prevalent functional gastrointestinal disorder characterized by infrequent or difficult bowel movements, prolonged gastrointestinal transit time, hard stools, and abdominal discomfort [55]. EPS75 and FM75 successfully alleviated constipation in a Balb/c mouse model with loperamide-induced constipation (Figure 7). Notably, FM75 exhibited the highest laxative potential due to its fermentation composition, which includes EPS75, organic acids, and milk proteins, or due to the involvement of the L. rhamnosus CRL75 strain. The polar nature of EPS facilitates water retention, increases fecal moisture, and alleviates constipation [55,56]. Cheng et al. [55] reported that fermented milk (FM) containing L. paracasei JY062 and Lactobacillus gasseri JM1 improved gastric emptying rate, intestinal motility, and fecal moisture in a mouse model of constipation. They also noted improvements in gastrointestinal regulatory peptides, neurotransmitters, and digestive enzyme activities in constipated mice. Similarly, Park et al. [56] observed comparable results for EPS isolated from Weissella confusa VP30. These findings highlight the significant potential of EPS75 and the FM75 matrix for applications in the food industry.

5. Conclusions

Lacticaseibacillus (L.) rhamnosus CRL75 is a lactic acid bacteria (LAB) strain capable of producing both capsular polysaccharides (CPSs) and a heteropolysaccharide (HePS) known as EPS75. The monomer composition of EPS75 consists of galactose and glucose in a 4.0:1.0 ratio. CRL75 demonstrated efficient growth in a dairy-based matrix, using lactose as the primary carbohydrate source, and exhibited beneficial properties such as enhanced viscosity, high viable cell counts, effective acidification (associated with a significant pH decrease), and substantial EPS production (~70 mg·L−1) after 16 h of fermentation. EPS75 was purified without detectable impurities, presenting a low molecular weight (1.27 × 10⁴ Da) and high lightness and whiteness index. Furthermore, EPS75 displayed characteristic vibrational patterns indicative of neutral polysaccharides, strong hydrodynamic interactions, and notable thermal stability (~220 °C), with a melting temperature of ~210 °C, making it a promising candidate for food industry applications. The biopolymer showed moderate antioxidant properties (in vitro assays), mainly through H2O2 and O2•− scavenging activities and Fe3+/2+ reduction potential. Additionally, EPS75 demonstrated immunomodulatory effects by stimulating murine macrophages in vitro, inducing a controlled and dose-dependent increase in anti-inflammatory cytokines without compromising cell viability or causing cytotoxic effects. EPS75 effectively protected cells from LPS-induced inflammatory damage by regulating cytokine production and release, with the most pronounced effects observed at the three highest concentrations (100, 200, and 400 ng·mL−1). Finally, EPS75 and FM75 prevented the development of constipation, representing a viable and safe alternative for the prevention and treatment of this condition. These findings highlight the potential of EPS75 as a multifunctional biopolymer with promising applications in the food industry, where its rheological, bioactive, and health-promoting properties could contribute to the development of functional foods and innovative dairy formulations.

Supplementary Materials

The following supporting information can be downloaded at https://www.mdpi.com/article/10.3390/fermentation11040224/s1, Figure S1. Loperamide-induced constipation mouse model. Mice were supplemented with non-FM, FM, or EPS75 for seven days. On the last 4 days, constipation was induced with a loperamide solution administered by gavage at a daily dose of 2 mg·Kg−1 of body weight. At the end of the treatment period, animals received, via gavage, a charcoal suspension (5% (m·v−1) charcoal + 0.2% (m·v−1) gum Guar) and were then were sacrificed 20 min later by cervical dislocation. NFM, non-fermented milk; FM, milk fermented with L. rhamnosus CRL75 (final count 2.4 × 10⁹ CFU·mL−1); EPS75, EPS75 in non-fermented milk (0.3 g·day−1·mouse−1 of EPS 75). Figure S2. EPS (+) and CPS (+) phenotypes of L. rhamnosus CRL75. (A) Macroscopic appearance of the “ropy” strand formed by the LAB culture in MRS agar plates. (B) CPS+ phenotype revealed through Indian Ink staining technique (1000×). Figure S3. Hydrodynamic macromolecular conformation of the purified EPS from fermented milk. (A) Zimm plot. (B) The declaiming of the correlation coefficient. (C) Autocorrelation function, g(1), in the time (µs). (D) Bathochromic shift values of the Congo red–EPS complex in alkali concentrations [NaOH: 0.0–0 5 M]. Figure S4. Differential thermal analysis of the purified EPS. Figure S5. Body weight and food intake. (A) Body weight (g); (B) Food intake (g·cage−1). (A) and (B) represent before sacrifice. G1, normal control group; G2, non-fermented milk control group; G3, loperamide-induced constipation group; G4, non-fermented milk + loperamide treated group; G5, CRL75 fermented milk + loperamide-treated group; G6, EPS75 + loperamide-treated group. Results are expressed as mean ± SD. a–c Means with different letters differ significantly, p < 0.05. Table S1. Signal frequencies (cm−1), intensities, and tentative vibrational assignments of IR absorption and Raman scattering spectra of the L. rhamnosus CRL75 EPS.

Author Contributions

Conceptualization, methodology, data curation, validation, formal analysis, investigation, and writing—original draft preparation, R.E.L. and A.M.Á.; methodology, data curation, validation, and formal analysis, J.L. and V.M.; software and resources, D.N. and M.I.G.; investigation, writing—original draft preparation, visualization, supervision, project administration, and funding acquisition, M.I.T. and M.P.T. All authors have read and agreed to the published version of the manuscript.

Funding

This research was funded by PICT 2019–02858 (ANPCyT–FONCyT, Argentina) and PIP 11220200102036CO (CONICET, Argentina).

Institutional Review Board Statement

Animal experiments were carried out in strict accordance with the recommendations of the Guide to the Care and Use of Laboratory Animals from CERELA (in 8 September 2023, the Animal Care and Use Committee approved the animal experiment by the CRL-CICUAL-TD-2023/3A protocol).

Informed Consent Statement

Not applicable.

Data Availability Statement

Data are contained within the article.

Conflicts of Interest

The authors declare no conflicts of interest.

Abbreviations

The following abbreviations are used in this manuscript:
a*Redness values
A2Virial coefficient
ABTS•+2,2′-Azino-bis(3-ethylbenzothiazoline-6-sulfonic acid)
b*Yellowness values
C*Chroma
CFUsMicrobial colony-forming units
cm–1Wavenumber
CPSCapsular polysaccharide
DaDaltons
dCConcentration increment
DhHydrodynamic diameter
DLSDynamic light scattering
DMSODimethyl sulfoxide
DnRefractive index increment
DNADeoxyribonucleic acid
DTADifferential thermal analysis
DSCDifferential scanning calorimetry
EPSExopolysaccharide
eq.Equivalent
FMFermented milk
FTIRFourier transform infrared
FT-RFourier transform Raman
GGram
GGroup
g(1)Autocorrelation function
GITGastrointestinal transit
HHour
HePSHeteropolysaccharide
HPLCHigh-performance liquid chromatography
ILInterleukin
IRInfrared
kDaKilodaltons
LLiter
L*Lightness values
LABLactic acid bacteria
LDHLactate dehydrogenase
LPSLipopolysaccharides
mMass
MMolar
mmMillimeter
mgMilligram
minMinute
mLMilliliter
mPaMili Pascal
MRSDe Man, Rogosa, and Sharpe
MTT1-(4,5-Dimethylthiazol-2-yl)-3,5-diphenyl formazan
MwMolecular weight
ngNanogram
nmNanometer
pStatistical probability
PBSPhosphate buffered saline
pgPicogram
RSMReconstituted skimmed milk
sSecond
SDStandard deviation
SECSize exclusion chromatography
SLSStatic light scattering
TDDegradation temperature
TMMelting temperature
TFATrifluoroacetic acid
TGAThermogravimetric analysis
TNF-αTumor necrosis factor-α
UUnit
UVUltraviolet
VVolume
VCAscorbic acid
WIWhiteness index
xgRelative centrifugal force
YIYellow index
λmaxMaximum absorption wavelength
ΔHEnthalpy change
μLMicroliter
μMMicromolar
µsMicrosecond
°CCelsius degrees
°HHue angle
ΔRate
%Percentage

References

  1. Lynch, K.M.; Zannini, E.; Coffey, A.; Arendt, E.K. Lactic Acid Bacteria Exopolysaccharides in Foods and Beverages: Isolation, Properties, Characterization, and Health Benefits. Annu. Rev. Food Sci. Technol. 2018, 9, 155–176. [Google Scholar] [CrossRef] [PubMed]
  2. Guérin, M.; Silva, C.R.-D.; Garcia, C.; Remize, F. Lactic acid bacterial production of exopolysaccharides from fruit and vegetables and associated benefits. Fermentation 2020, 6, 115. [Google Scholar] [CrossRef]
  3. Prete, R.; Alam, M.K.; Perpetuini, G.; Perla, C.; Pittia, P.; Corsetti, A. Lactic Acid Bacteria Exopolysaccharides Producers: A Sustainable Tool for Functional Foods. Foods 2021, 10, 1653. [Google Scholar] [CrossRef] [PubMed]
  4. Berthold-Pluta, A.M.; Pluta, A.S.; Garbowska, M.; Stasiak-Różańska, L. Exopolysaccharide-producing lactic acid bacteria–health-promoting properties and application in the dairy industry. Postep. Mikrobiol. 2019, 58, 191–204. [Google Scholar] [CrossRef]
  5. Juraskova, D.; Ribeiro, S.C.; Silva, C.C.G. Exopolysaccharides Produced by Lactic Acid Bacteria: From Biosynthesis to Health-Promoting Properties. Foods 2022, 11, 156. [Google Scholar] [CrossRef]
  6. Bengoa, A.A.; Llamas, M.G.; Iraporda, C.; Duenas, M.T.; Abraham, A.G.; Garrote, G.L. Impact of growth temperature on exopolysaccharide production and probiotic properties of Lactobacillus paracasei strains isolated from kefir grains. Food Microbiol. 2018, 69, 212–218. [Google Scholar] [CrossRef]
  7. Živković, M.; Miljković, M.S.; Ruas-Madiedo, P.; Markelić, M.B.; Veljović, K.; Tolinački, M.; Soković, S.; Korać, A.; Golić, N. EPS-SJ exopolisaccharide produced by the strain Lactobacillus paracasei subsp. paracasei BGSJ2-8 is involved in adhesion to epithelial intestinal cells and decrease on E. coli association to Caco-2 cells. Front. Microbiol. 2016, 7, 286. [Google Scholar] [CrossRef]
  8. Gao, J.; Li, Q.; Liu, Y.; Yang, B.; Sadiqb, F.A.; Li, X.; Mi, S.; Sang, Y. Immunoregulatory effect of Lactobacillus paracasei VL8 exopolysaccharide on RAW264. 7 cells by NF-κB and MAPK pathways. J. Funct. Foods 2022, 95, 105166. [Google Scholar] [CrossRef]
  9. Han, J.; Xia, W.; Wang, D.; Wang, Y.; Liu, Z.; Wu, Z. Characterization of an exopolysaccharide synthesized by Lacticaseibacillus rhamnosus B6 and its immunomodulatory activity in vitro. Int. J. Biol. Macromol. 2024, 264, 130576. [Google Scholar] [CrossRef]
  10. Mozzi, F.; Torino, M.I.; de Valdez, G.F. Identification of exopolysaccharide-producing lactic acid bacteria: A method for the isolation of polysaccharides in milk cultures. In Food Microbiology Protocols; Humana Press: Totowa, NJ, USA, 2001; pp. 183–190. [Google Scholar] [CrossRef]
  11. Lobo, R.E.; Gómez, M.I.; de Valdez, G.F.; Torino, M.I. Physicochemical and antioxidant properties of a gastroprotective exopolysaccharide produced by Streptococcus thermophilus CRL1190. Food Hydrocoll. 2019, 96, 625–633. [Google Scholar] [CrossRef]
  12. Vaningelgem, F.; Zamfir, M.; Mozzi, F.; Adriany, T.; Vancanneyt, M.; Swings, J.; De Vuyst, L. Biodiversity of exopolysaccharides produced by Streptococcus thermophilus strains is reflected in their production and their molecular and functional characteristics. Appl. Environ. Microbiol. 2004, 70, 900–912. [Google Scholar] [CrossRef] [PubMed]
  13. Lobo, R.E.; Figueroa, T.; Navarro, D.; Gomez, M.I.; Font de Valdez, G.; Torino, M.I. Techno-functional properties of HoPS from lactic acid bacteria of different origins as potential food additives. Food Chem. 2021, 356, 129627. [Google Scholar] [CrossRef] [PubMed]
  14. Lobo, R.E.; Orrillo, P.A.; Ribotta, S.B.; de Valdez, G.F.; Garcia, M.S.; Cabello, J.C.R.; Torino, M.I. Structural characterization of a homopolysaccharide produced by Weissella cibaria FMy 2-21-1 and its potential application as a green corrosion inhibiting film. Int. J. Biol Macromol. 2022, 212, 193–201. [Google Scholar] [CrossRef] [PubMed]
  15. Hasheminya, S.-M.; Dehghannya, J. Novel ultrasound-assisted extraction of kefiran biomaterial, a prebiotic exopolysaccharide, and investigation of its physicochemical, antioxidant and antimicrobial properties. Mater. Chem. Phys. 2020, 243, 122645. [Google Scholar] [CrossRef]
  16. Kavitake, D.; Techi, M.; Abid, U.; Kandasamy, S.; Devi, P.B.; Shetty, P.H. Effect of γ-irradiation on physico-chemical and antioxidant properties of galactan exopolysaccharide from Weissella confusa KR780676. J. Food Sci. Technol. 2019, 56, 1766–1774. [Google Scholar] [CrossRef]
  17. Yang, X.; Ren, Y.; Zhang, L.; Wang, Z.; Li, L. Structural characteristics and antioxidant properties of exopolysaccharides isolated from soybean protein gel induced by lactic acid bacteria. LWT Food Sci. Technol. 2021, 150, 111811. [Google Scholar] [CrossRef]
  18. Rajoka, M.S.R.; Mehwish, H.M.; Zhang, H.; Ashraf, M.; Fang, H.; Zeng, X.; Wu, Y.; Khurshid, M.; Zhao, L.; He, Z. Antibacterial and antioxidant activity of exopolysaccharide mediated silver nanoparticle synthesized by Lactobacillus brevis isolated from Chinese koumiss. Colloids Surf. B Biointerfaces 2020, 186, 110734. [Google Scholar] [CrossRef]
  19. Wang, X.; Shao, C.; Liu, L.; Guo, X.; Xu, Y.; Lü, X. Optimization, partial characterization and antioxidant activity of an exopolysaccharide from Lactobacillus plantarum KX041. Int. J. Biol. Macromol. 2017, 103, 1173–1184. [Google Scholar] [CrossRef]
  20. Hanchi, H.; Sebei, K.; Mottawea, W.; Al Kasaa, I.; Hammami, R. An agar-based bioassay for accurate screening of the total antioxidant capacity of lactic acid bacteria cell-free supernatants. J. Microbiol. Methods 2022, 195, 106437. [Google Scholar] [CrossRef]
  21. Wang, X.; Zhang, F.; Liu, Z.; Feng, H.; Yu, Z.B.; Lu, Y.; Zhai, H.; Bai, F.; Shi, Y.; Lan, M. Effects of essential oil from Croton tiglium L. on intestinal transit in mice. J. Ethnopharmacol. 2008, 117, 102–107. [Google Scholar] [CrossRef]
  22. Li, X.-W.; Lv, S.; Shi, T.-T.; Liu, K.; Li, Q.-M.; Pan, L.-H.; Zha, X.-Q.; Luo, J.-P. Exopolysaccharides from yoghurt fermented by Lactobacillus paracasei: Production, purification and its binding to sodium caseinate. Food Hydrocoll. 2020, 102, 105635. [Google Scholar] [CrossRef]
  23. Exarhopoulos, S.; Raphaelides, S.N.; Kontominas, M.G. Conformational studies and molecular characterization of the polysaccharide kefiran. Food Hydrocoll. 2018, 77, 347–356. [Google Scholar] [CrossRef]
  24. Zhang, H.; Nie, S.; Guo, Q.; Wang, Q.; Cui, S.W.; Xie, M. Conformational properties of a bioactive polysaccharide from Ganoderma atrum by light scattering and molecular modeling. Food Hydrocoll. 2018, 84, 16–25. [Google Scholar] [CrossRef]
  25. Wang, Z.-M.; Cheung, Y.-C.; Leung, P.-H.; Wu, J.-Y. Ultrasonic treatment for improved solution properties of a high-molecular weight exopolysaccharide produced by a medicinal fungus. Bioresour. Technol. 2010, 101, 5517–5522. [Google Scholar] [CrossRef] [PubMed]
  26. Nowak, K.; Wiater, A.; Choma, A.; Wiącek, D.; Bieganowski, A.; Siwulski, M.; Waśko, A. Fungal (1 → 3)-α-d-glucans as a new kind of biosorbent for heavy metals. Int. J. Biol. Macromol. 2019, 137, 960–965. [Google Scholar] [CrossRef]
  27. Ivleva, N.P.; Wagner, M.; Horn, H.; Niessner, R.; Haisch, C. Towards a nondestructive chemical characterization of biofilm matrix by Raman microscopy. Anal. Bioanal. Chem. 2009, 393, 197–206. [Google Scholar] [CrossRef]
  28. Yang, Y.; Peng, Q.; Guo, Y.; Han, Y.; Xiao, H.; Zhou, Z. Isolation and characterization of dextran produced by Leuconostoc citreum NM105 from manchurian sauerkraut. Carbohydr. Polym. 2015, 133, 365–372. [Google Scholar] [CrossRef]
  29. Ye, G.; Chen, Y.; Wang, C.; Yang, R.; Bin, X. Purification and characterization of exopolysaccharide produced by Weissella cibaria YB-1 from pickle Chinese cabbage. Int. J. Biol. Macromol. 2018, 120, 1315–1321. [Google Scholar] [CrossRef]
  30. Zhang, Z.; Kong, F.; Ni, H.; Mo, Z.; Wan, J.-B.; Hua, D.; Yan, C. Structural characterization, α-glucosidase inhibitory and DPPH scavenging activities of polysaccharides from guava. Carbohydr. Polym. 2016, 144, 106–114. [Google Scholar] [CrossRef]
  31. Liu, Y.; Zhang, B.; Ibrahim, S.; Gao, S.-S.; Yang, H.; Huang, W. Purification, characterization and antioxidant activity of polysaccharides from Flammulina velutipes residue. Carbohydr. Polym. 2016, 145, 71–77. [Google Scholar] [CrossRef]
  32. Yuen, S.-N.; Choi, S.-M.; Phillips, D.L.; Ma, C.-Y. Raman and FTIR spectroscopic study of carboxymethylated non-starch polysaccharides. Food Chem. 2009, 114, 1091–1098. [Google Scholar] [CrossRef]
  33. Du, R.; Qiao, X.; Zhao, F.; Song, Q.; Zhou, Q.; Wang, Y.; Pan, L.; Han, Y.; Zhou, Z. Purification, characterization and antioxidant activity of dextran produced by Leuconostoc pseudomesenteroides from homemade wine. Carbohydr. Polym. 2018, 198, 529–536. [Google Scholar] [CrossRef] [PubMed]
  34. Chylińska, M.; Szymańska-Chargot, M.; Zdunek, A. FT-IR and FT-Raman characterization of non-cellulosic polysaccharides fractions isolated from plant cell wall. Carbohydr. Polym. 2016, 154, 48–54. [Google Scholar] [CrossRef]
  35. Matsuhiro, B.; Osorio-Román, I.O.; Torres, R. Vibrational spectroscopy characterization and anticoagulant activity of a sulfated polysaccharide from sea cucumber Athyonidium chilensis. Carbohydr. Polym. 2012, 88, 959–965. [Google Scholar] [CrossRef]
  36. Kavitake, D.; Delattre, C.; Devi, P.B.; Pierre, G.; Michaud, P.; Shetty, P.H.; Andhare, P. Physical and functional characterization of succinoglycan exopolysaccharide produced by Rhizobium radiobacter CAS from curd sample. Int. J. Biol. Macromol. 2019, 134, 1013–1021. [Google Scholar] [CrossRef] [PubMed]
  37. Miao, M.; Ma, Y.; Huang, C.; Jiang, B.; Cui, S.W.; Zhang, T. Physicochemical properties of a water soluble extracellular homopolysaccharide from Lactobacillus reuteri SK24. 003. Carbohydr. Polym. 2015, 131, 377–383. [Google Scholar] [CrossRef]
  38. Wang, J.; Zhang, J.; Guo, H.; Cheng, Q.; Abbas, Z.; Tong, Y.; Yang, T.; Zhou, Y.; Zhang, H.; Wei, X. Optimization of exopolysaccharide produced by Lactobacillus plantarum R301 and its antioxidant and anti-inflammatory activities. Foods 2023, 12, 2481. [Google Scholar] [CrossRef]
  39. Xiao, L.; Xu, D.; Tang, N.; Rui, X.; Zhang, Q.; Chen, X.; Dong, M.; Li, W. Biosynthesis of exopolysaccharide and structural characterization by Lacticaseibacillus paracasei ZY-1 isolated from Tibetan kefir. Food Chem. Mol. Sci. 2021, 3, 100054. [Google Scholar] [CrossRef]
  40. García-Burgos, M.; Moreno-Fernández, J.; Alférez, M.J.; Díaz-Castro, J.; López-Aliaga, I. New perspectives in fermented dairy products and their health relevance. J. Funct. Foods 2020, 72, 104059. [Google Scholar] [CrossRef]
  41. Hamet, M.F.; Piermaria, J.A.; Abraham, A.G. Selection of EPS-producing Lactobacillus strains isolated from kefir grains and rheological characterization of the fermented milks. LWT Food Sci. Technol. 2015, 63, 129–135. [Google Scholar] [CrossRef]
  42. Zhou, Y.; Cui, Y.; Qu, X. Exopolysaccharides of lactic acid bacteria: Structure, bioactivity and associations: A review. Carbohydr. Polym. 2019, 207, 317–332. [Google Scholar] [CrossRef]
  43. Li, C.; Li, W.; Chen, X.; Feng, M.; Rui, X.; Jiang, M.; Dong, M. Microbiological, physicochemical and rheological properties of fermented soymilk produced with exopolysaccharide (EPS) producing lactic acid bacteria strains. LWT Food Sci. Technol. 2014, 57, 477–485. [Google Scholar] [CrossRef]
  44. Wang, K.-p.; Wang, J.; Li, Q.; Zhang, Q.-l.; You, R.-x.; Cheng, Y.; Luo, L.; Zhang, Y. Structural differences and conformational characterization of five bioactive polysaccharides from Lentinus edodes. Food Res. Int. 2014, 62, 223–232. [Google Scholar] [CrossRef]
  45. Wang, K.; Niu, M.; Wu, Y.; Zhu, R.; Zhao, J.; Lu, B.; Niu, G. Physicochemical characterization and antioxidant activity of cell-bound exopolysaccharides from Lactobacillus fermentum S1 obtained by two extraction methods. Process Biochem. 2019, 85, 195–205. [Google Scholar] [CrossRef]
  46. Xiao, L.; Li, Y.; Tian, J.; Zhou, J.; Xu, Q.; Feng, L.; Rui, X.; Fan, X.; Zhang, Q.; Chen, X. Influences of drying methods on the structural, physicochemical and antioxidant properties of exopolysaccharide from Lactobacillus helveticus MB2-1. Int. J. Biol. Macromol. 2020, 157, 220–231. [Google Scholar] [CrossRef] [PubMed]
  47. Thygesen, L.G.; Løkke, M.M.; Micklander, E.; Engelsen, S.B. Vibrational microspectroscopy of food. Raman vs. FT-IR. Trends Food Sci. Technol. 2003, 14, 50–57. [Google Scholar] [CrossRef]
  48. Bhat, B.; Bajaj, B.K. Hypocholesterolemic potential and bioactivity spectrum of an exopolysaccharide from a probiotic isolate Lactobacillus paracasei M7. Bioact. Carbohydr. Diet. Fibre 2019, 19, 100191. [Google Scholar] [CrossRef]
  49. Sánchez-Moreno, C. Methods used to evaluate the free radical scavenging activity in foods and biological systems. Food Sci. Technol. Int. 2002, 8, 121–137. [Google Scholar] [CrossRef]
  50. Liu, C.F.; Tseng, K.C.; Chiang, S.S.; Lee, B.H.; Hsu, W.H.; Pan, T.M. Immunomodulatory and antioxidant potential of Lactobacillus exopolysaccharides. J. Sci. Food Agric. 2011, 91, 2284–2291. [Google Scholar] [CrossRef]
  51. Shankar, T.; Palpperumal, S.; Kathiresan, D.; Sankaralingam, S.; Balachandran, C.; Baskar, K.; Hashem, A.; Alqarawi, A.A.; Abd_Allah, E.F. Biomedical and therapeutic potential of exopolysaccharides by Lactobacillus paracasei isolated from sauerkraut: Screening and characterization. Saudi J. Biol. Sci. 2021, 28, 2943–2950. [Google Scholar] [CrossRef]
  52. Kıray, E.; Raheel, N.M. New Approach to Exopolysaccharides of Post Probiotic Lactobacillus paracasei L1 Strain: Anti-quarum Sensing Activity. Balkan Med. J. 2023, 40, 351–357. [Google Scholar] [CrossRef] [PubMed]
  53. Tarique, M.; Ali, A.H.; Kizhakkayil, J.; Gan, R.-Y.; Liu, S.-Q.; Kamal-Eldin, A.; Ayyash, M. Investigating the biological activities and prebiotic potential of exopolysaccharides produced by Lactobacillus delbrueckii and Lacticaseibacillus rhamnosus: Implications for gut microbiota modulation and rheological properties in fermented milk. Food Hydrocoll. Health 2023, 4, 100162. [Google Scholar] [CrossRef]
  54. Wang, X.; Tian, J.; Zhang, X.; Tang, N.; Rui, X.; Zhang, Q.; Dong, M.; Li, W. Characterization and immunological activity of exopolysaccharide from Lacticaseibacillus paracasei GL1 isolated from Tibetan kefir grains. Foods 2022, 11, 3330. [Google Scholar] [CrossRef] [PubMed]
  55. Cheng, S.; Li, B.; Ding, Y.; Hou, B.; Hung, W.; He, J.; Jiang, Y.; Zhang, Y.; Man, C. The probiotic fermented milk of Lacticaseibacillus paracasei JY062 and Lactobacillus gasseri JM1 alleviates constipation via improving gastrointestinal motility and gut microbiota. J. Dairy Sci. 2024, 107, 1857–1876. [Google Scholar] [CrossRef]
  56. Park, S.-H.; Lee, M.-R.; Yang, S.Y.; Lee, J.Y.; Lee, H.H.; Seong, Y.-J.; Kim, B.; Kim, H.-J.; Jin, H.; Johnston, T.V. In vivo functional effects of Weissella confusa VP30 exopolysaccharides on loperamide-induced constipation in rats. Food Sci. Biotechnol. 2022, 31, 1703–1715. [Google Scholar] [CrossRef]
Figure 1. Fermentation of skimmed milk by Lactobacillus rhamnosus CRL75 (FM75). (A) Phenotypic appearance of the “ropy” strand formed by CRL75 on skimmed milk agar plates. (B) CPS+ phenotype visualized using the Indian Ink staining technique (light microscopy, 1000×). (C) Flow curve of FM75 (viscosity vs. frequency). (D) Morphology of the purified and lyophilized EPS75 (magnifying lens, 10×). (E) UV spectrum of EPS75 in the 200–500 nm range.
Fermentation 11 00224 g001
Figure 2. Characterization of EPS75. (A) Chromatogram of monosaccharide composition. (B) Chromatogram of molecular weight. Inset: calibration curve of standard dextran (39.1–4900 kDa). (C) EPS size distribution by intensity. (D) Variation in λmax of EPS–Congo red complexes at different NaOH concentrations. Milli-Q water was used as a negative control.
Fermentation 11 00224 g002
Figure 3. Physicochemical properties of EPS75. (A) FTIR and FT-Raman spectroscopic profiles (gray dashed lines indicate vibrational signals that are active in both spectra). (B) Thermogravimetric analysis (TGA) of mass loss. (C) Differential scanning calorimetry (DSC).
Fermentation 11 00224 g003
Figure 4. Antioxidant capacity of purified EPS75. (A) ABTS•+ radical scavenging ability. (B) HO radical scavenging. (C) O2•− scavenging. (D). H2O2 scavenging. (E) Mo6+/5+ reducing power. (F) Fe3+/2+ reducing power. (G) Mn7+/+4 reducing power. Results are expressed as mean ± standard deviation (SD). Different letters (a–f) indicate significant differences (p < 0.05).
Fermentation 11 00224 g004
Figure 5. Cytotoxicity potential of purified EPS75. (A) MTT assay (% cell viability). (B) Cell membrane permeability (LDH activity, U·L−1). Results are expressed as mean ± SD. Different letters (a–h) indicate significant differences (p < 0.05).
Fermentation 11 00224 g005
Figure 6. Cytokine profile induced in RAW264.7 cells by EPS75: (A) IL-10 (pg·mL−1), (B) TNF-α (pg·mL−1), (C) IL-6 (pg·mL−1), and (D) IL-1β (pg·mL−1). Results are expressed as mean ± SD. Different letters (a–q) indicate significant differences (p < 0.01).
Fermentation 11 00224 g006
Figure 7. Gastrointestinal transit of charcoal (%). G1, normal control group; G2, non-FM control group; G3, loperamide-induced constipation group; G4, non-FM + loperamide-treated group; G5, FM75 + loperamide-treated group; G6, EPS75 + loperamide-treated group. Results are expressed as mean ± SD. Different letters (a–e) indicate significant differences (p < 0.05).
Fermentation 11 00224 g007
Table 1. Chromatic parameters of the purified EPS75 isolated from FM75.
aBL°HC*WIYI
0.21 ± 0.121.92 ± 0.8978.29 ± 0.9185.99 ± 2.321.92 ± 0.9978.19 ± 0.913.46 ± 1.83
Disclaimer/Publisher’s Note: The statements, opinions and data contained in all publications are solely those of the individual author(s) and contributor(s) and not of MDPI and/or the editor(s). MDPI and/or the editor(s) disclaim responsibility for any injury to people or property resulting from any ideas, methods, instructions or products referred to in the content.

