Article

Evaluation of Sensory Properties and Short-Chain Fatty Acid Production in Fermented Soymilk on Addition of Fructooligosaccharides and Raffinose Family of Oligosaccharides

1
Department of Plant Physiology and Biochemistry, Bihar Agricultural University, Sabour, Bhagalpur 813210, Bihar, India
2
Division of Biochemistry, ICAR-Indian Agricultural Research Institute, New Delhi 110012, India
3
Automation and Plant Engineering Division, ICAR-National Institute of Secondary Agriculture, Namkum, Ranchi 834010, Jharkhand, India
4
Symbiosis Centre for Climate Change and Sustainability, Symbiosis International University (Deemed), Pune 412115, Maharashtra, India
5
Statistics and Economics Section, ICAR-Sugarcane Breeding Institute, Coimbatore 641007, Tamil Nadu, India
6
Division of Microbiology, ICAR-Indian Agricultural Research Institute, New Delhi 110012, India
7
Division of Agricultural Chemicals, ICAR-Indian Agricultural Research Institute, New Delhi 110012, India
*
Authors to whom correspondence should be addressed.
Fermentation 2025, 11(4), 194; https://doi.org/10.3390/fermentation11040194
Submission received: 6 February 2025 / Revised: 21 February 2025 / Accepted: 27 February 2025 / Published: 5 April 2025

Abstract

:
High potential is attributed to the concomitant use of probiotics and prebiotics in a single food product, called “synbiotics”, where the prebiotic component distinctly favours the growth and activity of probiotic microbes. This study implemented a detailed comparison between the prebiotic effect of Fructooligosaccharides (FOSs) and Raffinose family oligosaccharides (RFOs) on the viable count of bacteria, hydrolysis into monosaccharides, the biosynthesis of short-chain fatty acids and sensory attributes of soymilk fermented with 1% (v/v) co-cultures of Lacticaseibacillus rhamnosus JCM1136 and Weissella confusa 30082b. The highest viable count of 1.21 × 10⁹ CFU/mL was observed in soymilk with 3% RFOs added as a prebiotic source compared with MRS broth with 3% RFOs (3.21 × 10⁸) and 3% FOS (6.2 × 10⁷ CFU/mL) when replaced against glucose in MRS broth. Raffinose and stachyose were extensively metabolised (4.75 and 1.28-fold decrease, respectively) in 3% RFOs supplemented with soymilk, and there was an increase in glucose, galactose, fructose (2.36, 1.55, 2.76-fold, respectively) in soymilk supplemented with 3% FOS. Synbiotic soymilk with 3% RFOs showed a 99-fold increase in methyl propionate, while the one supplemented with 3% FOS showed an increase in methyl butyrate. The highest acceptability based on the sensory attributes was for soymilk fermented with 2% RFOs + 2% FOS + 2% table sugar + 1% vanillin (7.87 ± 0.52) with high mouth feel, product consistency, taste, and flavour. This study shows that the simultaneous administration of soy with probiotic bacteria and prebiotic oligosaccharides like FOSs and RFOs enhance the synergistic interaction between them, which upgraded the nutritional and sensory quality of synbiotic soymilk.

1. Introduction

Recently, consumers have been cognizant of the association between health and diet. There is a huge demand for healthy foods with enhanced nutritional status to avert health problems. This trend offers new opportunities for functional foods with health benefits beyond their fundamental nutritional value, which concurrently meet consumers’ expectations, including good taste and texture [1]. The abundance of nutrients in soybeans makes them a good candidate for human consumption. Among the soy foods, soymilk constitutes an excellent source of good quality protein for human consumption, and its nutritional quality and sensory properties can be enhanced via lactic acid fermentation with the simultaneous depletion of anti-nutrients [2,3]. Fermentation is an advisable strategy to improve soy milk’s nutritional, shelf-life, and organoleptic attributes since soybean composition encourages the growth of microorganisms, including probiotics [4,5].
The International Scientific Association for Probiotics and Prebiotics (ISAPP) updated the definition of a synbiotic to “a mixture comprising live microorganisms and substrate(s) selectively utilized by host microorganisms that confer a health benefit on the host” [6]. Among the diverse strategies to enhance the functionality of soymilk, employing co-culture fermentation and incorporating prebiotics in fermented soy foods could be promising, as they offer a wide range of health benefits to the consumer [7]. The intake of synbiotics has been identified to enhance the immune response, haemato-immunological serum parameters, and intestinal fermentation in the host [8].
Pure culture models do not emulate the environmental conditions that the probiotic bacteria confront in the human gut. Bacterial fermentation occurs in the colon, utilising prebiotics/dietary fibre as major growth substrates, which do not undergo digestion in the small intestine [9]. Co-culture fermentation can stimulate the production of nutritional compounds and enzymes resulting from positive mutual interactions between the bacteria, called protocooperation. Co-culture fermentation encourages multi-step transformation, boosts the viable cell count, and allocates the required nutrients and molecules like bacteriocins through mutualistic interactions like quorum sensing within the microbial consortium [10].
To be a synergistic synbiotic, the probiotic microorganism chosen must be entrenched in its ability to deliver a health benefit, and the prebiotic substrate is selected to essentially aid the growth and activity of that particular probiotic microorganism [11]. The dietary combination of soy with probiotics and prebiotics seems to increase the coordination between probiotic bacteria and soy components, which may result in the upgradation of nutritional quality rather than being solely attributable to individual components [12]. Soymilk is also a native source of oligosaccharides with lower degrees of polymerisation, such as Raffinose family oligosaccharides (RFOs)—raffinose and stachyose, which cannot be digested easily as humans do not have α-galactosidases, which hydrolyse these oligosaccharides [13]. During soy milk fermentation, the hydrolysis of RFOs to sucrose and galactose through bacterial α-galactosidases eliminates the flatulence in the fermented soy foods. Fructooligosaccharides (FOSs), on the other hand, are not naturally present in soy milk. FOSs are low-calorie carbohydrates with the β-(2-1) glycosidic linkage of glucose and fructose constituting up to eleven sugar moieties. The growth-promoting properties of RFOs and FOSs enhance the viable bacterial count, and their hydrolysis leads to the co-production of readily absorbable short-chain fatty acid (SCFA) metabolites, primarily acetate, propionate, and butyrate, as end products [14]. One kind of potential postbiotic—beneficial substances generated by the gut bacteria during fermentation—is the SCFA. The accumulation of these SCFAs decreases the pH of soy foods, which helps hinder pathogen attacks. The liver predominantly absorbs propionate, while butyrate is a prominent colonocyte energy source. At the same time, SCFAs are well known for preventing colon cancer, maintaining immune homeostasis and reducing the risk of gastrointestinal disorders, thus conferring additional health benefits to the consumption of synbiotics [15].
Improving soymilk’s functional quality also emphasises the consumer acceptance of the fermented product, which is directly linked to its sensory attributes. Lactic acid-fermented foods are usually characterised by a sour taste, mainly attributed to the lactic and acetic acid produced. The FOSs improve the sensory properties of soy milk by providing sweetness [16]. Also, adding RFOs upgrades the firmness and chewiness of soy foods [17].
Limited studies have demonstrated the nutraceutical potential of synbiotic soymilk developed out of the synergistic interaction between prebiotic oligosaccharides and multi-species bacterial consortia. To the best of our knowledge, this is the first comparative study of the synbiotic behaviour of FOSs and RFOs and their synergistic interaction with co-cultures of commonly used probiotics like L. rhamnosus JCM1136 and emerging probiotics like Weissella confusa 30082b.

2. Materials and Methods

2.1. Biological Material and Reagents

L. rhamnosus JCM1136 was procured from the Japan Collection of Microorganisms (JCM) RIKEN BioResource Research Center, Kyoto-fu, Japan, and W. confusa 30082b was obtained from the National Centre for Cell Science (NCCS) Pune, India. Soybean seeds belonging to the Pusa 1213 cultivar were collected from the Division of Genetics and Plant Breeding, ICAR-Indian Agricultural Research Institute (ICAR-IARI), New Delhi, India. The Raffinose/Sucrose/D-Glucose assay kit (#K-RAFGL) and Raffinose/D-Galactose Assay Kit (K-RAFGA) were procured from Megazyme International Ltd., (Wicklow, Ireland). Raffinose pentahydrate, stachyose pentahydrate (RFOs) and FOSs were procured from Sigma-Aldrich Chemicals, St. Louis, MO, USA. Other analytical grade chemicals and gas chromatography (GC) analysis reagents were procured from Sisco Research Laboratories (SRL) Pvt. Ltd., New Delhi, India.

2.2. Preparation of Synbiotic Soymilk

In double-distilled water, 400 g of soybean seeds were soaked for 14 h. The dehulled soybean seeds were homogenised using warm double-distilled water with a 1:10 seed–water ratio. The solution was filtered using a muslin cloth and collected. Prebiotics were added to the soymilk at different concentrations (2% FOS, 2% RFOs, 3% FOS, and 3% RFOs; all w/v). Further, soymilk containing these prebiotic oligosaccharides was sterilised by autoclaving at 121 °C for 15 min and cooled to 37 °C. Sterilised soymilk was inoculated with (1% v/v) cultures of L. rhamnosus JCM1136 and W. confusa 30082b mixed in a ratio of 1:1 with an average concentration of 107 CFU/mL. Fermentation was carried out in a bioreactor (Applikon-Model: Bio Console ADI 1025, Conquer Scientific, Faridabad, India) at 37 °C for 48 h and stirred at 250 rpm. Microaerophilic conditions were maintained by sparging the culture with 0.05 v/v/min filter-sterilised (0.22 μm) nitrogen. Samples were collected periodically to monitor growth and assess the biochemical parameters.

2.3. Measurement of pH and Titratable Acidity (TA)

The pH was continuously measured using the 405-DPAS probe in Mettler Toledo, Mumbai, India. The Association of Official Analytical Chemists [18] technique was used to calculate the TA, which was then expressed as a percentage of lactic acid. After taking a sample of 10 mL of fermented soymilk, 10 mL of distilled water was added along with 4–5 drops of the phenolphthalein indicator. The solution was titrated against 0.1 N of NaOH till the solution colour turned pink, indicating the endpoint.

2.4. Estimation of Glucose, Sucrose, and RFOs

The concentration of glucose, sucrose, and RFOs was determined using an enzyme-based Raffinose/Sucrose/D-Glucose Assay Kit (K-RAFGL), Megazyme (Wicklow, Ireland). In a test tube, 0.5 g of freeze-dried synbiotic soymilk and 5 mL of 95% v/v ethanol were taken. The mixture was incubated in a water bath at 87 °C for 5 min to inactivate the endogenous enzymes. The volume was adjusted to 50 mL with a sodium acetate buffer (50 mM), pH 4.5, and the digested sample was extracted for 20 min and mixed thoroughly. Subsequently, the mixture was centrifuged at 1000× g for 10 min after 2 mL of chloroform, and 5 mL of slurry was violently vortexed for 20 s. A volume of 0.2 mL from the aqueous phase of the supernatant was taken in three tubes to carry out an assay for glucose, sucrose, and RFOs. A volume of 0.2 mL of sodium acetate buffer, invertase, and a mixture of α-galactosidase and invertase was poured into three tubes and incubated at 50 °C for 20 min. The reagent blank (0.4 mL of a 50 mM sodium acetate buffer) and D-glucose control were prepared simultaneously. Subsequently, 3 mL of Glucose Oxidase/Peroxidase (GOPOD) was added to all tubes and incubated at 50 °C for 20 min. The change in absorbance was measured at 510 nm against the reagent blank. The Raffinose/D-Galactose Assay Kit was used to evaluate the levels of free D-galactose and raffinose (K-RAFGA), Megazyme.

2.5. Estimation of Fructose

For fructose estimation, a spectrophotometric method given by Assaker and Rima (2019) [19] using 2-Thiobarbituric Acid (TBA) and Zero-Valent Iron Powder (ZVIP) was followed. For analysis, 3 mL of freeze-dried synbiotic soymilk sample treated with ZVIP was poured into 3 mL of TBA in 15% acetic acid (1% TBA, w/v). The mixture was heated in a water bath maintained at 102 °C for 13 min. The mixture was allowed to cool, and, then, absorption was measured at 490 nm.

2.6. Measurement of Cell Viability

The estimation of total viable cells was performed using the spread plate method of cell counting with standard MRS agar containing 2% glucose as the primary carbon source. Plates of MRS agar medium were prepared using standard microbiological practises. The serial dilution of the cultured viable cells was performed using sterile NaCl solution (0.85% w/v) for the quantitative estimation of the number of viable microorganisms. The bacterial culture in serially diluted tubes with NaCl solutions were spread on MRS medium plates using a sterile glass spreader. Overnight incubation of the plates was performed at 37 °C. The unit in which the concentration of viable cells was measured is CFU/mL.

2.7. Kinetics of Cell Growth with Different Carbon Sources

The microbial growth rate was assessed using a growth analyser (Bio screen C automated; Model-FP-1100-C, Fujitsu, Pune, India). The wells of microtiter plates were filled with 381.2 µL of a chemically defined medium containing only glucose or the aforementioned prebiotic oligosaccharides. In total, 3.82 µL of bacterial cultures was added to the media, and the kinetics of bacterial growth were spectrophotometrically monitored at 600 nm (A600) at 1 h intervals up to 48 h in media supplemented with D-glucose or prebiotics incubated at 37 °C.

2.8. Fatty Acyl Methyl Ester (FAME) Preparation and GC Analysis

For SCFA metabolite estimation, soy lipids were derivatised to FAME [20]. For that, 100 mL of synbiotic soymilk was stirred with hexane (ratio 1:3) for 30 min, and the hexane layer was syphoned. The extraction was repeated 2 more times to achieve maximum defatting. The hexane layer was then transferred to a round bottom flask, and the hexane was evaporated using a rotary evaporator at 55 °C with a gradual increase in pressure. The lipid fraction was taken in a double-necked round bottom flask, and 25 mL of 1% methanolic H2SO4 was added to it for derivatisation. The mixture was transferred into an oil bath and was refluxed at 90 °C until methyl ester was formed. The ester formation was confirmed with thin-layer chromatography. H2SO4 was removed by adding a saturated solution of Na2CO3 and neutralising the solution (pH = 7.0). Methanol was removed using a rotary evaporator, and 10–15 mL of distilled water was added to it, followed by 50 mL of diethyl ether. The diethyl ether layer was separated using a funnel, and a pinch of anhydrous Na2SO4 was added to remove water drops in the diethyl ether layer. Once the turbidity disappeared, the diethyl ether fraction was kept overnight to air dry. Methyl esters of fatty acid preparation and standards were diluted using HPLC-grade hexane and injected into GC. Samples were analysed using a Shimadzu GC-2010 instrument (Kyoto, Japan) equipped with a Flame Ionisation Detector (FID) with an RTX-5ms capillary column (30 m × 0.25 mm × 0.25 µm film thickness). The initial column temperature was 60 °C, increased at the rate of 3 °C/min up to 220 °C, and, then, the FID temperature was 260 °C, held for 5 min. The helium (carrier gas) flow rate was kept at 1 mL/min. In total, 1 µL of the derivatised sample was injected with a 3 min solvent delay time and a split ratio of 20:1.

2.9. Sensory Evaluation

Colour, mouth feel, consistency, taste, flavour, and overall liking of the synbiotic soymilk were evaluated using a nine-point hedonic scale (1-“Dislike extremely” and 9-“like extremely”) [21]. The sensory evaluation of 18 soymilk beverages was performed by 25 participants (16 males and 9 females). Initial subject selection criteria included interest, availability, smoking status, and the absence of dietary allergies. All 25 members involved in the sensory evaluation of fermented soymilk received appropriate training for their role and food hygiene training. A unique 2-digit code identified each sample in this single-blind trial. The co-culture fermented soymilk was supplemented with RFOS/FOS at different concentrations (1%, 2%, 3%) along with 2% table sugar. In total, 1% vanillin was added as a flavouring agent to enhance palatability. The oligosaccharides provide sweetness to the fermented soymilk; therefore, only 2% table sugar was added. All samples were prepared in a uniform manner in terms of size and portion to minimise variability.

2.10. Statistical Analysis

The results were obtained for each treatment in triplicates and are presented as means ± standard deviations. The ANOVA test was carried out for the variables including pH, TA, RFOs, FOSs, SCFAs and sensory attributes of synbiotic soymilk to determine the significance of the relationship. Duncan’s multiple range test (DMRT) was carried out to compare treatments under each response variable at 5% significance level. Principal component analysis (PCA) of the synbiotic soymilk samples was performed using the scores provided by the panellists via the hedonic rating scale, and the software used was R-version-4.2.1. The PCA graph was obtained as points or row names, and the variables are exhibited as vectors or arrows representing the scores.

3. Results

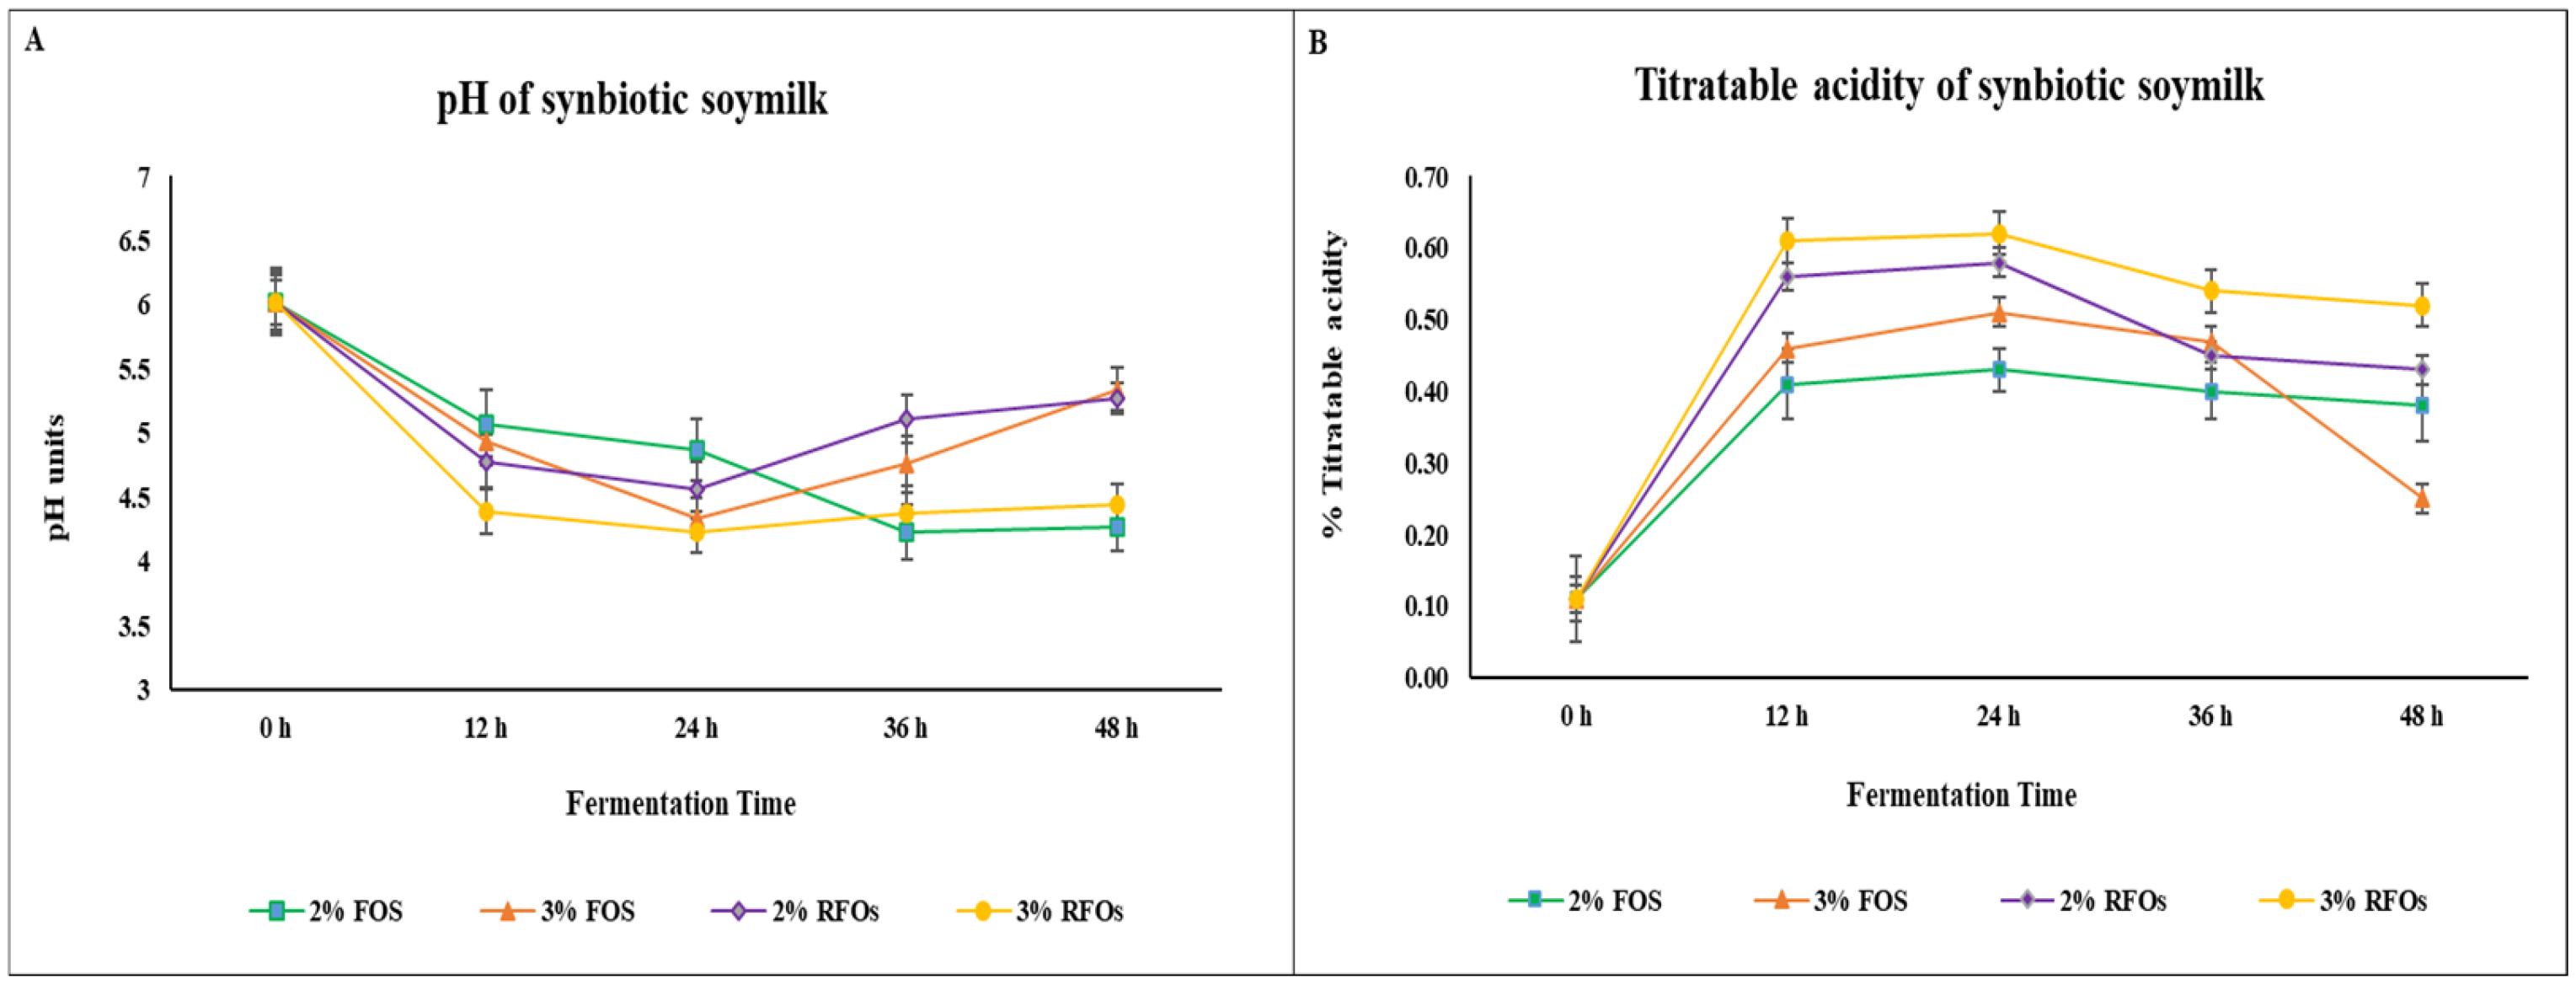
3.1. pH and TA Change During Fermentation and Storage

In our study (Figure 1A), the pH change in synbiotic soymilk was monitored after 0, 12, 24, 36, and 48 h fermentation. The initial pH was 6.0 ± 0.2 for the unfermented soymilk (control), and, during fermentation, a gradual decrease in pH was observed. The pH values of the soymilk fermented with co-cultures of L. rhamnosus JCM1136 and W. confusa 30082b having 2% FOS showed a maximum decrease to 4.2 ± 0.1 after the 36 h and slightly increased up to 4.3 ± 0.1 after the 48 h of fermentation. The pH values of synbiotic soymilk with 3% FOS decreased to 4.3 ± 0.3 after 24 h and increased to 5.3 ± 0.4 after 48 h of fermentation. Meanwhile, the pH values of the soymilk fermented with co-cultures of L. rhamnosus JCM1136 and W. confusa 30082b with 3% RFOs showed a maximum decrease to 4.2 ± 0.4 after 24 h and increased to 4.3 ± 0.5 until the 36 h. Meanwhile, for the synbiotic soymilk with 2% RFOs, the pH values decreased to 4.5 ± 0.2 after 36 h of fermentation and increased to 5.2 ± 0.5 after 48 h.
In our study, the titrable acidity (TA) of unfermented soymilk (control) was 0.11 ± 0.02%. The TA increased to 0.43 ± 0.03% after 24 h of fermentation and slightly decreased to 0.38 ± 0.06% after 48 h of fermentation in synbiotic soymilk, having 2% FOS added. The TA of synbiotic soymilk with 3% FOS prebiotic increased to 0.51 ± 0.05%, where the maximum acidity of 0.51 ± 0.05% was reached after 24 h of fermentation and decreased to a minimum of 0.25 ± 0.03% after 48 h of fermentation. Meanwhile, the soymilk fermented with co-cultures of L. rhamnosus JCM1136 and W. confusa 30082b having 3% RFO prebiotic reached a maximum acidity of 0.62 ± 0.02% after 24 h of fermentation and decreased to 0.52 ± 0.02% after 48 h of fermentation. In synbiotic soymilk with 2% RFOs added, the TA increased from 0.11 ± 0.02 to 0.58 ± 0.06% after 24 h of fermentation and dropped to 0.43 ± 0.03% after 48 h (Figure 1B, Tables S2 and S3).

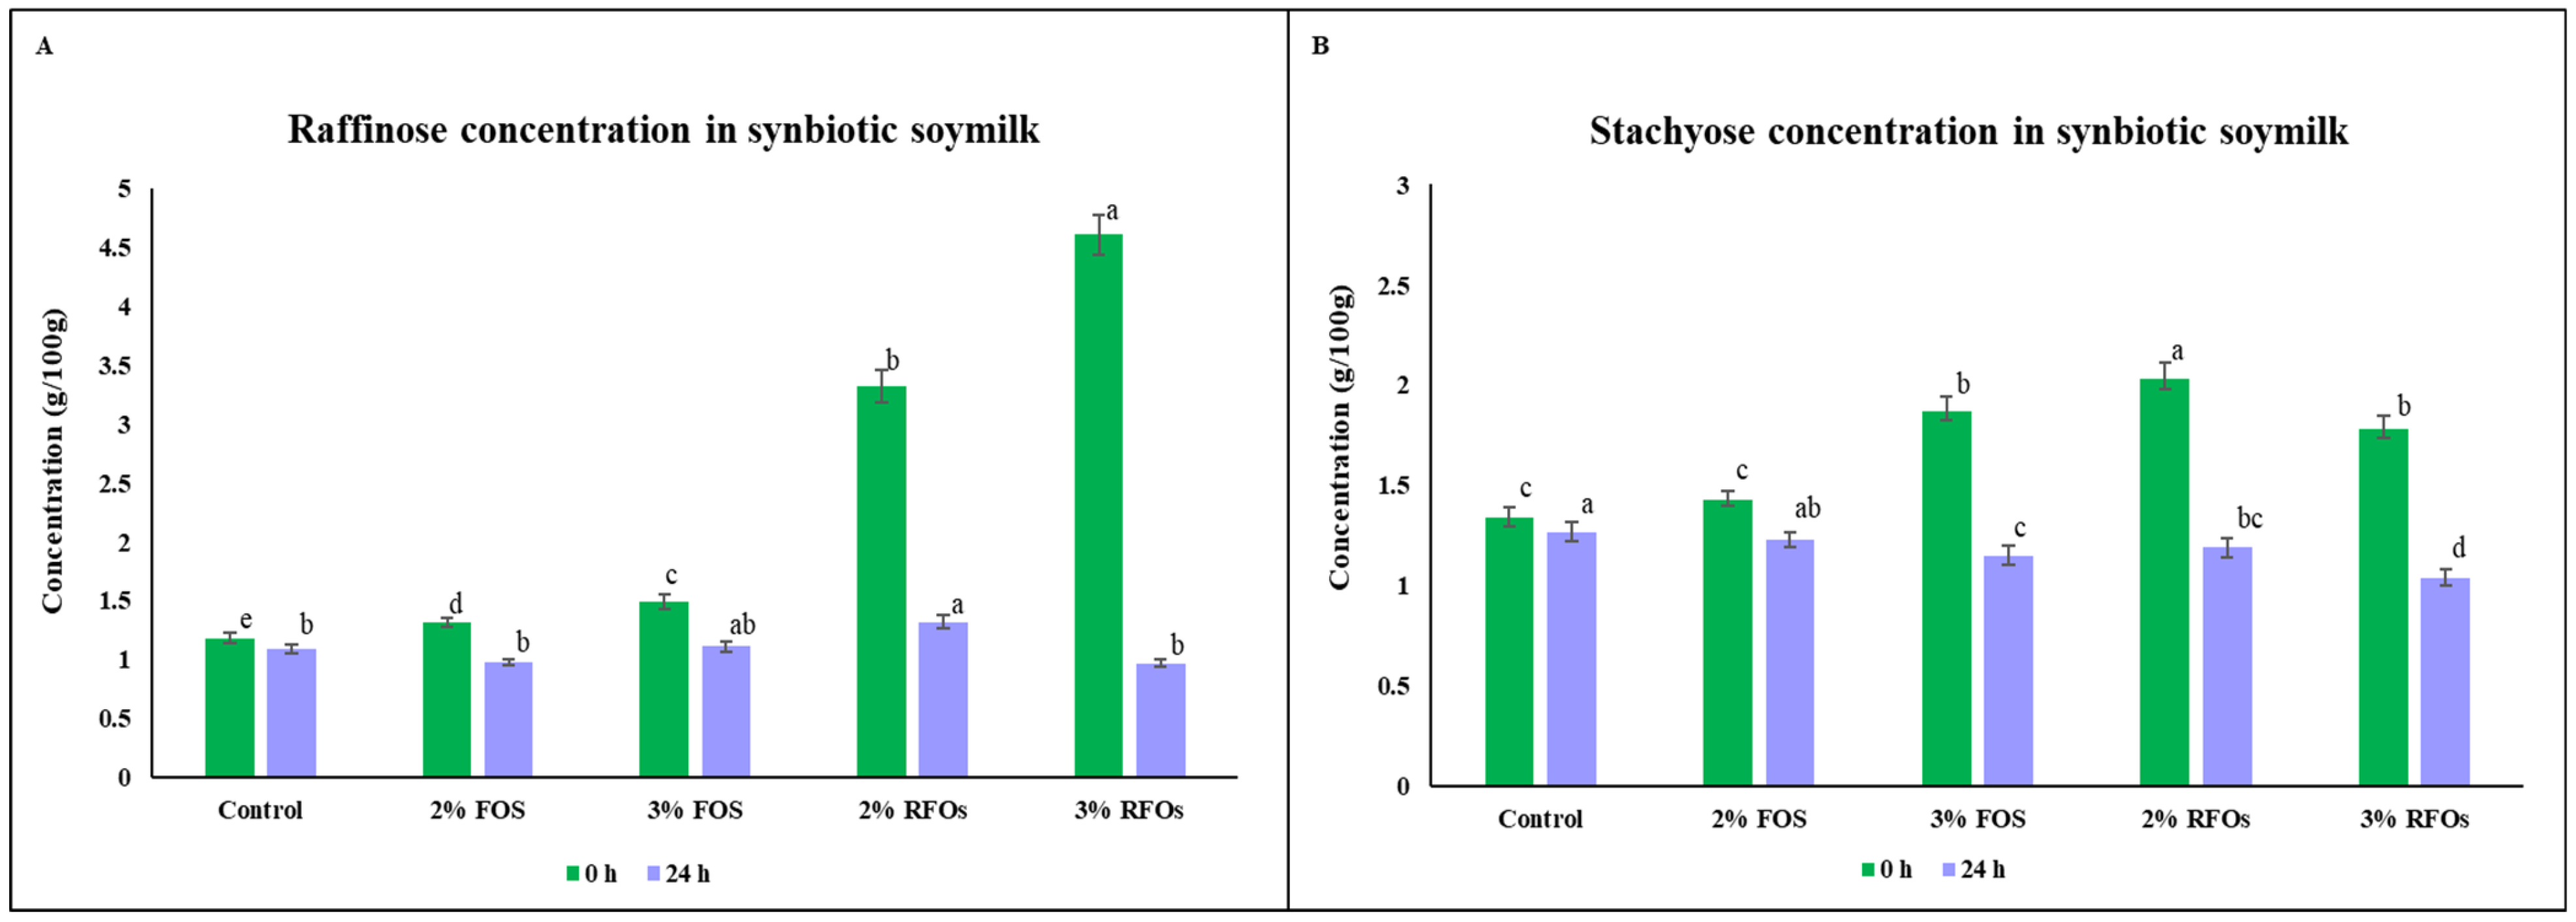
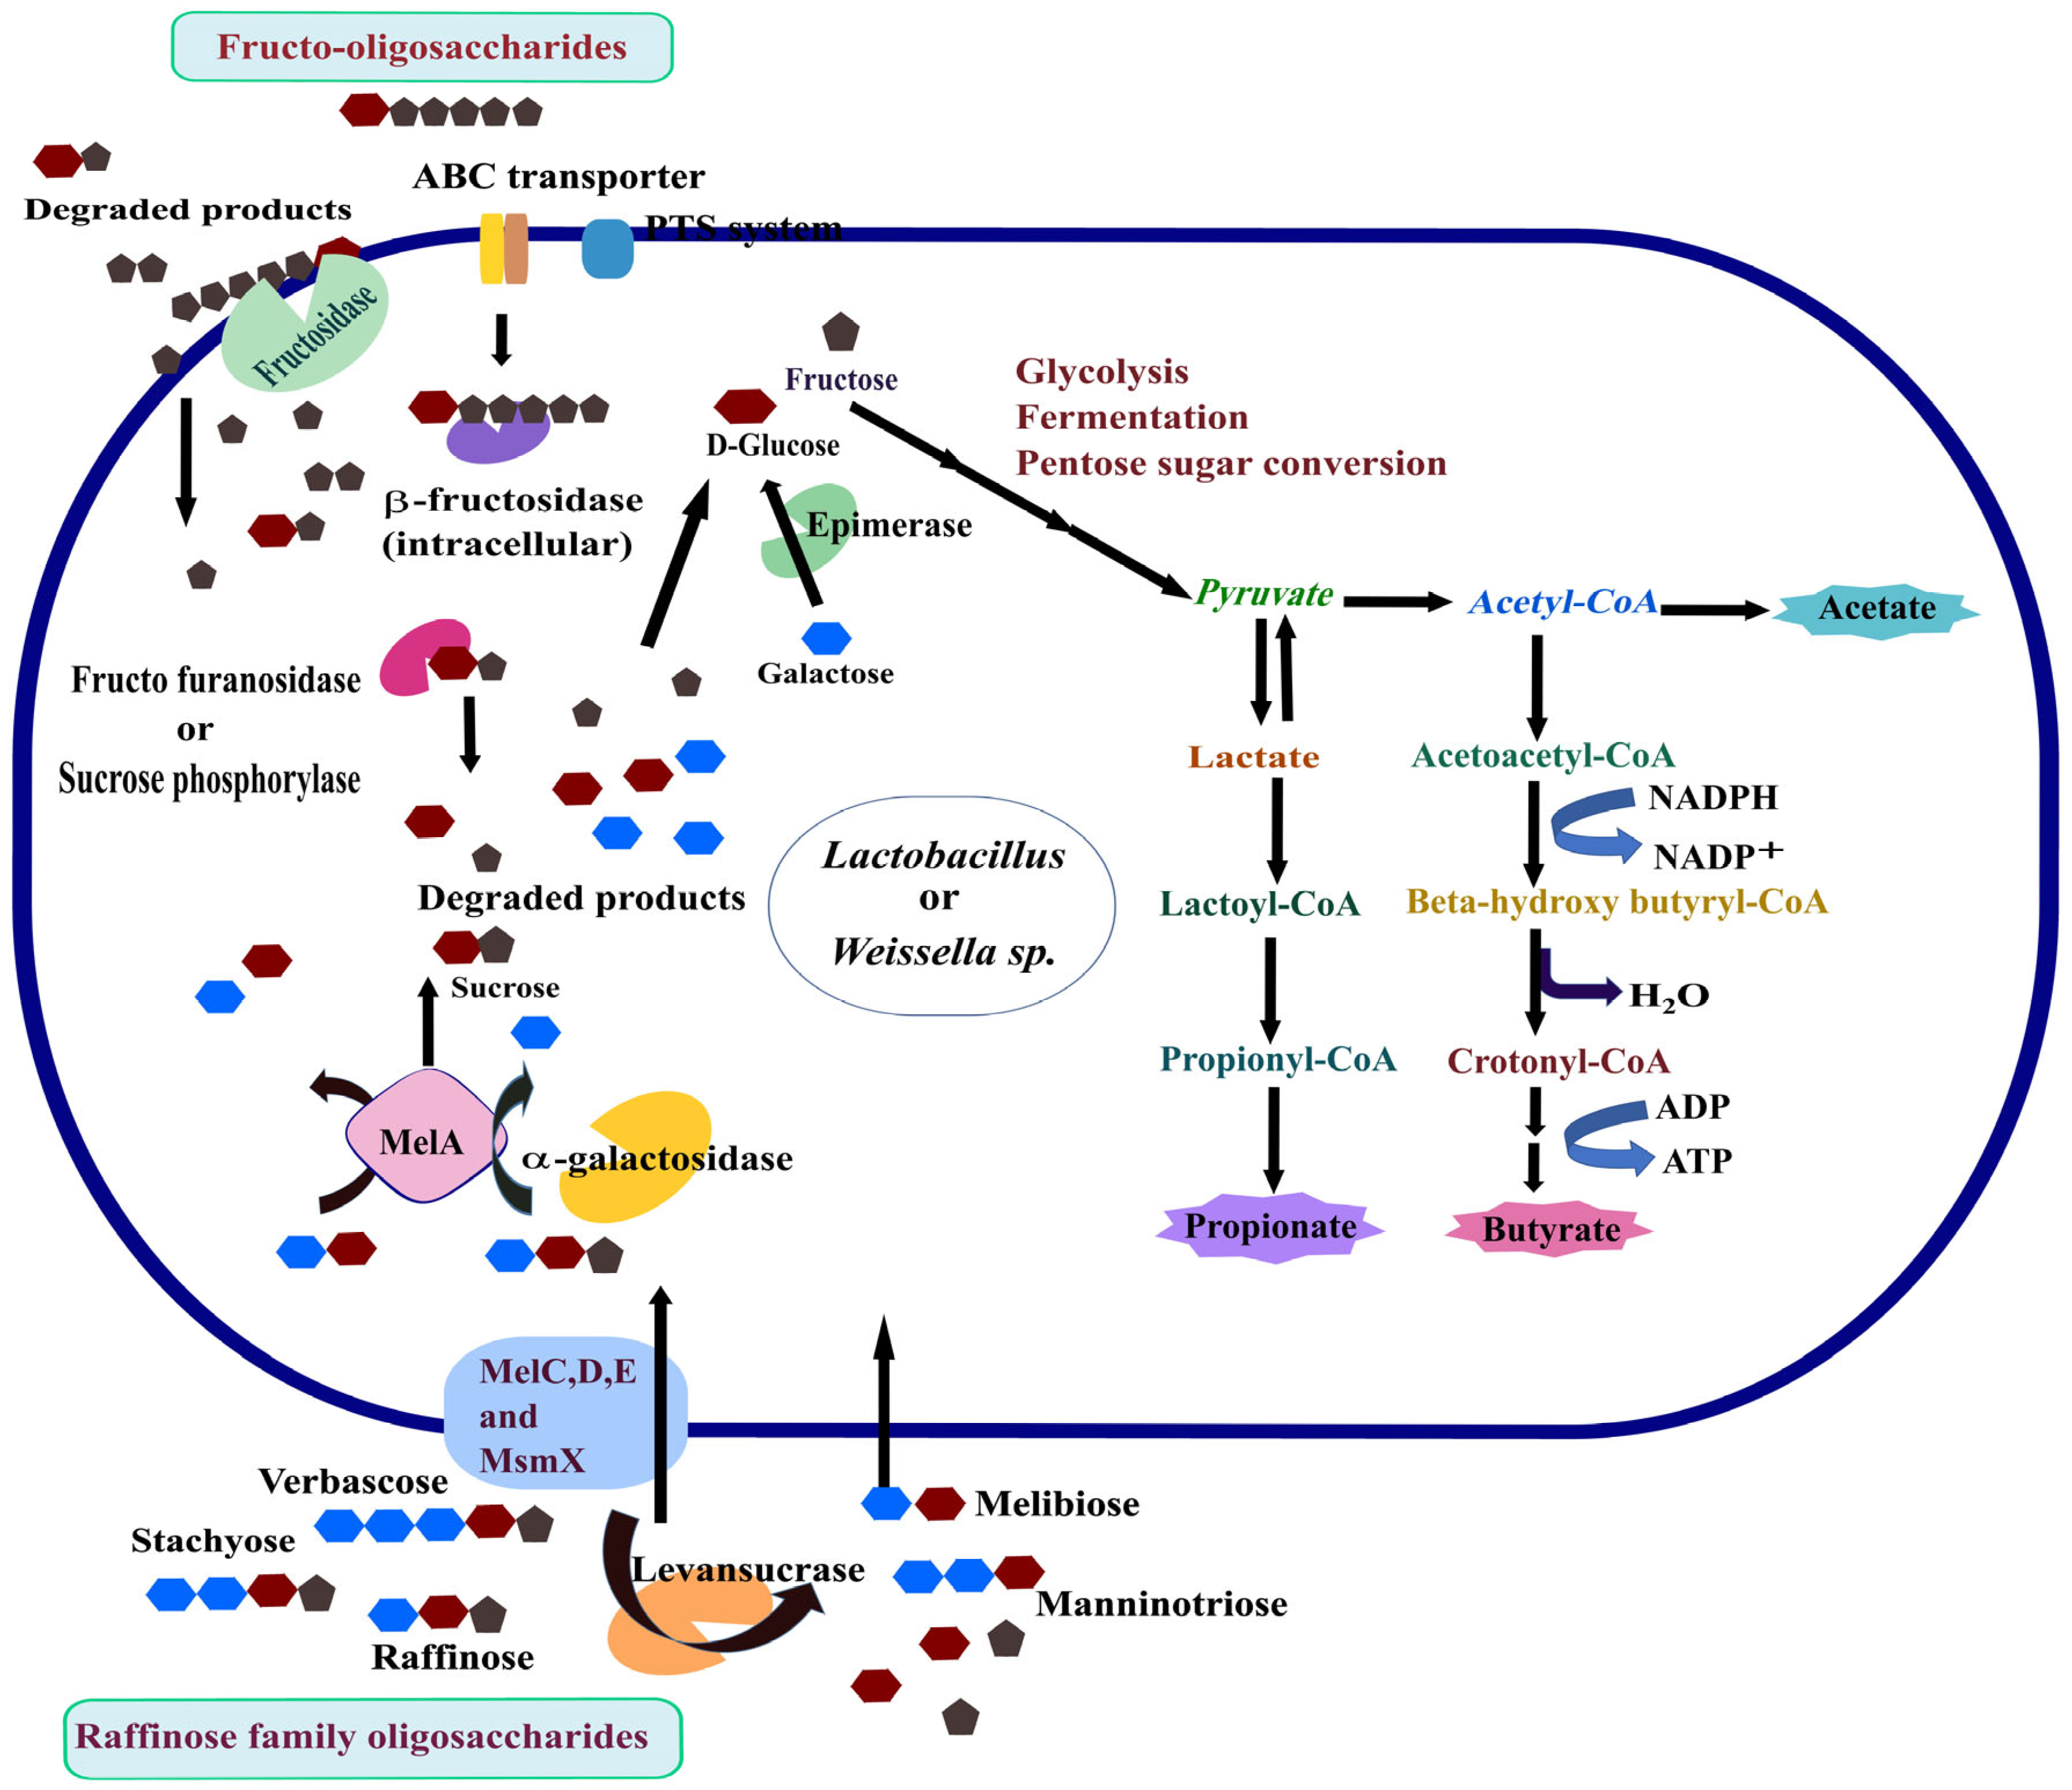
3.2. Utilisation of Prebiotic Oligosaccharides—RFOs and FOS

Prior to fermentation, soymilk had a much higher percentage of raffinose and stachyose than the fermented versions. After 24 h of fermentation, the probiotic bacteria extensively metabolised raffinose and stachyose. In soymilk supplemented with 3% RFOs, raffinose was reduced up to 0.97 ± 0.07 g/100 g from 4.61 ± 0.13 g/100 g, i.e., a 4.75-fold decrease after 24 h of fermentation (Figure 2A), and stachyose was reduced to 1.04 ± 0.02 g/100 g from 1.78 ± 0.06 g/100 after 24 h (Figure 2B). However, the concentration of raffinose for soymilk supplemented with 2% FOS and 3% FOS was found to be reduced to 0.98 ± 0.03 and 1.11 ± 0.04 by, respectively (Figure 2A). For the same samples, the concentration of stachyose decreased to 1.23 ± 0.03 and 1.15 ± 0.04, respectively (Table S4).

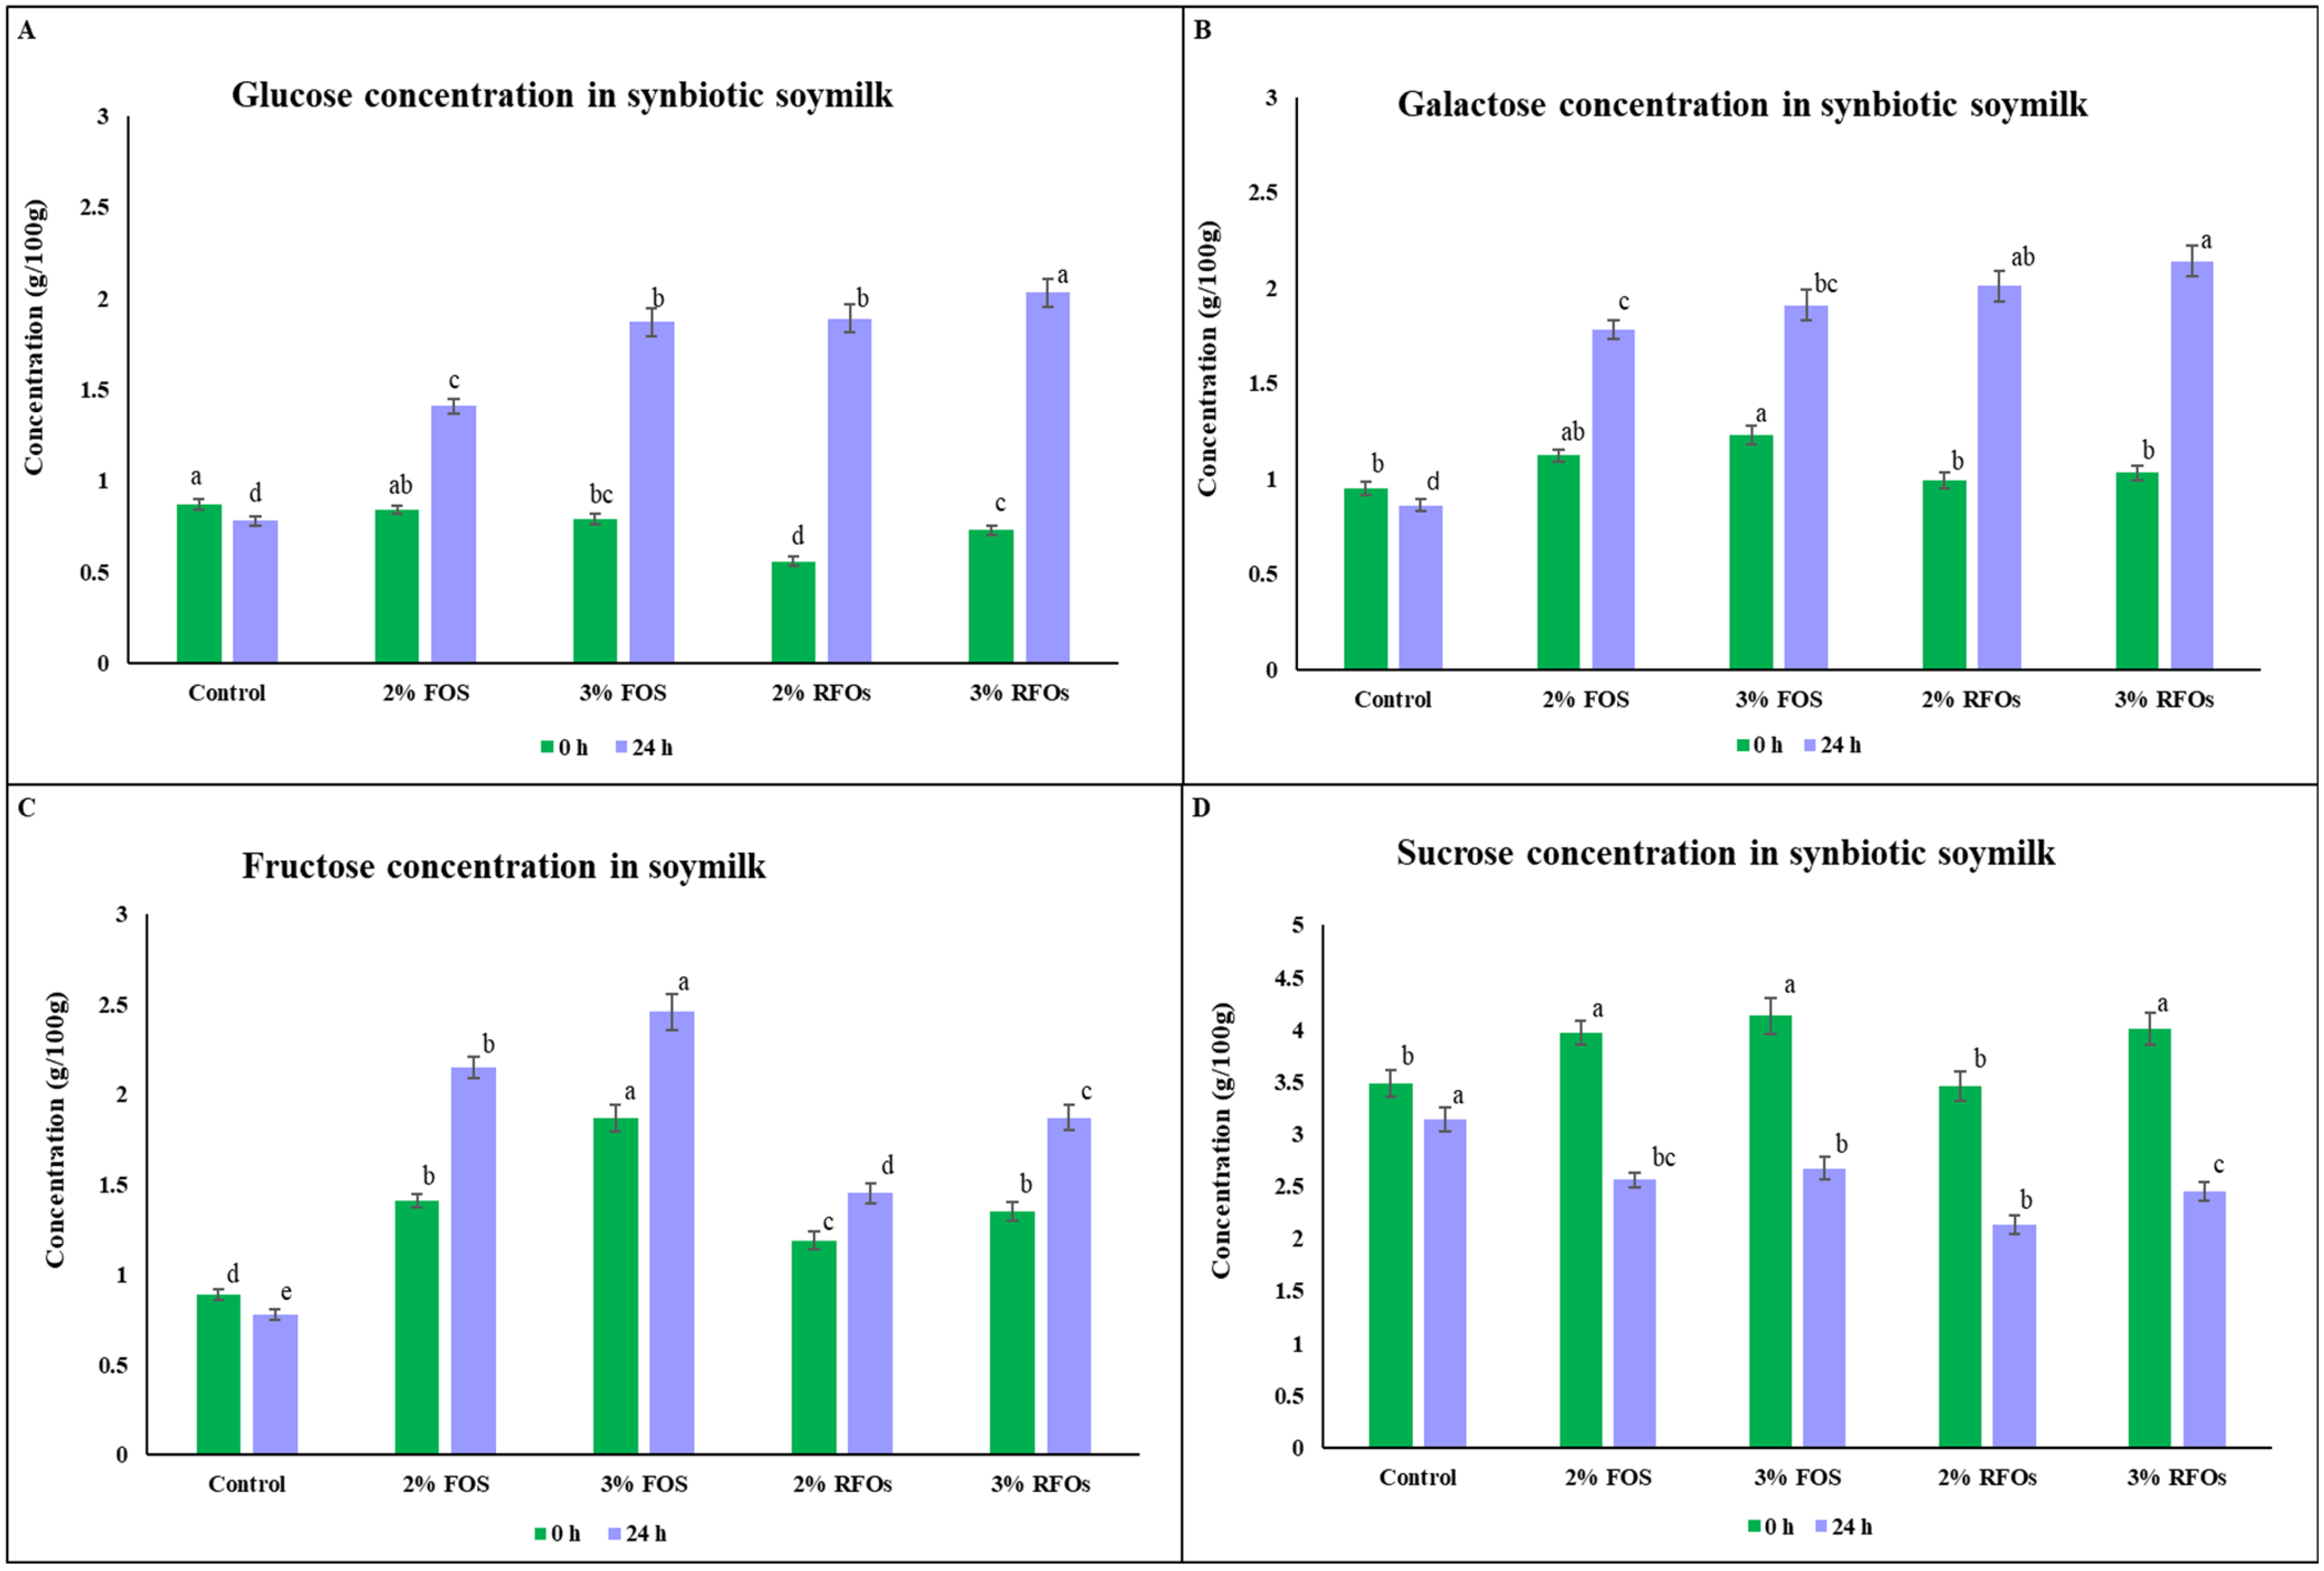
3.3. Effect of Supplementation and Fermentation on Monosaccharides and Sucrose Concentrations

The intake of selected prebiotic oligosaccharides FOS and RFOs improved the concentrations of monosaccharides in the co-culture fermented soymilk. The glucose concentration of unfermented (control) soymilk supplemented with 2% FOS, 3% FOS, 2% RFOs, and 3% RFOs at 0 h comprised 0.84 ± 0.07, 0.79 ± 0.09, 0.56 ± 0.05 and 0.73 ± 0.03 g/100 g, respectively, while the concentration of galactose comprised 1.12 ± 0.01, 1.23 ± 0.01, 0.99 ± 0.04, 1.03 ± 0.05 g/100 g, respectively. After 24 h of fermentation, raffinose and stachyose were considerably metabolised by the probiotic bacteria to produce monosaccharides such as glucose, galactose, and fructose, and, therefore, an increment was found in the concentration of these compounds. The concentration of glucose in soymilk supplemented with 2% FOS, 3% FOS, 2% RFOs, and 3% RFOs after 24 h of fermentation was observed to be increased by 1.67-fold, 2.36-fold, 3.3-fold and 2.78-fold (Figure 3A), and that of galactose was 1.58-fold increase, 1.55-fold, 2.03-fold, and 2.07-fold (Figure 3B). Fructose content was found to increase gradually up to a maximum of 2.76-fold increase in 3% FOS supplemented soymilk after 24 h of fermentation (Figure 3C). Also, the initial sucrose content (at 0 h of fermentation) was higher in all samples of synbiotic soymilk ranging from 3.46 ± 0.03 (2% RFOs)-4.13 ± 0.04 g/100 g in unfermented control to 3% FOS supplemented soymilk. After 24 h of fermentation, the sucrose content showed 1.54-fold decrease in 3% FOS and 1.62-fold decrease in 2% RFOs in synbiotic soymilk, respectively (Figure 3D).

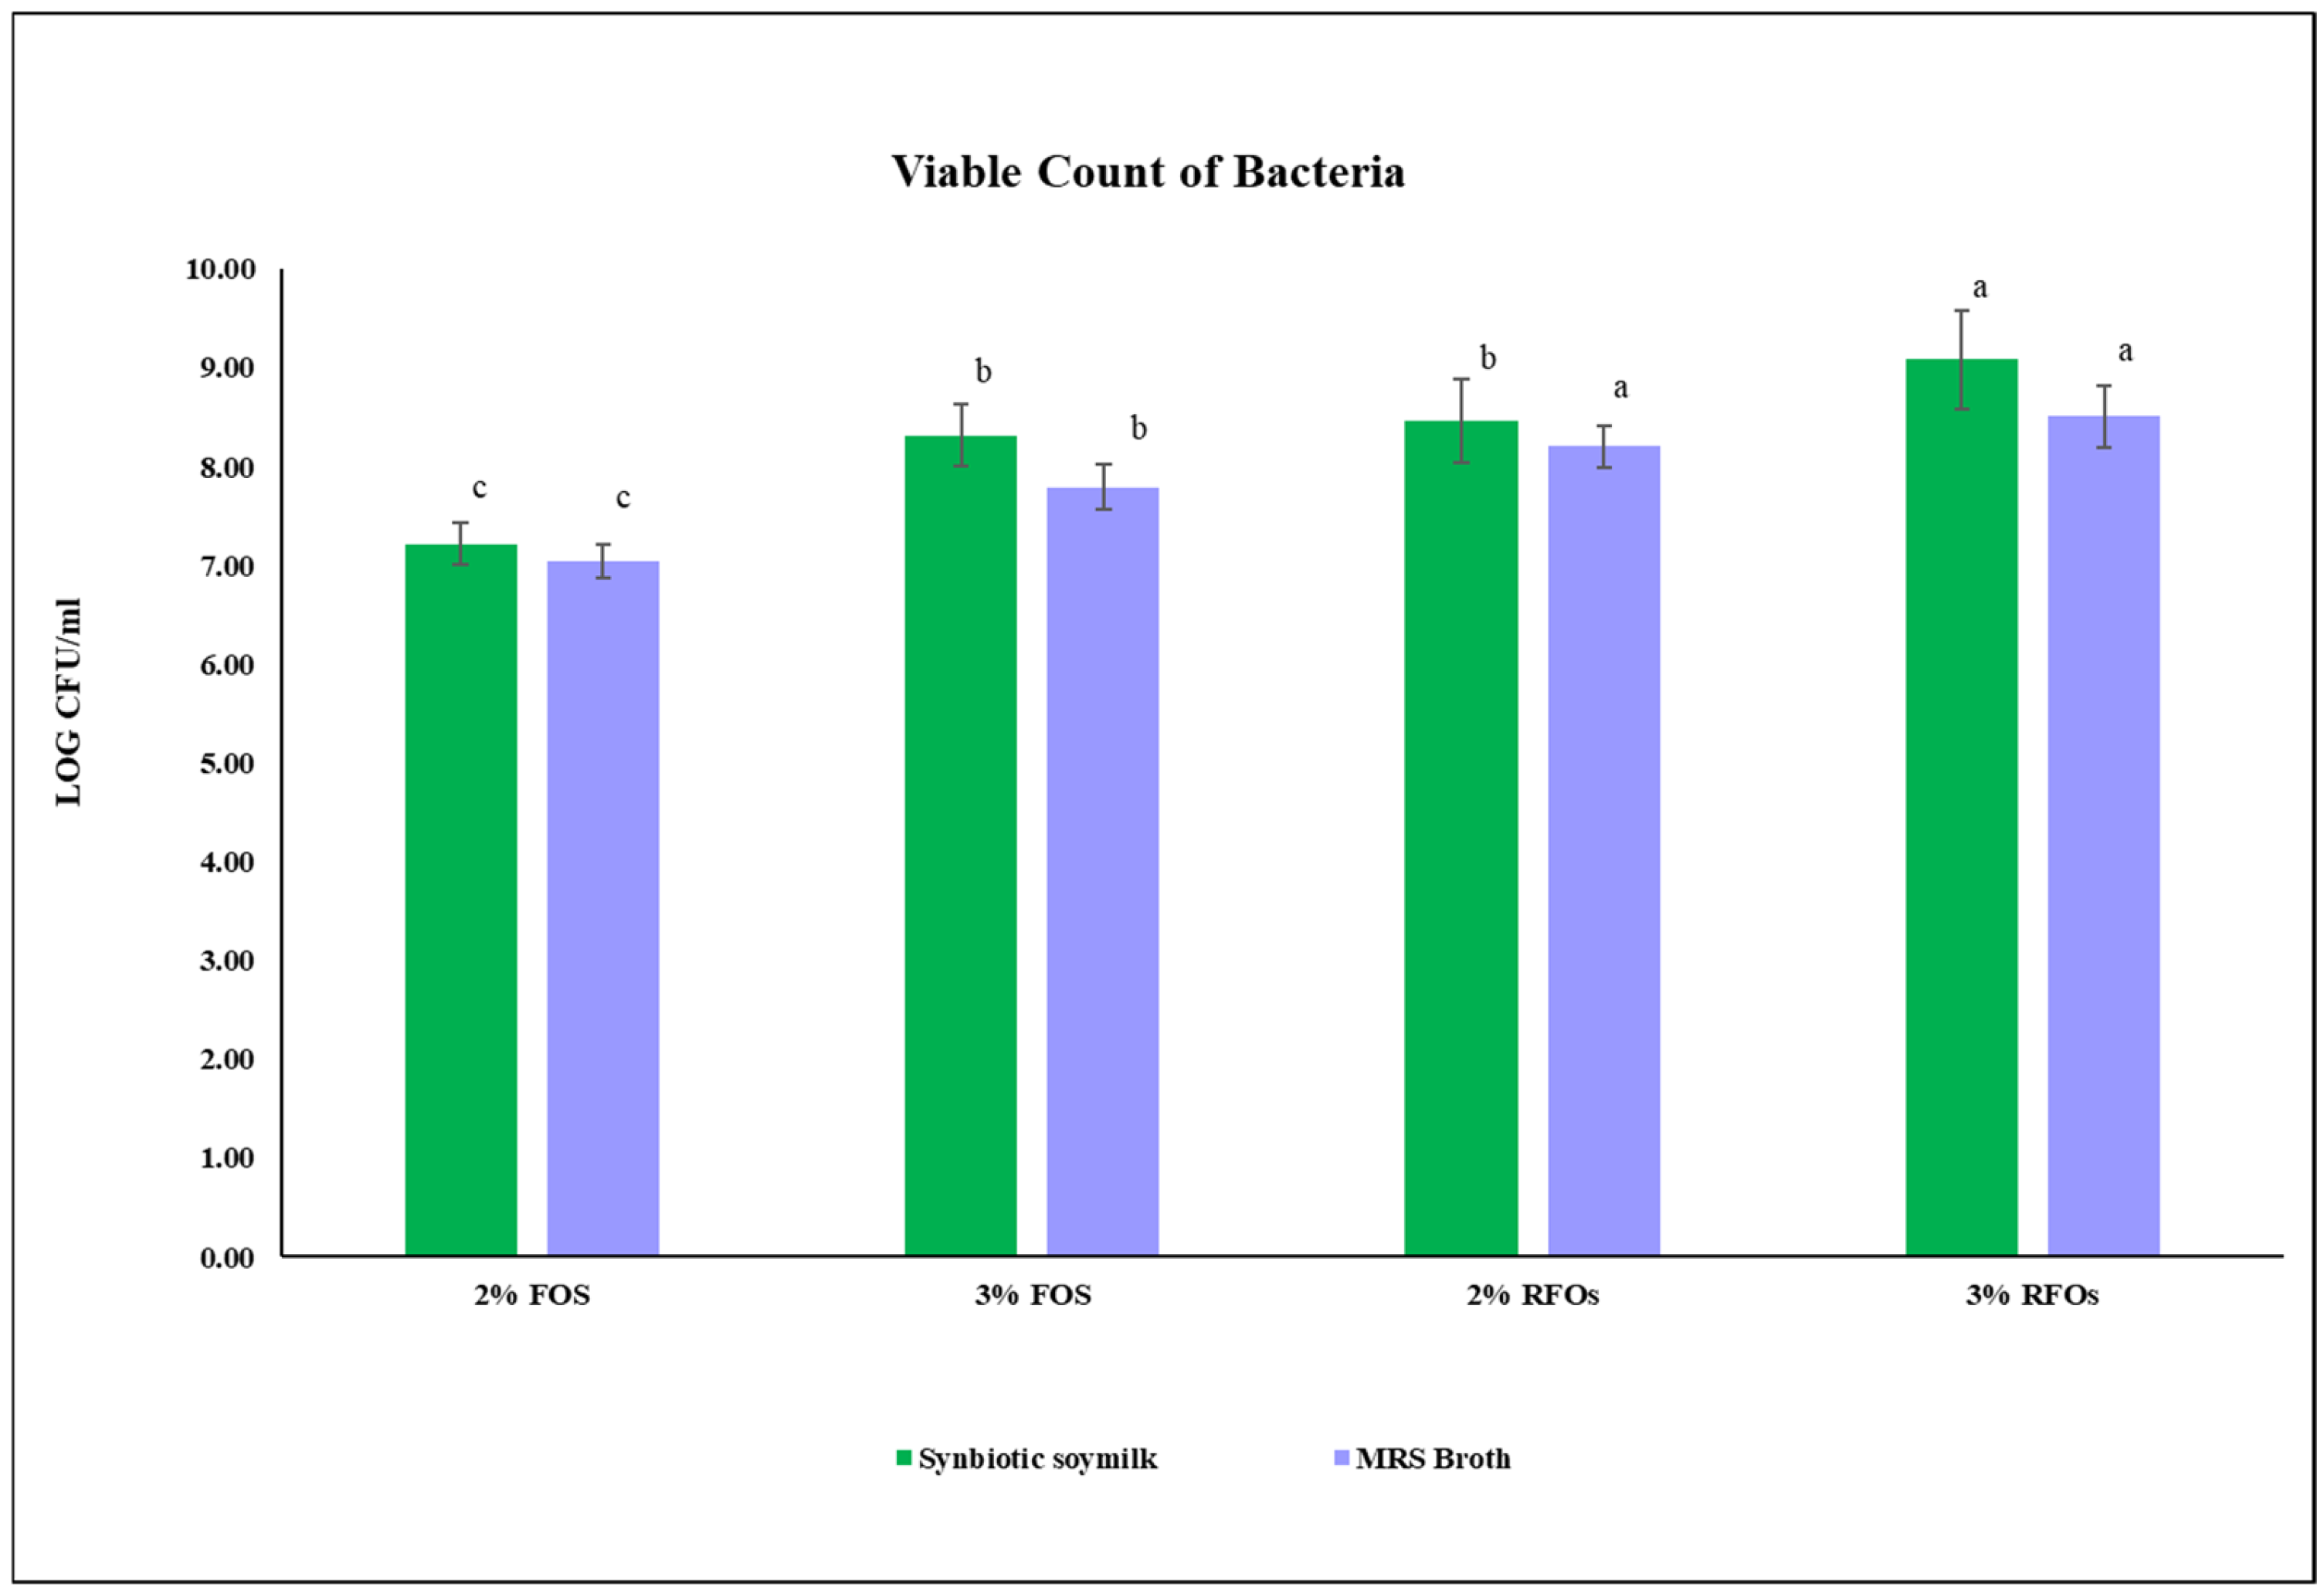
3.4. Measurement of Viable Count of Bacteria in Synbiotic Soymilk

This study observed the highest viable count of 1.21 × 10⁹ CFU/mL in the synbiotic soymilk, with 3% RFOs added as a prebiotic source (Figure 4 and Figure S1). Meanwhile, MRS broth with 3% RFOs was replaced against glucose as the nutrient source showed lesser viability up to 3.21 × 10⁸ CFU/mL. A viable count of 2.92 × 10⁸ CFU/mL was observed in the synbiotic soymilk, with 2% RFOs added as a prebiotic source after 24 h of fermentation. At the same time, MRS broth with 2% RFOs was replaced against glucose as the nutrient source showed lesser viability of 1.61 × 10⁸ CFU/mL. In synbiotic soymilk with 3% FOS added as a prebiotic, a viable count of 2.08 × 10⁸ CFU/mL was observed after 24 h of fermentation, while MRS broth with 3% FOS instead of glucose showed a lesser viable count of 6.2 × 10⁷ CFU/mL. It indicates that soymilk supplemented with prebiotic oligosaccharides is efficient in enhancing probiotic bacteria’s viability compared to control MRS media and normal soymilk.

3.5. Growth Curve Analysis

Comparative analysis between the growth of pure and co-culture bacteria cultures in MRS broth with RFOs and FOSs indicates that co-cultures showed a faster fermentation rate than pure cultures (Figures S2 and S3). Pure cultures of L. rhamnosus JCM1136 with RFOs and FOSs showed doubling time values between 55 and 125 min, while the pure cultures of W. confusa 30082b with the prebiotics showed a doubling time between 52 and 87 min. L. rhamnosus JCM1136 and W. confusa 30082b co-cultures showed doubling time values between 39 and 63 min and 87–39 min, respectively (Table S1). The lowest doubling time was for co-cultures supplemented with 2% RFOs (39.3 min), followed by co-cultures with 3% RFOs (41.4 min).

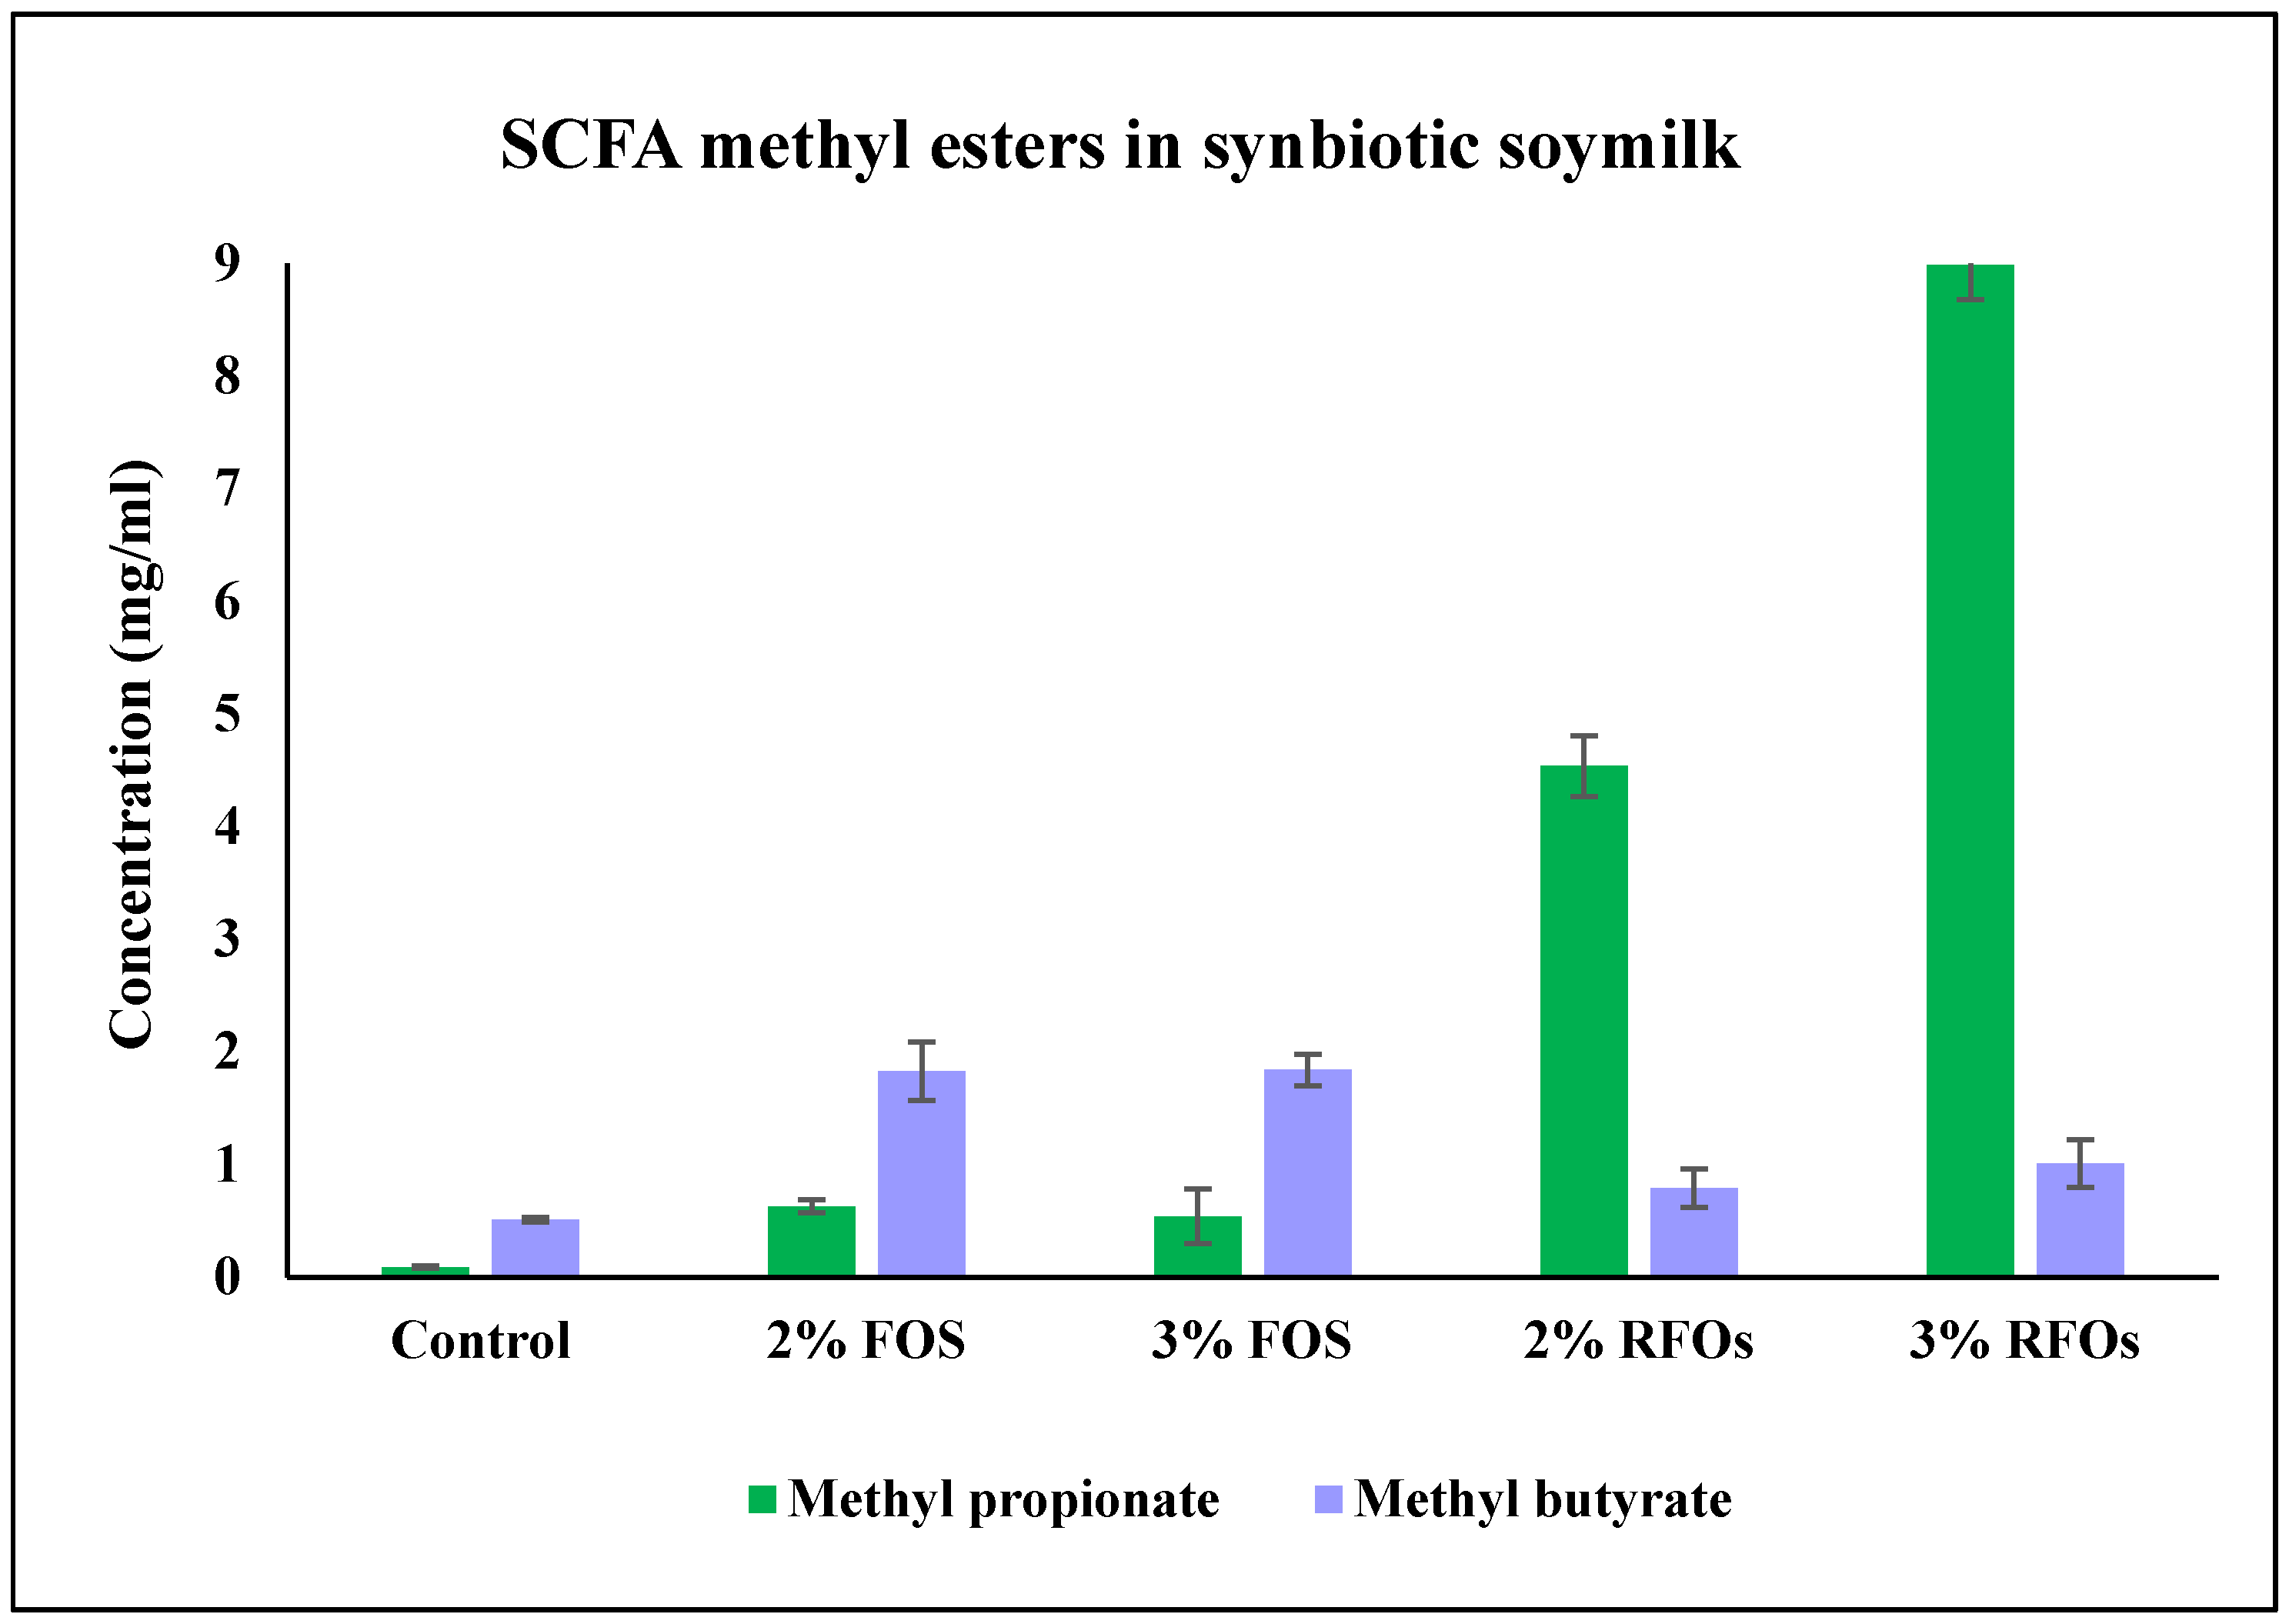
3.6. Change in SCFA Methyl Esters

The current study identified and estimated methyl esters of SCFAs, like methyl propionate (MeP) and methyl butyrate (MeB), in the samples after 24 h of fermentation. In the unfermented control soymilk, the MeP detected was only 0.09 ± 0.01 mg/mL, and MeB was 0.51 ± 0.02 mg/mL at 24 h of fermentation. The soymilk supplemented with 2% FOS and 3% FOS showed a higher production of MeB up to 3.59-fold and 3.60-fold increase, respectively, whereas relatively low concentrations of MeP were detected in 2% FOS (with 7-fold increase) and 3% FOS (6-fold increase) prebiotic oligosaccharides. Meanwhile, soymilk supplemented with 2% RFOs and 3% RFOs showed a higher production of MeP up to 50.4-fold and 99.8-fold increase, respectively, and low concentrations of MeB were also produced from 2% RFO (1.54-fold) and 3% RFO (1.98-fold) prebiotic oligosaccharides (Figure 5 and Figure S4, Tables S4–S6).

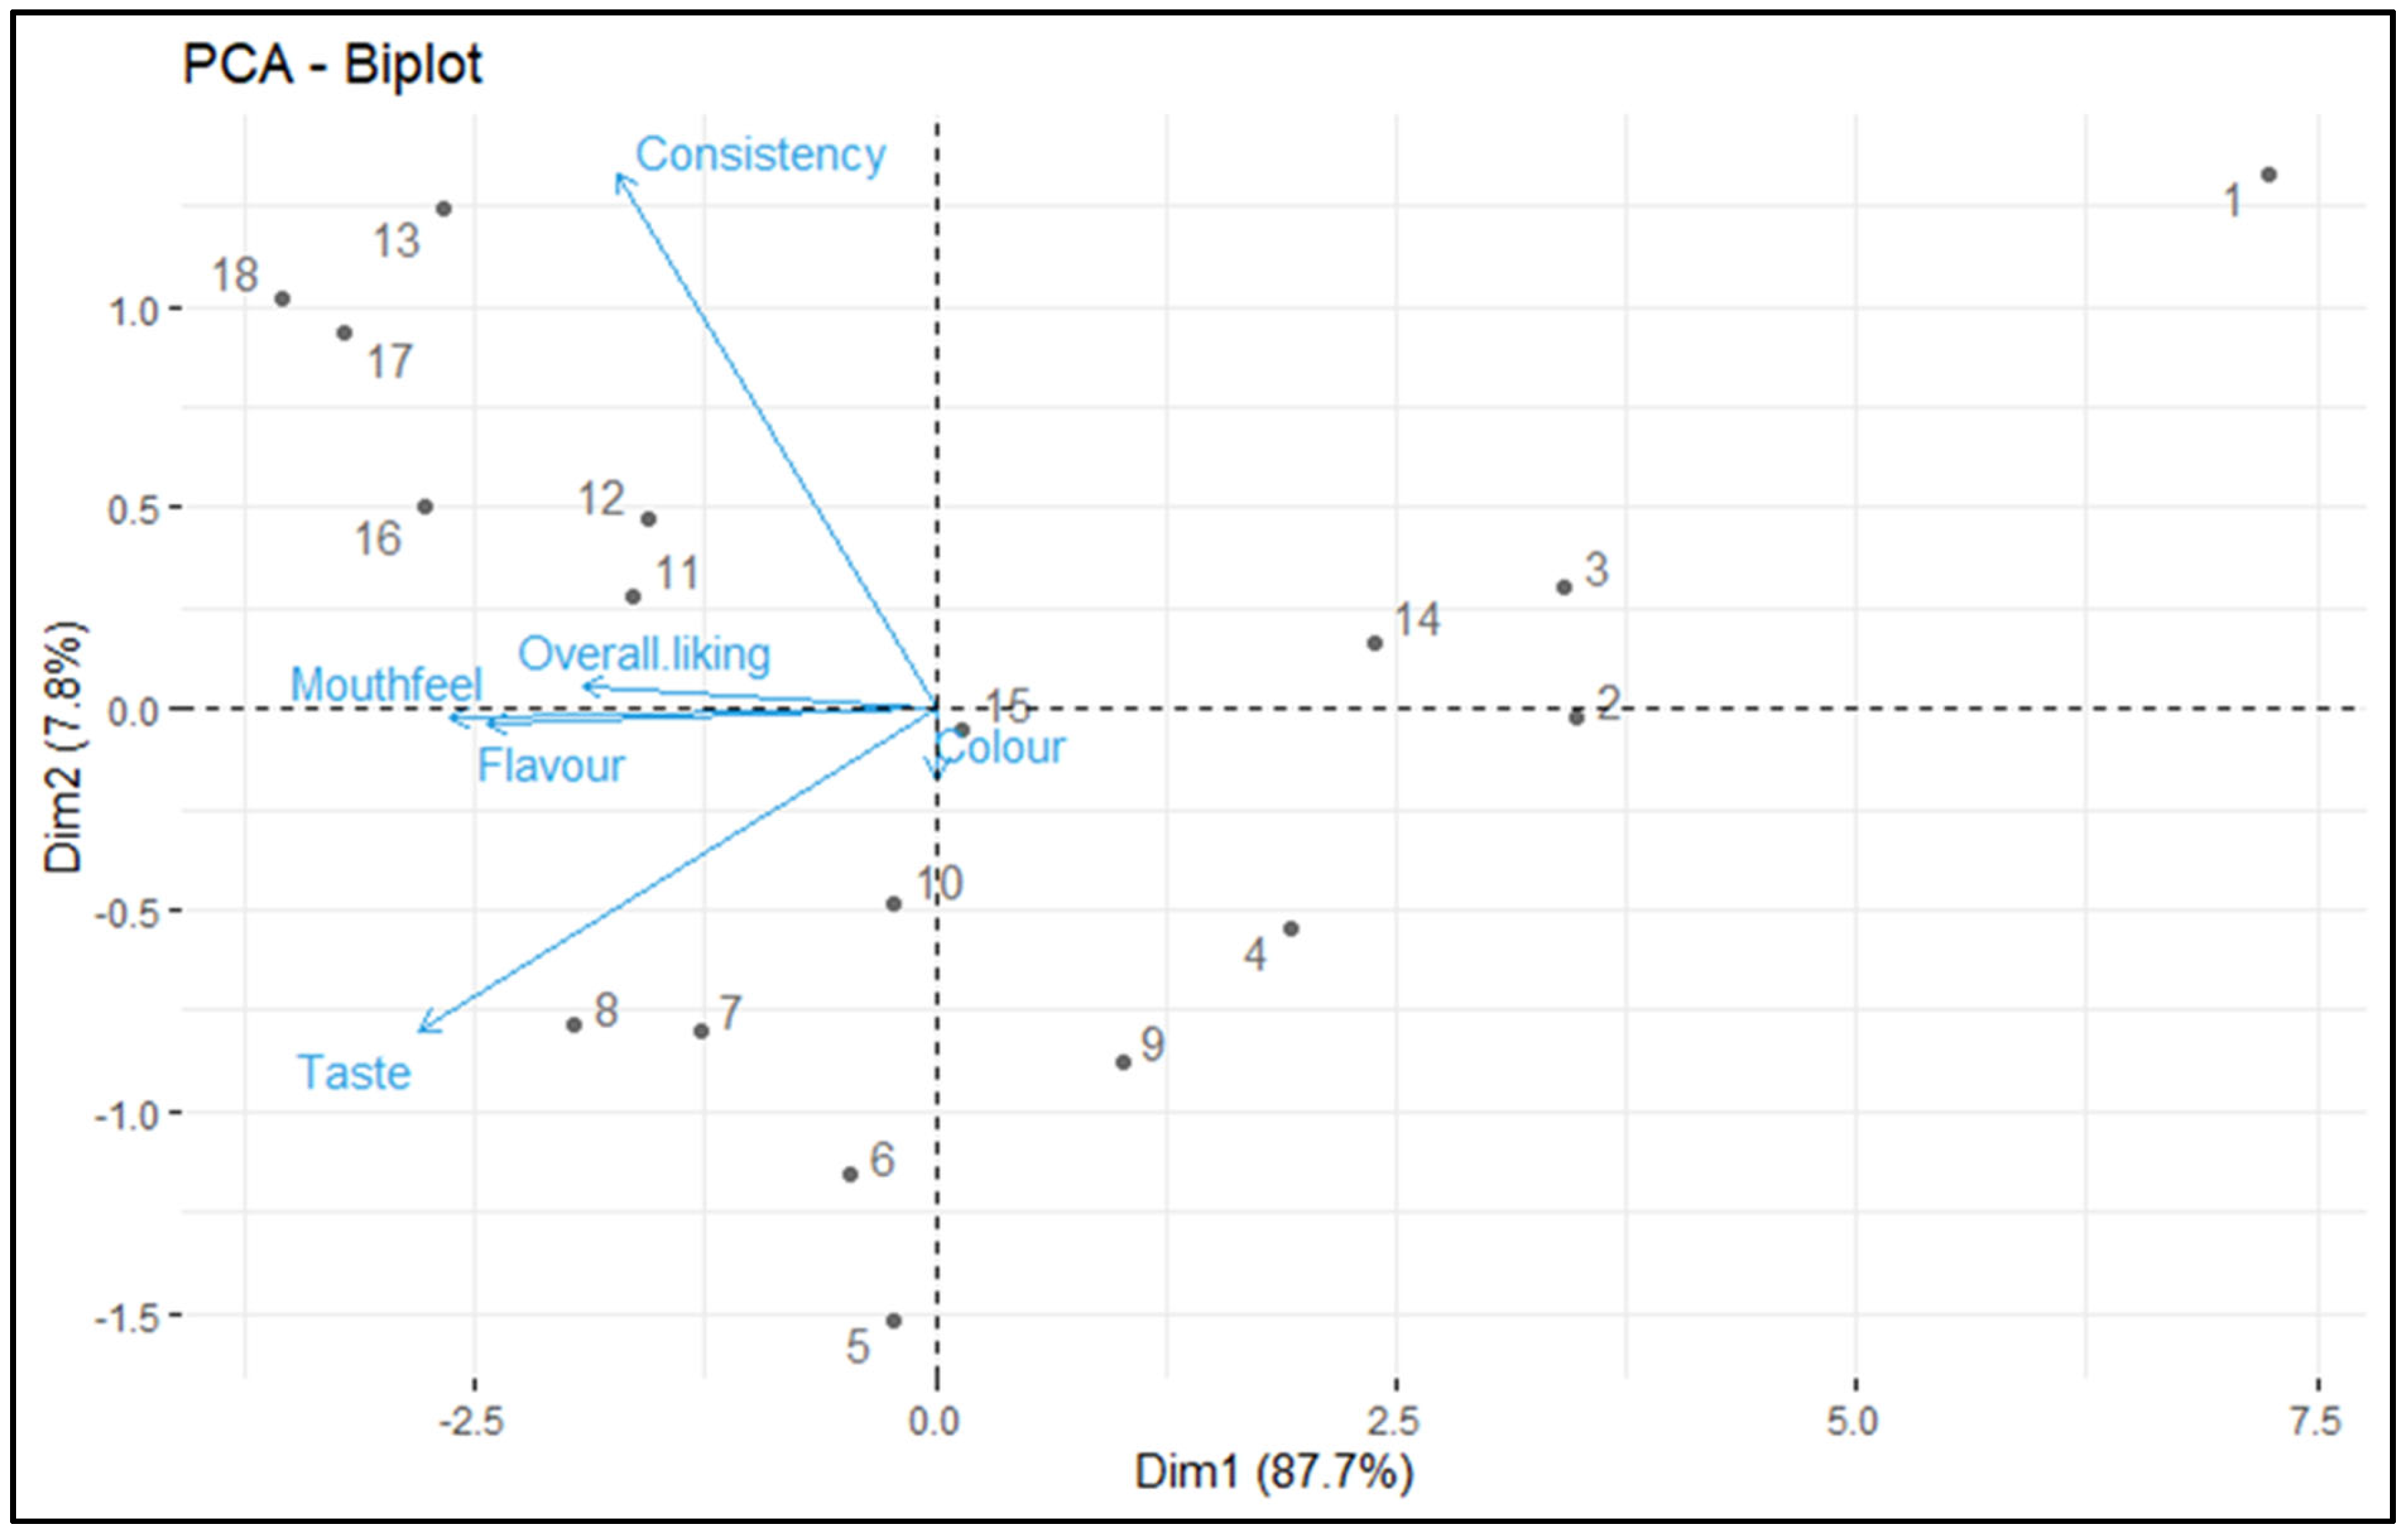
3.7. Sensory Analysis

The mean rates of overall liking based on the sensory attributes obtained for unfermented soymilk (control) and synbiotic soymilk studied are shown in Table 1 and Table S7. All products generally showed mean overall liking rates ranging between 3.9 ± 0.06 (dislike moderately) and 7.87 ± 0.52 (like very much). The overall liking for unfermented soymilk (control) was observed to be 3.9 ± 0.06 (dislike moderately), while the unfermented soymilk, when supplemented with 2% table sugar and 1% vanillin, the overall liking was enhanced to 5.23 ± 0.24 and 5.28 ± 0.27 (neither like nor dislike). Additionally, there was a significant increase in the overall liking when adding 1% vanillin and 2% table sugar to the synbiotic soy milk. Soymilk fermented with 3% RFOs + 2% table sugar + 1% vanillin (7.53 ± 0.42) were liked more as compared to fermented with 3% FOS + 2% table sugar + 1% vanillin (7.24 ± 0.27). Fermented soymilk having 2% RFOs + 2% FOS + 1% vanillin had comparable overall liking (7.72 ± 0.42) to the one supplemented with 2% RFOs + 2% FOS + 2% table sugar + 1% vanillin (7.87 ± 0.52). In the PCA, two principal components, PC1 and PC2, were able to explain 96.5% of the data (Figure 6). It could be easily seen that the colour of the soymilk did not have a direct relationship, but the addition of oligosaccharides was a key contributor towards sensory attributes by imparting sweetness.

4. Discussion

The lower pH of fermented soy foods assures food safety because the lactic acid disturbs the homeostasis of pathogenic and spoilage-causing bacteria (Clostridia, Salmonellae), thereby limiting growth [7]. During the fermentation of soymilk, due to the production of lactic, acetic acids and other metabolites, the pH tends to reduce to 4.0–5.0 [22]. In our study, the fastest decrease in pH was found in synbiotic soymilk fermented with 3% RFOs, followed by 3% FOS-added soymilk. Similar to our finding, yoghurt fermented with co-cultures of L. bulgaricus and Streptococcus thermophilus subsp. Thermophiles supplemented with soy–raffinose 2% (w/v) was observed to have the least pH, followed by the one with 1% (w/v) soy–raffinose [17]. It indicates that the probiotic strains could utilise a higher concentration of RFOs as a nutrient source; hence, there was a more significant reduction in pH. Also, the trend of faster decrease in pH up to 18 h of fermentation in soymilk fermented with Lactiplantibacillus plantarum X7021 and their gradual increase during storage is demonstrated earlier [23], which is in agreement with the pattern of pH change observed in the current study.
This study found the highest increase in TA in synbiotic soymilk fermented with 3% RFOs, followed by 3% FOS-added soymilk. In a similar study, yoghurt fermented with co-cultures of L. bulgaricus and S. thermophilus supplemented with soy–raffinose 2%(w/v) was observed to have the highest TA followed by the one with 1%(w/v) soy–raffinose and unfermented control [17]. Moreover, the heterofermentative metabolism of Weissella promoted a higher increase in TA compared to the homofermentative L. rhamnosus JCM1136.
The growth of probiotics may be associated with the substrates and activities of the enzymes correlated with carbohydrate catabolism [24]. The stimulatory effect of prebiotics such as inulin and FOS on the viability of probiotics like W. confusa CD1 and L. rhamnosus GG in soymilk was observed in a study [25]. This study observed an increase in the viable count for W. confusa CD1 and L. rhamnosus GG when the concentration of inulin and FOSs was increased. An FOS concentration (0.15 mM) that is 10 times lower than long fructan inulin (15 mM) could enhance the viable bacteria count at comparable levels, suggesting that FOS is a better prebiotic than inulin. The addition of prebiotics–RFOs and FOS induces the intracellular α-galactosidase and β-fructofuranosidase enzymes, thus aiding in enhancing the viability of probiotics by providing additional carbon sources as monosaccharides, which is advantageous for bacterial growth [26].
The major fermentation products of prebiotic metabolism in the large intestine are SCFAs, namely, propionate and butyrate, which have different effects on colon morphology and function, such as the supply of energy to the intestinal mucosa, lowering of the pH, and stimulation of sodium and water absorption [27]. The type, structure, and amount of carbohydrate source play a predominant role in forming SCFAs during fermentation. In our research, RFOs and FOS stimulated SCFA production with FOS supplementation, leading to the significant production of butyrate, and RFOs were fermented more towards propionate. Zhou et al. (2014) [28] also observed that mini-pigs fed a diet supplemented with soybean oligosaccharides augmented the synthesis of propionic and butyric acid in comparison with corn starch, indicating the stimulatory effect of oligosaccharides on the growth of beneficial bacteria in the gut.
The sensory appeal of soymilk is low because of its unacceptable beany flavour and mouth feel due to the unsaturated fatty acids and lipoxygenases that give rise to volatile compounds such as hexanal [21]. Fermentation increases the flavour score and taste compared to unfermented soymilk. Adding vanillin, an aromatic flavouring agent, can mask the beany flavour of soy beverages [29], and adding known concentrations of table sugar can enhance the sweetness and mouth feel of the product. In the sensory analysis performed in the present study, the fermented soymilk with both RFOs and FOS, along with table sugar and vanillin, had a maximum overall liking, and the one with oligosaccharides and vanillin without sugar was a close second. In a similar analysis, a minimum concentration of 2% FOS/inulin was incorporated into soy yoghurt fermented with Streptococcus salivarius subsp. Thermophiles and L. acidophilus to study the impact of these oligosaccharides on the texture and sensory attributes of the synbiotic product [30]. The sensory scores of synbiotic soy yoghurt for appearance, texture, taste and mouth feel indicate that the overall acceptability was the maximum for synbiotic soy yoghurt with 2% FOS as compared to 2% inulin, which aligns with our research finding. FOSs are more soluble than long-fructans like inulin and also 36% sweeter than table sugar, owing to its shorter chain length. Therefore, FOSs in fermented soymilk can augment its sensory attributes by imparting sweetness [31]. Incorporating 2% soy–RFOs in yoghurt was identified to enhance firmness as compared to inulin, thereby enhancing the chewiness and acceptability of soy–RFO yoghurt [17].

5. Conclusions

The rationale for our study was to implement a detailed comparison between the prebiotic effect of FOS and RFOs on the viable count of bacteria, the utilisation of prebiotic oligosaccharides resulting from the synergistic interaction between probiotics and prebiotics, the production of microbial metabolites like SCFAs, and the sensory attributes of synbiotic soymilk. Soymilk supplemented with RFOs displayed higher growth performance in MRS broth and synbiotic soymilk in a concentration-dependent manner. The present study demonstrated that the probiotic strains utilise these monosaccharides mentioned above to synthesise SCFAs in co-culture fermented soymilk. At the same time, the metabolic flux of FOS degradation was more towards propionate synthesis, along with a minimal concentration of butyrate. Furthermore, the pH of the fermented soymilk was reduced due to the production of SCFAs, and the presence of lactate is helpful to prevent pathogen growth. Besides improving the nutritional value, the fermentation of FOSs and RFOs could banish the unpleasant beany flavour and ameliorate consumer acceptability when fortified with vanillin, an aromatic flavouring agent. From the current study, it can be concluded that FOS and RFO supplementation is a felicitous strategy in enhancing the nutritional and sensory quality of soymilk fermented with the co-cultures of two different species, i.e., L. rhamnosus JCM1136 and W. confusa 30082b. Our final product, synbiotic soymilk differs from native plant-based foods in which the former is endowed with microbial hydrolytic enzymes such as α-galactosidase, β-fructosidase, and proteases, bestowing an improved nutritional profile and nutraceutical and sensory value to it (Figure 7). The matrix combinations of synbiotics, doses, and variation in the prebiotic effect with structures comprising human colon model studies have yet to be thoroughly corroborated. In the future, to cope with the pitfalls of synbiotic products and enhance their functionality, a better understanding of the probiosis and prebiosis mechanisms and advanced cultivation technologies could be defined/studied in detail.

Supplementary Materials

The following supporting information can be downloaded at https://www.mdpi.com/article/10.3390/fermentation11040194/s1, Figure S1: (A) Growth of 1% (v/v) mixed cultures of L. rhamnosus JCM1136 and W. confusa 30082 in synbiotic soymilk supplemented with 2% FOS (w/v) (Row A1) and in MRS broth supplemented with 2% FOS (w/v) (Row A2) (B) Growth of 1% (v/v) mixed cultures of L. rhamnosus JCM1136 and W. confusa 30082 in synbiotic soymilk supplemented with 3% FOS (w/v) (Row B1) and in MRS broth supplemented with 3% FOS (w/v) (Row B2) (C) Growth of 1% (v/v) mixed cultures of L. rhamnosus JCM1136 and W. confusa 30082 in synbiotic soymilk supplemented with 2% RFOs (w/v) (Row C1) and in MRS broth supplemented with 2% RFOs (w/v) (Row C2) (D) Growth of 1% (v/v) mixed cultures of L. rhamnosus JCM1136 and W. confusa 30082 in synbiotic soymilk supplemented with 3% RFOs (w/v) (Row D1) and in MRS broth supplemented with 3% RFOs (w/v) (Row D2); Figure S2: Standardization of inoculum (A) Kinetics of growth of pure cultures of 1, 2 and 5% (v/v) Lactobacillus rhamnosus JCM1136 in MRS broth supplemented with 2% glucose (B) Kinetics of growth of pure cultures of 1, 2 and 5% (v/v) Weissella confusa 30082b supplemented with 2% glucose; Figure S3: (A) Kinetics of growth of pure and mixed cultures of 1% (v/v) Lactobacillus rhamnosus JCM1136 and Weissella confusa 30082b in MRS broth supplemented with 2% FOS up to 48 h (B) Kinetics of growth of pure and mixed cultures of 1% (v/v) Lactobacillus rhamnosus JCM1136 and Weissella confusa 30082b in MRS broth supplemented with 3% FOS up to 48 h. (C) Kinetics of growth curve of pure and mixed cultures of 1% (v/v) Lactobacillus rhamnosus JCM1136 and Weissella confusa 30082b in MRS broth supplemented with 2% RFOs up to 48 h. (D) Kinetics of growth curve of pure and mixed cultures of 1% (v/v) Lactobacillus rhamnosus JCM1136 and Weissella confusa 30082b in MRS broth supplemented with 3% RFOs up to 48 h; Figure S4: (A) GC chromatogram of SCFA-Methyl propionate standard peak (Retention time-4.9 min) (B) GC chromatogram of SCFA-Methyl butyrate standard peak (Retention time-5.6 min) (C) GC-Chromatogram of SCFA (methyl butyrate: R.T-5.6 min; methyl propionate: R.T-4.9 min) in unfermented soymilk (control) (D) GC-Chromatograms of SCFA in synbiotic soymilk fermented with mixed cultures of 1% (v/v) Lactobacillus rhamnosus JCM1136 and Weissella confusa 30082b supplemented with 2% FOS after 24 h of fermentation (E) GC-Chromatograms of SCFA in synbiotic soymilk supplemented with 3% FOS after 24 h of fermentation (F) GC-Chromatograms of SCFA in synbiotic soymilk supplemented with 2% RFOs after 24 h of fermentation (G) GC-Chromatograms of SCFA in synbiotic soymilk supplemented with 3% RFOs after 24 h of fermentation; Table S1: Doubling time and specific growth rates of 1% (v/v) pure and mixed cultures of L. rhamnosus JCM1136 and W. confusa 30082 in MRS broth supplemented with 2, 3% FOS and 2.3% RFOs (w/v); Table S2: ANOVA Results for Synbiotic Soymilk, MRS Broth, and pH and TA-Synbiotic soymilk at Different Time Points; Table S3: DMRT Multiple Comparisons of means, SE(m), and CV for Synbiotic Soymilk Viability, and pH, TA-Synbiotic soymilk; Table S4: ANOVA Results for FOS, RFOs, and SCFA Concentrations at 0 h and 24 h; Table S5: Mean, Standard Deviation, CV, and DMRT Comparisons at α = 0.05 for FOS, RFOs, and SCFA Concentrations; Table S6: ANOVA Results for Sensory Attributes: Color, Mouthfeel, Consistency, Taste, Flavor, and Overall Liking; Table S7: DMRT Multiple Comparisons of means at α = 0.05, SE(m), and CV for Sensory Attributes.

Author Contributions

M.S. and A.D.: conceptualisation; performed research; writing; S.K. and O.P.: methodology, writing; V.K. and V.: statistical analysis; G.S.T. and A.S.R.: methodology; J.M. and P.K.: review and editing, V.S.R.: methodology. All authors have read and agreed to the published version of the manuscript.

Funding

This work was funded by the ICAR-IARI institutional fund.

Institutional Review Board Statement

Not applicable.

Informed Consent Statement

Not applicable.

Data Availability Statement

Data available in a publicly accessible repository.

Acknowledgments

The authors acknowledge the support and facilities from the ICAR-IARI, NCMR-NCCS and ICAR-NAHEP-CAAST.

Conflicts of Interest

The authors declare no conflicts of interest.

Abbreviations

LABLactic acid bacteria
FOSFructooligosaccharide
RFOsRaffinose family oligosaccharides
SCFAsShort-chain fatty acids
ANFAnti-nutritional factor
TAOTotal antioxidant activity
CFUColony-forming unit
MRSDe Man, Rogosa and Sharpe medium
TATitratable acidity
GSOGalactosyl-sucrose oligosaccharide
GOPODGlucose oxidase/peroxidase
FIDFlame ionisation detector
MePMethyl propionate
MeBMethyl butyrate
PCAPrincipal component analysis
TBA2-thiobarbituric acid
DMRTDuncan multiple range test

References

  1. Das, S.; Das, M.K.; Kesharwani, R.K. Recent Advances of Nutraceutical and Functional Foods in Immune Health. In Nutraceuticals and Functional Foods in Immunomodulators, 1st ed.; Springer: Singapore, 2022; pp. 313–330. [Google Scholar] [CrossRef]
  2. Hassan, M.; Tripathi, K.; Harun, M.; Krishnan, V.; Kaushik, R.; Chawla, G.; Shakil, N.A.; Kumar, M. Unravelling the effect of extraction on anthocyanin functionality and prebiotic potential. Heliyon 2024, 10, e31780. [Google Scholar] [CrossRef]
  3. Liu, L.; Huang, Y.; Zhang, X.; Zeng, J.; Zou, J.; Zhang, L.; Gong, P. Texture analysis and physicochemical characteristics of fermented soymilk gel by different lactic acid bacteria. Food Hydrocoll. 2023, 136, 108252. [Google Scholar] [CrossRef]
  4. Madjirebaye, P.; Peng, Z.; Mueed, A.; Huang, T.; Peng, F.; Allasra, Y.; Benar, M.E.; Hu, Z.; Xie, M.; Xiong, T. Promising probiotic-fermented soymilk for alleviating acute diarrhea: Insights into the microbiome and metabolomics. Food Funct. 2024, 15, 4462–4474. [Google Scholar] [CrossRef] [PubMed]
  5. de Moraes Filho, M.L.; Busanello, M.; Prudencio, S.H.; Garcia, S. Soymilk with okara flour fermented by Lactobacillus acidophilus: Simplex-centroid mixture design applied in the elaboration of probiotic creamy sauce and storage stability. LWT 2018, 93, 339–345. [Google Scholar] [CrossRef]
  6. Swanson, K.S.; Gibson, G.R.; Hutkins, R.; Reimer, R.A.; Reid, G.; Verbeke, K.; Scott, K.P.; Holscher, H.D.; Azad, M.B.; Delzenne, N.M.; et al. The International Scientific Association for Probiotics and Prebiotics (ISAPP) consensus statement on the definition and scope of synbiotics. Nat. Rev. Gastroenterol. Hepatol. 2020, 17, 687–701. [Google Scholar] [CrossRef]
  7. Sasi, M.; Kumar, S.; Hasan, M.; Garcia-Gutierrez, E.; Kumari, S.; Prakash, O.; Nain, L.; Sachdev, A.; Dahuja, A. Current trends in the development of soy-based foods containing probiotics and paving the path for soy-synbiotics. Crit. Rev. Food Sci. Nutr. 2022, 63, 9995–10013. [Google Scholar] [CrossRef]
  8. Ghorbani, Z.; Kazemi, A.; UPBartolomaeus, T.; Martami, F.; Noormohammadi, M.; Salari, A.; Löber, U.; Balou, H.A.; KForslund, S.; Mahdavi-Roshan, M. The effect of probiotic and synbiotic supplementation on lipid parameters among patients with cardiometabolic risk factors: A systematic review and meta-analysis of clinical trials. Cardiovasc. Res. 2023, 119, 933–956. [Google Scholar] [CrossRef]
  9. Lan, T.; Lv, X.; Zhao, Q.; Lei, Y.; Gao, C.; Yuan, Q.; Sun, X.; Liu, X.; Ma, T. Optimization of strains for fermentation of kiwifruit juice and effects of mono- and mixed culture fermentation on its sensory and aroma profiles. Food Chem. X 2023, 17, 100595. [Google Scholar] [CrossRef]
  10. Elmassry, M.M.; Zayed, A.; Farag, M.A. Gut homeostasis and microbiota under attack: Impact of the different types of food contaminants on gut health. Crit. Rev. Food Sci. Nutr. 2022, 62, 738–763. [Google Scholar] [CrossRef]
  11. Jeong, S.; Kwon, A.; Jeong, H.; Park, Y.S. Synergistic Immunostimulatory Activities of Probiotic Strains, Leuconostoc lactis and Weissella cibaria, and the Prebiotic Oligosaccharides They Produce. Microorganisms 2023, 11, 1354. [Google Scholar] [CrossRef]
  12. Babot, J.D.; Argañaraz-Martínez, E.; Apella, M.C.; Perez Chaia, A. Microencapsulation of Probiotics with Soy Protein Isolate and Alginate for the Poultry Industry. Food Bioprocess. Technol. 2023, 16, 1478–1487. [Google Scholar] [CrossRef] [PubMed]
  13. Elango, D.; Rajendran, K.; Van der Laan, L.; Sebastiar, S.; Raigne, J.; Thaiparambil, N.A.; El Haddad, N.; Raja, B.; Wang, W.; Ferela, A.; et al. Raffinose family oligosaccharides: Friend or foe for human and plant health? Front. Plant Sci. 2022, 13, 829118. [Google Scholar] [CrossRef] [PubMed]
  14. Zhang, S.; Wang, H.; Zhu, M.J. A sensitive GC/MS detection method for analyzing microbial metabolites short chain fatty acids in fecal and serum samples. Talanta 2019, 196, 249–254. [Google Scholar] [CrossRef] [PubMed]
  15. Gu, Y.; Chen, H.; Li, X.; Li, D.; Sun, Y.; Yang, L.; Ma, Y.; Chan, E.C.Y. Lactobacillus paracasei IMC 502 ameliorates type 2 diabetes by mediating gut microbiota-SCFA-hormone/inflammation pathway in mice. J. Sci. Food Agric. 2023, 103, 2949–2959. [Google Scholar] [CrossRef]
  16. Cai, J.S.; Feng, J.Y.; Ni, Z.J.; Ma, R.H.; Thakur, K.; Wang, S.; Hu, F.; Zhang, J.G.; Wei, Z.J. An update on the nutritional, functional, sensory characteristics of soy products, and applications of new processing strategies. Trends Food Sci. Technol. 2021, 112, 676–689. [Google Scholar] [CrossRef]
  17. Bharathi, S. Functional Effects of Soy-Raffinose on the Quality Parameters of Yogurt. Ph.D. Thesis, University of Central Oklahoma, Edmond, OK, USA, 2019. [Google Scholar]
  18. Association of Official Analytical Chemists; Association of Official Agricultural Chemists (US). Official Methods of Analysis of the Association of Official Analytical Chemists; Association of Official Analytical Chemists: Rockville, MD, USA, 1931. [Google Scholar]
  19. Assaker, K.; Rima, J. A New Spectrophometric Method for The Analysis of Fructose, Glucose and Sucrose, Using 2-Thiobarbituric Acid and Zero-Valent Iron Powder (ZVIP). J. Food Res. 2019, 8, 48–55. [Google Scholar] [CrossRef]
  20. Rana, V.S.; Das, M. Fatty Acid and Non-Fatty Acid Components of the Seed Oil of Celastrus paniculatus wild. Int. J. Fruit. Sci. 2017, 17, 407–414. [Google Scholar] [CrossRef]
  21. Fatima, S.M.; Hekmat, S. Microbial and Sensory Analysis of Soy and Cow Milk-Based Yogurt as a Probiotic Matrix for Lactobacillus rhamnosus GR-1. Fermentation 2020, 6, 74. [Google Scholar] [CrossRef]
  22. Zong, L.; Lu, M.; Wang, W. The Quality and Flavor Changes of Different Soymilk and Milk Mixtures Fermented Products during Storage. Fermentation 2022, 8, 668. [Google Scholar] [CrossRef]
  23. Du, L.; Ro, K.S.; Zhang, Y.; Tang, Y.J.; Li, W.; Xie, J.; Wei, D. Effects of Lactiplantibacillus plantarum X7021 on physicochemical properties, purines, isoflavones and volatile compounds of fermented soymilk. Process Biochem. 2022, 113, 150–157. [Google Scholar] [CrossRef]
  24. Cui, Y.; Qu, X. Genetic mechanisms of prebiotic carbohydrate metabolism in lactic acid bacteria: Emphasis on Lacticaseibacillus casei and Lacticaseibacillus paracasei as flexible, diverse and outstanding prebiotic carbohydrate starters. Trends Food Sci. Technol. 2021, 115, 486–499. [Google Scholar] [CrossRef]
  25. Choudhary, S.; Singh, M.; Sharma, D.; Attri, S.; Sharma, K.; Goel, G. Principal component analysis of stimulatory effect of synbiotic combination of indigenous probiotic and inulin on antioxidant activity of soymilk. Probiotics Antimicrob. Proteins 2019, 11, 813–819. [Google Scholar] [CrossRef] [PubMed]
  26. Tsangalis, D.; Shah, N.P. Metabolism of oligosaccharides and aldehydes and production of organic acids in soymilk by probiotic bifidobacteria. Int. J. Food Sci. Technol. 2004, 39, 541–554. [Google Scholar] [CrossRef]
  27. Holscher, H.D. Dietary fiber and prebiotics and the gastrointestinal microbiota. Gut Microbes 2017, 8, 172–184. [Google Scholar] [CrossRef]
  28. Zhou, X.L.; Kong, X.F.; Lian, G.Q. Dietary supplementation with soybean oligosaccharides increases short-chain fatty acids but decreases protein-derived catabolites in the intestinal luminal content of weaned Huanjiang mini-piglets. Nutr. Res. 2014, 34, 780–788. [Google Scholar] [CrossRef]
  29. Kumari, M.; Patel, H.K.; Kokkiligadda, A.; Bhushan, B.; Tomar, S.K. Characterization of probiotic lactobacilli and development of fermented soymilk with improved technological properties. LWT 2022, 154, 112827. [Google Scholar] [CrossRef]
  30. Mishra, S.; Mishra, H.N. Comparative study of the synbiotic effect of inulin and fructooligosaccharides with probiotics with regard to the various properties of fermented soy milk. Food Sci. Technol. Int. 2018, 24, 564–575. [Google Scholar] [CrossRef]
  31. Mishra, S.; Mishra, H.N. Effect of synbiotic interaction of fructooligosaccharides and probiotics on the acidification profile, textural and rheological characteristics of fermented soy milk. Food Bioprocess. Technol. 2013, 6, 3166–3176. [Google Scholar] [CrossRef]
Figure 1. Change in pH of synbiotic soymilk: (A) Change in pH of synbiotic soymilk fermented with co-cultures of L. rhamnosus JCM1136 and W. confusa 30082b supplemented with 2% FOS, 3% FOS, 2% RFOs, 3% RFOs during 0, 12, 24, 36 and during 48 h of fermentation at 37 °C temperature. (B) Change in titratable acidity (% lactic acid) of synbiotic soymilk fermented with co-cultures of L. rhamnosus JCM1136 and W. confusa 30082b supplemented with 2% FOS, 3% FOS, 2% RFOs, and 3% RFOs during 0, 12, 24, 36 and 48 h of fermentation.
Fermentation 11 00194 g001
Figure 2. Change in oligosaccharide concentration in synbiotic soymilk: (A) Change in raffinose concentration (g/100 g) in synbiotic soymilk fermented with co-cultures of L. rhamnosus JCM1136 and W. confusa 30082b supplemented with 2% FOS, 3% FOS, 2% RFOs, and 3% RFOs during 0 and 24 h of fermentation at 37 °C temperature. (B) Change in stachyose concentration (g/100 g) in synbiotic soymilk during 0 and 24 h of fermentation. The small alphabets—a, b, c, d near error bars are statistical annotations used to indicate significant differences between groups or treatments based on ANOVA test followed by a Duncan’s test under each response variable at 5% significance level. Groups with the same letter are not significantly different from each other (p > 0.05) and groups with different letters are significantly different from each other at a given confidence level (p < 0.05).
Fermentation 11 00194 g002
Figure 3. Change in monosaccharides and sucrose concentration in synbiotic soymilk: (A) Change in glucose concentration (g/100 g) in synbiotic soymilk fermented with co-cultures of L. rhamnosus JCM1136 and W. confusa 30082b supplemented with 2% FOS, 3% FOS, 2% RFOs, and 3% RFOs during 0 and 24 h of fermentation at 37 °C temperature. (B) Change in galactose concentration (g/100 g) in synbiotic soymilk during 0 and 24 h of fermentation. (C) Change in fructose concentration (g/100 g) in synbiotic soymilk during 0 and 24 h of fermentation. (D) Change in sucrose concentration (g/100 g) in synbiotic soymilk during 0 and 24 h of fermentation. The small alphabets—a, b, c, d near error bars are statistical annotations used to indicate significant differences between groups or treatments based on ANOVA test followed by a Duncan’s test under each response variable at 5% significance level. Groups with the same letter are not significantly different from each other (p > 0.05) and groups with different letters are significantly different from each other at a given confidence level (p < 0.05).
Fermentation 11 00194 g003
Figure 4. Measurement of viable count of bacteria in synbiotic soymilk: Viable count of bacteria (log CFU/mL) in synbiotic soymilk fermented with co-cultures of L. rhamnosus JCM1136 and W. confusa 30082b supplemented with 2% FOS, 3% FOS, 2% RFOs, 3% RFOs and MRS broth fermented with co-cultures of L. rhamnosus JCM1136 and Weissella confusa 30082b supplemented with 2% FOS, 3% FOS, 2% RFOs, and 3% RFOs. Soymilk fermentation and culture incubation are performed at 37 °C for 24 h. The small alphabets—a, b, c near error bars are statistical annotations used to indicate significant differences between groups or treatments based on ANOVA test followed by a Duncan’s test under each response variable at 5% significance level. Groups with the same letter are not significantly different from each other (p > 0.05) and groups with different letters are significantly different from each other at a given confidence level (p < 0.05).
Fermentation 11 00194 g004
Figure 5. Production of methyl propionate (MeP) and methyl butyrate (MeB) esters in synbiotic soymilk: Production of MeP and MeB (mg/mL) in synbiotic soymilk fermented with co-cultures of L. rhamnosus JCM1136 and W. confusa 30082b supplemented with 2% FOS, 3% FOS, 2% RFOs, and 3% RFOs during 24 h of fermentation at 37 °C temperature.
Fermentation 11 00194 g005
Figure 6. Principal component analysis (PCA) biplot as a sensory assessment tool for synbiotic soymilk: PCA biplot of the 18 samples (filled circles) and the 6 sensory attributes (arrows) for the first two principal components viz. Dim1 (explained variance = 87.7%) and Dim2 (explained variance = 7.8%).
Fermentation 11 00194 g006
Figure 7. Scheme for RFOs and FOS utilisation by probiotic bacteria. The intracellular uptake of RFOs (stachyose, raffinose) is carried out by the Mel C, D, E, and Msm ABC transport system. Further intracellular breakdown of RFOs to sucrose and monosaccharides like galactose, glucose, and fructose is catalysed by Mel A (α-galactosidases) (in Lactobacillaceae Family or Weissella sp.). FOSs are degraded into smaller products by cell wall anchored β-fructosidase, which is further taken up by the phosphoenolpyruvate-dependent phosphotransferase (PTS) system or ABC transporters facilitating the transport of FOSs inside the cell which follows intracellular hydrolysis by β-fructosidase (in Lactobacillaceae Family or Weissella sp.). After the breakdown of RFOs and FOSs, the monomers produced go through glycolysis, pentose sugar conversion, and succinate pathways to produce SCFAs like propionate and butyrate with immense beneficial health effects.
Fermentation 11 00194 g007
Table 1. The mean rates for colour and appearance, taste, flavour, mouth feel, acidity and overall liking of various formulations of synbiotic soymilk in which the fermentation was performed at 37 °C for 24 h. Panellists (n = 25) rate the synbiotic soymilk supplemented with prebiotics/vanillin/sugar using a nine-point hedonic scale ranging from 1 (dislike extremely) to 9 (like extremely). The small alphabets are statistical annotations used to indicate significant differences between groups or treatments based on ANOVA test followed by a Duncan’s test under each response variable at 5% significance level. Groups with the same letter are not significantly different from each other (p > 0.05) and groups with different letters are significantly different from each other at a given confidence level (p < 0.05).
Treatment No.SamplesColourMouth FeelConsistencyTasteFlavourOverall Liking
T1Control (unfermented soymilk)6.17 ± 0.27 de3.23 ± 0.11 n4.37 ± 0.17 l2.12 ± 0.05 m3.62 ± 0.22 n3.9 ± 0.06 n
T2Unfermented + 2% table sugar6.21 ± 0.31 de4.32 ± 0.12 l4.71 ± 0.1 jk5.28 ± 0.1 l5.61 ± 0.25 m5.23 ± 0.24 m
T3Unfermented + 1% vanillin6.22 ± 0.27 de3.71 ± 0.09 m5.13 ± 0.16 h5.33 ± 0.21 k6.01 ± 0.31 l5.28 ± 0.27 l
T4Unfermented with 3% FOS6.51 ± 0.13 bc5.12 ± 0.18 j4.93 ± 0.08 i6.61 ± 0.31 i5.92 ± 0.26 l5.82 ± 0.51 j
T5Fermented with 3% FOS6.27 ± 0.34 d6.7 ± 0.31 e4.62 ± 0.31 k8 ± 0.42 d6.91 ± 0.11 ij6.5 ± 0.26 h
T6Fermented with 3% FOS + 2% table sugar6.32 ± 0.45 cd7.29 ± 0.45 d4.74 ± 0.71 jk7.45 ± 0.37 g7.23 ± 0.52 gh6.61 ± 0.5 f
T7Fermented with 3% FOS + 1% vanillin6.81 ± 0.41 a6.73 ± 0.32 e5.51 ± 0.21 g7.92 ± 0.21 e8.19 ± 0.71 e7.03 ± 0.61 e
T8Fermented with 3% FOS + 2% table sugar + 1% vanillin6.57 ± 0.23 b7.23 ± 0.47 d5.63 ± 0.27 fg8.12 ± 0.43 c8.64 ± 0.27 ab7.24 ± 0.27 d
T9Unfermented with 3% RFOs5.91 ± 0.11 fg5.22 ± 0.21 i4.81 ± 0.61 ij7.13 ± 0.32 h7.09 ± 0.52 hi6.03 ± 0.34 i
T10Fermented with 3% RFOs6.23 ± 0.56 g6.18 ± 0.61 g5.75 ± 0.53 ef7.89 ± 0.26 e6.75 ± 0.61 j6.56 ± 0.45 g
T11Fermented with 3% RFOs + 2% table sugar5.91 ± 0.36 fg6.53 ± 0.26 f6.82 ± 0.76 d8.21 ± 0.52 b7.89 ± 0.42 f7.07 ± 0.52 e
T12Fermented with 3% RFOs + 1% vanillin5.84 ± 0.21 g6.57 ± 0.39 f6.81 ± 0.54 d7.82 ± 0.35 f8.16 ± 0.26 e7.04 ± 0.26 e
T13Fermented with 3% RFOs + 2% table sugar + 1% vanillin6.11 ± 0.65 def7.52 ± 0.41 c7.81 ± 0.32 a7.92 ± 0.61 e8.31 ± 0.51 b7.53 ± 0.42 c
T14Unfermented with 2% RFOs + 2% FOS6.28 ± 0.27 d4.89 ± 0.11 k5.19 ± 0.18 h5.67 ± 0.41 j6.23 ± 0.62 k5.65 ± 0.52 f
T15Fermented with 2% RFOs + 2% FOS6.31 ± 0.23 cd5.72 ± 0.17 h5.82 ± 0.16 e7.11 ± 0.27 h7.38 ± 0.41 g6.47 ± 0.21 h
T16Fermented with 2% RFOs + 2% FOS + 2% table sugar6.01 ± 0.43 efg7.77 ± 0.32 b7.12 ± 0.28 c8.23 ± 0.21 b8.41 ± 0.62 cd7.51 ± 0.31 c
T17Fermented with 2% RFOs + 2% FOS + 1% vanillin6.18 ± 0.25 de8.09 ± 0.53 a7.63 ± 0.87 b8.19 ± 0.36 b8.52 ± 0.71 bc7.72 ± 0.42 b
T18Fermented with 2% RFOs + 2% FOS + 2% table sugar + 1% vanillin6.31 ± 0.12 cd8.16 ± 0.53 a7.84 ± 0.65 a8.34 ± 0.51 a8.72 ± 0.24 a7.87 ± 0.52 a
Disclaimer/Publisher’s Note: The statements, opinions and data contained in all publications are solely those of the individual author(s) and contributor(s) and not of MDPI and/or the editor(s). MDPI and/or the editor(s) disclaim responsibility for any injury to people or property resulting from any ideas, methods, instructions or products referred to in the content.

