Article

Transcriptional and Physiological Responses of Saccharomyces cerevisiae CZ to Octanoic Acid Stress

College of Food and Pharmaceutical Engineering, Guizhou Institute of Technology, Guiyang 550003, China
*
Authors to whom correspondence should be addressed.
Fermentation 2025, 11(4), 180; https://doi.org/10.3390/fermentation11040180
Submission received: 15 January 2025 / Revised: 20 March 2025 / Accepted: 21 March 2025 / Published: 1 April 2025

Abstract

This study elucidates the adaptive mechanisms of Saccharomyces cerevisiae CZ under octanoic acid stress, revealing concentration-dependent growth inhibition (76% lethality at 800 mg/L) and notable tolerance at 600 mg/L. Initial exposure (≤6 h) showed no growth impairment, but prolonged treatment induced dose-dependent lethality, accompanied by reduced H+/K+-ATPase activity and elevated malondialdehyde (MDA) levels, indicative of oxidative damage. Transcriptomic profiling of 5665 genes highlighted the predominant downregulation of ribosomal functions (translation, ribosome biogenesis) and amino acid metabolism pathways (e.g., ARO10, ARO9). Strain-specific regulatory dynamics were observed: (1) TPO1-mediated efflux was active at 400 mg/L but absent at 600 mg/L, suggesting compensatory mechanisms under high stress; (2) HTX1-related genes exhibited bidirectional regulation (downregulated at 400 mg/L vs. upregulated at 600 mg/L), reflecting metabolic flexibility; (3) ACC1 downregulation (600 mg/L) and unaltered SFK1 expression contrasted with lipid-remodeling strategies in engineered strains; and (4) PMA2 suppression diverged from literature-reported PMA1 activation, underscoring strain-specific energy reallocation. Suppression of ergosterol biosynthesis and ribosomal genes revealed a trade-off between stress adaptation and biosynthetic processes. These findings reconcile prior contradictions by attributing discrepancies to genetic backgrounds (CZ vs. laboratory/engineered strains) and methodological variations. Unlike strains relying on phospholipid asymmetry or oleic acid overproduction, CZ’s unique tolerance stems from integrated membrane homeostasis (via lipid balance) and metabolic conservation. This work emphasizes the critical role of strain-specific regulatory networks in octanoic acid resistance and provides insights for optimizing yeast robustness through targeted engineering of membrane stability and metabolic adaptability. Future studies should employ multi-omics integration to unravel the dynamic gene regulatory logic underlying these adaptive traits.

1. Introduction

Saccharomyces cerevisiae, commonly known as baker’s or brewer’s yeast, is a model organism extensively utilized in both research and industrial applications due to its robustness and ease of genetic manipulation [1,2,3]. The ability of S. cerevisiae to ferment sugars into ethanol has been harnessed in various sectors, including biofuel production [4], food fermentation [5], and pharmaceuticals [6,7]. However, the presence of fatty acids, such as octanoic acid (C8:0), can significantly impair yeast fermentation efficiency and cell viability [8,9]. Octanoic acid, a short-chain fatty acid (SCFA), is produced naturally during the fermentation of certain substrates and can accumulate to inhibitory levels, leading to what is referred to as “fatty acid stress” [10]. Understanding how S. cerevisiae responds to and tolerates octanoic acid stress is crucial for optimizing industrial processes and enhancing the robustness of yeast strains used in these applications.
S. cerevisiae employs multifaceted molecular strategies to counteract octanoic acid toxicity, involving coordinated adaptations in membrane architecture, stress-responsive signaling, and transcriptional reprogramming. The primary resistance mechanisms involve the active efflux of octanoic acid via ATP-binding cassette (ABC) transporters, notably Pdr12, which is robustly upregulated under C8 stress to mediate energy-dependent extrusion of the toxic acid [9,11]. Concurrently, cells initiate membrane remodeling to reduce permeability, including increased rigidity through altered lipid composition, thereby limiting the passive influx of lipophilic compounds [12]. This process is complemented by lipid droplet biogenesis, which sequesters intracellular octanoic acid into neutral lipid reservoirs, further mitigating cytotoxicity [11]. Transcriptional reprogramming orchestrated by stress-responsive regulators (Msn2/Msn4) coordinates the expression of genes involved in membrane biogenesis, detoxification pathways, and energy metabolism [13]. Emerging evidence implicates additional molecular players, including the Tpo3 transporter that augments efflux capacity [14], and plasma membrane H+-ATPases that maintain essential proton gradients.
Several studies have focused on the identification of genetic determinants that confer increased tolerance to octanoic acid. One approach involves the use of adaptive laboratory evolution (ALE) to generate yeast strains with enhanced resistance. For example, through ALE, researchers have developed a strain capable of growing in media containing high concentrations of octanoic acid [15]. Transcriptomic analyses of these evolved strains revealed the upregulation of genes involved in fatty acid metabolism and transport, suggesting a shift in cellular resources to mitigate the stress [16]. These findings highlight the potential for genetic engineering to enhance yeast tolerance to fatty acid stress.
Another area of interest is the engineering of S. cerevisiae to produce enzymes and modify its membrane properties to degrade or detoxify fatty acids, such as octanoic acid. Co-overexpression of Lem3 and Sfk1 has been demonstrated to remodel the membrane phospholipid distribution, enhancing the membrane potential by 131.5% and the membrane integrity by 29.2% [17]. Modifying the lipid profile by increasing oleic acid production through the expression of the engineered acetyl-CoA carboxylase (Acc1S1157A) has been shown to reduce the toxicity of octanoic acid [18]. These strategies underscore the importance of membrane remodeling in mitigating the adverse effects of fatty acid stress.
Despite these advances, there is still much to be learned about the complex interplay between S. cerevisiae and octanoic acid stress. The precise molecular mechanisms underlying the toxicity of octanoic acid and the full spectrum of adaptive responses remain incompletely understood. In particular, the isolation of high-octanoic-acid-tolerant strains and elucidation of the mechanisms enabling such tolerance are areas that require further exploration.
This study aims to provide a comprehensive understanding of the physiological and molecular responses of the high-octanoic-acid-tolerant strain S. cerevisiae CZ to octanoic acid stress. This knowledge could aid in the development of strains with enhanced tolerance for industrial applications.

2. Materials and Methods

2.1. Reagents and Yeast Strains

All chemicals used were of analytical grade unless otherwise specified. Octanoic acid (CAS 124-07-2, ≥99% purity), glacial acetic acid (CAS 64-19-7, ≥99% purity), anhydrous ethanol (CAS 64-17-5, ≥99% purity), methylene blue (CAS 61-73-4,), and sodium chloride (CAS 7647-14-5) were procured from a local supplier, Reggie Biology, in Guiyang, China. The MDA assay kit and H+/K+-ATPase activity detection kit were obtained from Nanjing Jiancheng Hongda Biotechnology Co., Ltd. (Nanjing, China).
The S. cerevisiae strain CZ, previously isolated from Rosa roxburghii and maintained in our laboratory [19,20], was utilized in this study.

2.2. Determination of Octanoic Acid Stress Concentration

Yeast pre-culture: A single colony from YPD agar (1% yeast extract, 2% peptone, 2% glucose,1–2% agar) was inoculated into 5 mL of sterile YPD broth (identical composition excluding agar) and cultured at 30 °C with 180 rpm shaking until mid-exponential growth phase was reached, as indicated by an OD600 value of 0.6–0.8 (approximately 8 h post-inoculation).
Stress treatment: Aliquots (1 mL) of pre-cultured yeast suspension were aseptically transferred to 100 mL YPD broth containing octanoic acid (final concentrations: 0, 200, 400, 600, and 800 mg/L). The octanoic acid working solution was prepared by dissolving sterile-filtered absolute ethanol (≥99% purity) followed by 0.22 μm membrane filtration, with ethanol vehicle concentration rigorously maintained below 1%vol across all experimental groups. Negative control groups received equivalent volumes of sterile ethanol solvent without octanoic acid. All cultures were incubated under controlled conditions (30 ± 0.5 °C) in an orbital shaker with constant agitation at 180 rpm for designated time intervals.
Sampling protocol: At T = 0 and T = 6 h, 5 mL aliquots were collected for the following:
(1)
OD600 measurement: cells were vortexed for 30 sec, and absorbance was measured against blank YPD.
(2)
Spot plating: serial 10-fold dilutions (100 to 10−4) in sterile water, plated (2 μL/drop) on YPD agar.
(3)
Viability assessment: methylene blue staining as per Section 2.4.

2.3. Determination of Spotting Count and Yeast Suspension Concentration

Prior to spotting, the treated yeast suspension was diluted in sterile water to three distinct dilution gradients: undiluted (0), 10−2, and 10−4. Subsequently, 2 μL of each dilution was spotted onto YPD agar and incubated at 30 °C for 12 h. The resulting colonies were photographed against a black velvet background to ensure clear visibility. Concurrently, the optical density of the yeast suspension was measured using a spectrophotometer, with a sterile liquid medium serving as the blank control. Each measurement was performed in triplicate to ensure reproducibility and accuracy.

2.4. Methylene Blue Staining and Cell Counting

To determine the viability of the yeast cells, a 1 mL aliquot of the yeast solution was placed in a 1.5 mL tube. The yeast was collected by centrifugation at 8000 rpm (round per minute) for 2 min. After discarding the supernatant, 1 mL of sterile water was added to the tube, and the yeast was resuspended and washed under the same centrifugation conditions. The washed yeast was then resuspended in 500 μL of sterile water. A 0.01% (w/v) methylene blue staining solution (2 drops) was added to the resuspension. After 2 min incubation at room temperature, a 10 μL stained suspension was loaded onto a hemocytometer. Viable (unstained) and non-viable (blue-stained) cells were counted under a microscope (SOPTOP CX40, NINGBO SUNNY INSTRUMENTS Co., Ltd., Ningbo, China) across ten randomly selected areas on the slide. Cell death rate (%) was calculated as Death rate = (Non-viable cells/Total cells) × 100.

2.5. Growth Curve Determination

Yeast pre-cultures (OD600 = 0.6–0.8) were inoculated into 10 mL YPD broth supplemented with octanoic acid (0, 200, 400, and 600 mg/L) in 15 mL glass tubes and inoculated at 30 °C with 30 rpm (round per minute) shaking. The initial yeast inoculum was standardized to 1 × 10⁶ colony-forming units per milliliter (CFU/mL). Cell density was monitored by collecting 0.2 mL aliquots at 6 h intervals until the stationary phase. OD600 was measured using an enzyme-linked immunosorbent assay (ELISA) reader (model HBS-1096A, DeTie, Nanjing, China), with samples exceeding OD600 > 1.0 diluted in sterile water to maintain spectrophotometric linearity. Triplicate cultures and uninoculated controls ensured reproducibility and sterility. Ethanol solvent controls (≤1% vol) confirmed no interference with growth kinetics [21].

2.6. Determination of Trace Malondialdehyde (MDA) and H+/K+-ATPase Activity

The content of trace malondialdehyde (MDA) was determined following the kit instruction manual and method described by Chen et al. [22]. Malondialdehyde, a degradation product of lipid peroxides, reacts with thiobarbituric acid (TBA) to form a red product with a maximum absorption peak at 532 nm.
The activity of H+/K+-ATPase was assessed according to the protocol established by Nanjing Jiancheng Hongda Biotechnology Co., Ltd. [23]. H+/K+-ATPase is an enzyme uniquely activated by potassium and not inhibited by ouabain. This enzyme catalyzes the hydrolysis of ATP to generate ADP and inorganic phosphate. The quantification of inorganic phosphate provides a measure of ATPase activity [23].

2.7. Transcriptional Analysis of Cell Gene Expression Profiles

To investigate the transcriptional adaptation of yeast to octanoic acid stress, S. cerevisiae cells were treated with 0, 400, and 600 mg/L octanoic acid for 6 h under aerobic conditions (30 °C, 180 rpm). Post-treatment, cells were harvested by centrifugation (12,000 rpm, 5 min), flash-frozen in liquid nitrogen, and stored at −80 °C. Total RNA was extracted using TRIzol reagent (Invitrogen, Waltham, MA, USA) and quantified (Agilent Bioanalyzer 2100, Santa Clara, CA, USA). Sequencing libraries were prepared from 3 μg RNA via poly-A mRNA enrichment (Illumina, San Diego, CA, USA), fragmentation, cDNA synthesis (SuperScript II Reverse Transcriptase), end repair, adapter ligation (Illumina PE adapters), and PCR amplification (AMPure XP purification). Libraries (400–500 bp) were validated (Agilent High Sensitivity DNA Kit) and sequenced on the Illumina NovaSeq 6000 platform (150 bp paired-end; Shanghai Personal Biotechnology Co., Shanghai, China).
Raw reads were aligned to the S. cerevisiae S288C genome (Ensembl R64) using HISAT2. Gene expression levels were quantified as FPKM, and differentially expressed genes (DEGs) were identified via DESeq2 (|log2FC| > 1, p < 0.05). Functional enrichment analyses were performed using TopGO (Gene Ontology) and ClusterProfiler (KEGG pathways), with significance thresholds set at p < 0.05. The raw transcriptome sequencing datasets generated in this study have been deposited in the National Center for Biotechnology Information (NCBI) Sequence Read Archive (SRA). The datasets are accessible under BioProject accession number PRJNA1236703. The datasets will be released for public availability on 15 March 2026. For further details regarding the experimental procedures and data analysis, please refer to our previous study by Li et al. [21].

2.8. Data Analysis

All experiments were conducted in triplicate, and data analysis and graphical representation were performed using GraphPad Prism 9.0, IBM SPSS Statistics 27, and Origin 2021. Data are presented as mean ± standard deviation (SD).

3. Results and Discussion

3.1. Physiological Characteristics Analysis of S. cerevisiae CZ

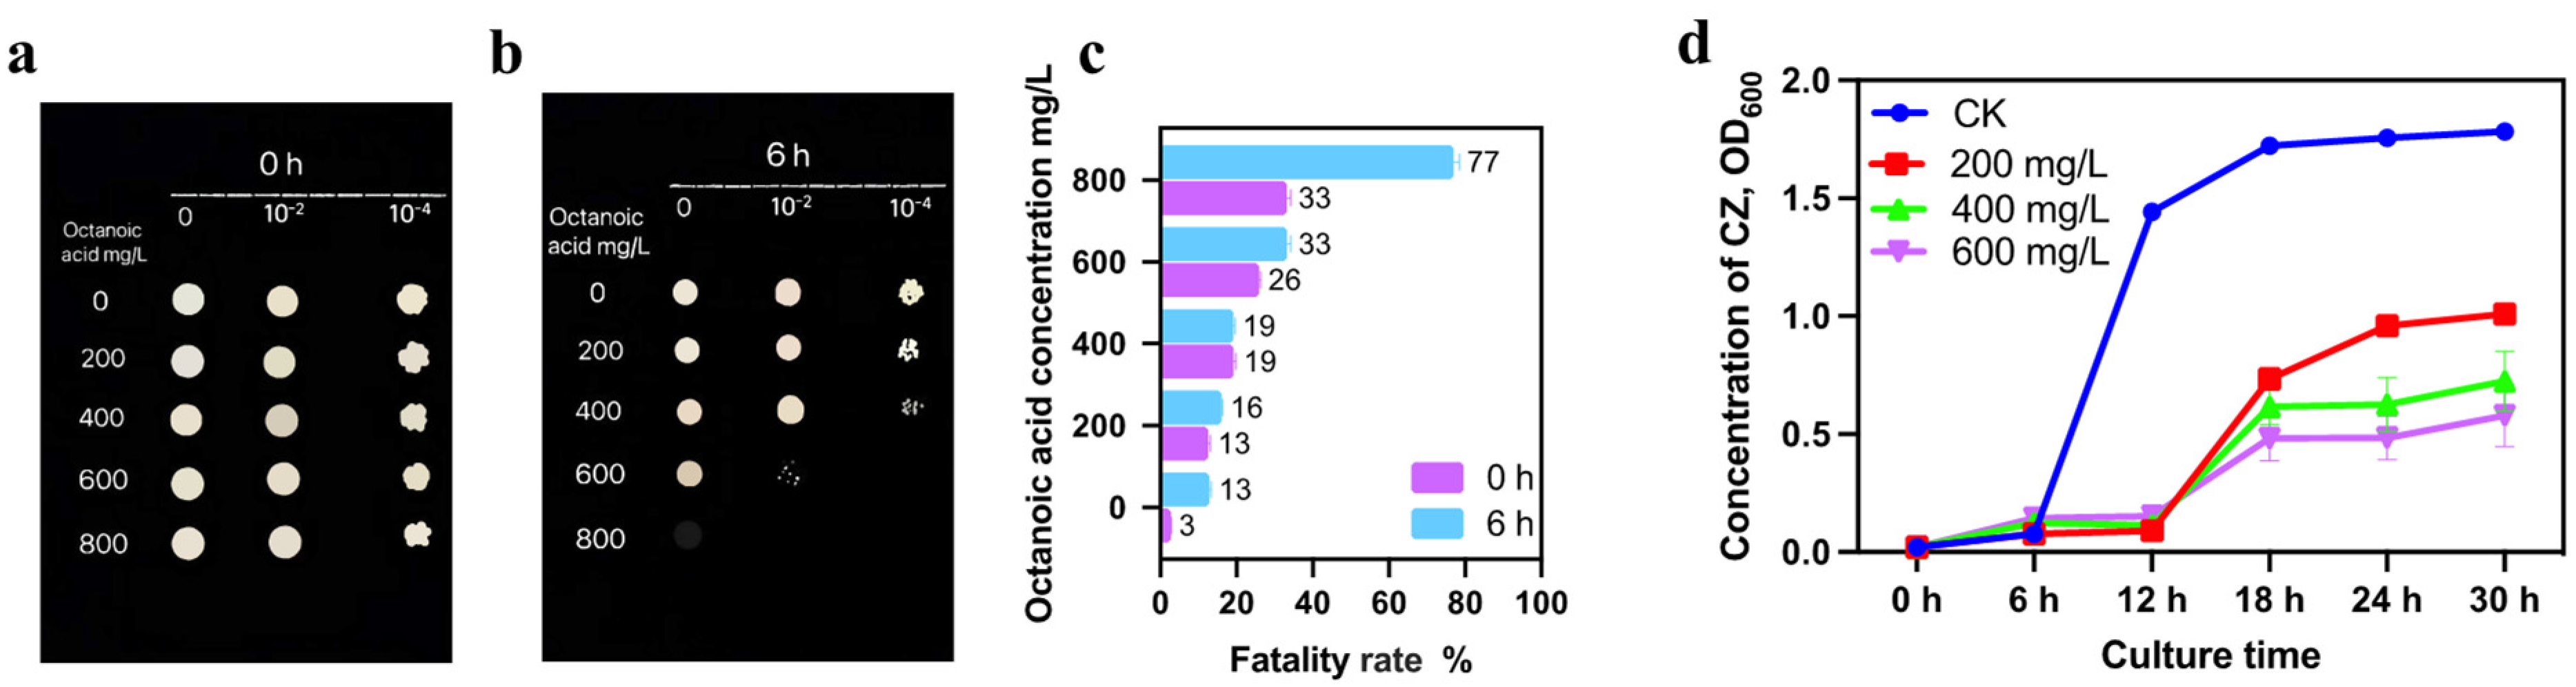
3.1.1. Effects of Octanoic Acid Stress on Growth and Lethality of S. cerevisiae CZ

The impact of octanoic acid stress on the growth of S. cerevisiae CZ is depicted in Figure 1. Immediately following the addition of octanoic acid to the liquid culture medium, there was no discernible effect on the growth status of S. cerevisiae CZ colonies across all concentrations [Figure 1a]. However, after 6 h of continuous exposure, the growth status of the colonies was visibly inhibited, with the severity increasing with the concentration of octanoic acid. At 600 mg/L, the growth of S. cerevisiae CZ was markedly weakened, and at 800 mg/L, the yeast was unable to grow on the medium [Figure 1b].
To quantify the lethality of S. cerevisiae CZ, methylene blue staining was employed. The results indicated that immediately upon the addition of octanoic acid to the culture medium (0 h), the growth of S. cerevisiae CZ was affected, with an increasing trend in lethality as the concentration increased. However, the overall lethality remained below 40%. After 6 h of exposure, the inhibitory effect of 800 mg/L octanoic acid on S. cerevisiae CZ was extremely evident, reaching 77%. Interestingly, the inhibitory effect of 600 mg/L octanoic acid after 6 h was comparable to the level observed at 0 h with 800 mg/L octanoic acid, both at approximately 33% [Figure 1c]. Despite the high concentration of octanoic acid, S. cerevisiae CZ was still able to grow on solid media [Figure 1b]. This finding indicates that S. cerevisiae CZ can tolerate at least 600 mg/L of octanoic acid stress, a result that significantly exceeds the reported tolerances of 115.4 mg/L by Legras et al. [11], 43.2 mg/L by Liu et al. [12], 16.0 mg/L by Viegas et al. [24], 14.4 mg/L by Cabral et al. [9], 125.3 mg/L by Borrull et al. [25], and 86.4 mg/L by Liu et al. [17]. These differences in tolerance levels suggest strain-specific variations in resistance to octanoic acid, indicating that S. cerevisiae CZ is a high-octanoic-acid-tolerant strain.
Growth curves of S. cerevisiae CZ under different octanoic acid concentrations indicate that the exponential growth phase and stationary phase are critical periods where the yeast is influenced by octanoic acid stress. Compared to the control, octanoic acid caused a lag in yeast growth, with the inhibitory effect becoming more pronounced as the concentration increased, particularly during the stationary phase [Figure 1d].

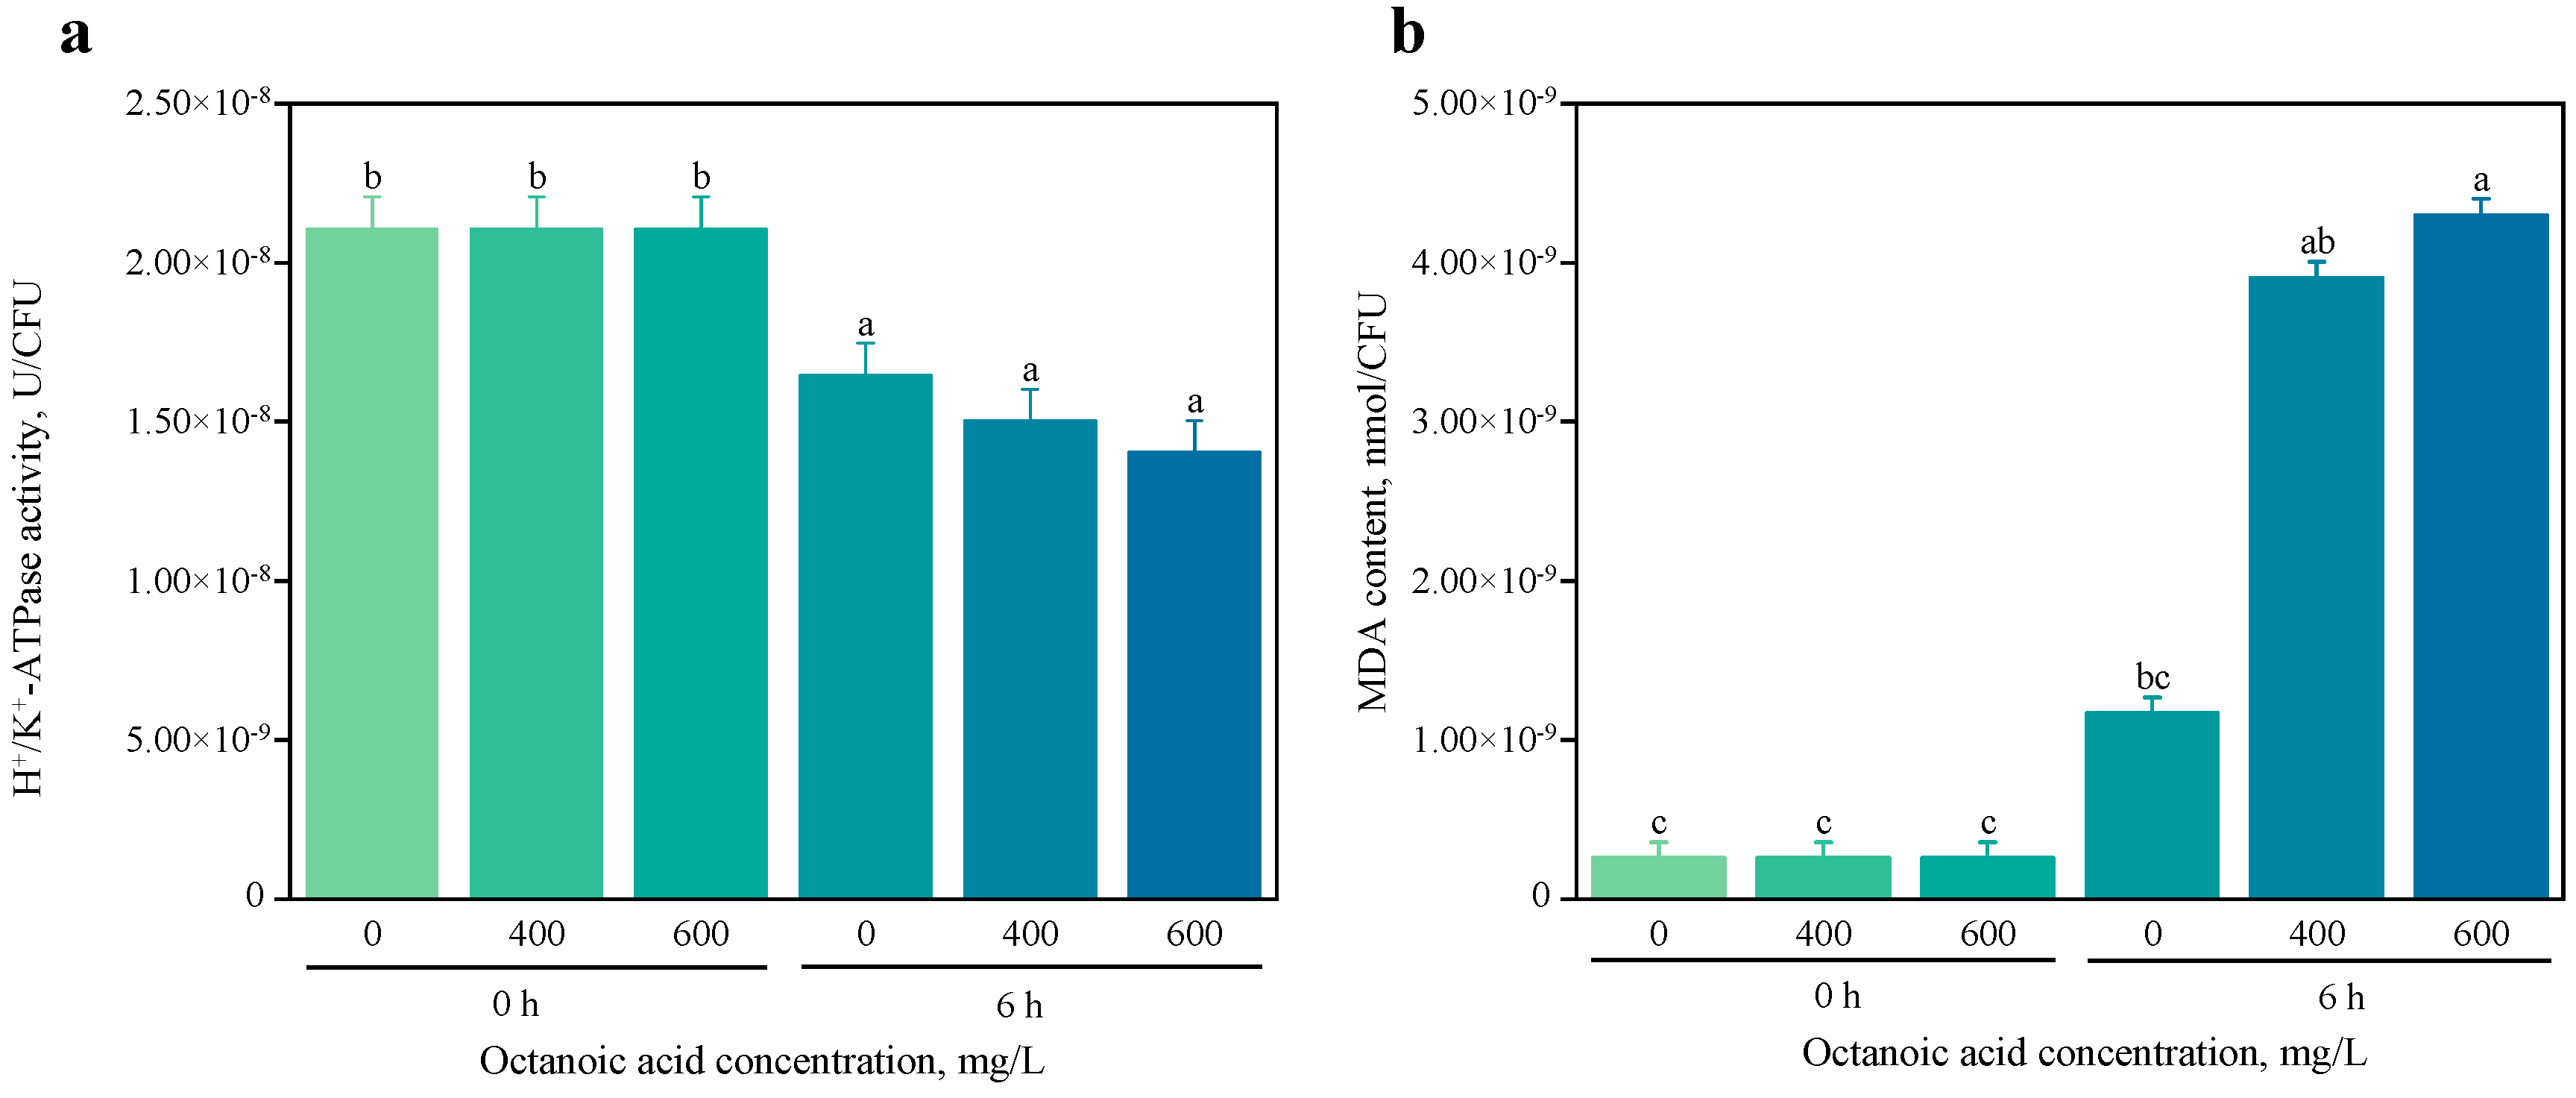
3.1.2. Effects of Octanoic Acid Stress on H+/K+-ATPase Activity and Malondialdehyde Content in S. cerevisiae CZ

Given the lethal effects of 800 mg/L octanoic acid stress on S. cerevisiae CZ, and due to the similarity in treatment effects between 200 mg/L and 400 mg/L concentrations, our study focused on investigating the impact of three specific octanoic acid concentrations (0, 400, and 600 mg/L) on this yeast strain. This decision was made to streamline the experimental design while still capturing the range of physiological responses induced by varying levels of octanoic acid stress.
The results from H+/K+-ATPase activity testing revealed a significant reduction in enzyme activity across all experimental groups after 6 h of treatment compared to the activity immediately following the addition of octanoic acid to the yeast culture [Figure 2a]. This finding is particularly noteworthy as it contrasts with previously reported data in the literature [26], which may suggest unique regulatory mechanisms or cellular responses in S. cerevisiae CZ under octanoic acid stress.
In biological systems, malondialdehyde (MDA) serves as a biomarker for lipid peroxidation, an oxidative degradation initiated by free radicals that are often generated in response to various stress factors [27]. Consequently, this study also examined changes in MDA content under different octanoic acid stress conditions. Our results demonstrated that after 6 h of treatment with varying concentrations of octanoic acid, the MDA content was significantly elevated compared to both the initial time point (0 h) and the control group [Figure 2b]. These findings are consistent with the known response of S. cerevisiae to other stressors [28], indicating that octanoic acid induces oxidative stress and subsequent lipid peroxidation in yeast cells.
The observed increase in MDA content underscores the detrimental impact of octanoic acid on cellular membranes, potentially compromising membrane integrity and function. This lipid peroxidation could further exacerbate cellular stress by disrupting essential cellular processes such as ion homeostasis and energy production. The significant reduction in H+/K+-ATPase activity suggests that the enzyme may be particularly sensitive to the oxidative damage caused by lipid peroxidation, leading to impaired ion transport functions critical for cellular homeostasis.
These observations collectively highlight the multifaceted nature of the yeast’s response to octanoic acid stress. By examining both enzymatic activity and oxidative stress markers, we provide a comprehensive understanding of how S. cerevisiae CZ copes with and responds to environmental challenges posed by fatty acids. Future studies should aim to elucidate the underlying molecular mechanisms responsible for these observed changes, potentially paving the way for developing strategies to mitigate the adverse effects of such stressors on yeast physiology.

3.2. Analysis of Gene Expression Profiles in S. cerevisiae

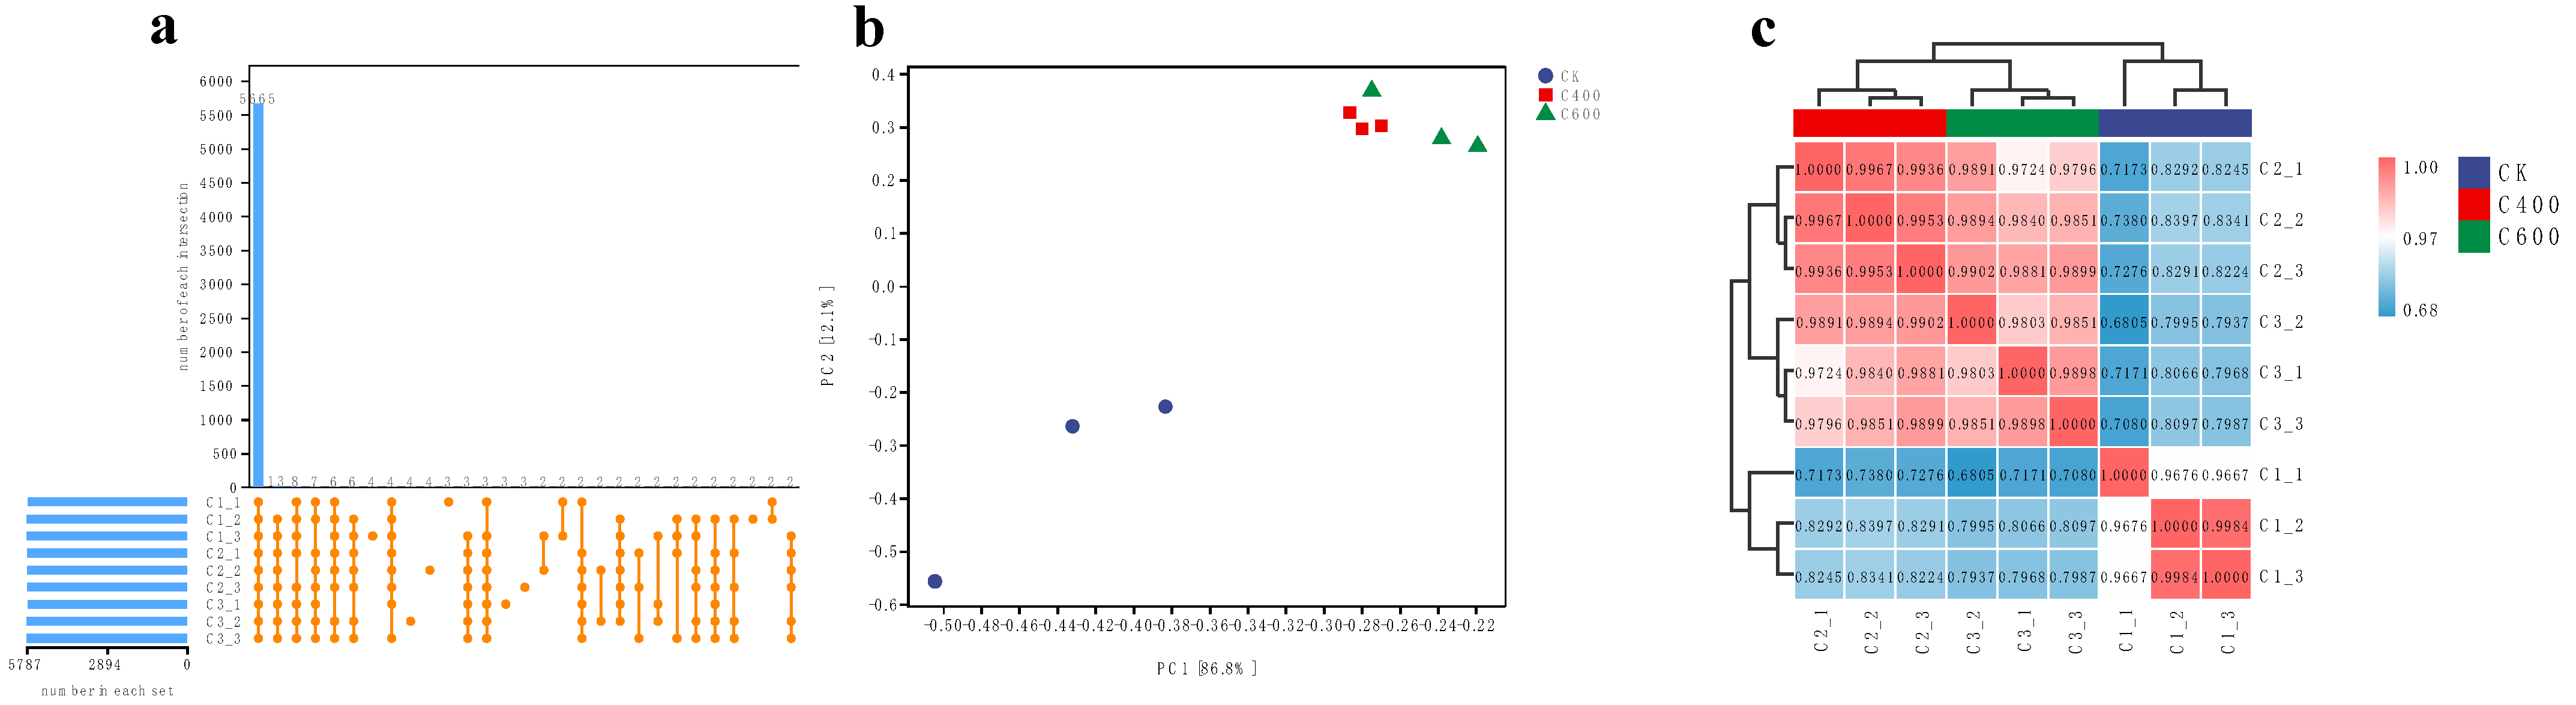
3.2.1. Quality Control Analysis of Transcriptomic Data

Transcriptome sequencing generated 37,637,308, 42,983,217, and 38,825,746 raw reads for S. cerevisiae CZ samples treated with 0, 400, and 600 mg/L octanoic acid, respectively. After filtering, 35,536,034, 40,496,293, and 36,624,445 clean reads were obtained for each respective treatment. The proportions of useful reads and useful bases were greater than 94%, with Q20 and Q30 values exceeding 94% (Table 1). The data exhibited no bias in gene coverage uniformity, had reasonable saturation, and over 90% of the aligned regions were within the coding sequence (CDS) region. Consequently, the quality of the transcriptome sequencing data was deemed accurate and suitable for use.

3.2.2. Gene Expression Analysis

A comprehensive transcriptomic analysis was conducted on a series of samples, resulting in the identification of 5665 genes that were actively transcribed across all examined samples. Notably, an in-depth investigation into unique gene expression revealed a nuanced distribution: while samples C2_1 and C3_3 did not manifest any genes with exclusive expression patterns, sample C1_2 featured a pair of uniquely expressed genes. In contrast, samples C1_1, C2_3, and C3_1 exhibited a slightly higher complexity, each harboring three genes with unique expression profiles. Samples C1_3, C2_2, and C3_2 presented the highest level of complexity within this subset, with four genes demonstrating distinct expression patterns [Figure 3a]. Principal component analysis (PCA) was employed to elucidate the underlying structure of the dataset, revealing a clear demarcation in the gene expression landscape between octanoic acid-treated samples and their respective controls. The compositional dissimilarity observed is indicative of a substantial shift in the transcriptional response elicited by the treatment, as evidenced by the distinct clustering patterns [Figure 3b]. Moreover, the PCA also highlighted a concentration-dependent effect, with samples exposed to different concentrations of octanoic acid (C400 vs. C600) displaying discernible variations in their gene expression profiles. This finding underscores the significant influence of octanoic acid on the transcriptional architecture of S. cerevisiae CZ, suggesting that even subtle changes in concentration can lead to meaningful alterations in gene regulation.
To further assess the consistency and reliability of the observed expression patterns, a correlation analysis was performed across biological replicates. The results indicated robust positive correlations, with Pearson’s correlation coefficients ranging from 0.8 to 1.0 among replicate samples. Such high correlation values are indicative of a high degree of reproducibility and reliability in the experimental setup, affirming the biological relevance of the detected differences in gene expression. The clear differentiation in expression levels between replicate groups, as visualized in [Figure 3c], reinforces the notion that the observed variations are not merely stochastic fluctuations but rather reflect true biological phenomena.

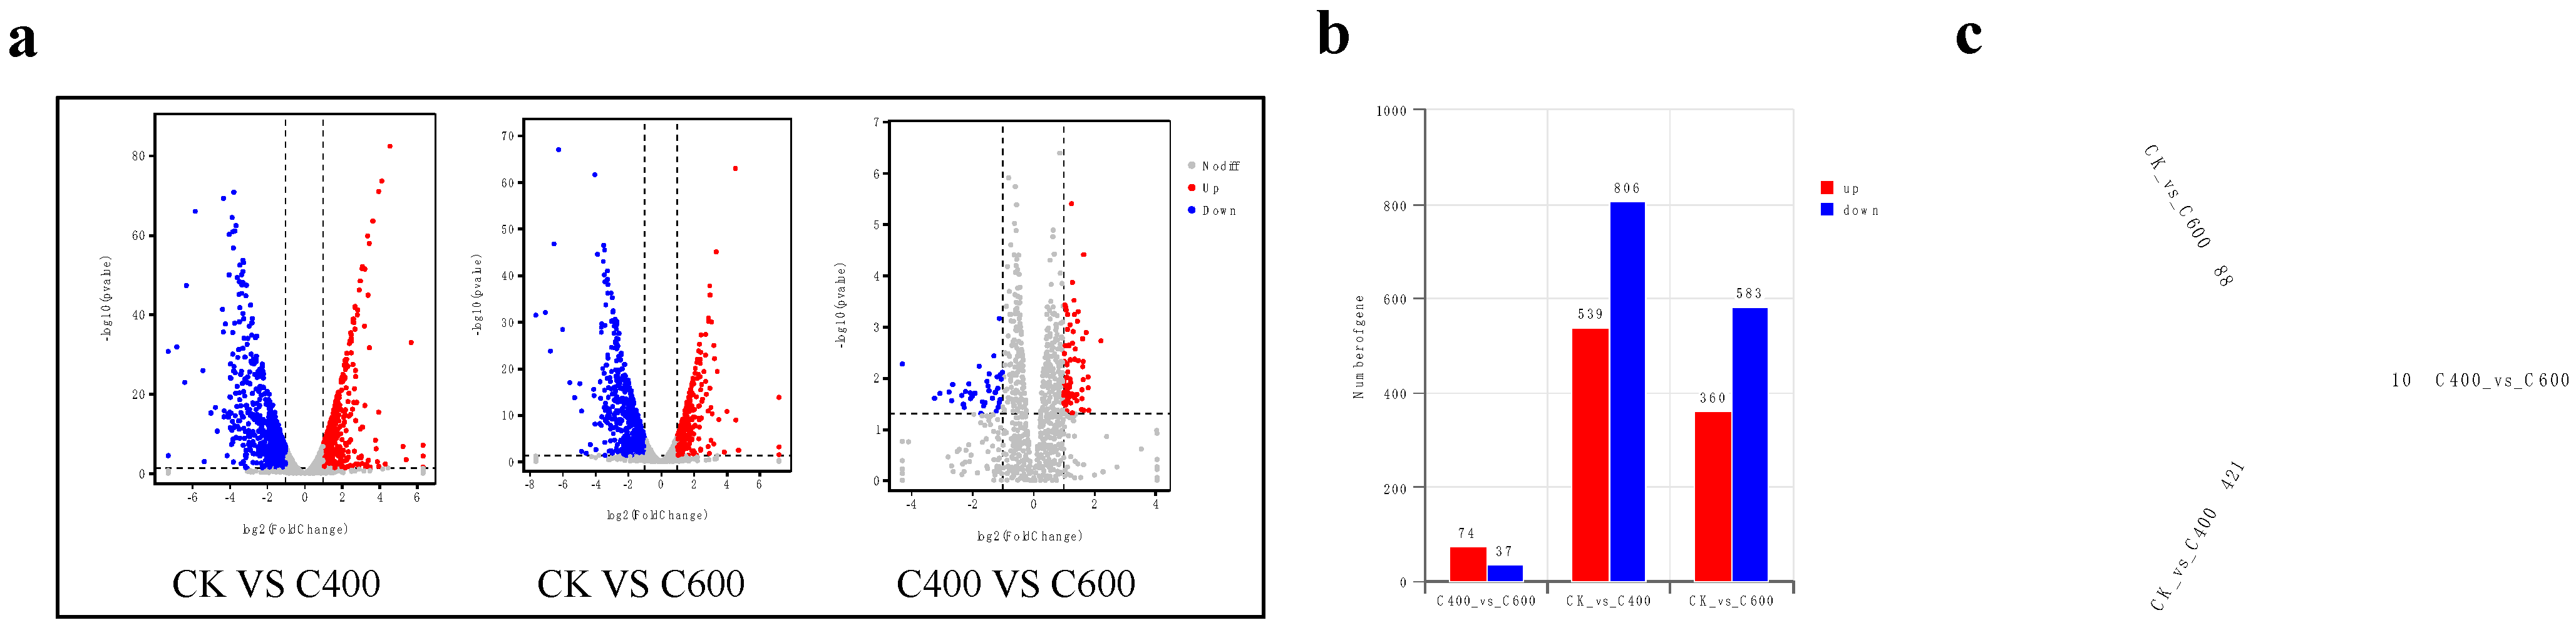
3.2.3. Statistical Analysis of Differentially Expressed Genes

Using the criteria of |log2FoldChange| > 1 and a significance threshold of p-value < 0.05 to identify differentially expressed genes, we found that compared to the control, octanoic acid treatment (400 or 600 mg/L) of S. cerevisiae CZ resulted in a substantial number of genes being upregulated or downregulated. This finding aligns with previous studies that have shown significant transcriptional responses in yeast subjected to fatty acid stress [29,30].
However, while a significant number of genes were upregulated or downregulated between the 400 and 600 mg/L octanoic acid treatment groups, the magnitude of change was less pronounced compared to the control [Figure 4a]. This finding suggests that the yeast’s response to increasing concentrations of stressors may become less dramatic above certain thresholds, potentially indicating a saturation point in the cellular stress response mechanisms.
Specifically, compared to the control, 400 mg/L octanoic acid treatment resulted in 539 upregulated genes and 806 downregulated genes in S. cerevisiae CZ. At 600 mg/L octanoic acid treatment, there were 360 upregulated genes and 583 downregulated genes, with the number of downregulated genes consistently higher than the number of upregulated genes. These results are in agreement with previous studies that have shown a predominance of downregulated genes in yeast exposed to high concentrations of fatty acids [11]. Between the 400 mg/L and 600 mg/L octanoic acid treatment groups, there were 74 upregulated genes and 37 downregulated genes, with the number of upregulated genes exceeding the number of downregulated genes [Figure 4b].
Venn diagram analysis revealed that the number of shared genes among CK, C400, and C600 was only 18. Among the pairwise comparisons, the number of uniquely differentially expressed genes was 421 for CK versus C400, 88 for CK versus C600, and 10 for C400 versus C600 [Figure 4c]. This suggests that the transcriptional response to octanoic acid is concentration-dependent and that the yeast adapts to different stress levels through distinct sets of genes.
These findings indicate that S. cerevisiae CZ undergoes a stress response when exposed to octanoic acid, manifesting as the upregulation or downregulation of a large number of genes. Notably, when the concentration of octanoic acid increased from 400 mg/L to 600 mg/L, the increase in the number of differentially expressed genes was less pronounced compared to the difference relative to the control. This observation supports the notion that yeast may have evolved mechanisms to cope with moderate stress levels, but higher concentrations of stressors trigger a more limited response. What metabolic pathways do these differentially expressed genes participate in? Which genes should be selected for validation? We will address these questions in the subsequent analysis.

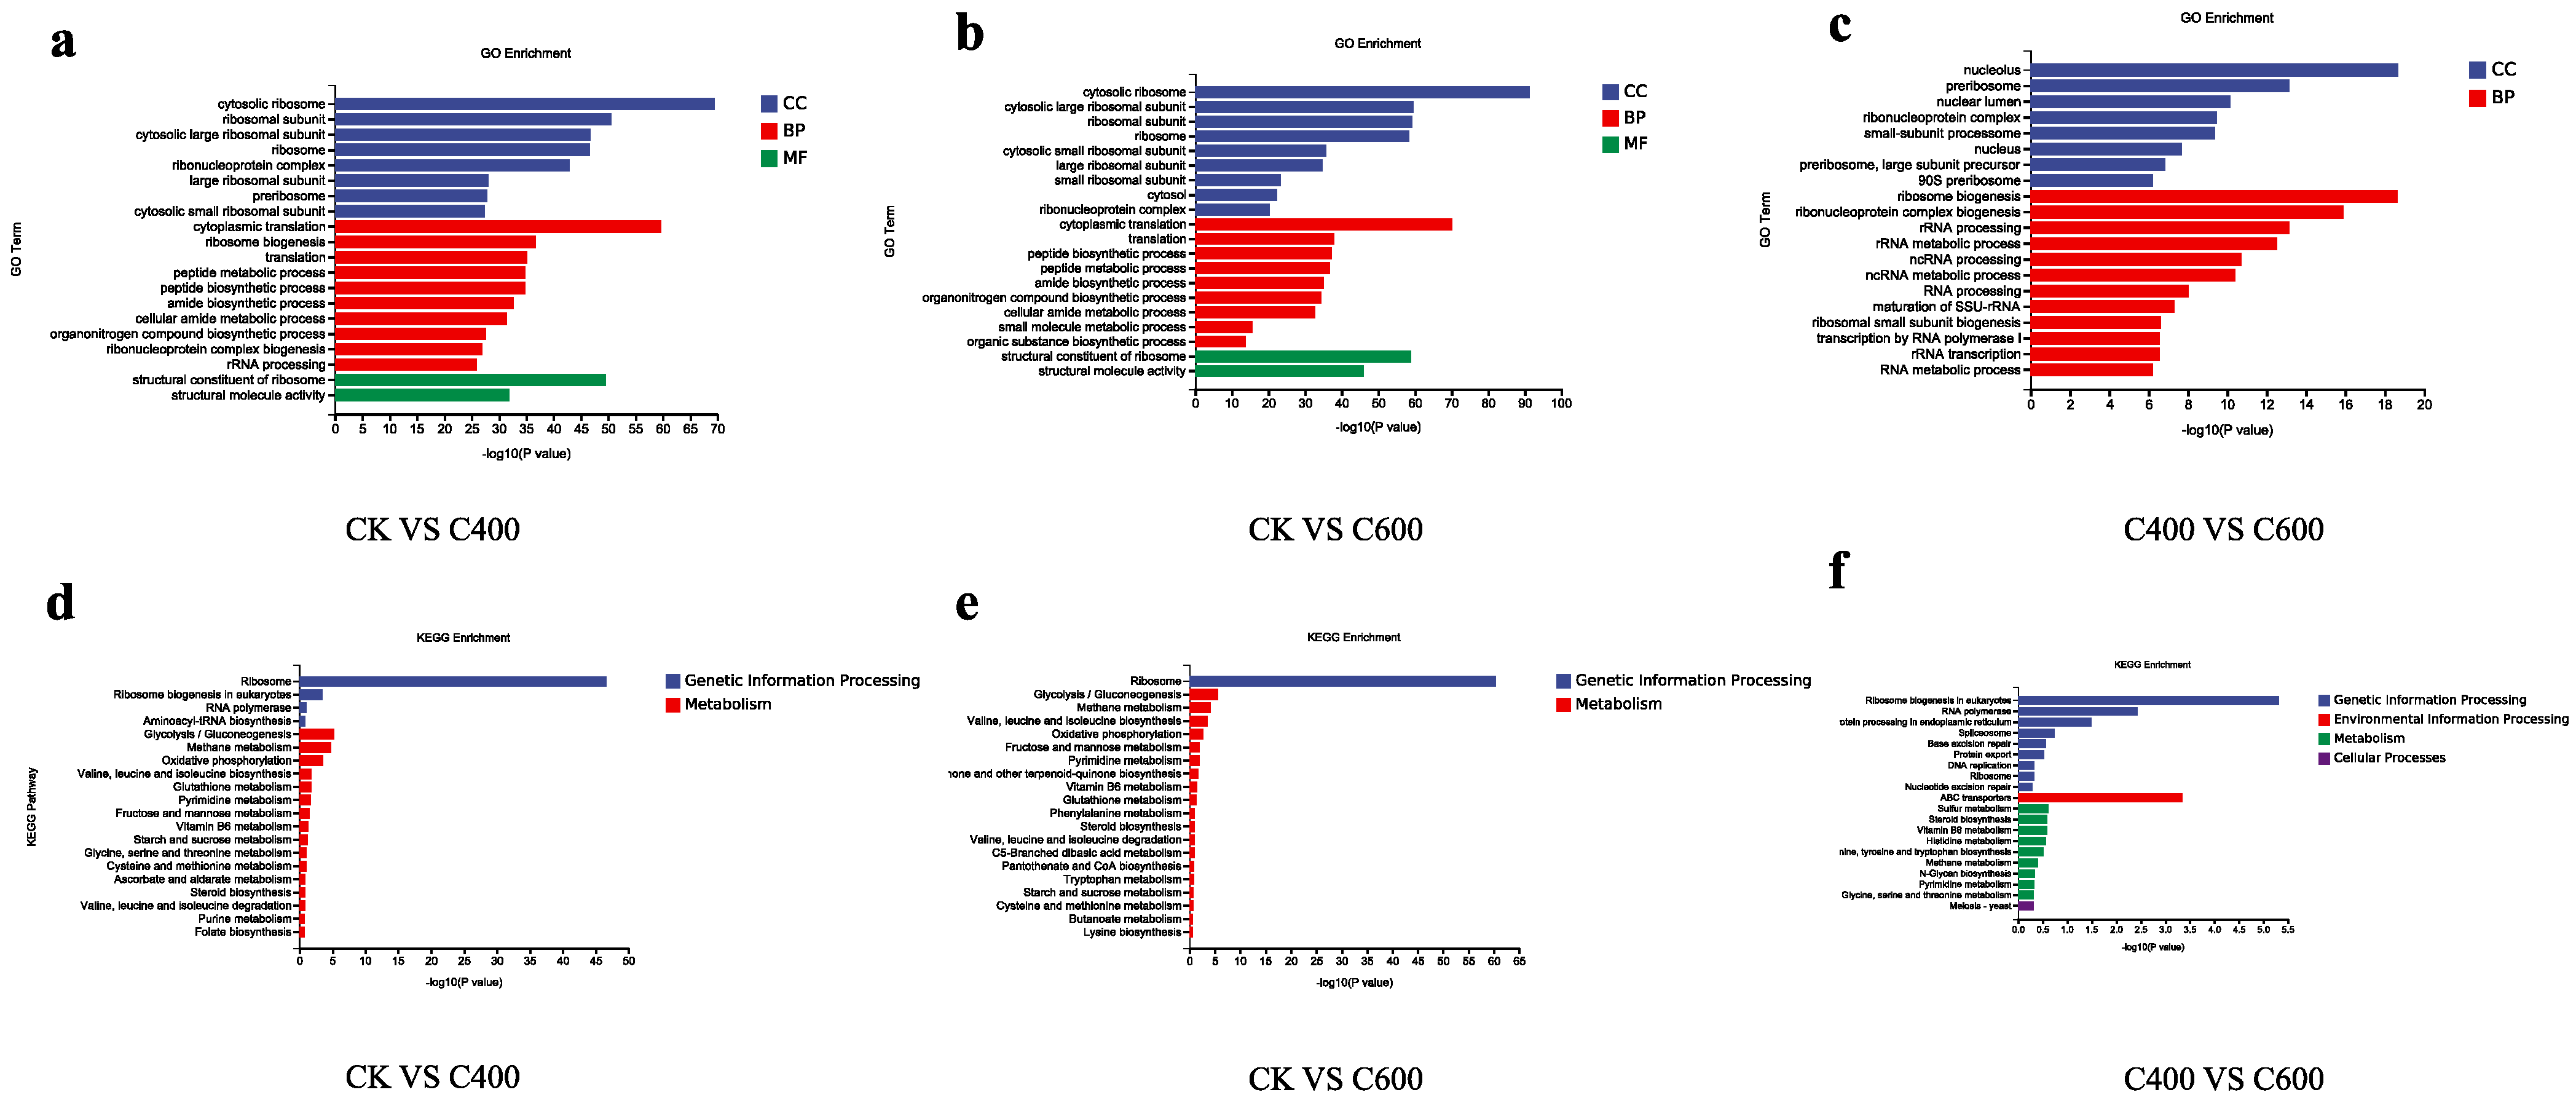
3.2.4. Functional Enrichment Analysis of Differentially Expressed Genes

The Gene Ontology (GO) functional annotation results indicate that the differentially expressed genes (DEGs) identified in S. cerevisiae CZ following octanoic acid treatment may be associated with various molecular functions (MF), cellular components (CC), and biological processes (BP). The significantly enriched GO terms demonstrate that the DEGs in S. cerevisiae CZ after octanoic acid treatment are primarily linked to ribosome structures and functions, and are involved in biological processes such as translation, ribosome biogenesis, peptide metabolism, amide metabolism, organic nitrogen biosynthesis, synthesis of ribosomal protein complexes, rRNA processing, and structural molecules and activities of ribosomes [Figure 5a–c]. These findings suggest that octanoic acid treatment may exert a significant impact on the structural integrity and functionality of ribosomes, thereby affecting ribosome-related metabolic pathways, molecular functions, and associated biological processes. These findings are consistent with previous studies that have demonstrated that stress conditions, including exposure to fatty acids, can disrupt ribosomal function and associated pathways in yeast [1,2]. The disruption or alteration of ribosomal structure and function under stress conditions could lead to impaired protein synthesis and other downstream effects, ultimately affecting overall cellular health and viability.
Furthermore, the Kyoto Encyclopedia of Genes and Genomes (KEGG) pathway-matching analysis largely corroborates the findings from the GO functional annotation. Specifically, the KEGG pathway analysis indicates that octanoic acid treatment primarily affects ribosomes and is associated with multiple metabolic pathways, including ribosome biogenesis, RNA polymerase activity, aminoacyl-tRNA biosynthesis, glycolysis, methane metabolism, pyruvate metabolism, oxidative phosphorylation, Vitamin B6 metabolism, and amino acid metabolism [Figure 5d–f]. The observed impact on ribosome biogenesis and aminoacyl-tRNA biosynthesis suggests an adaptive mechanism by which yeast cells respond to environmental stress. This adaptation may involve the upregulation of ribosomal components and tRNA charging processes to maintain protein synthesis under suboptimal conditions, thereby enhancing cellular resilience.
In summary, the comprehensive analysis of both GO functional annotations and KEGG pathways reveals that octanoic acid treatment induces significant changes in the expression profiles of genes related to ribosomal structure and function in S. cerevisiae CZ. These changes likely reflect a multifaceted response to environmental stress, involving the modulation of key metabolic pathways and molecular functions critical for cell survival and homeostasis. Understanding these mechanisms provides valuable insights into the complex interplay between environmental factors and cellular responses, paving the way for further investigations into stress adaptation strategies in yeast and potentially other eukaryotic organisms.

3.2.5. Potential Mechanisms of S. cerevisiae in Response to Octanoic Acid Stress

Octanoic acid stress activates the canonical weak acid response in S. cerevisiae, with its core mechanism involving the PDR12- and TPO1-mediated efflux system for toxic substances, which maintains cellular function by regulating intracellular pH homeostasis [11]. However, this study reveals the dynamic complexity of this system: under 400 mg/L octanoic acid stress, TPO1 exhibits specific upregulation (without differential expression of its family genes TPO2, TPO3, or TPO5), whereas this differential expression disappears at 600 mg/L (S3 DESeq_Sum). This dose-dependent characteristic suggests that TPO1 may function as the primary efflux carrier under low-concentration stress, while alternative compensatory mechanisms may be activated under high-concentration stress. Notably, the genetic background divergence between the industrial strain EC1118 used in the previous study [11] and our laboratory strain may further contribute to regulatory discrepancies.
Dynamic reprogramming of metabolic networks represents another critical strategy for yeast adaptation to octanoic acid stress. While earlier work observed the downregulation of HTX2 (a glucose transporter) and BTN2 (a v-SNARE protein) to alleviate metabolic pressure [31], our study identified contrasting expression patterns: HTX1-related genes were downregulated at 400 mg/L but upregulated at 600 mg/L (S3 DESeq_Sum). This discrepancy may stem from differences in stress duration—dynamic fermentation systems versus static stress models—highlighting the temporal dependency of metabolic regulation. Furthermore, the widespread downregulation of ribosomal protein genes (S3 DESeq_Sum) contrasts with the finding that RPL40B overexpression enhances octanoic acid tolerance, suggesting bidirectional plasticity in ribosomal function: reduced biosynthesis for energy conservation versus subunit-specific optimization for stress adaptation.
Membrane remodeling mechanisms exhibit marked strain specificity. Lipid composition remodeling theory (increasing oleic acid content) [12]receives partial support here: ACC1 showed significant downregulation at 600 mg/L, whereas some studies [18] demonstrated that Acc1S1157A mutation-enhanced oleic synthesis overrides natural regulatory constraints. Although other investigations [17] achieved improved tolerance through LEM3/SFK1 co-overexpression-driven asymmetrical remodeling of phospholipids (inner PE enrichment), SFK1 expression remained unchanged in our strain under stress. Notably, the observed downregulation of ergosterol biosynthesis genes (S3 DESeq_Sum) conflicts with membrane lipid remodeling requirements, implying dynamic balancing between sterol metabolism and fatty acid synthesis for membrane maintenance.
Substantial interstudy discrepancies exist in H+-ATPase regulation. Post-translational activation of PMA1 under low-concentration stress has been reported [10], whereas our study detected unchanged PMA1 expression but significant PMA2 downregulation at 400/600 mg/L. This contradiction likely arises from experimental design differences: chronic low-concentration exposure versus acute high-concentration challenges, potentially reflecting distinct energy allocation strategies. The reported PMA2 activation during the late exponential phase [10] starkly contrasts with its downregulation observed here, suggesting cell cycle phase- and stress duration-dependent functionality.
The current understanding of S. cerevisiae’s octanoic acid response remains fragmented due to multiple confounding factors: strain genetic backgrounds (industrial vs. laboratory), stress parameters (concentration gradients, exposure duration), and technical variations (qRT-PCR vs. RNA sequencing sensitivity). Our identification of metabolic conflicts between amino acid metabolism gene downregulation (e.g., ARO10, ARO9) and membrane remodeling demands underscores unresolved cellular trade-off mechanisms under multidimensional stress. The integration of artificial intelligence-driven multi-omics data will be pivotal for constructing dynamic gene regulatory networks, providing a systematic framework to resolve these complex interactions and advance the engineering of industrial yeast strains with enhanced octanoic acid tolerance.

4. Conclusions

This study reveals the adaptive mechanisms of S. cerevisiae CZ under octanoic acid stress, demonstrating concentration-dependent growth inhibition with 76% lethality at 800 mg/L and notable tolerance at 600 mg/L. Transcriptomic analysis identified predominant downregulation of genes, particularly those involved in ribosomal functions (translation, ribosome biogenesis) and amino acid metabolism (e.g., ARO10, ARO9). Strain-specific responses were observed: (1) TPO1-mediated efflux was active at 400 mg/L but absent at 600 mg/L, suggesting compensatory mechanisms under high stress; (2) HTX1-related genes exhibited bidirectional regulation (downregulated at 400 mg/L vs. upregulated at 600 mg/L), reflecting dynamic metabolic rewiring; (3) ACC1 downregulation at 600 mg/L and unaltered SFK1 expression contrasted with engineered lipid remodeling strategies in other strains; and (4) PMA2 downregulation diverged from literature-reported PMA1 activation, indicating strain-specific energy reallocation.
The suppression of ergosterol biosynthesis and ribosomal genes highlights a trade-off between stress adaptation and biosynthetic processes. These findings resolve contradictions in prior studies by attributing discrepancies to genetic backgrounds (industrial vs. laboratory strains) and methodological differences (static vs. dynamic systems). S. cerevisiae CZ’s exceptional tolerance likely arises from its unique integration of membrane homeostasis (via lipid balance) and metabolic conservation, distinguishing it from engineered strains reliant on phospholipid asymmetry or oleic acid overproduction. This work underscores the critical role of strain-specific regulatory networks in octanoic acid resistance and provides a foundation for optimizing industrial yeast through targeted engineering of membrane stability and metabolic flexibility. Future studies should leverage multi-omics integration to decode the dynamic gene regulatory logic underlying these adaptive mechanisms.

Supplementary Materials

The following supporting information can be downloaded at: https://www.mdpi.com/article/10.3390/fermentation11040180/s1. S1: S1 CK_vs_C400.DESeq; S2: S2 CK_vs_C600.DESeq; S3: S3 DESeq_Sum.

Author Contributions

Conceptualization, Z.-H.Y. and M.-Z.H.; methodology—preparation of yeast sample for transcriptomic sequence, M.-Z.S.; methodology—tolerance analysis and traits analysis for winemaking, W.-X.D.; data curation, Z.-H.Y.; writing—original draft preparation, Z.-H.Y.; writing—review and editing, Z.-H.Y.; visualization, X.-Z.L. and W.-Y.T. All authors have read and agreed to the published version of the manuscript.

Funding

This research was supported by Guizhou Provincial Basic Research Program (Natural Science), Grant/Award Number: Qiankehejichu MS[20259]195, Guizhou Fruit Wine Brewing Engineering Research Center (Qianjiaoji (2022)050), Guizhou Provincial Key Technology R&D Program (No. [2023] 069), Guizhou Provincial Science and Technology Department (KXJZ[2024]021), and Guizhou Provincial Science and Technology Foundation ([2024]512).

Institutional Review Board Statement

Not applicable.

Informed Consent Statement

Not applicable.

Data Availability Statement

The original contributions presented in this study are included in the article/Supplementary Material. Further inquiries can be directed to the corresponding authors.

Acknowledgments

We are deeply grateful to Ye-Xin Yuan, Mei-Xing Zhang, Hong-Wei Wang, Xiao-Lang Wang, and Ting Tian for their assistance during the experimental process.

Conflicts of Interest

The authors declare no conflicts of interest.

References

  1. Vanderwaeren, L.; Dok, R.; Voordeckers, K.; Nuyts, S.; Verstrepen, K.J. Saccharomyces cerevisiae as a model system for eukaryotic cell biology, from cell cycle control to DNA damage response. Int. J. Mol. Sci. 2022, 23, 11665. [Google Scholar] [CrossRef] [PubMed]
  2. Jouhten, P.; Ponomarova, O.; Gonzalez, R.; Patil, K.R. Saccharomyces cerevisiae metabolism in ecological context. FEMS Yeast Res. 2016, 16, fow080. [Google Scholar] [PubMed]
  3. Nielsen, J. Yeast systems biology: Model organism and cell factory. Biotechnol. J. 2019, 14, e1800421. [Google Scholar]
  4. Berłowska, J.; Pielech-Przybylska, K.; Balcerek, M.; Dziekońska-Kubczak, U.; Patelski, P.; Dzi-ugan, P.; Kręgiel, D. Simultaneous Saccharification and fermentation of sugar beet pulp for efficient bioethanol production. Biomed. Res. Int. 2016, 2016, 3154929. [Google Scholar]
  5. Tao, Z.; Yuan, H.; Liu, M.; Liu, Q.; Zhang, S.; Liu, H.; Jiang, Y.; Huang, D.; Wang, T. Yeast extract: Characteristics, production, applications and future perspectives. J. Microbiol. Biotechnol. 2023, 33, 151–166. [Google Scholar]
  6. Wang, Z.; Zhang, R.; Yang, Q.; Zhang, J.; Zhao, Y.; Zheng, Y.; Yang, J. Recent advances in the biosynthesis of isoprenoids in engineered Saccharomyces cerevisiae. Adv. Appl. Microbiol. 2021, 114, 1–35. [Google Scholar]
  7. Kang, N.K.; Lee, J.W.; Ort, D.R.; Jin, Y.S. L-malic acid production from xylose by engineered Saccharomyces cerevisiae. Biotechnol. J. 2022, 17, e2000431. [Google Scholar]
  8. Swamy, K.B.S.; Zhou, N. Experimental evolution: Its principles and applications in developing stress-tolerant yeasts. Appl. Microbiol. Biotechnol. 2019, 103, 2067–2077. [Google Scholar] [PubMed]
  9. Cabral, M.G.; Viegas, C.A.; Sá-Correia, I. Mechanisms underlying the acquisition of resistance to octanoic-acid-induced-death following exposure of Saccharomyces cerevisiae to mild stress imposed by octanoic acid or ethanol. Arch. Microbiol. 2001, 175, 301–307. [Google Scholar]
  10. Viegas, C.A.; Supply, P.; Capieaux, E.; Van Dyck, L.; Goffeau, A.; Sá-Correia, I. Regulation of the expression of the H(+)-ATPase genes PMA1 and PMA2 during growth and effects of octanoic acid in Saccharomyces cerevisiae. Biochim. Biophys. Acta 1994, 1217, 74–80. [Google Scholar]
  11. Legras, J.L.; Erny, C.; Le Jeune, C.; Lollier, M.; Adolphe, Y.; Demuyter, C.; Delobel, P.; Blondin, B.; Karst, F. Activation of two different resistance mechanisms in Saccharomyces cerevisiae upon exposure to octanoic and decanoic acids. Appl. Environ. Microbiol. 2010, 76, 7526–7535. [Google Scholar] [CrossRef] [PubMed]
  12. Liu, P.; Chernyshov, A.; Najdi, T.; Fu, Y.; Dickerson, J.; Sandmeyer, S.; Jarboe, L. Membrane stress caused by octanoic acid in Saccharomyces cerevisiae. Appl. Microbiol. Biotechnol. 2013, 97, 3239–3251. [Google Scholar] [PubMed]
  13. Rajvanshi, P.K.; Arya, M.; Rajasekharan, R. The stress-regulatory transcription factors Msn2 and Msn4 regulate fatty acid oxidation in budding yeast. J. Biol. Chem. 2017, 292, 18628–18643. [Google Scholar] [CrossRef]
  14. Zhang, X.; Nijland, J.G.; Driessen, A.J.M. Combined roles of exporters in acetic acid tolerance in Saccharomyces cerevisiae. Biotechnol. Biofuels Bioprod. 2022, 15, 67. [Google Scholar] [CrossRef]
  15. Guirimand, G.; Kulagina, N.; Papon, N.; Hasunuma, T.; Courdavault, V. Innovative tools and strategies for optimizing yeast cell factories. Trends Biotechnol. 2021, 39, 488–504. [Google Scholar] [CrossRef]
  16. Zhang, Z.; Lan, Q.; Yu, Y.; Zhou, J.; Lu, H. Comparative metabolome and transcriptome analyses of the properties of Kluyveromyces marxianus and Saccharomyces yeasts in apple cider fermentation. Food Chem. 2022, 4, 100095. [Google Scholar] [CrossRef]
  17. Liu, H.; Yuan, W.; Zhou, P.; Liang, G.; Gao, C.; Guo, L.; Hu, G.; Song, W.; Wu, J.; Chen, X.; et al. Engineering membrane asymmetry to increase medium-chain fatty acid tolerance in Saccharomyces cerevisiae. Biotechnol. Bioeng. 2022, 119, 277–286. [Google Scholar] [CrossRef]
  18. Besada-Lombana, P.B.; Fernandez-Moya, R.; Fenster, J.; Da Silva, N.A. Engineering Saccharomyces cerevisiae fatty acid composition for increased tolerance to octanoic acid. Biotechnol. Bioeng. 2017, 114, 1531–1538. [Google Scholar] [CrossRef] [PubMed]
  19. Yu, Z.; Yue, L.; Wang, Q.; Wu, J.; Zhong, X.; Liu, X.; Huang, M. Identification and brewing potential of a Saccharomyces cerevisiae strain from Rosa roxbunghii. Food Ferment. Indu. 2022, 48, 70–75. (In Chinese) [Google Scholar]
  20. Yu, Z.-H.; Huang, G.-D.; Huang, X.Y.; Pu, J.H.; Wu, J.S.; Yue, L.R.; Hardie, W.J.; Liu, X.Z.; Huang, M.Z. A Comparative Study of Yeasts for Rosa roxburghii Wine Fermentation. Fermentation 2022, 8, 311. [Google Scholar] [CrossRef]
  21. Li, Y.; Long, H.; Jiang, G.; Gong, X.; Yu, Z.; Huang, M.; Guan, T.; Guan, Y.; Liu, X. Analysis of the ethanol stress response mechanism in Wickerhamomyces anomalus based on transcriptomics and metabolomics approaches. BMC Microbiol. 2022, 22, 275. [Google Scholar]
  22. Chen, S.; Li, Y.; Wu, E.; Li, Q.; Xiang, L.; Qi, J. Arctigenin from Fructus arctii exhibits antiaging effects via autophagy induction, antioxidative stress, and increase in telomerase activity in yeast. Antioxidants 2024, 13, 684. [Google Scholar] [CrossRef] [PubMed]
  23. Grigore, D.; Meade, J.C. Functional complementation of the yeast P-type H-ATPase, PMA1, by the Pneumocystis carinii P-type H-ATPase, PCA1. J. Eukaryot. Microbiol. 2006, 53, 157–164. [Google Scholar] [PubMed]
  24. Viegas, C.A.; Rosa, M.F.; Sá-Correia, I.; Novais, J.M. Inhibition of yeast growth by octanoic and decanoic acids produced during ethanolic fermentation. Appl. Environ. Microbiol. 1989, 55, 21–28. [Google Scholar] [CrossRef]
  25. Borrull, A.; López-Martínez, G.; Poblet, M.; Cordero-Otero, R.; Rozès, N. New insights into the toxicity mechanism of octanoic and decanoic acids on Saccharomyces cerevisiae. Yeast 2015, 32, 451–460. [Google Scholar]
  26. Viegas, C.A.; Almeida, P.F.; Cavaco, M.; Sá-Correia, I. The H(+)-ATPase in the plasma membrane of Saccharomyces cerevisiae is activated during growth latency in octanoic acid-supplemented medium accompanying the decrease in intracellular pH and cell viability. Appl. Environ. Microbiol. 1998, 64, 779–783. [Google Scholar]
  27. Mohideen, K.; Chandrasekar, K.; Ramsridhar, S.; Rajkumar, C.; Ghosh, S.; Dhungel, S. Assessment of oxidative stress by the estimation of lipid peroxidation marker malondialdehyde (MDA) in patients with chronic periodontitis: A systematic review and meta-analysis. Int. J. Dent. 2023, 2023, 6014706. [Google Scholar]
  28. Gerçek, E.; Zengin, H.; Erdem Erişir, F.; Yılmaz, Ö. Biochemical changes and antioxidant capacity of naringin and naringenin against malathion toxicity in Saccharomyces cerevisiae. Comp. Biochem. Physiol. C Toxicol. Pharmacol. 2021, 241, 108969. [Google Scholar]
  29. James, T.C.; Campbell, S.; Donnelly, D.; Bond, U. Transcription profile of brewery yeast under fermentation conditions. J. Appl. Microbiol. 2003, 94, 432–448. [Google Scholar]
  30. Li, P.; Fu, X.; Chen, M.; Zhang, L.; Li, S. Proteomic profiling and integrated analysis with transcriptomic data bring new insights in the stress responses of Kluyveromyces marxianus after an arrest during high-temperature ethanol fermentation. Biotechnol. Biofuels 2019, 12, 49. [Google Scholar]
  31. Baumann, L.; Doughty, T.; Siewers, V.; Nielsen, J.; Boles, E.; Oreb, M. Transcriptomic response of Saccharomyces cerevisiae to octanoic acid production. FEMS Yeast Res. 2021, 21, foab011. [Google Scholar] [CrossRef] [PubMed] [PubMed Central]
Figure 1. Morphological Changes and Growth Dynamics of S. cerevisiae CZ Under Octanoic Acid Stress: (a) Morphological Changes at 0 h: Morphological appearance of S. cerevisiae CZ colonies treated with different concentrations of octanoic acid for 0 h at 30 °C. (b) Morphological Changes at 6 h: Morphological appearance of S. cerevisiae CZ colonies treated with different concentrations of octanoic acid for 6 h at 30 °C. (c) Fatality Rates: Quantification of the lethality of S. cerevisiae CZ at different octanoic acid concentrations after 0 and 6 h of treatment. (d) Growth Curves: Growth dynamics of S. cerevisiae CZ under varying octanoic acid concentrations over time.
Fermentation 11 00180 g001
Figure 2. H+/K+-ATPase Activity (a) and Malondialdehyde Content (b) in S. cerevisiae CZ treated with Octanoic Acid at different concentrations. Note: Different letters denote significant differences at p < 0.05.
Fermentation 11 00180 g002
Figure 3. Upset Analysis (a), PCA Analysis (b), and Correlation Analysis (c) of Gene Expression: (a) Upset plot illustrating the number of genes uniquely or jointly expressed across different samples. (b) Principal Component Analysis (PCA) plot showing the distribution of samples based on gene expression levels. (c) Heatmap representing the correlation coefficients between biological replicate samples. C1_1, C1_2, and C1_3 represent the triplicate biological replicates of the control group (CK), while C2_1, C2_2, and C2_3 correspond to the 400 mg/L octanoic acid treatment group (C400), and C3_1, C3_2, and C3_3 represent the 600 mg/L octanoic acid treatment group (C600).
Fermentation 11 00180 g003
Figure 4. Analysis of Differential Gene Expression Levels: (a) Volcano plot depicting the log2 (fold change) vs. −log10 p-value for differentially expressed genes between control and octanoic acid-treated samples (400 and 600 mg/L). (b) Upset plot illustrating the number of upregulated and downregulated genes between the 400 mg/L and 600 mg/L octanoic acid treatment groups. (c) Venn diagram showing the overlap of differentially expressed genes among the control (CK), 400 mg/L (C400), and 600 mg/L (C600) octanoic acid treatments.
Fermentation 11 00180 g004
Figure 5. GO Analysis (ac) and KEGG Analysis (df) of Differentially Expressed Genes: (ac) GO enrichment analysis depicting the top enriched terms in molecular function (MF), cellular component (CC), and biological process (BP) categories. (df) KEGG pathway enrichment analysis showing the top enriched pathways related to the differentially expressed genes.
Fermentation 11 00180 g005
Table 1. Quality analysis of transcriptome sequencing data of S. cerevisiae CZ under octanoic acid stress.
TreatmentRaw ReadsRaw BasesClean ReadsUseful Reads %
0 mg/L37,637,3085,683,233,50835,536,03494.41 ± 0.03
400 mg/L42,983,2176,490,465,81740,496,29394.21 ± 0.08
600 mg/L38,825,7465,862,687,74736,624,44594.33 ± 0.08
TreatmentUseful bases %Clean basesQ20%Q30%
0 mg/L94.41 ± 0.035,365,941,13498.17 ± 0.2694.41 ± 0.68
400 mg/L94.21 ± 0.086,114,940,29398.04 ± 0.2194.09 ± 0.60
600 mg/L94.33 ± 0.085,530,291,24598.04 ± 0.2794.02 ± 0.72
Disclaimer/Publisher’s Note: The statements, opinions and data contained in all publications are solely those of the individual author(s) and contributor(s) and not of MDPI and/or the editor(s). MDPI and/or the editor(s) disclaim responsibility for any injury to people or property resulting from any ideas, methods, instructions or products referred to in the content.

