Article

From Raw Milk Microbiome to Cheese: The Challenge of Indigenous Natural Starter Culture Exploitation

Agris Sardegna, Servizio Ricerca Prodotti di Origine Animale, Associated Member of the JRU MIRRI-IT, Loc. Bonassai SS 291 km 18.600, 07100 Sassari, Italy
*
Author to whom correspondence should be addressed.
Fermentation 2025, 11(12), 660; https://doi.org/10.3390/fermentation11120660
Submission received: 20 October 2025 / Revised: 19 November 2025 / Accepted: 19 November 2025 / Published: 25 November 2025
(This article belongs to the Special Issue Development and Application of Starter Cultures, 2nd Edition)

Abstract

A freeze-dried natural starter culture (NSC) was developed and assessed for its suitability in producing a semi-cooked, 60-day-ripened cheese resembling the protected designation of origin (PDO) Pecorino Sardo. The culture, derived from raw ewe’s milk from a dairy farm involved in the study, without thermal decontamination to preserve indigenous microbiota, was enriched with two strain-level-characterised, biodiverse mixtures of Streptococcus thermophilus (Str-mix) and Lactobacillus delbrueckii (Lb-mix). This study evaluated the technological robustness and adaptability of NSC enriched with biodiverse Str-mix and Lb-mix across three different artisanal dairy-processing environments with varying milk compositions and equipment levels at plants located in different geographic areas. During cheesemaking, technological, physico-chemical, and compositional parameters were monitored, along with microbial characterisation of milks and 1-day cheeses. After 60 days of ripening, cheeses were characterised from the microbiological, physico-chemical, and compositional perspectives. Furthermore, nutritional labelling was established, and consumer acceptance was determined. Results showed that the starter (NSC + Str-mix + Lb-mix) demonstrated strong and reproducible technological performance in all dairies, regardless of the milk’s chemical and microbial composition variability. Sensory quality was preserved in cheeses ripened for up to 180 days. These preliminary findings seem to support the use of freeze-dried, raw-milk-derived natural cultures in artisanal cheesemaking as a way to preserve microbial diversity and to reconnect with traditional practices that enhance both the tangible and intangible assets of modern society.

1. Introduction

In cheese manufacturing, starter cultures play a fundamental role in acidifying milk, promoting coagulation, extending shelf life, and enhancing the sensory characteristics of the final products. These cultures are primarily composed of homo- and hetero-fermentative lactic acid bacteria (LAB), which can be mesophilic or thermophilic depending on the specific transformation technology employed. Historically, the knowledge of fermentation processes was transmitted empirically, leading to a wide variety of fermented products differing in microbial composition, nutritional value, and sensory properties. Over the past decades, the use of starter cultures has become widespread in both industrial and artisanal settings due to their ability to predictably control fermentation processes, ensuring technological success and also maintaining consistent sensory attributes in the final products [1,2]. From a microbiological perspective, natural cultures, which are different from selected ones, are often associated with artisanal or protected designation of origin (PDO) production and originate from the microbiota present in raw milk and the production environment [3]. These complex cultures consist of an undefined number of species and strains that coexist in equilibrium, whose unique composition cannot be replicated outside their native environment. They can evolve according to the traditional fermentation techniques, thereby imparting distinctive sensory traits to products typical of specific geographical regions [4,5,6]. In particular, the use of natural starter cultures derived from raw ewe’s milk, which include both starter and non-starter LAB (NSLAB), as observed in many Mediterranean PDO cheeses, contributes to preserving the unique sensory profiles and microbial biodiversity that define these traditional products [7,8,9]. This microbial complexity is essential for maintaining the typicity and the cultural heritage embedded in artisanal cheesemaking practices, which rely heavily on indigenous microbiota to drive fermentation and flavour development [10]. The high biodiversity of natural starter cultures offers advantages such as complementary metabolic pathways among bacterial strains and resistance to bacteriophage infections, thus eliminating the need for culture rotation typically required in industrial settings that use commercial starter cultures composed of a limited number of selected strains [11]. Furthermore, natural cultures are often better adapted to the raw materials and local environmental conditions, which can enhance fermentation robustness and product authenticity [12]. However, natural cultures exhibit variability in their species and strain composition over successive reproduction cycles. If not properly managed, this variability can lead to inconsistencies in technological performance or defects in the final product. In contrast, selected starter cultures are microbiologically simplified, consisting of defined species and strains chosen for their ability to perform specific biochemical processes required by transformation technologies. Each strain is grown separately under controlled conditions, possibly blended with other strains as needed, depending on the intended culture composition, and preserved at high concentrations, typically in freeze-dried form. Because of their consistent performance, operational reliability, and ability to standardise product quality, selected starters are widely used across different geographical regions and product types [2,4,13,14]. However, the dominance of commercial starter strains over natural microbiota, after repeated use, can reduce the microbial biodiversity of processing environments, which is crucial for maintaining product typicity and culture identity. To address this issue, natural cultures with desirable technological traits, such as strong acidification capacity, can be collected and freeze-dried in toto without altering the balance between species and strains. This approach preserves microbial diversity while ensuring technological functionality [5,11]. Despite the advantages of natural starter cultures, their industrial application faces challenges related to standardisation and reproducibility, and the variable composition of natural cultures can lead to inconsistent technological performance across different production environments [15]. Therefore, evaluating the robustness of natural starter cultures under diverse processing conditions is crucial for their successful implementation in artisanal cheese production. Studies that address this knowledge gap by assessing the technological stability of a characterised natural starter culture across different dairy environments are currently lacking. Additionally, local dairy factories could consider producing natural starter cultures onsite to further support artisanal practices, while preserving local tradition and product quality. The aim of this study was to evaluate the technological performance of a freeze-dried natural starter culture (NSC) previously derived from raw ewe milk and characterised for microbiological composition and safety [16,17], supplemented with a biodiverse mixture of wild strains belonging to Streptococcus thermophilus (Str-mix) and Lactobacillus delbrueckii (Lb-mix), creating the combined culture (NSC + Str-mix + Lb-mix). The technological performance during the production and ripening of a semi-cooked ewe’s milk cheese resembling mature Pecorino Sardo PDO was monitored in both artisanal and pilot-scale dairies, which differed in their instrumental equipment levels and were located in different geographic areas of Sardinia (Italy). A multidisciplinary approach, including microbiological and nutritional analyses, residual lactose content, and sensory evaluation of the resulting cheeses, was adopted.

2. Materials and Methods

2.1. Experimental Plan

A natural starter culture (NSC), obtained in a previous study [17] from raw ewe’s milk and characterised for its biodiversity and safety [16], was investigated in this study for its technological stability in artisanal cheese manufacturing in different dairy plant environments. To enhance acidification during cheesemaking, the NSC was combined with two biodiverse mixtures of indigenous Streptococcus thermophilus (Str-mix) and Lactobacillus delbrueckii (Lb-mix), each characterised at the strain-level in this study. Several S. thermophilus and L. delbrueckii strains were isolated from a secondary natural starter culture (SNSC) collected at a local dairy farm distinct from the one supplying the raw milk used for obtaining the NSC. The resulting culture (NSC + Str-mix + Lb-mix) was freeze-dried and assessed for its effectiveness in producing a semi-cooked ewe’s milk cheese at three different dairies, two artisanal facilities (A and B), and at the pilot-scale dairy plant of the Agris Sardegna research centre (C). These sites were specifically selected to assess the robustness and adaptability of the starter culture both under authentic, variable artisanal production conditions (A and B), and under standardised technological settings (C), with the aim of characterising the culture rather than comparing its performance with a commercial starter. The cheesemaking technology applied was similar to that used for the production of the Pecorino Sardo mature PDO cheese. In total, nine cheesemaking trials were conducted, consisting of three independent processes on separate days at each of the three dairies involved. The milks used were analysed for microbiological and chemical parameters to determine their microbial composition, starter inoculum levels, and gross composition. Cheeses were examined for their microbial profile after 24 h and at 60 days of ripening. Nutritional characterisation, including residual lactose content, was also performed. Additionally, a consumer study was carried out on cheeses ripened for 60 and 180 days to assess consumers’ acceptability and sensory characteristics.

2.2. Identification and Biodiversity Evaluation of Bacterial Isolates for Str-Mix and Lb-Mix Preparation

In the present study, from the SNSC, several colonies were picked up from the 10−4 dilution (the lowest countable) of each agar plates of M17 medium (Biolife Italiana, Milan, Italy) incubated at 30 °C and 45 °C for 72 and 48 h, and from MRS medium (Biolife Italiana) at pH 5.4, incubated at 45 °C for 48–72 h, and purified by three sequential passages on the agar medium of origin to obtain cocci and lactobacilli starter strains. The morphology of the isolates was also examined using an Axio-Phot optical microscope (Carl Zeiss, Oberkochen, Germany) equipped with Objective EC Plan-Neofluar 1009/1.30 OilPol M27 (Carl Zeiss, Oberkochen, Germany). The isolates were characterised at the species level using a multiplex PCR assay following the protocol described by Cremonesi et al. [18]. Molecular genotyping of the isolates was performed by (GTG)5 rep-PCR microbial fingerprint, as described by Chessa et al. [19], using an FTA® Disc for DNA analysis (GE Healthcare, Chicago, IL, USA) as a template. PCR products were separated on 1.8% (w/v) agarose gel with 1× SYBR Safe (Invitrogen—Thermo Fisher Scientific, Waltham, MA, USA) at 100 V (222 V/h) in Tris-acetate buffer.

2.3. Starter Culture Preparation and Cheesemaking

The starter used was a biodiverse culture obtained by combining a natural starter culture (NSC) with two mixtures of strains belonging to the species Streptococcus thermophilus (Str-mix) and Lactobacillus delbrueckii (Lb-mix). Str-Mix and Lb-Mix were composed of S. thermophilus and L. delbrueckii strains in equal proportions.
In particular, as previously described by Chessa et al. [17], to obtain the NSC, raw ewe’s milk aliquots were plated on acidified whey agar and, after anaerobic incubation, the agar was transferred to sterile whey broth for enrichment and then used to inoculate sterile ewe’s milk. The milk was incubated at 37 °C with continuous acidification monitoring until coagulation. Fermented milk was checked for coliforms and inoculated again in milk to obtain, after coagulation, the natural starter culture (NSC). The three cultures (NSC, Str-mix, and Lb-mix), freeze-dried by Veneto Agricoltura (Thiene, Italy) as an external service, had a microbial concentration of 9.3 Log CFU/g (count in MPCA medium incubated at 37 °C, in aerobiosis) for NSC, and 9.7 Log CFU/g for both Str-mix and Lb-mix (count in M17 agar and MRS agar pH 5.4, respectively, incubated at 37 °C, in anaerobiosis). Cheesemaking trials were performed in three dairy facilities. Dairies A and B, located in different geographical areas and diversely equipped and structured, operate at an artisanal level, relying on manual or semi-automated processes with limited environmental control in the cheese-ripening phase. On the other hand, dairy C, the dairy plant for the Agris Sardegna research centre, is more structured, with advanced milk temperature and heating control and a thermally insulated and humidity-controlled ripening room, ensuring optimal ripening conditions. A total of nine cheesemakings were carried out, three for each dairy, in three distinct days, transforming, overall, 660 L of milk (100 L for each cheesemaking day in dairy A, and 60 L in dairies B and C), applying the technological cheesemaking scheme shown in Figure 1. Dairy B and C processed whole, refrigerated ewe’s milk, obtained from two milkings (evening and morning), while dairy A processed whole, unrefrigerated ewe’s milk, obtained from one milking (morning). The freeze-dried starter culture, obtained by combining the NSC with Str-mix and Lb-mix in equal parts, was resuspended in sterile physiological solution for 30 min before being added at ~38 °C to thermised milk (heated to 68 °C without holding time and then immediately cooled to the coagulation temperature) to achieve a final concentration of 6.2 Log CFU/mL. The inoculated milk was maintained at a constant temperature and stirred for 10 min to promote bacterial hydration and reactivation. Milk was then processed using a technology similar to that employed for Pecorino Sardo Maturo PDO cheese. The cheeses were salted in brine. The duration of the salting process was predetermined by applying a formula derived from an equation on salt diffusion in cheese, which takes into account cheese volume, surface area, brine concentration, and the salt diffusion coefficient [20]. The calculation was based on a diffusion coefficient of 0.14 cm2/day and a salt-to-moisture content of 4%. After salting, the cheeses were washed, dried, and transferred to the ripening process. Cheese yields were calculated using different methods to account for variations in milk composition and cheese moisture content. The actual yield (YA) was expressed as the kilograms of 1-day cheese obtained per 100 kg of milk. The normalised yield (YAN) was adjusted for milk fat and protein content, using average reference values of 5.32% fat and 5.19% protein to standardise for compositional differences in milk [21]. Additionally, the moisture-adjusted actual yield (YAM) and the moisture-adjusted normalised yield (YANM) were calculated by standardising cheese moisture at 43%, enabling direct comparisons among cheeses with different moisture levels [15]. To estimate the expected cheese yield (YP), the yield prediction model developed for Pecorino Sardo mature PDO cheese was applied [22]. This model utilises milk fat and protein content to predict cheese yield (expressed as kilograms of cheese per kilogram of milk). Finally, fat recovery (FR) and protein recovery (PR) were determined, expressed as the ratio between the total amount (kg) of fat and protein recovered in 1-day cheese and their respective total amounts in processed milk.

2.4. Microbial Analysis

Microbial counts for raw, thermised, and inoculated milk, and also for 1-day cheeses, and 60-day-ripened cheeses were performed by spreading 0.1 mL of each serial 10-fold dilution onto different agar media plates: presumptive mesophilic cocci on M17 agar (Biolife Italiana, Milan, Italy) incubated at 22 °C for 72 h in aerobiosis; presumptive thermophilic cocci on M17 agar incubated at 45 °C for 48 h in anaerobiosis (using Oxoid™ AnaeroGen™, Thermo Fisher Scientific, Waltham, MA, USA); presumptive mesophilic lactobacilli on FH (facultative heterofermentative) agar [23] incubated at 37 °C for 72 h in anaerobiosis; presumptive thermophilic lactobacilli on modified MRS (de Man, Rogosa and Sharpe; Biolife Italiana) agar pH 5.4 [23] incubated at 45 °C for 48–72 h in anaerobiosis; citrate-fermenting bacteria on modified MRS agar (by replacing the standard 20 g/L of glucose with 5 g/L of glucose and 19 g/L of calcium citrate) [24] incubated at 37 °C for 72 h in anaerobiosis; mould and yeasts on MEA (malt extract agar; VWR Chemicals BDH® Avantor, Milan, Italy) incubated at 25 °C for 3–5 days in aerobiosis; staphylococci on MSA (mannitol salt agar; Biolife Italiana) at 37 °C for 24–48 h in aerobiosis; enterococci on KAA (kanamycin aesculin azide; Biolife Italiana) agar incubated at 42 °C for 24 h in aerobiosis; and coliforms on VRBA mug (violet red bile agar with 4-methylumbelliferyl-β-D-glucuronide; VWR Chemicals BDH® Avantor) incubated at 37 °C for 18–24 h in aerobiosis. In thermised milk, the most probable number (MPN) of presumptive propionic acid bacteria and clostridia, in RCM-lactate (reinforced clostridial medium; Biokar Diagnostics, Allonne, France) and Buti media (Biolife Italiana), respectively, incubated at 37 °C for 7 days, was also evaluated. For the enumeration of clostridia, samples were pre-treated at 80 °C for 15 min. Microbial counts were expressed as average values of CFU/mL or Log CFU/g, depending on the substrate. The selectivity of each culture medium was confirmed by microscopic observation of ten randomly selected colonies per plate to verify that their cellular morphology corresponded to the target microbial group.

2.5. Chemical Analysis

2.5.1. Milk

Samples of thermised milk were analysed for pH, total solids, fat, proteins, casein, and lactose content. The pH was measured using a Crison Basic 20 + pH-meter (Crison Instruments S.A., Alella, Spain); total solids were determined according to ISO 6731:2010 [IDF 21:2010] [25]; fat, proteins, and casein determination, and lactose content were carried out using a Milkoscan FT+ (Foss, Hillerød, Denmark).

2.5.2. Cheeses

Cheese samples at 1-day and 60 days of ripening were analysed for pH, dry matter (DM; ISO 5534:2004 [IDF 4:2004] [26]), fat [27], and total nitrogen (TN; ISO 8968-1:2014 [IDF 20-1:2014] [28]). The protein content in cheese was calculated as follows: protein = [(TN) × 6.38]. Sodium chloride was determined by potentiometric titration with AgNO3 [29] using an automatic titrator, Mettler-Toledo DL55 (Mettler-Toledo GmbH, Schwerzenbach, Switzerland). The residual lactose content was determined according to Idda et al. [30]. To determine the fatty acid profile, cheese fat extraction was performed according to the method of Jiang et al. [31]. Briefly, 3 g aliquots of cheese were suspended in 10 mL of deionized water and 18 mL of isopropanol. After vigorous shaking, the mixture was supplemented with 13 mL of n-hexane and homogenised using an Ultra–Turrax (T 25 Basic, IKA WERKE, Staufen, Germany) for 3 min at 13,500 rpm. The suspension was then centrifuged (1094× g) for 10 min at 4 °C, and the upper organic layer was transferred to a glass test tube. The lower aqueous layer was extracted twice more, with 13 mL of n-hexane each time, and the organic supernatants, after suspension centrifugation, were pooled with the previous hexane layer. The pooled hexane layer was evaporated with a rotary evaporator at 30 °C. The extracted fat was stored at −20 °C until further analysis. Fatty acid methyl esters (FAMEs) were obtained from 50 mg of cheese fat trans-methylated according to the ISO 15884:2002 [IDF 182:2002] [32] and then analysed through GC-FID, as described by Caredda et al. [33]. The amount of alpha-tocopherol (Vitamin E), total retinol (Vitamin A), and total cholesterol in the cheese samples was determined by reversed-phase HPLC methods of Panfili et al. [34] and Manzi et al. [35]. Lipolysis in cheeses was monitored by determining individual free fatty acid (FFA) levels, as previously described by Addis et al. [36]. Proteolysis in cheeses was assessed through the determination of nitrogen (N) fractions: soluble N at pH 4.6, soluble N in 12% trichloroacetic acid (SN-TCA), and soluble N in 10% phosphotungstic acid (SN-PTA), as described by Gripon et al. [37].

2.6. Consumer Study

The consumer study was conducted with adult volunteers who were regular consumers of fermented products. The study followed institutional and international guidelines for low-risk sensory research [38]. Participants were informed in advance about the nature of the study, the voluntary and anonymous character of their participation, and the presence of any potential allergens contained in the samples. All samples were microbiologically safe and had been previously verified and approved by qualified food microbiologists, in accordance with IFST recommendations. The products were food-grade and considered safe for consumption (GRAS status). Participants evaluated the samples anonymously using standardised questionnaires, and no sensitive personal data were collected, in full compliance with the principles of the European General Data Protection Regulation [39]. No vulnerable populations were involved, and no ingestion of novel substances, deception, physical intervention, or psychological risk occurred. Consumer tests were conducted on cheeses ripened for 60 and 180 days, involving 120 consumers (aged 45–55, balanced by gender), who rated product acceptance using a 9-point hedonic scale (1 = extremely bad, 5 = neither good nor bad, and 9 = excellent). Consumers also provided qualitative descriptions through a Check-All-That-Apply (CATA) test, selecting terms from a predefined list of 25 sensory and emotional descriptors, resulting in a comprehensive consumer-perceived product profile. The descriptors used in the study were selected through the repertory grid method [40,41], and were presented in a randomised order across both samples and consumers to minimise positional bias [42]. Cheese samples (5.0 × 1.5 × 1.5 cm) were served in odourless plastic containers labelled with randomly assigned three-digit codes and presented in a sequential monadic order following a Williams’ Latin square design. Each consumer evaluated the full set of samples and was instructed to first rate their acceptance, and then to check all the terms that applied to describe each cheese sample. The evaluations were carried out in compliance with the requirements of ISO standards related to sensory testing [43,44,45]. According to European and Italian regulatory frameworks, ethical approval procedures primarily apply to biomedical or clinical research involving medical products or invasive interventions [46,47]. Sensory and consumer tests on conventional foods, conducted with informed adult volunteers and posing no more than minimal risk, are not considered within the scope of these regulations. Therefore, this sensory study was classified as a minimal-risk consumer evaluation not requiring formal approval from an ethics committee.

2.7. Statistical Analysis

Microbial counts for the evaluation of significant differences in the concentrations of each microbial group among the milks used for cheesemaking were performed by one-way analysis of variance (ANOVA). Differences between the individual means were compared by the Tukey–Kramer post hoc test (P ≤ 0.05) using the software SPSS Statistics (v. 21.0; IBM Corp., Armonk, NY, USA). Molecular (GTG)5 rep-PCR fingerprints were elaborated using BioNumerics (v. 6.6.11; Applied Maths, Sint-Martens-Latem, Belgium). Cluster analysis was performed using the unweighted pair group method with arithmetic averages (UPGMA) and Pearson’s correlation coefficient as the similarity index. The isolates sharing ≥93% similarity among their (GTG)5 rep-PCR profiles were considered to belong to the same genotype. The general linear model (GLM) analysis was used to assess the effects of the different dairies (factor F, 3 levels) on the physico-chemical and nutritional parameters determined in processed milk and cheeses. Means comparisons were carried out using Tukey’s honestly significant difference test (P ≤ 0.05). The statistical package Minitab 16 (Minitab 16 Statistical Software, 2010), State College, PA, USA: Minitab, Inc.) was used. Significant (P ≤ 0.05) differences in consumer acceptance scores were analysed by the one-way ANOVA followed by the Tukey–Kramer post hoc test, while differences in the selection of CATA descriptors were analysed using Cochran’s Q test [48,49]. Correspondence analysis (CA) was performed to generate a two-dimensional representation of the relationship between samples, descriptors, and acceptance [48]. Consumer data were collected and statistically analysed using Smart Sensory Box (v. 2.3.5), R Statistical Software (v. 4.3.1), and Statgraphics Centurion XV (v. 15.1.02).

3. Results and Discussion

3.1. Identification and Biodiversity Evaluation of the Bacterial Isolates for Str-Mix and Lb-Mix Preparation

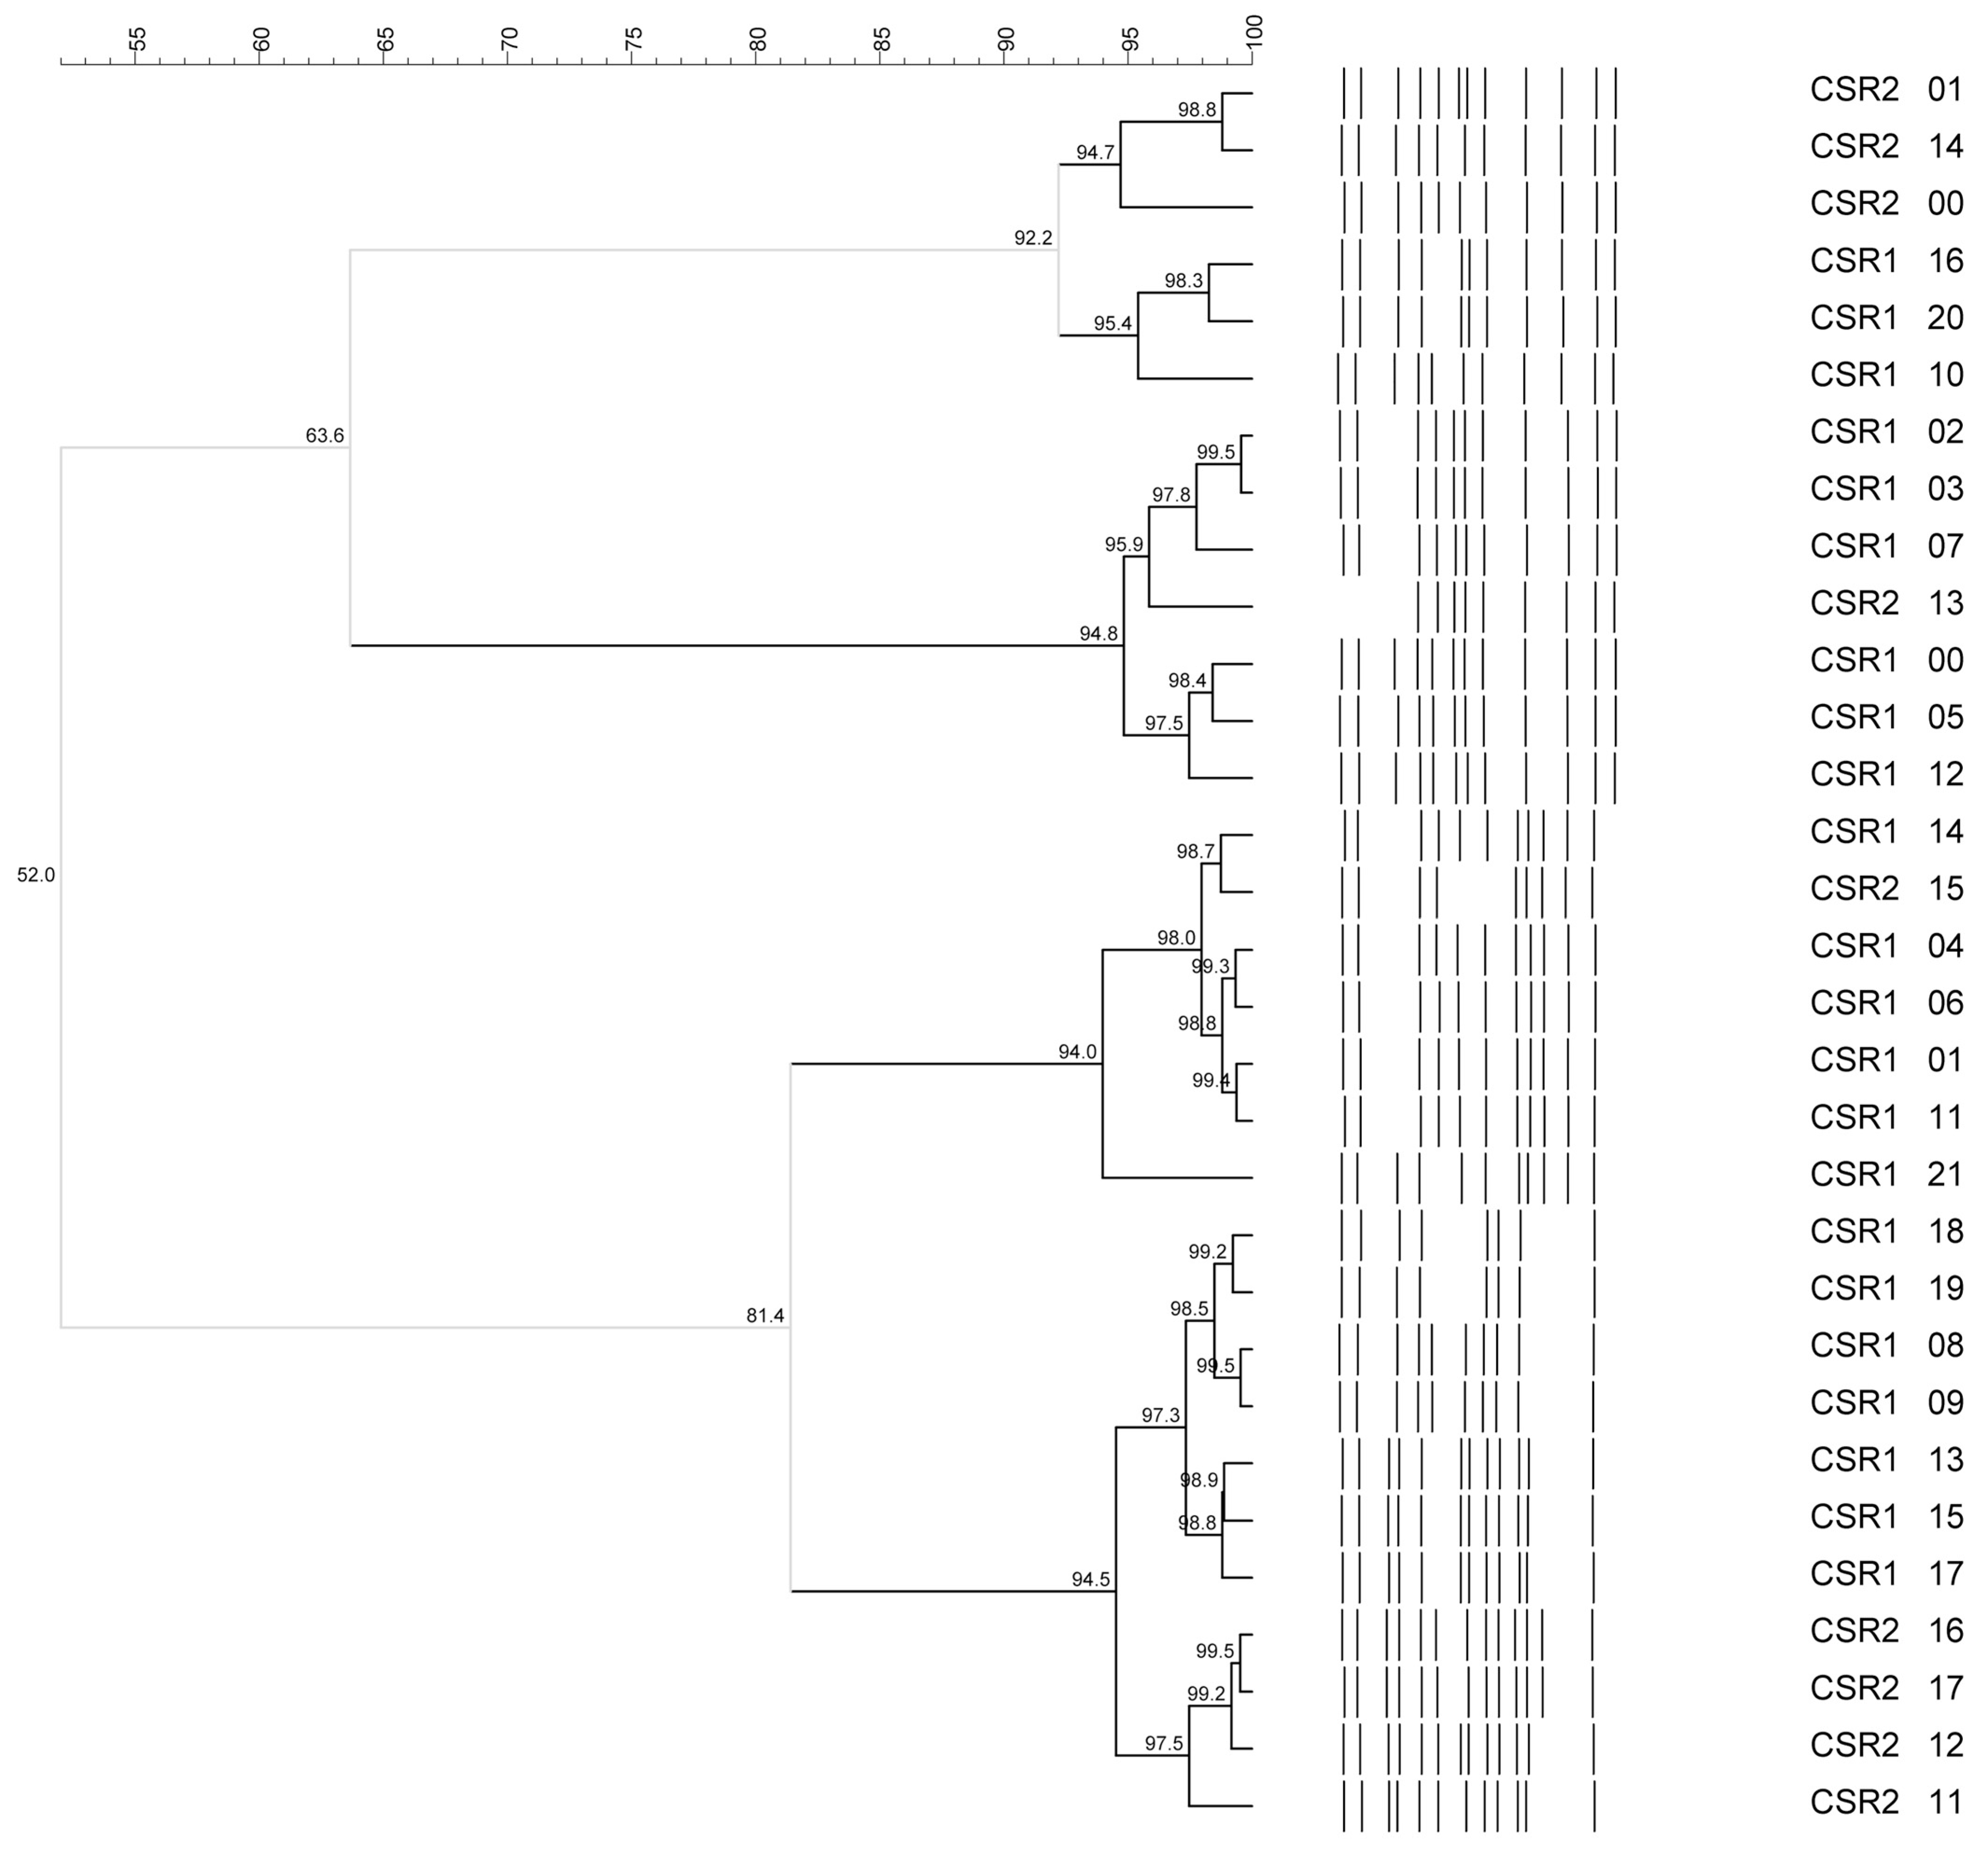
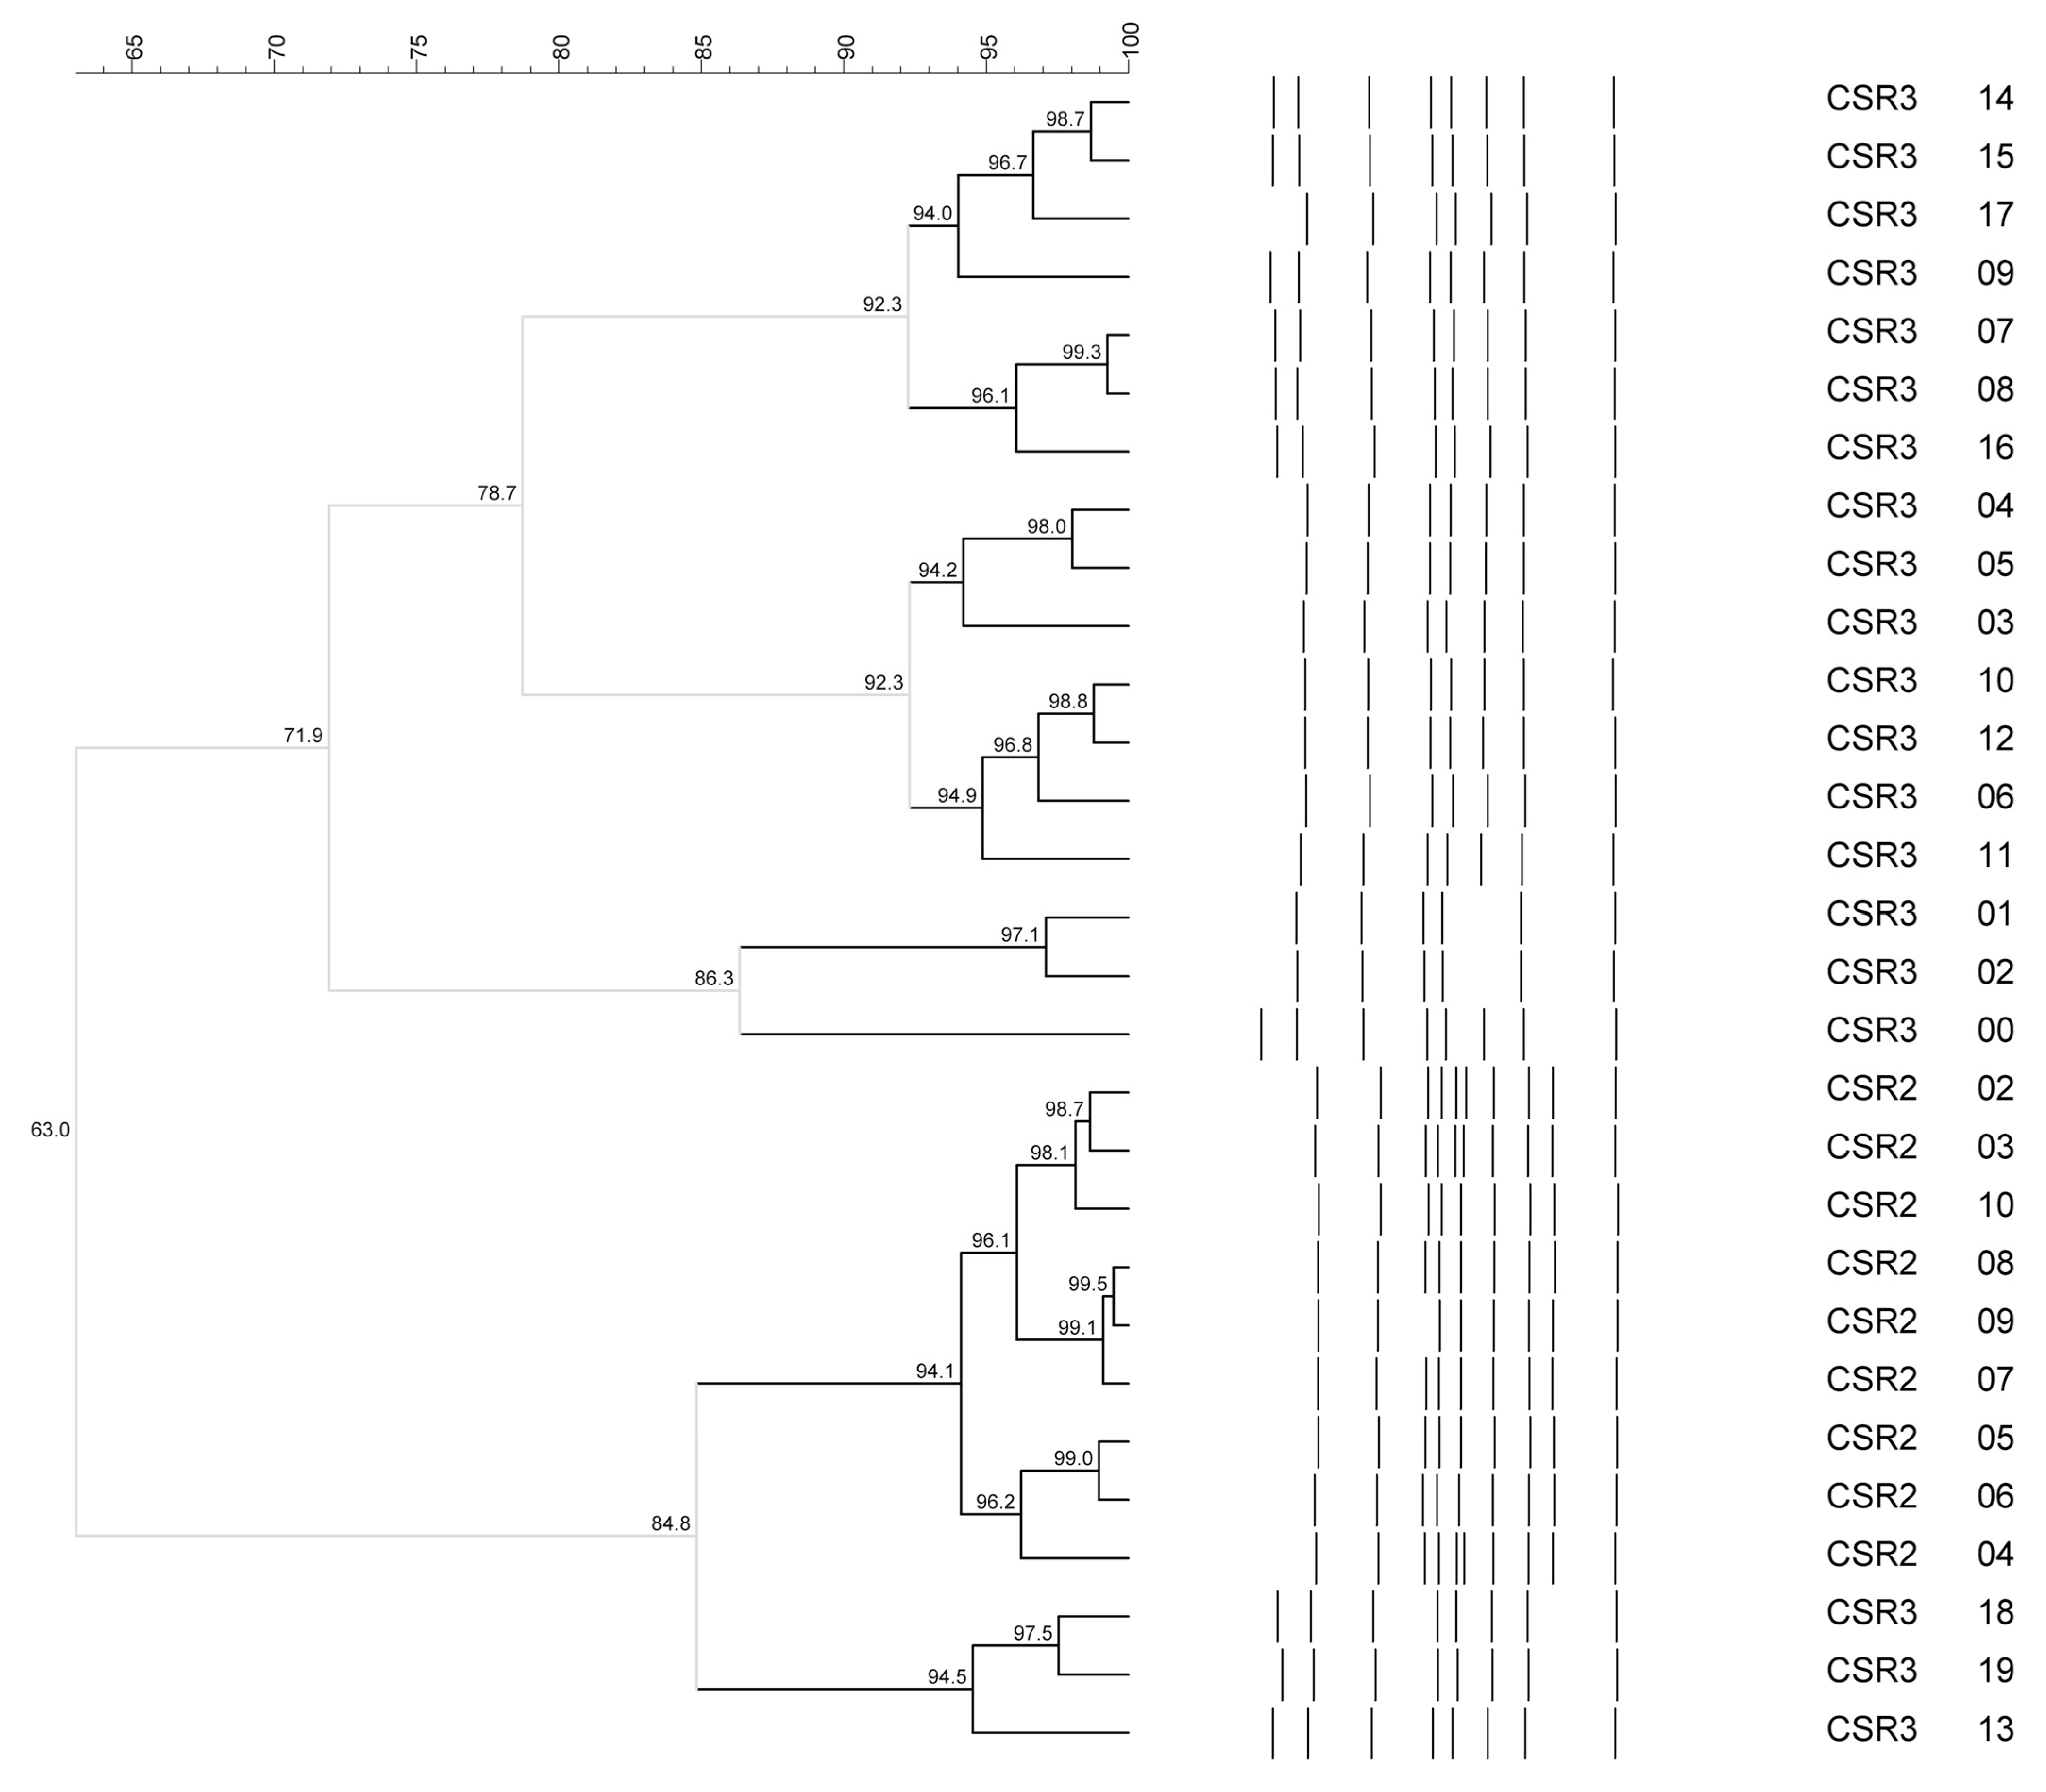
Sixty bacterial isolates were obtained from a secondary natural starter culture (SNSC) collected during this study at a dairy farm in Sardinia (Italy) not involved in the technological trials. Of these, 31 isolates were identified as S. thermophilus recovered from M17 agar plates incubated at 30 °C (22 isolates) and 45 °C (9 isolates), representing five distinct (GTG)5 rep-PCR genotypes (Figure 2). Additionally, 29 isolates were identified as L. delbrueckii (9 from M17 at 45 °C and 20 from MRS pH 5.4 at 45 °C), comprising eight (GTG)5 rep-PCR genotypes (Figure 3). All isolates used to obtain the Str-mix (S. thermophilus) and Lb-mix (L. delbrueckii) are preserved ex situ in the Agris-BNSS culture collection (www.mbds.it). Starter cultures are essential in dairy fermentation as they ensure the proper progression of technological procedures and safeguard the quality of the final product [50]. Moreover, starters enhance product safety and contribute to the desired sensory attributes. In particular, natural cultures, unlike commercial ones, not only help preserve microbial biodiversity but also contribute to the distinctive characteristics of the product [51,52]. The natural starter culture investigated in this multidisciplinary study for stability in technological performance during cheese manufacturing in dairy facilities with different equipment levels was obtained following a novel approach described by Chessa et al. [17], which avoids heat treatment of raw milk, thereby maximising the preservation and recovery of the original microbial diversity within the natural starter culture (i.e., NSC). The NSC, comprising Enterococcus and Streptococcus species not included in the EFSA QPS list [53], underwent a safety assessment and was found to be safe, as previously reported by Chessa et al. [16], and furthermore, it exhibited a high level of strain diversity, encompassing 33 distinct strains. Moreover, NSC was integrated with five Streptococcus thermophilus and eight Lactobacillus delbrueckii strains (Str-mix and Lb-mix, respectively) to enhance the acidification capacity of the starter culture during cheesemaking. These species, listed in the EFSA QPS document, can be used as food-grade additives and do not require additional safety tests [53]. Str-mix consisted of 5 S. thermophilus genotypes, while the Lb-mix comprised 8 L. delbrueckii genotypes, which complemented the 33 genotypes already present in the NSC, and, for cheese manufacturing, each strain was individually propagated and freeze-dried to obtain the Str-mix and the Lb-mix (both at 9.7 Log CFU/g), which were then combined with the freeze-dried natural starter culture NSC (9.3 Log CFU/g) to formulate the final starter culture used in this study. The technological efficiency of the starter culture (NSC + Str-mix + Lb-mix) was assessed in both artisanal and pilot-scale dairies, which differed in instrumental equipment level and were located in distinct geographic areas. A further objective of the study was to assess whether the technological performance of cheesemaking varied among the different dairies, including the one from which the NSC was originally derived. The assessment of the starter culture’s performance under diverse processing conditions, including variations in geographic location, raw milk composition, technological equipment across dairies, and cheese-ripening environments, was systematically evaluated from a multidisciplinary standpoint. Detailed results and analyses of this evaluation are presented below.

3.2. Technological Parameters of Cheesemaking

The volume of milk processed varied among the dairies according to their production scale can be seen in Table 1. The pH of the cheese milk was within the normal range reported for sheep’s milk by Pulina et al. [54]. Thermisation (68 °C) and coagulation (38 °C) temperatures were consistent across dairies. The rennet dose (72 IMCU/kg) ensured uniform coagulation. Curd cutting and semi-cooking times (43 °C) varied, with dairy C showing lower values, but remained within the Pecorino Sardo Maturo PDO process standards [55]. The technological parameters monitored during cheesemaking demonstrated the adaptability of the natural starter culture across the three different dairy environments (Table 1). Despite variations in milk composition and processing equipment, the starter culture maintained consistent performance indicators. All cheeses began the sweating phase with a similar pH (Table 1). However, dairy A required more time to reach the end-stewing pH, showing greater variability than dairies B and C, though differences were not significant. The lower acidification in dairy A’s cheese may be linked to milk characteristics. Dairy A processed fresh milk within 2 h, while dairies B and C used refrigerated milk from evening and morning milking. Fresh milk contains endogenous antibacterial substances (lysozyme, lactoperoxidase, lactoferrin, immunoglobulins, and lactalbumins) [56,57], whose activity decreases during refrigeration, potentially slowing bacterial growth and thus the acidification process in milk from dairy A. Despite differences, sweating duration remained within the Pecorino Sardo Maturo PDO standard range (120–240 min) [55]. Dairy B had a lower pH in 1-day cheese compared to dairies A and C. Dairy A consistently produced five cheese wheels per cycle, while dairies B and C each produced three. The cheese wheels of dairy B were considerably heavier, in line with its higher overall production. Due to differences in cheese characteristics and brine concentrations, the calculated total salting time followed an increasing trend: 28 h for dairy C, 30 h for dairy B, and 34 h for dairy A. The cheese yield (YA) (Table 2) varied significantly across three dairies, with dairy B yielding the highest (17.0 ± 1.2%), followed by dairy A (14.9 ± 0.1%) and dairy C (13.6 ± 0.3%) (P ≤ 0.05). The yield at constant moisture content (YAM) showed similar trends, indicating that differences in moisture content did not significantly affect the observed yield differences. The expected yield (YP), calculated based on milk fat and protein content, was consistent with YA, indicating that the cheesemaking process showed good performance, comparable to that typically observed in the Pecorino Sardo PDO production [22]. The differences in cheese yield among dairies were largely attributed to milk composition, specifically fat and protein content. Dairy B produced milk with higher fat and protein content compared to the others. Correlation analysis showed significant relationships between YA and both fat (r = 0.983, P ≤ 0.001) and protein (r = 0.965, P ≤ 0.001) content in transformed milk. Normalisation of the cheese yield (YAN), adjusted for milk composition, showed a more uniform yield across the dairies, with dairy C showing a higher YAN (16.0 ± 0.4%) than dairy B (14.9 ± 0.3%) (P ≤ 0.05), and no significant difference between dairy A and B. The normalised yield corrected for moisture content (YANM) was similar across all dairies, reinforcing that differences in YA are due to milk composition rather than processing factors. Technological efficiency in fat recovery (FR) also varied, with dairy C showing significantly higher fat recovery (82.5 ± 1.2%) than dairy A (77.5 ± 2.5%) and dairy B (77.1 ± 1.8%) (P ≤ 0.05). This difference was linked to the fat-to-protein ratio in milk, which was lower in dairy C (0.813 ± 0.002) compared to dairies A (0.98 ± 0.04) and B (1.2 ± 0.1) (P ≤ 0.05) (Table 3). It is well known that a lower fat-to-protein ratio enhances the curd’s ability to retain fat, thereby improving fat recovery, as observed in dairy C [58].

3.3. Microbial Characterisation

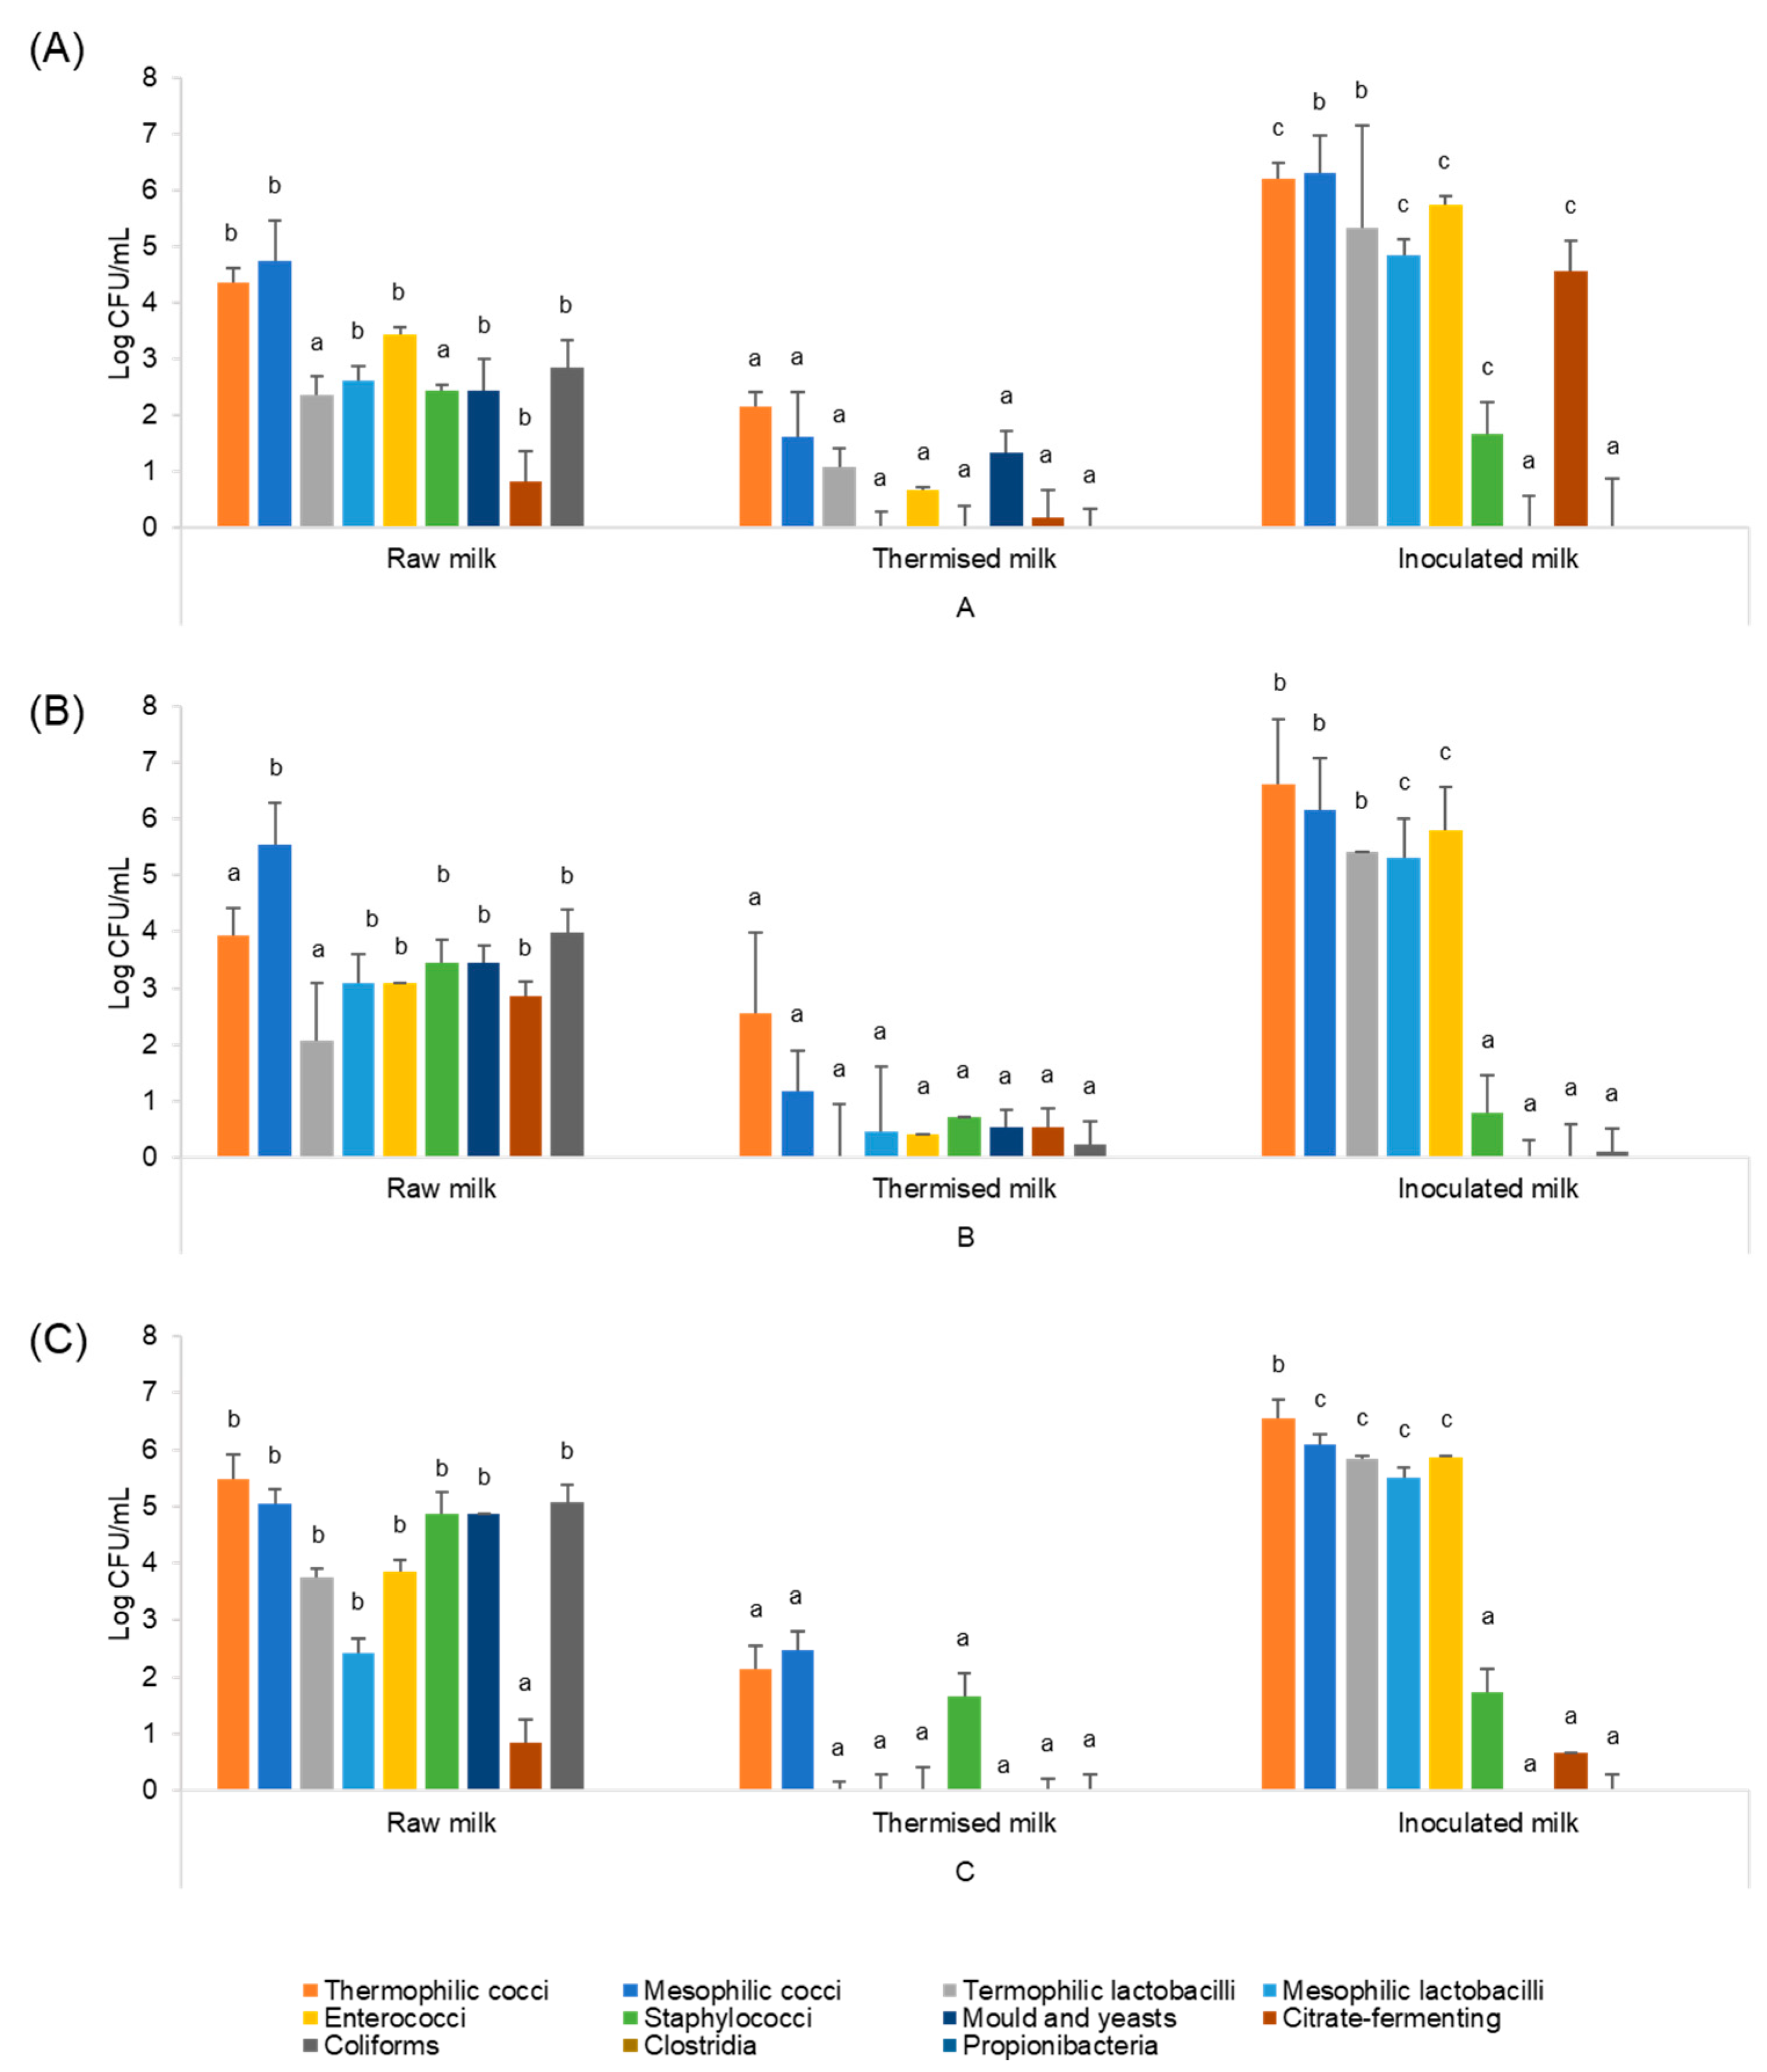
Microbial counts of the milks processed in the three dairies, monitored over three different production days per facility, revealed that the heat treatment had a significant (P ≤ 0.05) effect, markedly reducing the concentration of the native raw milk microbiota. This reduction was particularly evident in spoilage groups such as moulds and yeasts, citrate-fermenting bacteria, and potential pathogens, including coliforms and coagulase-negative staphylococci (Figure 4). Consequently, thermisation improved both the safety and the shelf life of the cheese. Furthermore, the heat treatment also resulted in a decrease in presumptive LAB with pro-technological properties, including thermophilic and mesophilic cocci, thermophilic and mesophilic lactobacilli, and enterococci. Propionibacteria and clostridia, which are known to cause late blowing and defects in cheese [59], were never detected in the milk from any of the three dairies. The inoculation of the biodiverse starter culture, composed of enterococci, streptococci, and mesophilic lactobacilli, and integrated with the Str-mix and Lb-mix, into the thermised milk increased the concentration of both starter bacteria involved in the initial transformation process (i.e., milk acidification) and in the non-starter bacteria responsible for the cheese ripening [7,60].
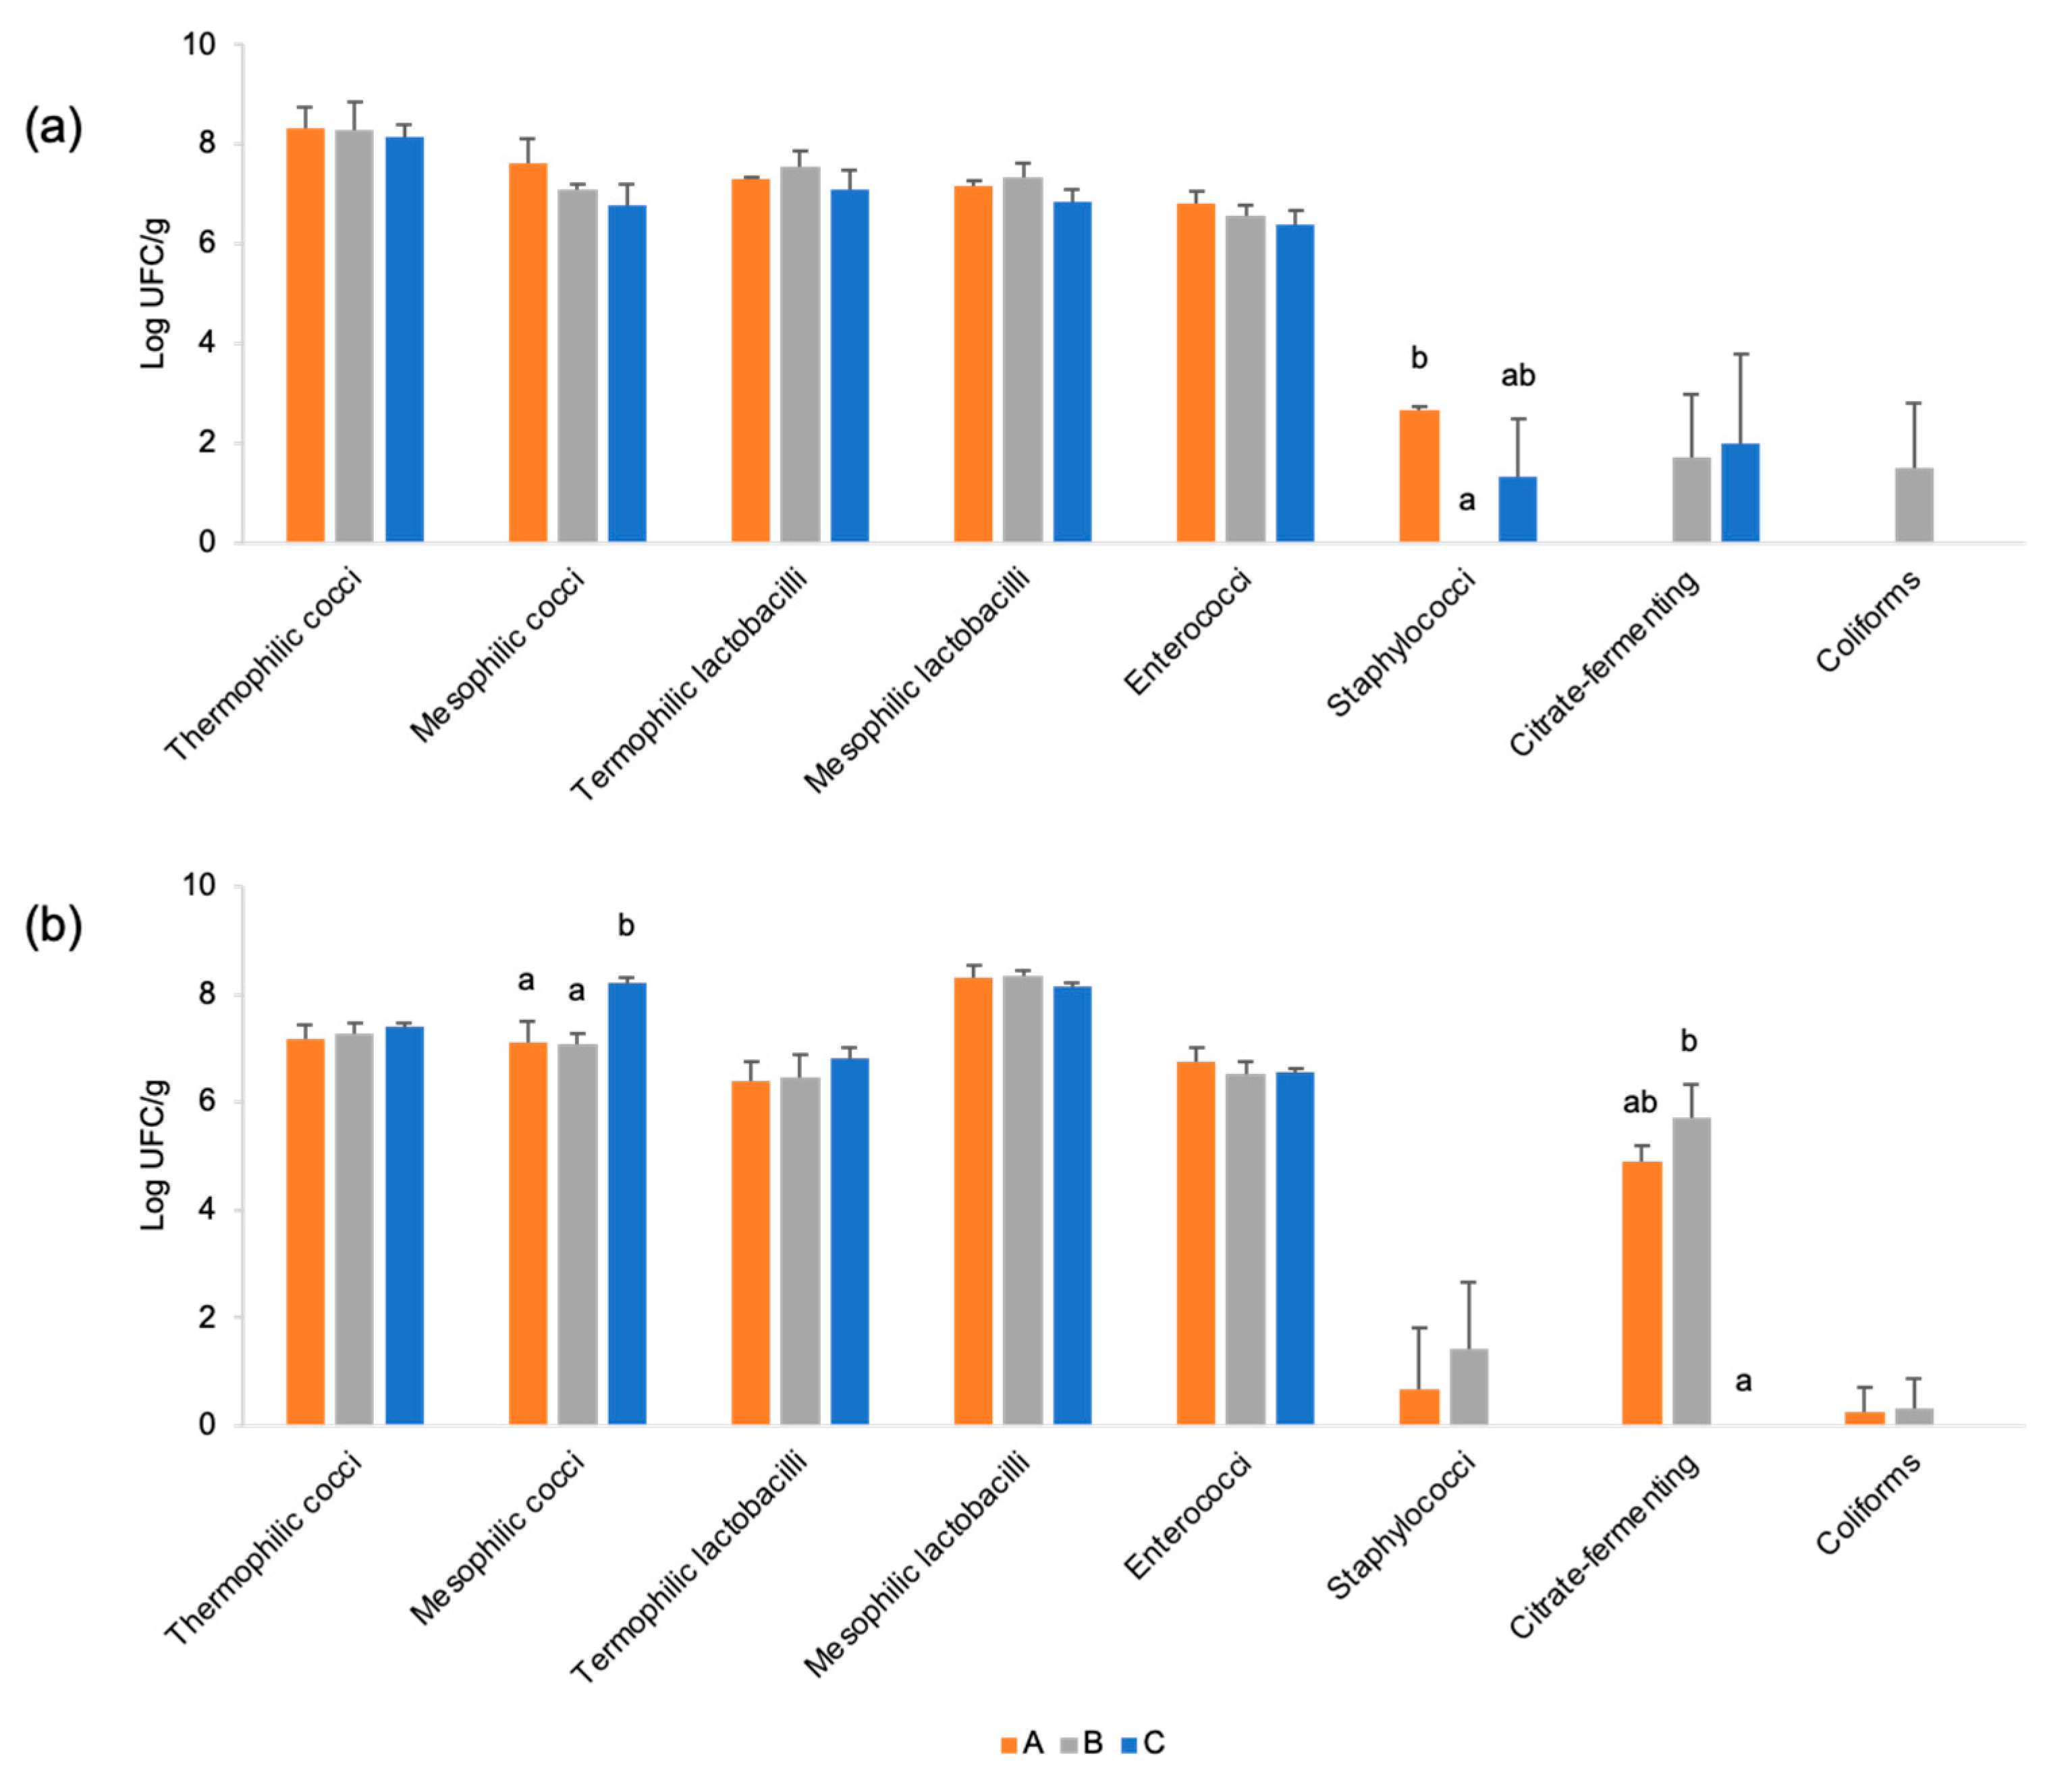
The concentrations of presumptive mesophilic and thermophilic cocci, as well as thermophilic lactobacilli, in 1-day cheeses and after 60 days ripening ranged from 6.4 to 8.3 Log CFU/g (Figure 5). These microbial groups are primarily represented by starter species that initiate fermentation and produce lactic acid. This acidification process inhibits the growth of undesirable microorganisms and contributes to the development of the cheese’s flavour and structure [61]. Presumptive mesophilic lactobacilli and enterococci were detected at high concentrations (up to 7.3 and 6.8 Log CFU/g, respectively) in 1-day cheeses. These microbial groups play a significant role in cheese ripening, contributing to the evolution of its chemical composition and sensory characteristics [62], and characterise the microbiota of artisanal ripened cheeses [63]. Among the undesired species, coagulase-negative staphylococci, a microbial group able to produce proteolytic enzymes that can negatively affect cheese texture and flavour [64], were not detected in 1-day cheese produced by dairy B. In contrast, low concentrations of staphylococci were found in cheeses from dairies A and C (2.7 and 1.3 Log CFU/g, respectively) (Figure 5). Nevertheless, staphylococci are commonly present in fermented foods, and coagulase-negative ones are generally regarded as non-pathogenic [65]. Citrate-fermenting bacteria can be responsible for defects such as gas formation in certain cheese types (i.e., cooked, semi-cooked), necessitating careful monitoring and control of their concentration to prevent quality issues [66]. However, these bacteria also play a dual role, as they significantly contribute to flavour development during cheese ripening [67]. In this study, citrate-fermenting bacteria were present in the 1-day cheeses produced by dairies B and C, but their concentrations were very low (≤2 Log CFU/g), indicating they are unlikely to pose a risk regarding the development of defects in the cheese paste. Coliforms, indicators of faecal contamination and potentially responsible for early defects in cheese [68], were detected at low concentrations (<3 Log CFU/g) only in the 1-day cheeses from dairy B. After 60 days of ripening, a general decrease in microbial concentrations was observed compared to the 1-day cheeses (Figure 5). This reflects the typical microbial evolution during cheese ripening, where starter bacteria gradually decline over time. Despite this trend, mesophilic and thermophilic cocci, as well as thermophilic lactobacilli, remained at high concentrations in all cheeses after 60 days of ripening. A general decline in starter microbiota was observed, with the sole exception of mesophilic cocci in the cheese produced by dairy C, which showed counts 1 Log CFU/g higher than A and B cheeses. This indicates a persistence of the starter species during the ripening process, contributing to the continuous evolution of the cheese characteristics. Mesophilic lactobacilli showed a remarkable increase, surpassing 8 Log CFU/g during ripening. In contrast, enterococci concentration remained stable across all cheeses (about 6 Log CFU/g) throughout the 60-day ripening period. The persistence of these microbial groups underscores their ongoing contribution to the biochemical processes considered critical for sensory profile development, which define the unique characteristics of artisanal ripened cheeses. Coagulase-negative staphylococci were either absent, in 60-day-ripened cheeses produced in dairy A, or present at negligible concentrations in B and C cheeses (0.67 and 1.42 Log CFU/g, respectively). This finding indicates adequate control of unwanted species during ripening, contributing to the overall safety and quality of the cheese. Citrate-fermenting bacteria, which play a dual role in flavour development and cheese ripening (but require careful monitoring to prevent defects), were detected exclusively in A and B cheeses. Despite their high concentrations in these cheeses (4.9 and 5.7 Log CFU/g, respectively), no structural defects in texture were observed. In general, the evolution of the microbial community from inoculated milk to cheese after 24 h and following 60 days of ripening suggests an effective activity of the starter species, a progressive development of ripening-associated species, and adequate control of undesirable species. However, the specific role and fate of each individual starter strain throughout the cheesemaking and ripening process remain to be elucidated. Future studies employing targeted microbial tracking will be required to clarify these dynamics and interactions.
Lactic acid bacteria (LAB) play a pivotal role in the production of fermented dairy products, contributing not only to their nutritional value but also to potential health benefits [69]. Key genera such as Lactobacillus, Lactococcus, and Enterococcus are commonly employed in the starter cultures to regulate fermentation and improve product quality and flavour [70]. Consumption of fermented dairy products has been associated with positive health effects, including cholesterol reduction and immune response stimulation [50]. Although commercial starter cultures are widely used in industrial production, their application may lead to the loss of distinctive sensory characteristics typical of artisanal cheeses. To address this issue, autochthonous starter cultures isolated from traditional cheeses can be applied to improve the flavour and sensory complexity of industrially produced cheeses, resulting in products that more closely resemble those obtained through spontaneous fermentation [71].

3.4. Chemical Characterisation

Milk from dairy B was characterised by a significantly higher (P ≤ 0.05) fat, protein, casein, and, consequently, total solids content than milk from the other two dairies, which did not differ from each other (Table 3). Based on the respective fat and protein contents of the milks, the fat/protein ratio varied as follows: B > A > C. This variation could affect the recovery efficiency of these macro-components in the produced cheeses.
One-day cheeses differed in terms of moisture, fat, protein, and NaCl content (Table 4). In particular, cheese from dairy B was significantly higher (P ≤ 0.05) in fat and lower in protein content than the cheeses produced in the other dairies, which, in contrast, did not differ from each other. This trend follows and can be explained by the different fat/protein ratios of the milk processed in the three dairies. Since protein is a hydrophilic molecule that conveys and traps water in the cheese matrix, the difference in protein content among cheeses partly determines the moisture content, which in cheese C was significantly higher than in cheese B and tended to be higher than in cheese A, and cheeses A and C did not differ from each other. In 1-day cheeses, lactose was generally not completely hydrolysed during the acidification phase of the curd, and the remaining amount in fresh cheese depends on several factors, among which the most important are the starter used and the duration of the curd-stewing phase (Table 1). The residual lactose content decreased further during cheese ripening; in fact, long-ripened cheeses are generally naturally lactose-free. The General Direction for Hygiene and Safety of Food and Nutrition of the Italian Ministry of Health, based on the opinion expressed by the European Single Commission on Dietetics and Nutrition [72], provided indications according to which the “lactose-free” claim may be used for dairy products with a lactose level lower than 0.1 g in 100 g (or 100 mL) of product. A noteworthy result of this study highlighted that the residual lactose in A, B, and C cheeses is, regardless of producing dairies, always below the limit that allows the product to be declared lactose-free starting from 24 h after production. The use of Str-mix and Lb-mix in the natural starter culture may have favoured the very early degradation of lactose during the production stage. All these thermophilic bacteria can promote a rapid conversion of glucose (derived from lactose) into lactic acid, whereas Lactobacillus delbrueckii strains are also able to ferment the galactose [73]. These bacteria survive in the cheese, enacting the complete degradation of residual sugars in the cheese during the ripening phase. All 60-day-ripened cheeses differed according to the dairy where cheeses were produced (A, B, and C) (Table 5). In particular, cheese produced in dairy B exhibited a higher fat content than the other two cheeses, which did not differ from each other.
The variation in protein content mirrored that of fat, as follows: C > A > B. Both parameters, related to the fat/protein ratio in the processed milk, closely followed the trend observed in the 1-day cheeses. The residual lactose in cheeses A, B, and C was always below the limit (0.1 g/100 g of cheese), allowing for the lactose-free labelling and highlighting an additional decrease in the residual lactose content during cheese ripening. The cheeses produced had very similar values for salt (NaCl) content, which is consistent with the expected value. This result confirms the effectiveness of the salting method used in ensuring the standardisation and control of salt content in the cheese. The nutrition label for each ripened cheese (A, B, and C) was prepared according to the indications of the European Regulation [74], which governs the food labels of pre-packaged products circulating in the European Union member states.
According to the nutritional label (Table 6, which reports the mandatory and non-mandatory parameters for ripened cheeses A, B, and C), a 100 g portion of cheese A supplies the following: 364 kcal, corresponding to 18% of the daily reference intakes (RI, relative to a 2000 kcal diet for an adult, EU No 1169/2011 [74]), 28 g of fat (40% of RI), of which 19 g is saturated fat (95% of RI), 28 g of protein (56% of RI), 0 g of sugar, and 1.6 g of salt (27% of RI); a 100 g portion of cheese B gives the following: 384 kcal, which corresponds to 19% of the daily RI, 32 g of fat (46% of RI), of which 21 g is saturated fat (105% of RI), 24 g of protein (48% of RI), 0 g of sugar, and 1.5 g of salt (25% of RI); 100 g portion of cheese C provides the following: 359 kcal, which corresponds to 18% of the daily RI, 27 g of fat (39% of RI), of which 18 g is saturated fat (90% of RI), 29 g of protein (58% of RI), 0 g of sugar, and 1.5 g of salt (25% of RI). According to the guidelines for healthy nutrition [75], a 50 g portion of cheese should be included in an adult’s diet three times a week. A 50 g portion of the A, B, and C cheeses, according to Regulation EC No 1924/2006 [76], can be considered “High Protein”, because more than 20% of the energy value of the cheese portion is provided by protein, “High in Calcium”, as a portion of the cheese contains more than twice a significant amount of this element, and a “Source of vitamin A and zinc”, as a portion of cheese contains a significant amount of these compounds.

3.5. Consumer Liking and Perception

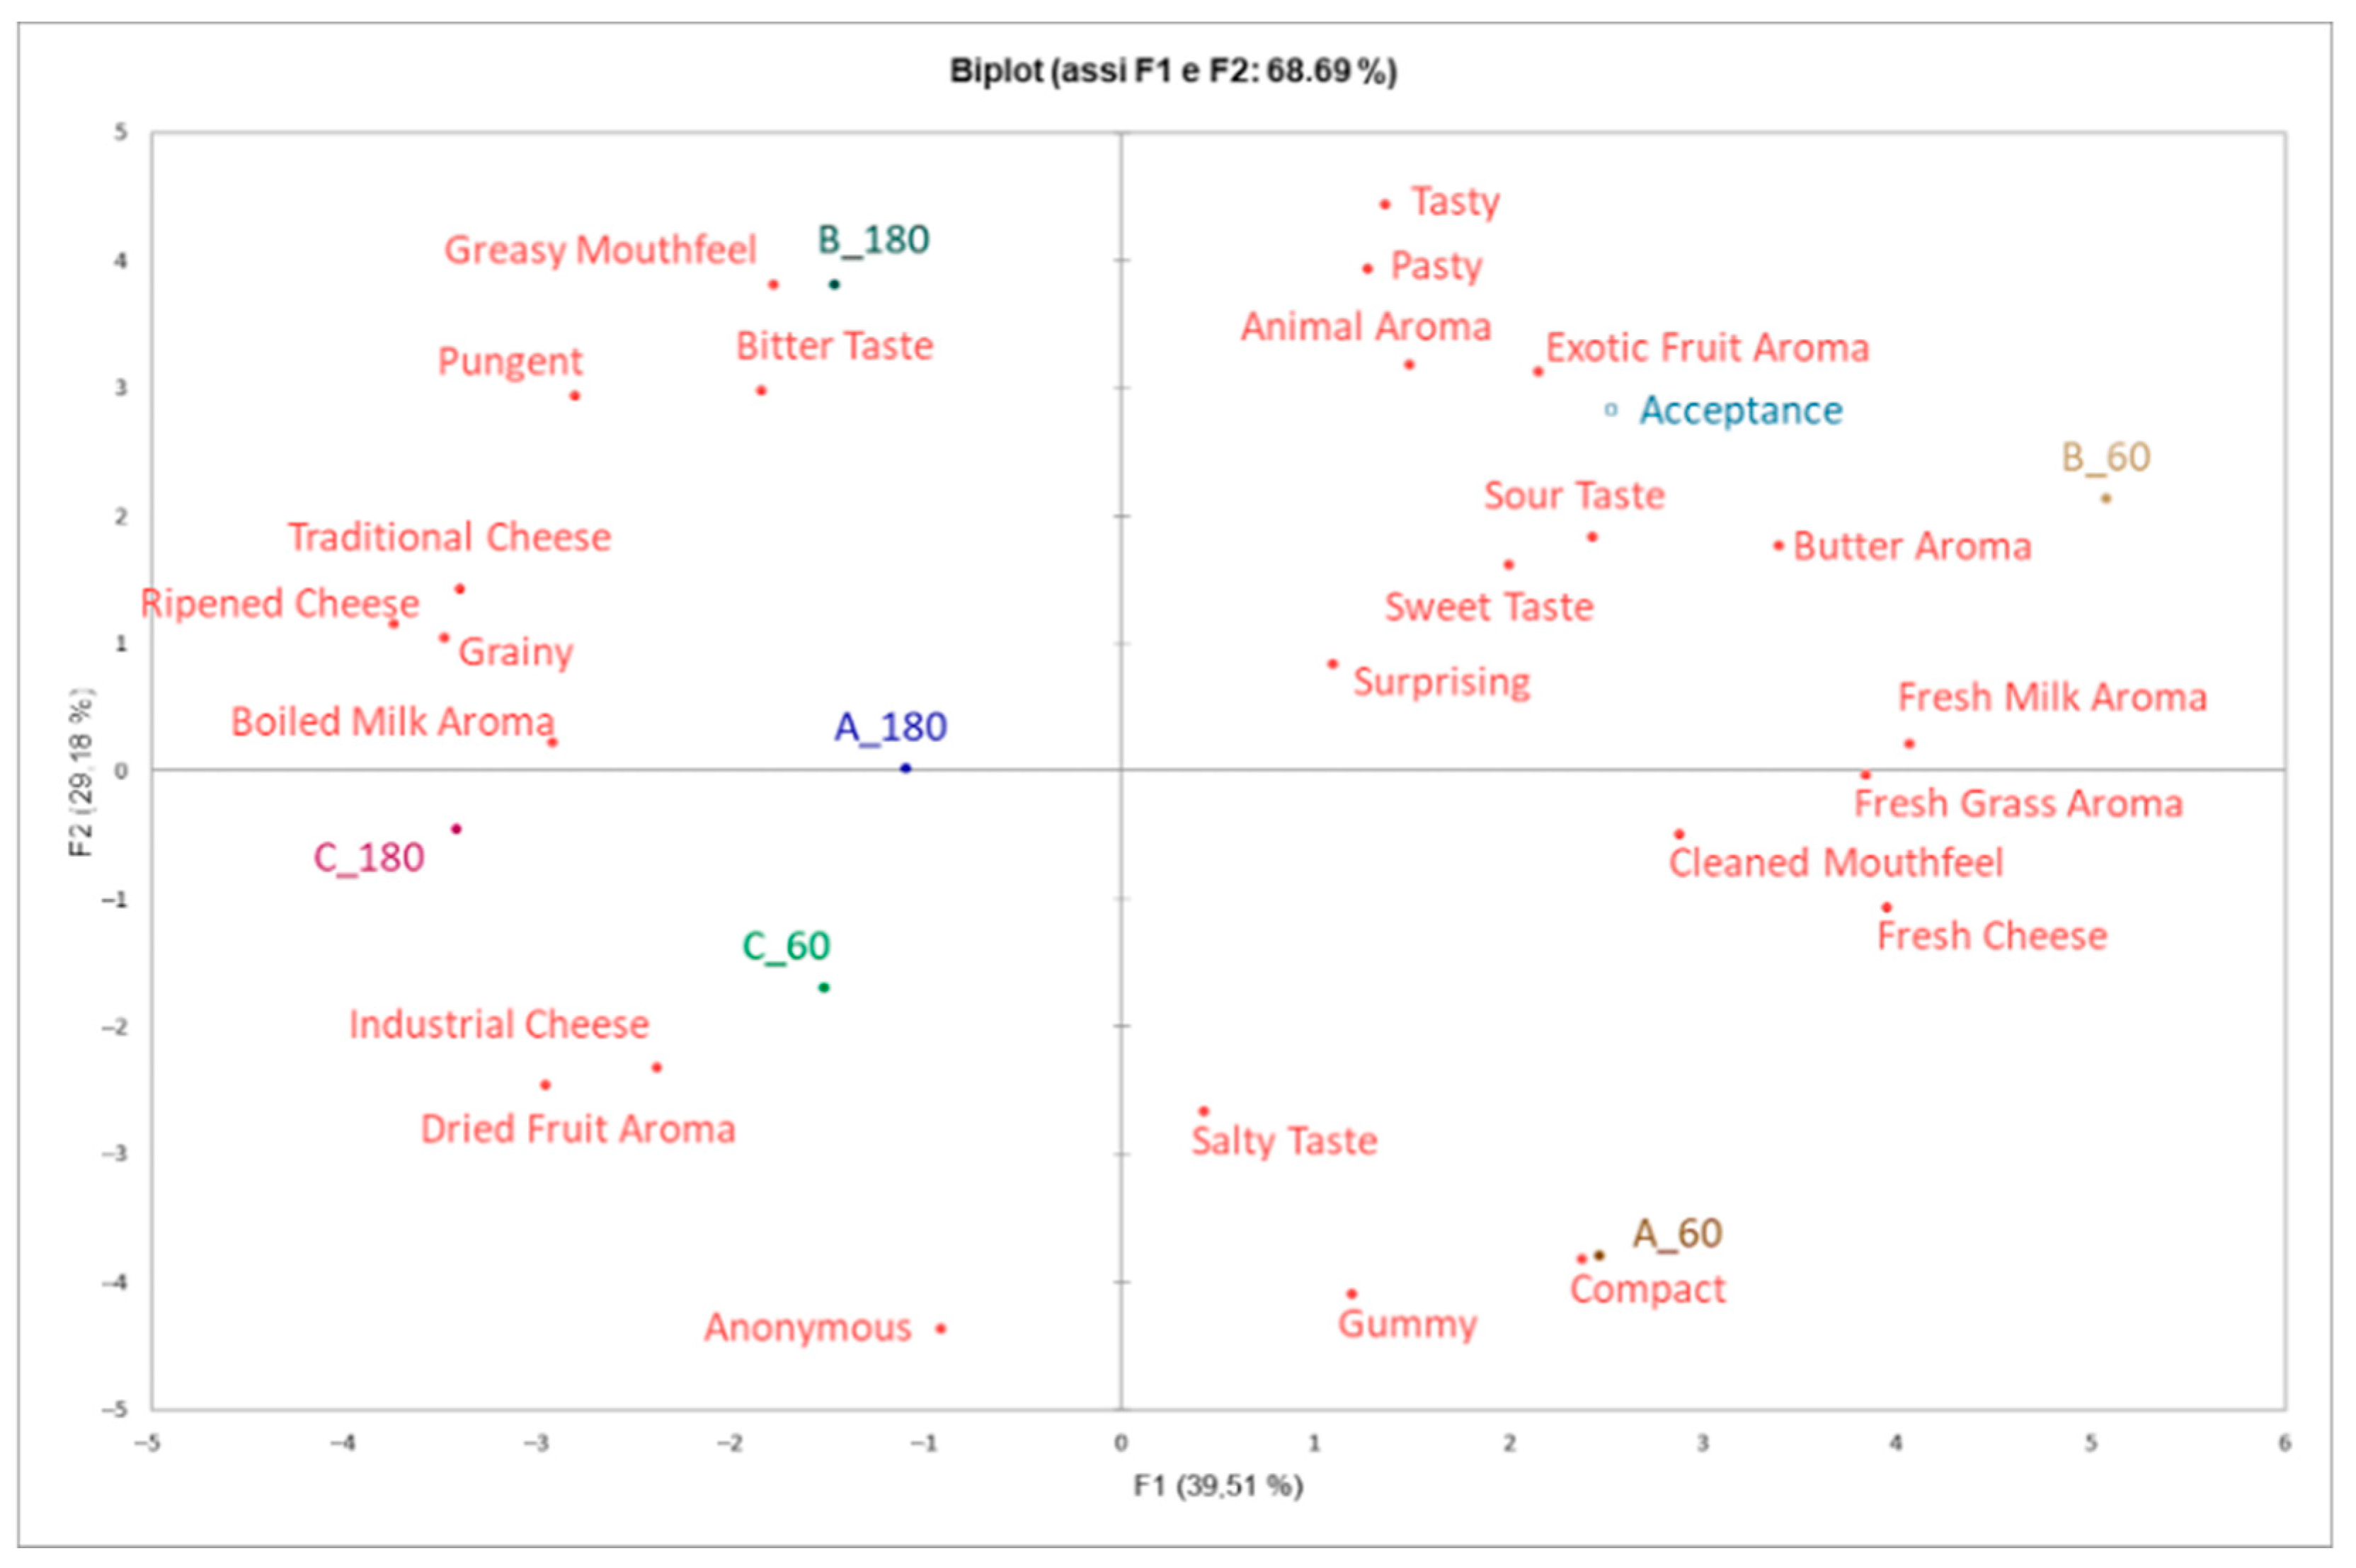
To assess the acceptability of the cheeses produced using the natural starter culture investigated in this study, and to identify the sensory characteristics perceived by consumers, a consumer test was conducted on cheeses ripened for 60 and 180 days, combining an acceptance test with a Check-All-That-Apply (CATA) questionnaire. This study’s combined approach is widely used in consumer research to simultaneously evaluate product liking and to describe sensory perceptions from the consumer’s point of view [49,77,78], providing complementary information that supports a more comprehensive understanding of consumer responses. Results of the consumer test indicated that all cheeses, ripened for either 60 or 180 days, were well accepted, with mean acceptance scores ranging from 6.0 (sample C at 60 days) to 6.4 (sample B at 60 days), confirming the suitability of the starter culture evaluated in this study. Moreover, all cheeses were equally preferred by consumers, as the ANOVA analysis revealed no significant differences (P ≤ 0.05) among the samples within each ripening period. Conversely, the Cochran’s Q test results, assessing the frequencies of sensory descriptors across cheeses from the three different dairies (A, B, and C) at two distinct ripening periods (60 and 180 days), highlighted significant sensory differences (P ≤ 0.05) among samples (Table 7). This apparent discrepancy between acceptance and the CATA results highlights an important consideration in sensory evaluation: while mean acceptance scores provide a broad indication of overall liking, they may fail to capture the nuanced complexity of sensory perception and consumer response. In contrast, the CATA results offer complementary insights by revealing perceptual differences among samples that are not necessarily reflected in hedonic ratings. These findings suggest that consumers can discriminate among products based on specific sensory attributes, even when such differences do not result in statistically significant variations in overall acceptance. Specifically, at 60 days of ripening, significant differences in the consumer-perceived sensory characteristics were identified. Dairy B cheese was characterised significantly more frequently by attributes associated with freshness and overall appeal, including “Sour Taste”, “Fresh Milk Aroma”, “Fresh Cheese”, “Tasty”, and “Surprising”. Cheese from dairy A was significantly more associated with “Sweet Taste” and “Fresh Grass Aroma”. Conversely, cheese from dairy C exhibited higher frequencies of descriptors typically considered less favourable, such as “Pungent”, “Grainy”, “Industrial Cheese”, and “Ripened Cheese”. At the 180-day ripening stage, fewer significant sensory differences were observed. Dairy A cheese was more frequently associated with descriptors like “Salty Taste”, “Gummy”, “Compact”, “Cleaned Mouthfeel”, and “Surprising”, reflecting favourable characteristics emerging prominently at longer maturation periods. Dairy B cheese was associated with a significantly higher frequency of the “Sweet” and “Grainy” descriptors. In contrast, cheese from dairy C differed only in the frequency of the “Grainy” descriptor.
These findings are further illustrated in Figure 6, a two-dimensional representation obtained through correspondence analysis (CA), depicting the relationships among samples, sensory descriptors, and acceptance. The CA clearly distinguished sensory profiles and consumer preferences among the six sheep milk cheeses analysed. Cheeses ripened for 60 days, especially samples A_60 and B_60, were generally associated with fresher and more desirable sensory attributes, including “Fresh Milk Aroma”, “Fresh Grass Aroma”, “Butter Aroma”, “Compact”, and “Cleaned Mouthfeel”. Consistent with their ripening stage, these samples were perceived by consumers as “Fresh Cheese” and were positioned closer to the “Acceptance” variable, indicating that these descriptors positively influenced consumer liking. In contrast, cheeses ripened for 180 days, particularly samples C_180 and B_180, exhibited more intense and “Traditional” sensory characteristics, such as “Pungent”, “Boiled Milk Aroma”, and “Greasy Mouthfeel.” Correspondingly, these cheeses were perceived as “Ripened Cheese”, displaying a “Grainy” texture consistent with extended ageing. Although these attributes might appeal to specific consumer segments, they generally distance the cheeses from broader consumer preferences. The sensory analysis also emphasised the influence of milk composition and microbial activity on cheese development, especially for cheese B. Attributes such as “Greasy Mouthfeel” and “Butter Aroma” observed in cheese B could be associated with its higher fat content, as confirmed by chemical analyses of both milk and cheese samples. Elevated fat levels likely facilitated the formation of volatile aroma compounds [67] and increased creaminess and the intensity of butter notes in cheese [79,80]. Furthermore, cheeses A and B demonstrated a distinct sensory evolution between 60 and 180 days of ripening, evident from the considerable spatial separation between younger (A_60, B_60) and older samples (A_180, B_180) on the biplot. This shift suggests a dynamic maturation process, potentially driven by a higher initial presence of citrate-fermenting bacteria observed in these cheeses at 60 days. It is well known that the metabolism of citrate by various lactic acid bacteria species commonly found in cheese can lead to the production of flavour compounds such as diacetyl and acetoin [81]. As evidenced by extensive research, these compounds not only contribute to buttery and creamy characteristics but also serve as precursors for more complex sensory attributes, including the “Pungent” sensation detected in older cheeses [82]. In contrast, cheese C showed a less pronounced sensory evolution between 60 and 180 days, as indicated by the proximity of C_60 and C_180 samples on the biplot. Differences in sensory evolution can be attributed to the production environment and scale. Cheeses A and B originated from an artisanal factory, where less standardised conditions, greater variability in raw milk composition, and traditional cheesemaking practices promote a richer and more diverse microbial community, including citrate-fermenting species. Conversely, cheese C, produced in a research-scale facility under more controlled conditions, exhibited a more restricted microbial profile, resulting in limited sensory changes. This was reflected in the closer positioning of C_60 and C_180 on the biplot and contributed to consumer perception of these cheeses as “Industrial” and “Anonymous.”

4. Conclusions

In this study, the stability of a freeze-dried natural starter culture, in terms of its technological performance, was investigated for the production of a semi-cooked ewe’s milk cheese similar to Pecorino Sardo mature PDO. The culture, obtained by recovering as much of the raw milk’s natural biodiversity as possible, while excluding spoilage and pathogenic microorganisms, and integrated with a biodiverse mixture of S. thermophilus and L. delbrueckii, comprised 46 strains belonging to different genera and species. Its addition to thermised milk allowed the reintroduction of part of the raw milk microbiota lost after heat treatment, thereby restoring enzymatic and metabolic activities critical for cheese ripening. Originating from the raw milk of one of the dairies involved in the study, the culture exhibited strong adaptability when applied in other dairies, despite variations in milk composition and equipment levels. Across multiple milk batches with variable chemical and microbial characteristics, the culture maintained a consistent acidification capacity, cheese yield, and microbial development patterns. These results were reflected in the preserved sensory quality of cheeses ripened for up to six months. Consumer trials further validated the approach, showing high approval ratings for cheeses produced with the biodiverse starter. Importantly, while supporting production standardisation, the culture maintained the distinctive sensory identity of cheeses from individual facilities. This was achieved through dynamic interactions between the inoculated strains and residual native microbiota, modulated by site-specific milk composition, leading to diverse yet consistent sensory expressions across dairy sites. Future studies, including commercial starter controls, would further strengthen these findings and provide comparative performance data. Overall, these preliminary results indicate the potential applicability of characterised natural starter cultures in diverse artisanal cheesemaking contexts. Further validation involving a larger number of dairy producers would be necessary to confirm their reproducibility and support a possible scale-up to industrial implementation. Moreover, tracking the specific contribution and fate of individual starter strains during cheesemaking and ripening should be another point to be addressed in future research. The findings highlight the value of natural starter cultures as tools to reconcile modern food safety standards with the preservation of microbial diversity and artisanal cheese typicity. Reviving biodiversity-driven traditional practices not only safeguards intangible cultural heritage but also enhances the economic value of regional dairy products through reproducible quality and distinctive sensory profiles. Such approaches deserve priority within PDO and traditional artisanal cheese frameworks, where microbial authenticity remains inseparable from product identity.

Author Contributions

Conceptualization, L.C. and R.C.; methodology, L.C., A.P., M.A., C.P., M.P., and R.C.; software, L.C., M.A., C.P., and M.P.; formal analysis, L.C., A.P., I.D., C.P., and M.P.; resources, R.C.; data curation, L.C., M.A., C.P., and M.P.; writing—original draft preparation, L.C.; writing—review and editing, L.C., M.A., C.P., M.P., and R.C.; supervision, L.C.; funding acquisition, R.C. All authors have read and agreed to the published version of the manuscript.

Funding

This research was funded by the Regione Autonoma della Sardegna—Progetto ValIdeS—Valorizzazione e tutela dei sistemi di produzione agroalimentare Identitari del centro Sardegna—L.R. 7/2007, “Promozione della ricerca scientifica e dell’innovazione tecnologica in Sardegna” annualità 2020 – CUP B79C20000710002.

Institutional Review Board Statement

Ethical review and approval were waived for this study, as the sensory analysis involved only adult volunteers performing non-invasive evaluations of food samples under controlled conditions. The research did not include the collection of health-related or identifying personal data, did not involve vulnerable populations, and was conducted on a GRAS food matrix using standardised sensory protocols. In accordance with European and national principles [38,46,47], such low-risk, non-clinical sensory tests are exempt from formal ethics committee review.

Informed Consent Statement

Informed consent was obtained from all participants prior to testing. Participation was voluntary, anonymous, and limited to the sensory evaluation of food products under standardised laboratory conditions.

Data Availability Statement

The original contributions presented in this study are included in the article. Further inquiries can be directed to the corresponding author.

Conflicts of Interest

The authors declare no conflicts of interest.

References

  1. Carminati, D.; Giraffa, G.; Quiberoni, A.; Binetti, A.; Suárez, V.; Reinheimer, J. Advances and trends in starter cultures for dairy fermentations. In Biotechnology of Lactic Acid Bacteria: Novel Applications; Mozzi, F., Raya, R.R., Vignolo, G.M., Eds.; Wiley Online Library: Hoboken, NJ, USA, 2010; pp. 177–192. [Google Scholar] [CrossRef]
  2. Cogan, T.M.; Beresford, T.P.; Steele, J.; Broadbent, J.; Shah, N.P.; Ustunol, Z. Invited review: Advances in starter cultures and cultured foods. J. Dairy. Sci. 2007, 90, 4005–4021. [Google Scholar] [CrossRef]
  3. Ercolini, D.; Frisso, G.; Mauriello, G.; Salvatore, F.; Coppola, S. Microbial diversity in natural whey cultures used for the production of Caciocavallo Silano PDO cheese. Int. J. Food Microbiol. 2008, 124, 164–170. [Google Scholar] [CrossRef]
  4. Kelleher, P.; Murphy, J.; Mahony, J.; van Sinderen, D. Next-generation sequencing as an approach to dairy starter selection. Dairy Sci. Technol. 2015, 95, 545–568. [Google Scholar] [CrossRef]
  5. Popović, N.; Brdarić, E.; Đokić, J.; Dinić, M.; Veljović, K.; Golić, N.; Terzić-Vidojević, A. Yogurt produced by novel natural starter cultures improves gut epithelial barrier in vitro. Microorganisms 2020, 8, 1586. [Google Scholar] [CrossRef]
  6. Parente, E.; Cogan, T.M.; Powell, I. Starter Cultures: General Aspects; Academic Press: Cambridge, MA, USA, 2017; pp. 201–226. [Google Scholar] [CrossRef]
  7. Settanni, L.; Moschetti, G. Non-starter lactic acid bacteria used to improve cheese quality and provide health benefits. Food Microbiol. 2010, 27, 691–697. [Google Scholar] [CrossRef] [PubMed]
  8. Chessa, L.; Paba, A.; Daga, E.; Dupré, I.; Comunian, R. Biodiversity and safety assessment of half-century preserved natural starter cultures for Pecorino Romano PDO cheese. Microorganisms 2021, 9, 1363. [Google Scholar] [CrossRef]
  9. Chessa, L.; Paba, A.; Daga, E.; Dupré, I.; Piga, C.; Di Salvo, R.; Mura, M.; Addis, M.; Comunian, R. Autochthonous natural starter cultures: A chance to preserve biodiversity and quality of Pecorino Romano PDO cheese. Sustainability 2021, 13, 8214. [Google Scholar] [CrossRef]
  10. Montel, M.C.; Buchin, S.; Mallet, A.; Delbes-Paus, C.; Vuitton, D.A.; Desmasures, N.; Berthier, F. Traditional cheeses: Rich and diverse microbiota with associated benefits. Int. J. Food Microbiol. 2014, 177, 136–154. [Google Scholar] [CrossRef]
  11. García-Díez, J.; Saraiva, C. Use of starter cultures in foods from animal origin to improve their safety. Int. J. Environ. Res. Public Health 2021, 18, 2544. [Google Scholar] [CrossRef]
  12. Coelho, M.C.; Malcata, F.X.; Silva, C.C.G. Lactic acid bacteria in raw-milk cheeses: From starter cultures to probiotic functions. Foods 2022, 11, 2276. [Google Scholar] [CrossRef] [PubMed]
  13. Andrighetto, C.; Marcazzan, G.; Lombardi, A. Use of RAPD-PCR and TTGE for the evaluation of biodiversity of whey cultures for Grana Padano cheese. Lett. Appl. Microbiol. 2004, 38, 400–405. [Google Scholar] [CrossRef]
  14. Panesar, P.S. Fermented dairy products: Starter cultures and potential nutritional benefits. Food Nutr. Sci. 2011, 2, 5. [Google Scholar] [CrossRef]
  15. Randazzo, C.L.; Torriani, S.; Akkermans, A.D.L.; De Vos, W.M.; Vaughan, E.E. Diversity, dynamics, and activity of bacterial communities during production of an artisanal sicilian cheese as evaluated by 16S rRNA analysis. Appl. Env. Microbiol. 2002, 68, 1882–1892. [Google Scholar] [CrossRef]
  16. Chessa, L.; Daga, E.; Dupré, I.; Paba, A.; Fozzi, M.C.; Dedola, D.G.; Comunian, R. Biodiversity and safety: Cohabitation experimentation in undefined starter cultures for traditional dairy products. Fermentation 2024, 10, 29. [Google Scholar] [CrossRef]
  17. Chessa, L.; Paba, A.; Dupré, I.; Daga, E.; Fozzi, M.C.; Comunian, R. A strategy for the recovery of raw ewe’s milk microbiodiversity to develop natural starter cultures for traditional foods. Microorganisms 2023, 11, 823. [Google Scholar] [CrossRef]
  18. Cremonesi, P.; Vanoni, L.; Morandi, S.; Silvetti, T.; Castiglioni, B.; Brasca, M. Development of a pentaplex PCR assay for the simultaneous detection of Streptococcus thermophilus, Lactobacillus delbrueckii subsp. bulgaricus, L. delbrueckii subsp. lactis, L. helveticus, L. fermentum in whey starter for Grana Padano cheese. Int. J. Food Microbiol. 2011, 146, 207–211. [Google Scholar] [CrossRef]
  19. Chessa, L.; Paba, A.; Daga, E.; Comunian, R. Effect of growth media on natural starter culture composition and performance evaluated with a polyphasic approach. Int. J. Dairy. Technol. 2019, 72, 152–158. [Google Scholar] [CrossRef]
  20. Hardy, J. Le fromage. In Paris: Techniques et Documents, 2nd ed.; Eck, A., Ed.; Lavoisier: Paris, France, 1987; pp. 37–60. [Google Scholar]
  21. Guinee, T.P.; O’Kennedy, B.T.; Kelly, P.M. Effect of milk protein standardization using different methods on the composition and yields of Cheddar cheese. J. Dairy. Sci. 2006, 89, 468–482. [Google Scholar] [CrossRef]
  22. Pirisi, A.; Murgia, A.; Scintu, M.F. Estimate of Pecorino Romano and Pecorino Sardo cheese yield from the protein and fat contents in sheep milk. Sci. Tec. Latt. Casear 1994, 45, 476–483. [Google Scholar]
  23. Isolini, D.; Grand, M.; Glâttli, H. Selektivmedien zum Nachweis von obligat und fakultativ heterofermentativen Laklobazillen. Schweiz. Milchw. Forsch. 1990, 19, 57–59. [Google Scholar]
  24. Bottazzi, V.; Ledda, A.; Arrizza, S. Bacteries fermentant les citrates et gonflement du fromage “Pecorino Romano”. Lait 1971, 51, 328–331. [Google Scholar] [CrossRef]
  25. ISO 6731:2010 [IDF 21:2010]; Milk, Cream and Evaporated Milk—Determination of Total Solids Content. International Organisation for Standardization (ISO): Geneva, Switzerland, 2010.
  26. ISO 5534:2004 [IDF 4:2004]; Cheese and Processed Cheese—Determination of the Total Solids Content. International Organisation for Standardization (ISO): Geneva, Switzerland, 2004.
  27. Soxhlet, F. Die gewichtsanalytische Bestimmung des Milchfettes. Dinglers Polyt. J. 1879, 232, 461–465. [Google Scholar]
  28. ISO 8968-1:2014 [IDF 20-1:2014]; Milk and Milk Products—Determination of Nitrogen Content. Part 1: Kjeldahl Principle and Crude Protein Calculation. International Organization for Standardization (ISO): Geneva, Switzerland, 2014.
  29. ISO 5943 [IDF 88:2006]; Cheese and Processed Cheese Products—Determination of Chloride Content—Potentiometric Titration Method. International Organization for Standardization (ISO): Geneva, Switzerland, 2006.
  30. Idda, I.; Spano, N.; Addis, M.; Galistu, G.; Ibba, I.; Nurchi, V.M.; Pilo, M.I.; Scintu, M.F.; Piredda, G.; Sanna, G. Optimization of a newly established gas-chromatographic method for determining lactose and galactose traces: Application to Pecorino Romano cheese. J. Food Compos. Anal. 2018, 74, 89–94. [Google Scholar] [CrossRef]
  31. Jiang, J.; Bjoerck, L.; Fondén, R.; Emanuelson, M. Occurrence of conjugated cis-9,trans-11-octadecadienoic acid in bovine milk: Effects of feed and dietary regimen. J. Dairy Sci. 1996, 79, 438–445. [Google Scholar] [CrossRef] [PubMed]
  32. ISO 15884:2002 [IDF 182:2002]; Milk Fat Preparation of Fatty Acid Methyl Esters. International Organization for Standardization (ISO): Geneva, Switzerland, 2002.
  33. Caredda, M.; Addis, M.; Ibba, I.; Leardi, R.; Scintu, M.F.; Piredda, G.; Sanna, G. Prediction of fatty acid content in sheep milk by Mid-Infrared spectrometry with a selection of wavelengths by Genetic Algorithms. LWT 2016, 65, 503–510. [Google Scholar] [CrossRef]
  34. Panfili, G.; Manzi, P.; Pizzoferrato, L. High-performance liquid chromatographic method for the simultaneous determination of tocopherols, carotenes, and retinol and its geometric isomers in Italian cheeses. Analyst 1994, 119, 1161–1165. [Google Scholar] [CrossRef]
  35. Manzi, P.; Panfili, G.; Pizzoferrato, L. Normal and reversed-phase HPLC for more complete evaluation of tocopherols, retinols, carotenes and sterols in dairy products. Chromatographia 1996, 43, 89–93. [Google Scholar] [CrossRef]
  36. Addis, M.; Piredda, G.; Pes, M.; Di Salvo, R.; Scintu, M.F.; Pirisi, A. Effect of the use of three different lamb paste rennets on lipolysis of the PDO Pecorino Romano Cheese. Int. Dairy J. 2005, 15, 563–569. [Google Scholar] [CrossRef]
  37. Gripon, J.C.; Desmazeaud, M.J.; Le Bars, D.; Bergere, J.L. Etude du rôle des micro-organismes et des enzymes au cours de la maturation des fromages. II.-Influence de la présure commerciale. Lait 1975, 55, 502–516. [Google Scholar] [CrossRef]
  38. Institute of Food Science & Technology (IFST). Guidelines for Ethical and Professional Practices for the Sensory Analysis of Foods. Available online: https://www.ifst.org (accessed on 12 November 2025).
  39. Regulation (EU) 2016/679 of the European Parliament and of the Council of 27 April 2016 on the Protection of Natural Persons with Regard to the Processing of Personal Data and on the Free Movement of Such Data, and Repealing Directive 95/46/EC (General Data Protection Regulation); Official Journal of the European Union: Strasbourg, France, 2016.
  40. Fiszman, S.; Salgado, N.; Orrego, C.E.; Ares, G. Comparison of methods for generating sensory vocabulary with consumers: A case study with two types of satiating foods. Food Qual. Prefer. 2015, 44, 111–118. [Google Scholar] [CrossRef]
  41. Thomson, D.M.H.; McEwan, J.A. An application of the repertory grid method to investigate consumer perceptions of foods. Appetite 1988, 10, 181–193. [Google Scholar] [CrossRef]
  42. Ares, G.; Reis, F.; Oliveira, D.; Antúnez, L.; Vidal, L.; Giménez, A.; Chheang, S.L.; Hunter, D.C.; Kam, K.; Roigard, C.M.; et al. Recommendations for use of balanced presentation order of terms in CATA questions. Food Qual. Prefer. 2015, 46, 137–141. [Google Scholar] [CrossRef]
  43. ISO 11136:2014; Sensory Analysis—Methodology—General Guidance for Conducting Hedonic Tests with Consumers in a Controlled Area. International Organisation for Standardization (ISO): Geneva, Switzerland, 2014.
  44. ISO 8589:2007; Sensory Analysis—General Guidance for the Design of Test Rooms. International Organisation for Standardization (ISO): Geneva, Switzerland, 2007.
  45. ISO 22935-2:2023 [IDF 99-2:2023]; Milk and Milk Products—Sensory Analysis—Part 2: Methods for Sensory Evaluation. International Organisation for Standardization (ISO): Geneva, Switzerland, 2023.
  46. Regulation (EU) No 536/2014 of the European Parliament and of the Council of 16 April 2014 on Clinical Trials on Medicinal Products for Human Use, and Repealing Directive 2001/20/EC Text with EEA Relevance; Official Journal of the European Union: Strasbourg, France, 2014.
  47. Italian Ministry of Health. Orientamenti per i Comitati Etici in Italia; Presidenza del Consiglio dei Ministri: Rome, Italy, 2001.
  48. Ares, G.; Jaeger, S.R. 11—Check-All-That-Apply (CATA) Questions with Consumers in Practice: Experimental Considerations and Impact on Outcome. In Rapid Sens Prof Tech; Delarue, J., Lawlor, J.B., Rogeaux, M., Eds.; Woodhead Publishing: Cambridge, UK, 2015; pp. 227–245. [Google Scholar] [CrossRef]
  49. Varela, P.; Ares, G. Sensory profiling, the blurred line between sensory and consumer science. A review of novel methods for product characterization. Food Res. Int. 2012, 48, 893–908. [Google Scholar] [CrossRef]
  50. Marshall, V.M. Starter cultures for milk fermentation and their characteristics. Int. J. Dairy. Technol. 1993, 46, 49–56. [Google Scholar] [CrossRef]
  51. González-González, F.; Delgado, S.; Ruiz, L.; Margolles, A.; Ruas-Madiedo, P. Functional bacterial cultures for dairy applications: Towards improving safety, quality, nutritional and health benefit aspects. J. Appl. Microbiol. 2022, 133, 212–229. [Google Scholar] [CrossRef]
  52. Comunian, R.; Chessa, L. Development and application of starter cultures. Fermentation 2024, 10, 512. [Google Scholar] [CrossRef]
  53. EFSA Panel on Biological Hazards; Allende, A.; Alvarez-Ordóñez, A.; Bortolaia, V.; Bover-Cid, S.; De Cesare, A.; Dohmen, W.; Guillier, L.; Jacxsens, L.; Nauta, M.; et al. Update of the list of qualified presumption of safety (QPS) recommended microbiological agents intentionally added to food or feed as notified to EFSA 21: Suitability of taxonomic units notified to EFSA until September 2024. EFSA J. 2025, 23, e9169. [Google Scholar] [CrossRef] [PubMed]
  54. Pulina, G.; Atzori, A.S.; Dimauro, C.; Ibba, I.; Gaias, G.F.; Correddu, F.; Nudda, A. The milk fingerprint of Sardinian dairy sheep: Quality and yield of milk used for Pecorino Romano P.D.O. cheese production on population-based 5-year survey. Ital. J. Anim. Sci. 2021, 20, 171–180. [Google Scholar] [CrossRef]
  55. Pirisi, A.; Pes, M. Formaggi Ovi-Caprini. In Manuale Caseario; Tecniche Nuove Milano: Milano, Italy, 2011. [Google Scholar]
  56. Ekstrand, B. Antimicrobial factors in milk—A review. Food Biotechnol. 1989, 3, 105–126. [Google Scholar] [CrossRef]
  57. Tanaka, T. Antimicrobial Activity of Lactoferrin and Lactoperoxidase in Milk; Nova Science Publisher Inc.: New York, NY, USA, 2007. [Google Scholar]
  58. Guinee, T.P.; Mulholland, E.O.; Kelly, J.; Callaghan, D.J.O. Effect of protein-to-fat ratio of milk on the composition, manufacturing efficiency, and yield of Cheddar cheese. J. Dairy. Sci. 2007, 90, 110–123. [Google Scholar] [CrossRef]
  59. Klijn, N.; Nieuwenhof, F.F.; Hoolwerf, J.D.; van der Waals, C.B.; Weerkamp, A.H. Identification of Clostridium tyrobutyricum as the causative agent of late blowing in cheese by species-specific PCR amplification. Appl. Env. Microbiol. 1995, 61, 2919–2924. [Google Scholar] [CrossRef]
  60. Sousa, M.J.; Ardö, Y.; McSweeney, P.L.H. Advances in the study of proteolysis during cheese ripening. Int. Dairy J. 2001, 11, 327–345. [Google Scholar] [CrossRef]
  61. Afshari, R.; Pillidge, C.J.; Dias, D.A.; Osborn, A.M.; Gill, H. Cheesomics: The future pathway to understanding cheese flavour and quality. Crit. Rev. Food Sci. Nutr. 2020, 60, 33–47. [Google Scholar] [CrossRef]
  62. Moreno, M.R.F.; Sarantinopoulos, P.; Tsakalidou, E.; De Vuyst, L. The role and application of enterococci in food and health. Int. J. Food Microbiol. 2006, 106, 1–24. [Google Scholar] [CrossRef]
  63. Pisano, M.B.; Fadda, M.E.; Deplano, M.; Corda, A.; Cosentino, S. Microbiological and chemical characterization of Fiore Sardo, a traditional Sardinian cheese made from ewe’s milk. Int. J. Dairy Technol. 2006, 59, 171–179. [Google Scholar] [CrossRef]
  64. Ruaro, A.; Andrighetto, C.; Torriani, S.; Lombardi, A. Biodiversity and characterization of indigenous coagulase-negative staphylococci isolated from raw milk and cheese of North Italy. Food Microbiol. 2013, 34, 106–111. [Google Scholar] [CrossRef]
  65. Heo, S.; Lee, J.H.; Jeong, D.W. Food-derived coagulase-negative Staphylococcus as starter cultures for fermented foods. Food Sci. Biotechnol. 2020, 29, 1023–1035. [Google Scholar] [CrossRef]
  66. Beresford, T.P. Lactic Acid Bacteria|Citrate Fermentation by Lactic Acid Bacteria. In Encyclopedia of Dairy Sciences, 2nd ed.; Fuquay, J.W., Ed.; Academic Press: San Diego, CA, USA, 2011; pp. 166–172. [Google Scholar] [CrossRef]
  67. McSweeney, P.L.H.; Sousa, M.J. Biochemical pathways for the production of flavour compounds in cheeses during ripening: A review. Lait 2000, 80, 293–324. [Google Scholar] [CrossRef]
  68. Sheehan, J.J. Cheese: Avoidance of Gas Blowing. In Encyclopedia of Dairy Sciences, 3rd ed.; Academic Press: Cambridge, MA, USA, 2022. [Google Scholar]
  69. Ravyts, F.; Vuyst, L.D.; Leroy, F. Bacterial diversity and functionalities in food fermentations. Eng. Life Sci. 2012, 12, 356–367. [Google Scholar] [CrossRef]
  70. Carr, F.J.; Don, C.; Maida, N. The lactic acid bacteria: A literature survey. Crit. Rev. Microbiol. 2002, 28, 281–370. [Google Scholar] [CrossRef] [PubMed]
  71. Pavunc, A.; Novak, J.; Kos, B.; Uroić, K.; Blažić, M.; Šušković, J. Characterization and application of autochthonous starter cultures for fresh cheese production. Food Technol. Biotechnol. 2012, 50, 141. [Google Scholar]
  72. Italian Ministry of Health 0024708-P-16/06/2016. Aggiornamenti su Integratori Alimentari, Tolleranze Analitiche Applicabili in fase di Controllo e Indicazioni Sull’assenza o la Ridotta Presenza di Lattosio nei Prodotti Lattiero-Caseari. Available online: https://www.agrar.it/upload/documenti/8-Circolare%20Ministero%20della%20Salute%20Giugno%202016%20-%20Estratti%20e%20titolazioni.pdf (accessed on 18 November 2025).
  73. Arrizza, S. Caratteristiche microbiologiche della scotta fermento. Sci. Tec. Latt. Casear 1972, 23, 226–230. [Google Scholar]
  74. EU No 1169/2011 of the European Parliament and of the Council L. 304/18 22.11.2011; Official Journal of the European Union: Strasbourg, France, 2011.
  75. CREA—Consiglio per la Ricerca in Agricoltura e l’Analisi dell’Economia Agraria. Centro di Ricerca Alimenti e Nutrizione. Linee Guida per una Sana Alimentazione; CREA: Roma, Italy, 2018. [Google Scholar]
  76. Regulation EC No 1924/2006 of the European Parliament and of the Council L. 404/9 30.12.2006; Official Journal of the European Union: Strasbourg, France, 2006.
  77. Ares, G.; Barreiro, C.; Deliza, R.; Giménez, A.; Gámbaro, A. Application of a check-all-that-apply question to the development of chocolate milk desserts. J. Sens. Stud. 2010, 25, 67–86. [Google Scholar] [CrossRef]
  78. Ares, G.; de Andrade, J.C.; Antúnez, L.; Alcaire, F.; Swaney-Stueve, M.; Gordon, S.; Jaeger, S.R. Hedonic product optimisation: CATA questions as alternatives to JAR scales. Food Qual. Prefer. 2017, 55, 67–78. [Google Scholar] [CrossRef]
  79. Han, P.; Fark, T.; de Wijk, R.A.; Roudnitzky, N.; Iannilli, E.; Seo, H.-S.; Hummel, T. Modulation of sensory perception of cheese attributes intensity and texture liking via ortho- and retro-nasal odors. Food Qual. Prefer. 2019, 73, 1–7. [Google Scholar] [CrossRef]
  80. Pirc, M.; Mu, S.; Frissen, G.; Stieger, M.; Boesveldt, S. Smells like fat: A systematic scoping review on the contribution of olfaction to fat perception in humans and rodents. Food Qual. Prefer. 2023, 107, 104847. [Google Scholar] [CrossRef]
  81. Silva, L.F.; Sunakozawa, T.N.; Monteiro, D.A.; Casella, T.; Conti, A.C.; Todorov, S.D.; Barretto Penna, A.L. Potential of cheese-associated lactic acid bacteria to metabolize citrate and produce organic acids and acetoin. Metabolites 2023, 13, 1134. [Google Scholar] [CrossRef]
  82. Libudzisz, Z.; Galewska, E. Citrate metabolism in Lactococcus lactis subsp. lactis var. diacetylactis strains. Food 1991, 35, 611–618. [Google Scholar] [CrossRef]
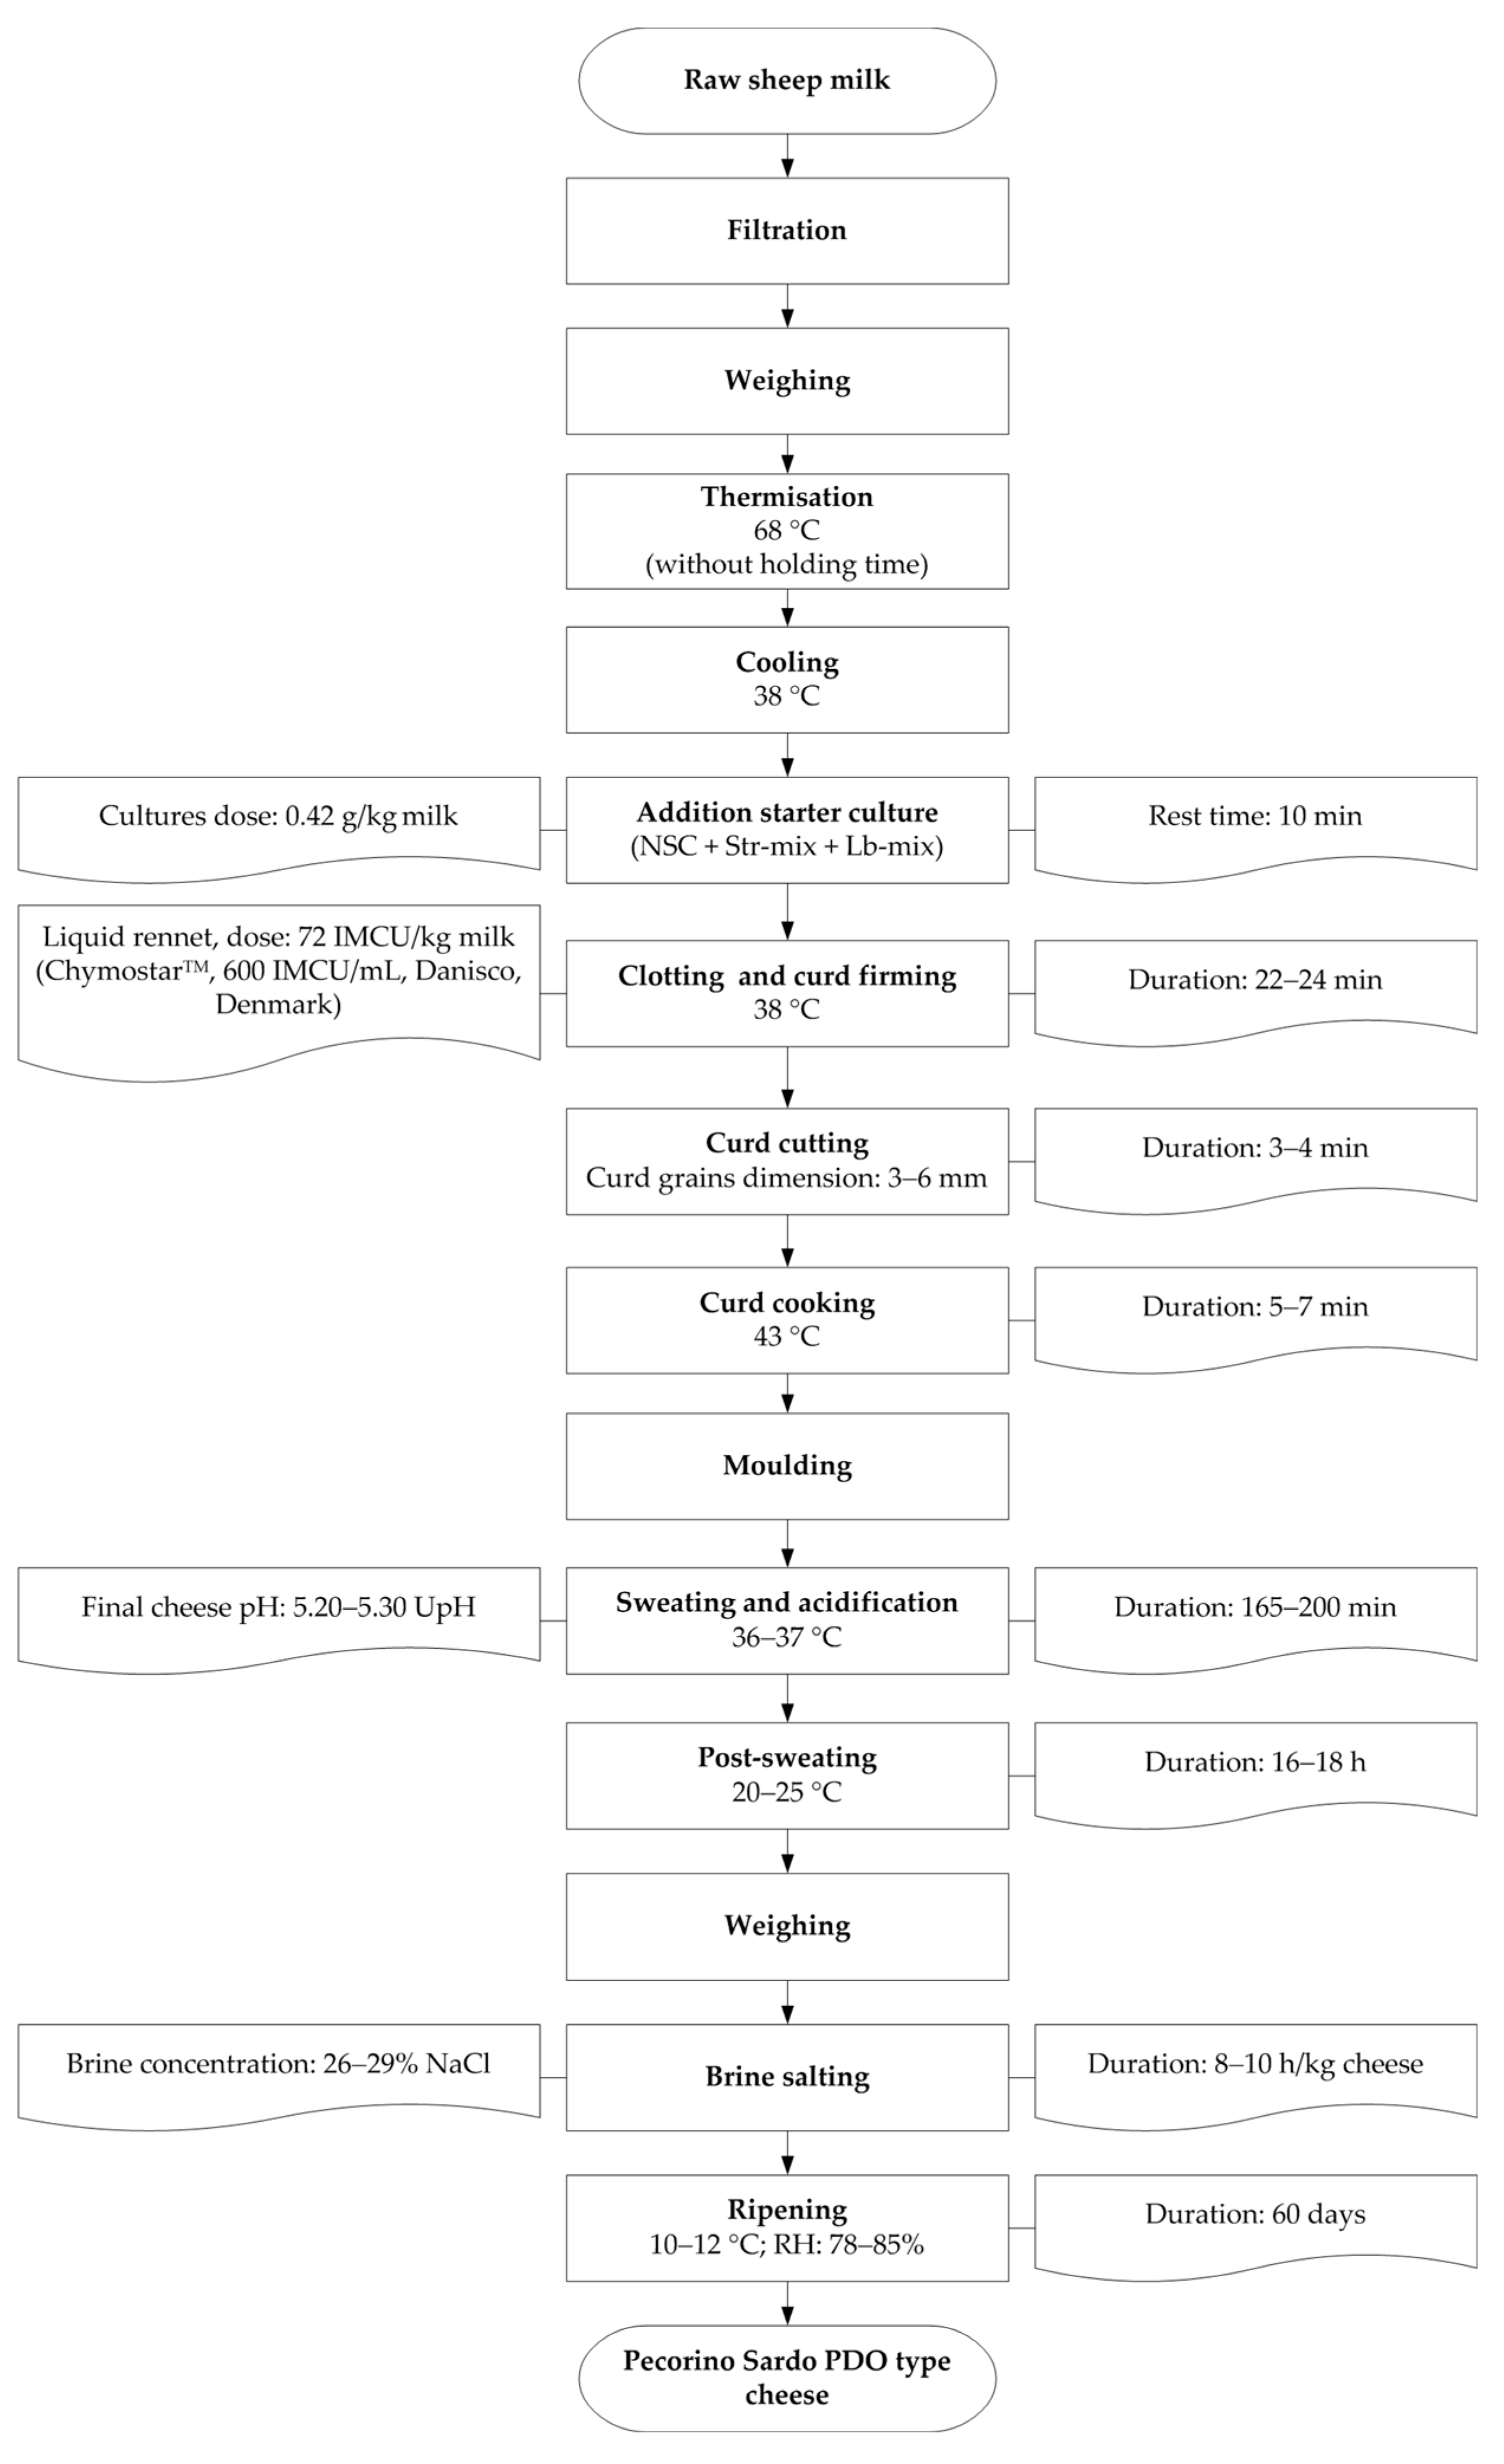
Figure 1. Technological cheesemaking scheme.
Fermentation 11 00660 g001
Figure 2. UPGMA cluster analysis, using Pearson correlation, of (GTG)5 rep-PCR of 31 Streptococcus thermophilus isolates from the Str-mix natural culture collected from a Sardinian dairy farm and preserved ex situ at the Agris-BNSS culture collection (www.mbds.it). The isolates sharing ≥93% similarity are considered to belong to the same genotype.
Fermentation 11 00660 g002
Figure 3. UPGMA cluster analysis, using Pearson correlation, of (GTG)5 rep-PCR of 29 Lactobacillus delbrueckii isolates from the Lb-mix natural culture collected from a Sardinian dairy farm and preserved ex situ at the Agris-BNSS culture collection (www.mbds.it). The isolates sharing ≥93% similarity are considered to belong to the same genotype.
Fermentation 11 00660 g003
Figure 4. Microbial counts in the milk samples used by the dairies involved in the study (AC). For each milk (raw, thermised, or inoculated), the concentrations of presumptive mesophilic and thermophilic cocci, presumptive mesophilic and thermophilic lactobacilli, enterococci, staphylococci, moulds and yeasts, citrate-fermenting bacteria, coliforms, clostridia, and presumptive propionibacteria are shown. Average values ± SD from three independent cheesemaking days are reported and expressed as Log CFU/mL of milk. For each dairy (AC), the concentrations of each microbial group in raw, thermised, and inoculated milk were compared. Different letters above the respective columns indicate significant (P ≤ 0.05) differences in Log CFU/mL, according to the ANOVA Tukey–Kramer post hoc test.
Fermentation 11 00660 g004
Figure 5. Microbial counts in 1-day cheeses (a) and after 60 days (b) of ripening, produced by the three dairies involved in the study (A, B, and C). Average values ± SD from three independent cheesemaking days are shown and expressed as Log CFU/g of cheese. For each microbial group, concentrations in products from dairies A, B, and C were compared. Different letters above the columns of the chart (where present) indicate significant (P ≤ 0.05) differences in Log CFU/g, according to the ANOVA Tukey–Kramer post hoc test.
Fermentation 11 00660 g005
Figure 6. Biplot of correspondence analysis (CA) performed on sensory descriptor frequencies, with mean acceptance values included as supplementary variables, comparing cheeses from three dairies (A, B, and C) at two ripening periods (60 and 180 days).
Fermentation 11 00660 g006
Table 1. Technological parameters measured during cheesemaking 1.
Dairies
ABC
Amount of milk processed (kg)103.8 ± 0.02 a62.4 ± 0.04 b60 ± 0.00 c
pH of raw milk (UpH)6.62 ± 0.076.71 ± 0.046.68 ± 0.00
Thermisation temperature (°C)68.3 ± 0.368.2 ± 0.268.6 ± 0.4
Clotting temperature (°C)37.8 ± 0.337.8 ± 0.838.1 ± 0.1
Rennet dose (IMCU/kg)727272
Clotting and curd firming time (min)22 ± 1.222 ± 1.024 ± 1.2
Curd cutting time (min)4.0 ± 0.0 a4.3 ± 0.6 a3.0 ± 0.0 b
Semi-cooking at 43 °C time (min)7.3 ± 0.6 a6.3 ± 0.6 a5.0 ± 0.0 b
pH of cheese at the start sweating (UpH)6.38 ± 0.126.36 ± 0.056.38 ± 0.02
Sweating duration at 36–37 °C (min)220 ± 27165 ± 21185 ± 24
pH of cheese at the end of sweating (UpH)5.29 ± 0.03 a5.27 ± 0.02 a5.19 ± 0.02 b
pH of 1-day cheese (UpH)5.20 ± 0.12 ab5.07 ± 0.02 b5.27 ± 0.02 a
Cheese wheels produced (n.)533
Weight of single cheese wheel (kg)3.1 ± 0.02 b3.5 ± 0.3 a2.7 ± 0.1 b
Weight cheese produced (kg)15.4 ± 0.1 a10.6 ± 0.8 b8.2 ± 0.2 c
Brine concentration (%)262928
Salting time (h)343028
1 Values are reported as mean ± standard deviation. a, b, c Different letters within the same row indicate statistically significant differences (P ≤ 0.05).
Table 2. Cheese yield, milk fat, and protein recoveries 1.
Dairies
ABC
Cheese yield 2   
YA (kg/100 kg)14.9 ± 0.1 b17.0 ± 1.2 a13.6 ± 0.3 c
YAM (kg/100 kg)14.9 ± 0.4 b17.3 ± 1.1 a13.2 ± 0.2 c
Yp (kg/100 kg)14.6 ± 0.2 b17.0 ± 0.8 a13.1 ± 0.01 c
YAN (kg/100 kg)15.5 ± 0.2 ab14.9 ± 0.3 b16.0 ± 0.4 a
YANM (kg/100 kg)15.5 ± 0.215.2 ± 0.315.4 ± 0.3
Recoveries 3   
FR (%)77.5 ± 2.5 b77.1 ± 1.8 b82.5 ± 1.2 a
PR (%)79.9 ± 1.179.4 ± 1.577.2 ± 0.4
1 Values are reported as mean ± standard deviation. a, b, c Different letters within the same row indicate statistically significant differences (P ≤ 0.05). 2 YA: actual yield was measured as kilograms of cheese (after 1-day manufacturing cheese) per 100 kg of milk; YAM: moisture-adjusted cheese yield was calculated considering YA an equal moisture value (to 43%, wt/wt); YAN: actual yield per 100 kg of cheese milk normalised to reference levels of fat (5.32%, wt/wt) and protein (5.19%, wt/wt); YANM: moisture-adjusted actual normalised yield was calculated considering YAN an equal moisture value (to 43%, wt/wt, average moisture value of 1-day cheeses); Yp: predicted yield, calculated with the following equation: (1733 × milk protein% + 1257 × milk fat%), corrected for milk density. 3 FR: fat recovery (fat in cheese kg/fat in milk kg × 100); PR: protein recovery (protein in cheese kg/protein in milk kg × 100).
Table 3. Physico-chemical and compositional parameters of milk from dairies A, B, and C 1.
Dairies
ABC
Total Solids (g/100 g)15.9 ± 0.1 b18 ± 1 a14.7 ± 0.1 b
Fat (g/100 g)5.0 ± 0.1 b6.5 ± 0.6 a4.01 ± 0.01 b
Protein (g/100 g)5.09 ± 0.05 b5.5 ± 0.1 a4.93 ± 0.02 b
Casein (g/100 g)3.83 ± 0.04 b4.2 ± 0.1 a3.75 ± 0.01 b
Fat/Protein0.98 ± 0.04 b1.2 ± 0.1 a0.813 ± 0.002 c
Lactose (g/100 g)4.79 ± 0.044.8 ± 0.14.91 ± 0.04
1 Values are reported as mean ± standard deviation. a, b, c Different letters within the same row indicate statistically significant differences (P ≤ 0.05).
Table 4. Physico-chemical and compositional parameters of 1-day cheeses manufactured in the dairies A, B, and C 1.
Dairies
ABC
Moisture (g/100 g)43 ± 1 ab42 ± 1 b45 ± 1 a
Fat/Dry Matter (g/100 g)46 ± 1 b51 ± 1 a44.1 ± 0.4 b
Protein/Dry Matter (g/100 g)44 ± 1 a41 ± 1 b46 ± 1 a
Fat/Protein1.0 ± 0.1 b1.2 ± 0.1 a0.95 ± 0.01 b
Lactose (g/100 g)0.007 ± 0.0020.009 ± 0.0030.004 ± 0.001
1 Values are reported as mean ± standard deviation. a, b Different letters within the same row indicate statistically significant differences (P ≤ 0.05).
Table 5. Physico-chemical and compositional parameters of cheeses at 60 days of ripening from dairies A, B, and C 1.
Dairies
ABC
Moisture (g/100 g)38 ± 236.2 ± 0.437.1 ± 0.4
Fat/Dry Matter (g/100 g)45 ± 2 b50 ± 1 a42.5 ± 0.4 b
Protein/Dry Matter (g/100 g)44 ± 1 b38 ± 1 c46.2 ± 0.5 a
Fat/Protein1.0 ± 0.1 b1.32 ± 0.02 a0.92 ± 0.02 c
Lactose (g/100 g)0.0012 ± 0.0002 ab0.003 ± 0.001 a0.001 ± 0.001 b
NaCl (g/100 g)1.6 ± 0.11.5 ± 0.11.5 ± 0.1
NaCl/Moisture (g/100 g)4.3 ± 0.14.1 ± 0.34.1 ± 0.4
1 Values are reported as mean ± standard deviation. a, b, c Different letters within the same row indicate statistically significant differences (P ≤ 0.05).
Table 6. Nutritional label of cheeses at 60 days of ripening from dairies A, B, and C according to EU Reg. 1169/2011.
Per 100 g of Cheese Dairy RI (%) 1
ABC
Energy (kcal)36438435918 ÷ 19
Fat (g)28 b32 a27 b39 ÷ 46
of which:    
  
  • saturates (g)
19 ab21 a18 b90 ÷ 105
  
  • mono-unsaturates (g)
5.2 a5.1 a4.0 b 
  
  • polyunsaturates (g)
091.10.9 
Carbohydrate (g)000 
of which:    
  
  • sugars (g)
000 
Proteins (g)28 b24 c29 a48 ÷ 58
Salt (NaCl) (g)1.61.51.525 ÷ 27
Vitamin A (μg)32632631039 ÷ 41
Calcium (mg)109310421111130 ÷ 139
Zinc (mg)3.42 a2.74 b2.99 ab27 ÷ 34
Copper (mg)0.240.220.1212 ÷ 24
Magnesium (mg)58.5 a50.6 b56.3 a13 ÷ 16
1 Percentage of the reference intake of an average adult (8400 kJ/2000 kcal). a, b, c Different letters within the same row indicate statistically significant differences (P ≤ 0.05).
Table 7. Consumer study. P-values for comparisons of mean acceptance scores (±standard deviation) and relative frequencies of sensory descriptor selections, obtained, respectively, from consumer acceptance tests and Check-All-That-Apply (CATA) tests, among cheeses produced by three dairies (A, B, and C) at two ripening periods (60 and 180 days).
60 Days 180 Days
ABC ABC
Acceptancep-valuesmean scoresp-valuesmean scores
 0.02646.2 ± 1.46.4 ± 1.76.0 ± 1.70.92416.3 ± 1.76.3 ± 1.76.2 ± 1.7
CATA Descriptorsp-valuesrelative frequenciesp-valuesrelative frequencies
Bitter Taste0.2600.0710.0790.1190.1280.1170.1690.078
Sour Taste<0.00010.159 a0.310 b0.143 a0.3370.1560.1560.221
Salty Taste1.0000.1750.1750.1750.0030.247 b0.065 a0.182 ab
Sweet Taste0.0340.198 a0.167 ab0.103 a0.0250.143 ab0.221 b0.104 a
Pungent0.0040.032 a0.095 ab0.151 a0.8820.1560.1690.143
Exotic Fruit Aroma0.1350.0080.0400.0240.3680.0260.0260.000
Dried Fruit Aroma0.0970.0400 a0.0320.8460.0390.0260.039
Fresh Milk Aroma0.0200.175 ab0.238 b0.127 a0.4860.1040.1170.065
Boiled Milk Aroma0.2450.1110.127 a0.1750.9430.1560.1430.156
Butter Aroma0.0610.1900.230 a0.1270.8270.180.1820.156
Fresh Grass Aroma0.0270.056 a0.056 a0.008 b0.3680.0260.0260.000
Animal0.1040.0870.1590.1270.6620.1430.1300.104
Gummy0.1690.1900.1270.1980.0470.143 b0.039 a0.104 ab
Compact/Cohesive0.0750.4920.3730.4050.0390.338 b0.195 a0.260 ab
Grainy<0.00010.095 a0.087 a0.278 b0.0080.130 a0.286 b0.312 b
Pasty0.0420.302 a0.429 b0.373 ab0.3100.3640.4160.312
Traditional Cheese0.6770.1900.1590.1900.6740.2730.2860.325
Industrial Cheese<0.00010.175 a0.095 a0.278 b0.8620.1950.1690.169
Ripened Cheese0.0010.040 a0.048 a0.143 b0.1790.2080.1950.286
Fresh Cheese<0.00010.317 b0.333 b0.143 a0.1210.0650.0910.026
Tasty0.0020.373 a0.532 b0.357 a0.3680.4420.5320.429
Cleaned Mouthfeel0.8610.0790.0950.0870.0390.000 a0.052 b0.013 ab
Greasy Mouthfeel0.9180.1670.1750.1830.7380.1820.2210.195
Surprising0.0180.024 ab0.071 b0.008 a0.0450.091 b0.013 a0.039 ab
Anonymous0.0000.222 b0.048 a0.151 b0.4830.1430.0910.143
a, b If present, different letters indicate significant differences (P ≤ 0.05) among dairies in descriptor selection frequencies within each ripening period. Values in bold indicate statistically significant values (P ≤ 0.05).
Disclaimer/Publisher’s Note: The statements, opinions and data contained in all publications are solely those of the individual author(s) and contributor(s) and not of MDPI and/or the editor(s). MDPI and/or the editor(s) disclaim responsibility for any injury to people or property resulting from any ideas, methods, instructions or products referred to in the content.