Article

β-Glucan from Highland Barley Spent Grain: Yield, Molecular Weight, Physicochemical Properties, Antioxidant Capacity, and Gel Characteristics

1
School of Food and Biological Engineering, Jiangsu University, Zhenjiang 212013, China
2
State Key Laboratory of Hulless Barley and Yak Germplasm Resources and Genetic Improvement, Research Institute of Agriculture, Tibet Academy of Agriculture and Animal Husbandry Sciences, Lhasa 850000, China
*
Authors to whom correspondence should be addressed.
Fermentation 2025, 11(10), 600; https://doi.org/10.3390/fermentation11100600
Submission received: 4 September 2025 / Revised: 16 October 2025 / Accepted: 16 October 2025 / Published: 21 October 2025
(This article belongs to the Special Issue Advances in Fermented Foods and Beverages)

Abstract

β-Glucan from Tibetan highland barley (THB) is an excellent edible gel polysaccharide due to its unique hypoglycemic and antioxidant activities. However, direct extraction of β-glucan from THB exhibits low yields with higher costs. Given that highland barley spent grain (BSG) is a byproduct of the brewing process and is frequently considered waste, the efficient extraction of its β-glucan could promote high-value repurposing of BSG. In this study, 2.74% β-glucan (BSG-B) was extracted from Rhizopus oryzae (R. oryzae)-fermented BSG, which is lower than those from THB (THB-B: 4.62%) yet enabled value-added utilization of BSG. The molecular weight of BSG-B was 5.24 × 10⁶ Da, which significantly increased by 124.89% compared to that of THB-B. Fourier-transform infrared (FT-IR) spectroscopy showed similar absorption peaks in BSG-B and THB-B, except for structural modifications in the β-glucan pyranose ring induced by the fermentation of R. oryzae. Scanning electron microscopy (SEM) and atomic force microscopy (AFM) indicated that BSG-B possesses a more compact structure and lower aggregation heights compared to THB-B. Moreover, BSG-B demonstrated superior antioxidant capacities to THB-B in NO/DPPH/ABTS/reducing power assays, and lower apparent viscosity and oil adsorption capacity, likely attributed to the fermentation of R. oryzae. This study establishes a foundation for extracting higher-molecular-weight antioxidant β-glucan from BSG.

1. Introduction

Tibetan highland barley (THB; Hordeum vulgare L. var. nudum) is mainly distributed in the Qinghai–Tibet Plateau of China [1,2]. THB exhibits excellent cold resistance and stress tolerance, enabling normal maturation under harsh high-altitude environmental conditions (4500 m), which is the main crop planted in Xizang, the staple food of Tibetan people, and an important feed for livestock [3,4]. Compared with other conventional crops, THB contains higher protein, fiber, and vitamin content alongside lower fat and sugar content [5,6]. THB also comprises rich phenolic compounds [7], anthocyanins, and flavonoids [8], exhibiting potent free radical scavenging activity [9], which regulates human blood sugar and lipid metabolism and prevents metabolic disorders [10,11,12]. Prominently, THB contains a high content of β-glucan (3.66–8.62%), which is mainly distributed in the aleurone layer and cell wall of endosperm [1]. β-Glucan forms a stable gel matrix with notable applicability in food processing. It also exhibits bioactivity in blood glucose regulation [13], blood lipid improvement [14], immune system stimulation, and cardiovascular risk reduction [15,16,17].
Highland barley wine (HBW) [18], a typical low-alcohol fermented wine in China, has been recognized as the traditional libation of indigenous Tibetan people inhabiting the Qinghai–Tibetan plateau [19]. This wine is made by fermentation of highland barley as the main raw material, and its alcohol content is relatively low (4–8%) with a unique flavor and aroma of highland barley wine [20,21]. During the fermentation process, flavonoids, total phenolic compounds, β-glucan, and other soluble dietary fiber in highland barley are incorporated into HBW [22]. However, the β-glucan content in HBW constitutes only a small fraction of that in highland barley [23], and it may still remain in the large amount of highland barley spent grain (BSG) after fermentation, which is typically used directly as feed.
β-Glucan is a polysaccharide consisting of D-glucose monomers linked by β-1,3 and β-1,4 or by β-1,3 and β-1,6 glucoside bonds [24], which are widely distributed in the cell walls of bacteria, fungi, yeasts, and algae, and in the cell walls and aleurone layer of the endosperm of oats, barley, and other grains [25,26]. The β-glucan in cereals is usually composed of β-1,3 and β-1,4 glycosidic linkages, and the proportion of glycosidic linkages of β-glucan varies in different grain extracts [27]. β-Glucan, as a dietary fiber (DF), can form a gel in water due to its unique molecular structure, which not only improves food quality, but also has biological activities, such as lowering serum cholesterol level; lowering blood glucose [28]; exhibiting anti-inflammatory, immunomodulatory, and anti-tumor effects; and modulating the intestinal microbiome [29]. However, current methods for extracting β-glucan from cereals are usually destructive, which means that once β-glucan has been extracted from cereals, the remaining material is difficult to use for other purposes [30]. We discovered that a substantial quantity of BSG, remaining after the production of HBW, can be used to extract β-glucan. In this study, the β-glucan extracted from BSG was systematically analyzed, including its yield of extraction, molecular weight, morphologies, physicochemical properties, antioxidant activity, and gel characteristics, which were compared with the β-glucan directly extracted from THB. The aim of this study is to investigate the repurposing of BSG and the physicochemical properties and potential health benefits of β-glucan from BSG, which will provide a scientific basis for the β-glucan from BSG.

2. Materials and Methods

2.1. Material and Strain

The black highland barley used in this study was procured from Lhasa (Tibet, China). THB denotes unprocessed black Tibetan highland barley, whereas BSG denotes the spent grain remaining after the fermentation of the same mash with Rhizopus oryzae (R. oryzae). An overview of the preparation steps is provided in Figure 1, and the main preparation process was as follows: 200 g of black highland barley was mixed with 200 g of water, which was then heated at approximately 100 °C for 60 min and cooled to 30 °C. The cooled mash was inoculated with 8 g of R. oryzae (Sweet Fermentation Starter, Angel, Yichang, China), and fermented at 30 °C for 48 h. After fermentation, the fermentation broth was separated by filtration; the retained solids were collected as black highland barley spent grain (BSG). THB and BSG were dried in a hot air oven at 50 °C until they reached a constant weight. Subsequently, they were ground using a high-speed grinder and passed through a 100-mesh sieve. The resulting THB and BSG flours were stored in sealed bags at −20 °C for further use.

2.2. Extraction of β-Glucan

β-Glucan was extracted using a modified method by Laitinen et al. [27] (Figure S1). Initially, THB/BSG flour was refluxed with 80% (v/v) ethanol in a boiling water bath for 1 h at a 1:8 (w/v) ratio, followed by vacuum filtration. The residue was then washed twice with 95% ethanol and dried overnight in a hot air oven at 50 °C. Subsequently, the sample powder was mixed with water at a ratio of 25 g flour to 250 mL water and stirred in a water bath at 40 °C for 2 h. A water solution containing 10 g/L of α-amylase (Shifeng, Shanghai, China) was heated at 80 °C for 15 min, then added to the extract and stirred at 80 °C for 1 h until the iodine test showed no blue coloration. After cooling, the pH was adjusted to 7.5 using sodium hydroxide. Next, 0.1 g of pepsin (Macklin Biochemical, Shanghai, China) was added, and the mixture was stirred in a 40 °C water bath for 1 h, followed by boiling for 10 min to inactivate the enzymes. The extract was centrifuged at 10,000× g for 10 min, and the supernatant was collected with the pH adjusted to 6.0. The addition of 0.1 g xylanase (Qiansheng, Hefei, China) was followed by stirring at 55 °C for 1 h and boiling for 10 min. After centrifugation at 10,000× g for 10 min, the supernatant was collected, and 2.5 volumes of ethanol (95%, v/v) were added slowly under magnetic stirring. The mixture was left to stand overnight at 4 °C. The precipitate was collected and washed four times with twice the volume of ethanol (95%, v/v) at 2000× g for 2 min after each wash. Finally, the precipitate was washed in anhydrous ethanol and dried at 50 °C overnight, and the purified β-glucan was obtained. The β-glucan extracted from Tibetan Highland Barley was designated as THB-B, and that from barley spent grain as BSG-B.

2.3. Analysis of Extracted β-Glucan Composition and Content

2.3.1. Determination of Total Polysaccharide

The carbohydrate content was determined using the phenol-sulfuric acid method with glucose as the standard [31]. A solution with a gradient ranging from 0 to 0.1 mg/mL was prepared. One milliliter of this sample solution was mixed with 1 mL of 5% phenol solution. The mixture was shaken thoroughly, and 5 mL of 98% concentrated sulfuric acid was added gradually in portions, while the mixture was kept in an ice bath. After standing for 10 min, the mixture was shaken again in a boiling water bath for 20 min, and the absorbance was measured at 490 nm.

2.3.2. Determination of β-Glucan Content

The content of β-glucan was determined by using the BL863A kit (Biosharp, Beijing, China). The main methods include the following: The purified and dried β-glucan powder was dissolved in pure water to prepare a 10 mg/mL stock solution. Immediately before the assay, the stock solution was diluted to 4 mg/mL with 0.02 mol/L sodium phosphate buffer (pH 6.5); then, it was heated in boiling water for 2 min. The 5 mL solution was mixed with 2.5 mL of β-glucanase solution (10 U/mL) thoroughly, and incubated in a 50 °C water bath for 60 min, stirring 3–4 times during this period. An amount of 2.5 mL of 0.2 mol/L sodium acetate buffer was added and mixed well, and allowed to stand for 5 min. The mixture was centrifuged at 1600× g for 10 min, and 2.5 mL of the supernatant was collected. An amount of 2.5 mL of β-glucosidase solution was added and incubated in a 50 °C water bath for another 60 min. The absorbance was then measured at 520 nm.

2.3.3. Determination of Protein Content

The protein content was determined using the Coomassie Brilliant Blue G-250 method with bovine serum albumin as the standard [32], with slight modifications. Specifically, the sample was prepared to a concentration of 1.0 mg/mL. One milliliter of the sample was thoroughly mixed with 5 mL of Coomassie Brilliant Blue solution, and left to react for 15 min away from light. The absorbance was then measured at 595 nm.

2.4. Determination of Molecular Weight of β-Glucan

A high-performance size exclusion chromatography (SEC) method [33], utilizing multi-angle laser light scattering and a differential refractive index detector (SEC-MALLS, DAWN EOS, Wyatt Technology, Santa Barbara, CA, USA), was employed to determine the molecular weight (Mw) and polydispersity index (Mw/Mn) of β-glucan. The chromatographic analysis was performed using a 5 µm, 150 Å MALS SEC protein column (300 mm × 7.8 mm) with 0.9% NaCl aqueous solution as the mobile phase at a flow rate of 0.5 mL/min.

2.5. Morphological Characterization of β-Glucan

2.5.1. SEM Analysis

A thin layer of β-glucan was evenly spread on the sample stage and coated with gold for 120 s using a coating apparatus. The sample surface was then examined using a scanning electron microscope (SEM) (Pharson X, Eindhoven, The Netherlands) at magnifications of 1000×, 2000×, and 5000×.

2.5.2. AFM Analysis

β-Glucan was dissolved in ultrapure water, heated to 80 °C, and stirred magnetically to obtain a 5 μg/mL solution. An amount of 10 μL of the solution was added to a mica substrate and allowed to air dry. The Bruker Multimode 8 atomic force microscope (AFM) was utilized for imaging analysis.

2.6. Physicochemical Characterization of β-Glucan

2.6.1. Monosaccharide Composition Analysis

The β-glucan was hydrolyzed in a 2 mol/L trifluoroacetic acid (TFA) solution under a nitrogen atmosphere at a flow rate of 10 L/min for 1 min, then heated at 110 °C for 2 h. Following cooling, 1 mL of the solution was mixed with 1 mL of methanol, and it was evaporated using a nitrogen stream in a 70 °C water bath, which was repeated twice to ensure complete removal of TFA. Subsequently, 1 mL of 0.3 mol/L sodium hydroxide (NaOH) solution was added to dissolve the residue, yielding the β-glucan hydrolysate. An amount of 400 μL of either the polysaccharide hydrolysate or a standard monosaccharide solution was added along with 400 μL of 0.5 mol/L 1-phenyl-3-methyl-5-pyrazolone (PMP) methanol solution in a 5 mL stoppered test tube. The mixture was vortexed and reacted for 2 h in a 70 °C water bath. Afterward, it was cooled to room temperature, and 400 μL of 0.3 mol/L hydrochloric acid (HCl) was added to neutralize the pH to 6–7. Then, 1200 μL of water and an equal volume of chloroform were added for extraction. The chloroform phase was discarded after vortexing. This extraction process was repeated two more times. Finally, the aqueous phase was filtered through a 0.45 μm microporous membrane, and the sample was analyzed using high-performance liquid chromatography (HPLC) on an Agilent 1100 system, equipped with a diode array detector. Chromatographic separation was used on a GraceSmart RP18 column (250 mm × 4.6 mm, 5 μm) at 30 °C. Mobile phase A consisted of 100 mM sodium phosphate buffer (pH 6.7) and mobile phase B was acetonitrile, with a gradient elution program outlined in Table S1. The flow rate was set at 1 mL/min, the detection wavelength was 250 nm, and the injection volume was 5 μL.
L-glucuronic acid and D-mannuronic acid were obtained from Bozhi Huili Biotechnology Co. (Qingdao, China). Mannose, glucosamine, ribose, rhamnose, glucuronic acid, galactosamine, galactose, xylose, arabinose, and fucose were sourced from Aldrich Co. (Sigma, Darmstadt, Germany), while galactonic acid was acquired from Supelco Co. (Merck, Darmstadt, Germany).

2.6.2. FT-IR Measurement

Following the method of Kyomugasho et al. [34], Fourier transform infrared spectroscopy (FT-IR) was utilized to determine the structural characteristics of β-glucan. Each sample (1.0 mg) was mixed with 150 mg of KBr, then crushed and pressed into thin slices for analysis. FT-IR (iS5, Thermo Scientific, Waltham, MA, USA) was employed to measure the thin-section samples across a wavenumber range of 400–4000 cm−1.

2.7. Determination of Antioxidant Activity In Vitro

2.7.1. Determination of Total Reducing Power

The reducing power of the extract was assessed using a modified method described by Yang [35]. An amount of 1 mL of β-glucan solution at varying concentrations was thoroughly mixed with 1 mL of 1% potassium ferricyanide; then, it was incubated in a water bath for 20 min. Subsequently, 1 mL of 10% trichloroacetic acid was added, and the mixture was centrifuged at 3000× g for 10 min. After centrifugation, 1 mL of the supernatant was mixed with 1 mL of deionized water and 0.2 mL of 0.1% ferric chloride. This mixture was thoroughly agitated and incubated for 30 min under light-protected conditions. Finally, the absorbance was measured at 700 nm, and a standard curve was constructed using a Trolox solution.

2.7.2. NO Radical Scavenging Activity

The production of nitric oxide (NO) by sodium nitroprusside (SNP) was determined using the Griess method [36]. First, 0.1 mL of SNP solution and 0.9 mL of β-glucan solution were thoroughly mixed in a tube, and the reaction was allowed to proceed for 3 h at 25 °C under a visible multicolor light source. Then, 0.5 mL of Griess reagent (containing 1% sulfanilamide and 0.1% naphthylethylenediamine dihydrochloride) was added, and the absorbance was measured at 540 nm. The NO radical scavenging activity was calculated using the formula:
NO   radical   scavenging   activity   ( % ) = 1 A s a m p l e A c o n t r o l A b l a n k × 100 %
where Asample is the absorbance of the mixture of β-glucan solution, SNP solution, and Griess reagent; Acontrol is the absorbance of the mixture of deionized water and β-glucan solution; and Ablank is the absorbance of the mixture of deionized water, SNP solution, and Griess reagent.

2.7.3. DPPH Radical Scavenging Activity

Following the method of Hua et al. [37] with slight modifications, 2 mL of β-glucan solution at varying concentrations was added to 2 mL of a 0.12 mg/mL DPPH free radical solution (dissolved in ethanol). The reaction was allowed to proceed in the dark at room temperature for 30 min. Subsequently, the absorbance was measured at 519 nm.
DPPH   radical   scavenging   activity   ( % ) = 1 A s a m p l e A c o n t r o l A b l a n k × 100 %
where Asample is the absorbance of a mixture of β-glucan solution and DPPH solution; Acontrol is the absorbance of a mixture of deionized water and β-glucan solution; and Ablank is the absorbance of a mixture of deionized water and DPPH solution.

2.7.4. ABTS Radical Scavenging Activity

Based on the method described by Guo et al. [38], minor modifications were made to measure the ABTS radical scavenging activity. An amount of 0.2 mL of 7 mmol/L ABTS solution was mixed with 0.2 mL of 2.6 mmol/L potassium persulfate and the reaction was allowed to proceed at room temperature in the dark for 12 h to obtain the ABTS+ solution. Subsequently, the solution was diluted with PBS buffer (pH 7.4) to achieve an absorbance of 0.750 at 734 nm as the working solution. An amount of 0.4 mL of various concentrations of β-glucan solution was mixed with 4 mL of the diluted ABTS working solution, and the mixture was permitted to react in the dark at room temperature for 6 min. Finally, the absorbance was measured at 734 nm.
ABTS   radical   scavenging   activity   ( % ) = 1 A s a m p l e A c o n t r o l A b l a n k × 100 %
where Asample is the absorbance of the β-glucan solution and ABTS working solution mixture; Acontrol is the absorbance of a mixture of deionized water and β-glucan solution; and Ablank is the absorbance of a mixture of deionized water and ABTS working solution.

2.8. Gel Characteristics and Functional Properties

2.8.1. Determination of Apparent Viscosity

β-Glucan samples were dissolved in deionized water overnight to achieve a concentration of 2–10 mg/mL for fully dissolved samples. The apparent viscosity (AV) of each sample was measured at 25 °C using a rotational viscometer (NDJ-8S, Lichen Technology, Changsha, China) [39].

2.8.2. Determination of Oil-Holding Capacity

Following the method proposed by Jin et al. [40], 1 mL of varying concentrations of β-glucan solution was added to 1 mL of peanut oil. The mixture was thoroughly vortexed and incubated in a water bath at 37 °C for 2 h. Then, it was centrifuged at 5000 rpm for 10 min. Using a dropper, the lower layer of the liquid was extracted, and 2 mL of petroleum ether was added to the extract and mixed well. This mixture was then centrifuged at 5000 rpm for 5 min and the upper layer of liquid was collected. This extraction process was repeated four times. Finally, the upper-layer liquids were combined, dried in an oven at 50 °C, and weighed.

2.9. Statistical Analysis

The experiments in this study were conducted in three parallel groups, with the experimental data expressed as mean ± standard deviation (mean ± SD). Statistical analyses were carried out using SPSS Statistics 26 and Origin 2024 software. Differences between the two samples were assessed using one-way ANOVA, with Duncan’s multiple range test employed for significance testing. p < 0.05 was considered indicative of a significant difference.

3. Results and Discussion

3.1. Yield of β-Glucan from BSG

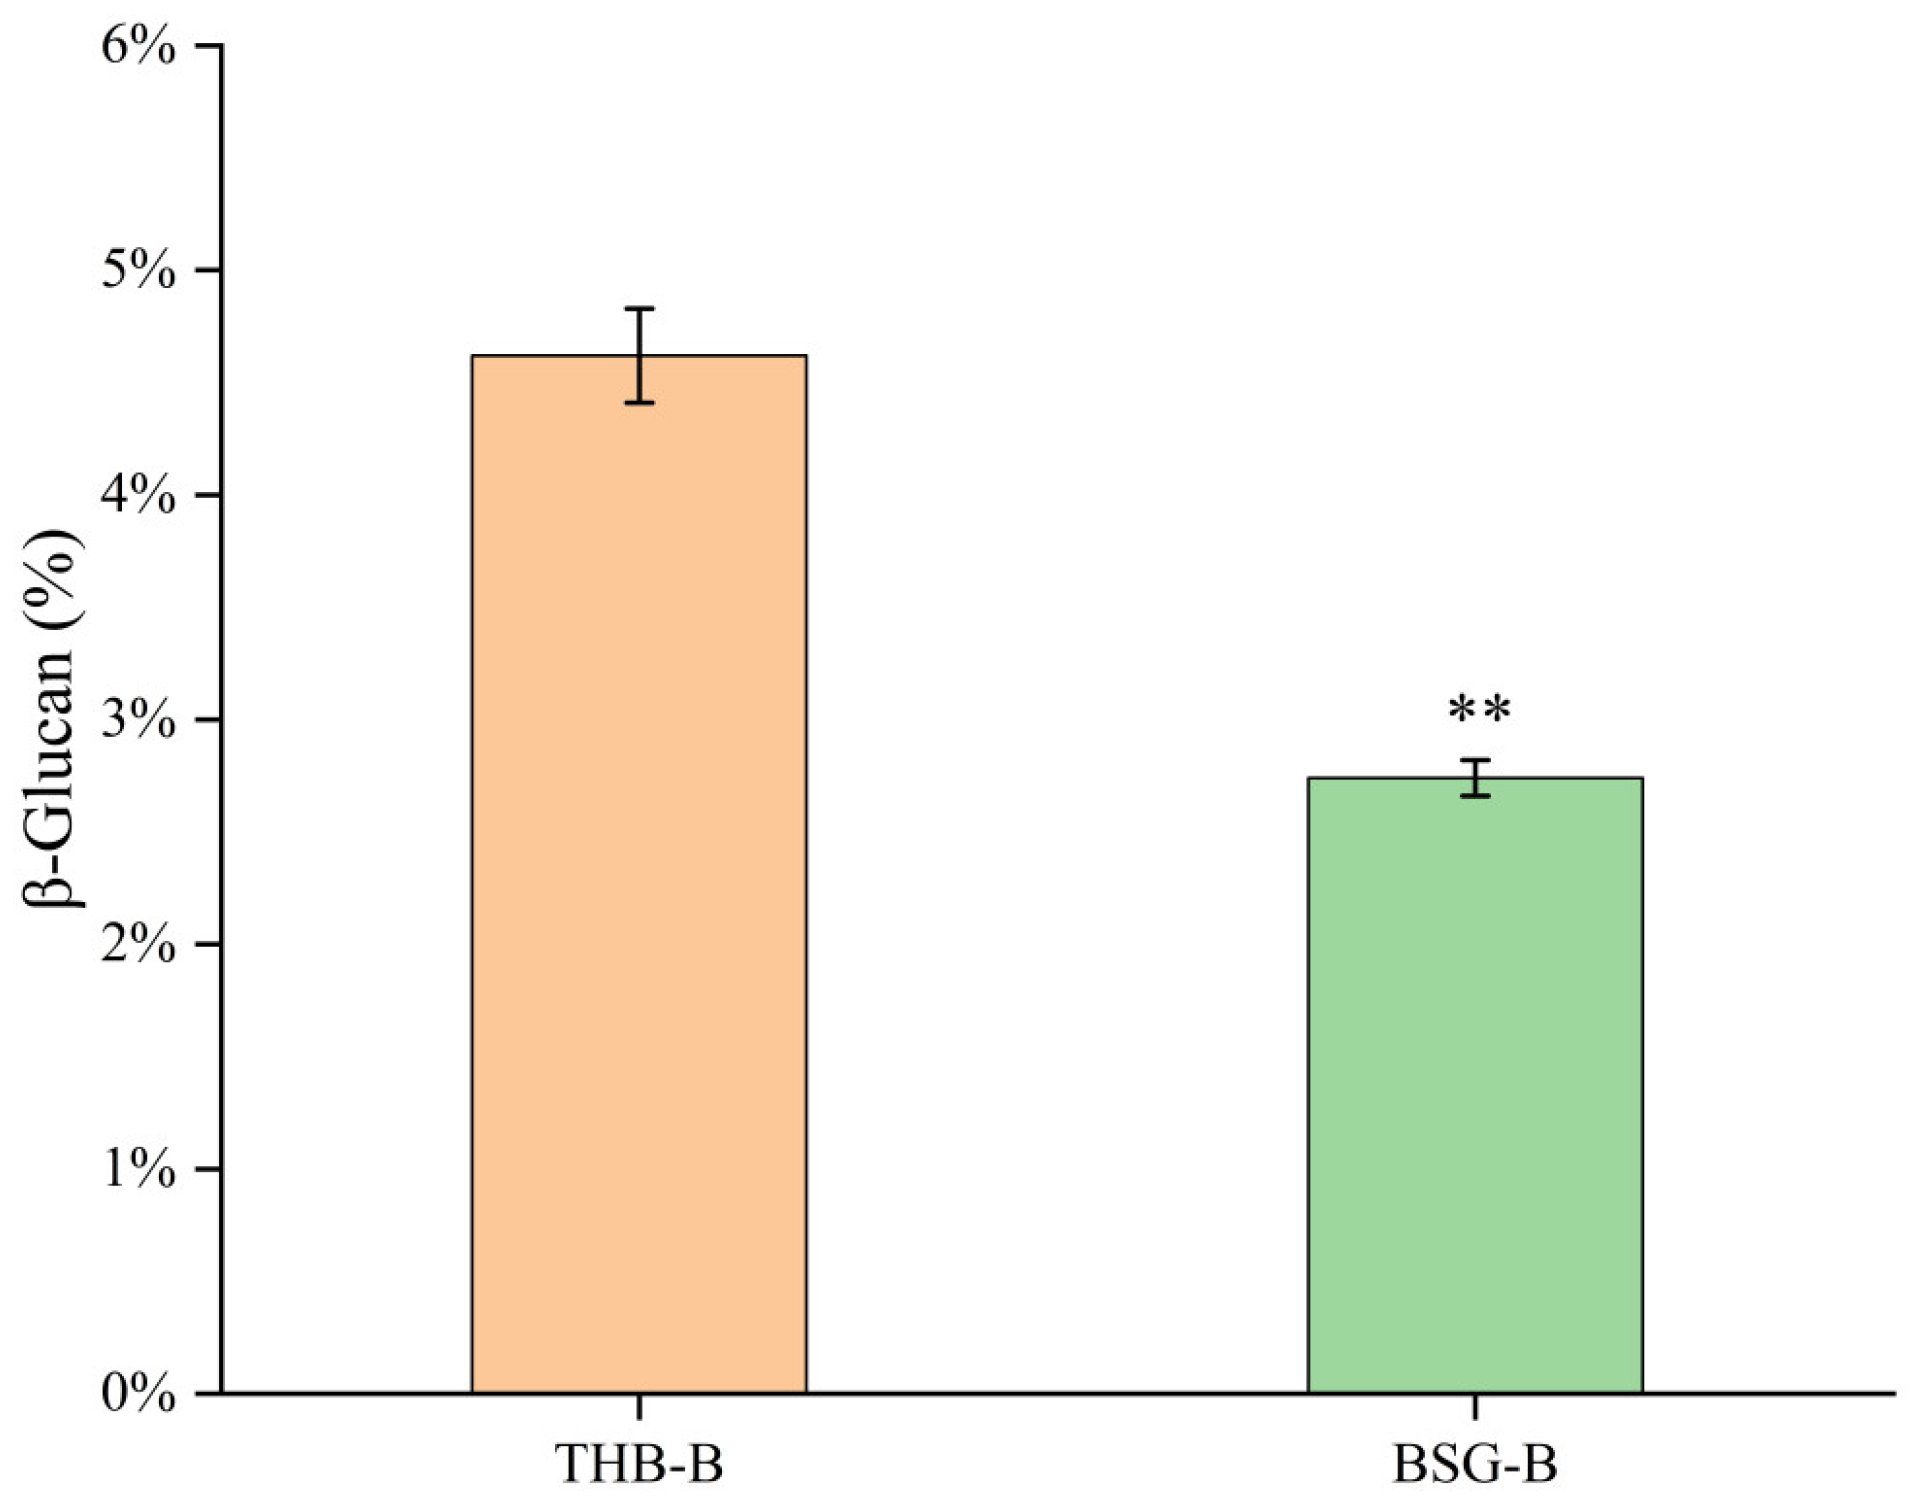
β-Glucan was extracted from highland barley spent grain (BSG-B) and Tibetan Highland Barley (THB-B) according to the extraction method of Laitinen et al. [27] with slight modification (Figure S1). Table 1 illustrates the extracted yield and its total sugar, β-glucan, and protein content of THB-B and BSG-B. After fermentation by R. oryzae, the extracted yield of BSG-B was 4.13%, lower than that in THB (5.11%). Among them, the total sugar and β-glucan content of BSG-B were 81.79% and 66.35%, respectively, which were also lower than those in THB-B. The protein content in BSG-B and THB-B was less than 5%, indicating that the extracted β-glucan was of high purity. Overall, 2.74% β-glucan was extracted from BSG, which is lower than the 4.62% extraction rate from THB (Figure 2). However, this process enabled the repurposing of BSG while achieving a high β-glucan content.

3.2. Molecular Weight of β-Glucan from BSG

β-Glucan is a linear polysaccharide, and its molecular weight is closely related to its properties. In this study, size-exclusion chromatography-multiangle laser light scattering (SEC-MALLS) was used to analyze the molecular weight of BSG-B and THB-B (Table 2 and Figure S2). The molecular weight of BSG-B was 5.24 × 10⁶ Da, and that of THB-B was 2.33 × 10⁶ Da, which indicated that the molecular weight of BSG-B increased by 124.89% than that of THB-B. This may be attributed to the considerable effect of the fermentation process by R. oryzae on the β-glucan of highland barley. The internal β-glucan of barley has a higher Mw and a lower dispersion coefficient compared to the β-glucan of bran [41]. In aqueous systems, β-glucan forms aggregates through hydrogen bonding, which results in an apparent increase in the molar mass of β-glucan [26,42], whereas the antioxidant activity of β-glucan increases with the increase in apparent molar mass [43]. In the fermentation of highland barley by R. oryzae, β-glucan was decomposed from the outside of the barley (lower molecular weight) to the interior (higher molecular weight), and finally the higher-molecular-weight β-glucan was formed. Moreover, the polydispersity index (PDI, Mw/Mn) of BSG-B (4.72 (±9.84%)) was slightly lower than that of THB-B (5.40 (±2.98%)), indicating a somewhat narrower distribution after fermentation by R. oryzae. In sharp contrast, the Mz/Mn value of BSG-B (129.92 (±13.47%)) was significantly higher than that of THB-B (39.16 (±5.74%)) likely due to the high sensitivity of the Mz value to the high-molecular-weight fraction, which indicates that there are a large number of high-molecular-weight components in BSG-B. This is consistent with the observed increase in Mw and with the expected impact on rheology and gelation.

3.3. Physicochemical Properties of β-Glucan from BSG

An increasing number of studies suggest a correlation between the biological activity of polysaccharides derived from natural sources and their physicochemical properties, including monosaccharide composition and functional group composition [44,45].

3.3.1. Monosaccharide Composition

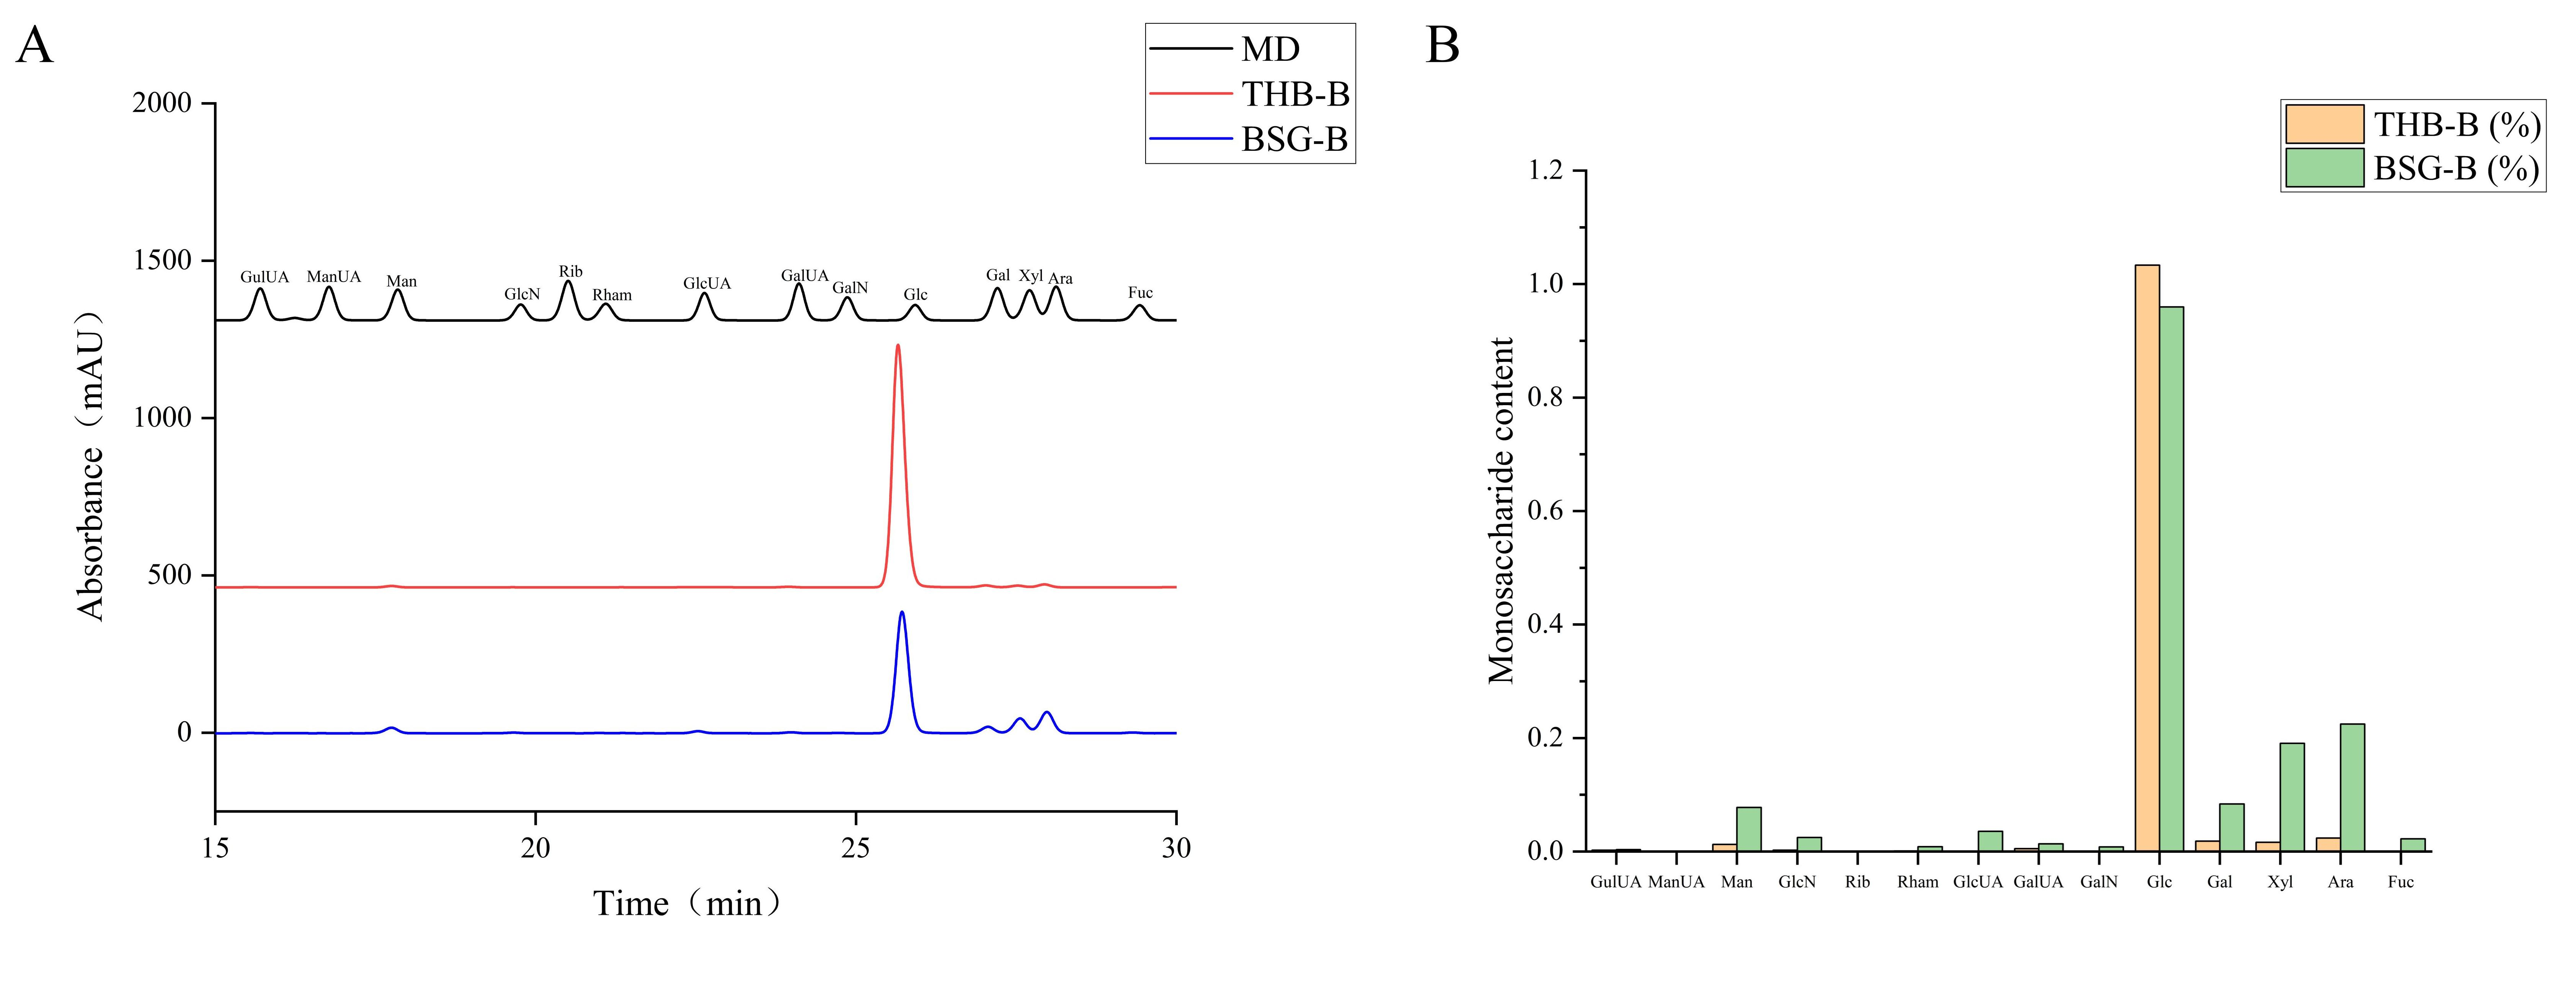
The chromatograms showed the separation of monosaccharide standards and β-glucan samples (Figure 3A), and the mass percentages (%) are summarized in Table 3 and Figure 3B. In the separation of monosaccharide standards, the following monosaccharides were identified in order of retention time: guluronic acid (GulUA), mannose (Man), glucosamine (GlcN), rhamnose (Rham), glucuronic acid (GlcUA), galacturonic acid (GalUA), aminogalactose (GalN), glucose (Glc), galactose (Gal), xylose (Xyl), arabinose (Ara), and fucose (Fuc). The results demonstrated that THB-B comprised 97.96% Glc and a minimal quantity of heterosaccharides in comparison to the monosaccharide standard. Meanwhile, BSG-B contained 81.13% Glc, 6.77% Ara, 5.15% Xyl, and 1.96% Man, which were likely the reason for the lower β-glucan content of BSG-B due to the fermentation by R. oryzae. Due to the involvement of R. oryzae, there are more heteromonosaccharides in BSG-B which may lead to the formation of larger aggregates in the aqueous system, resulting in an increase in molecular weight.

3.3.2. FT-IR Analysis

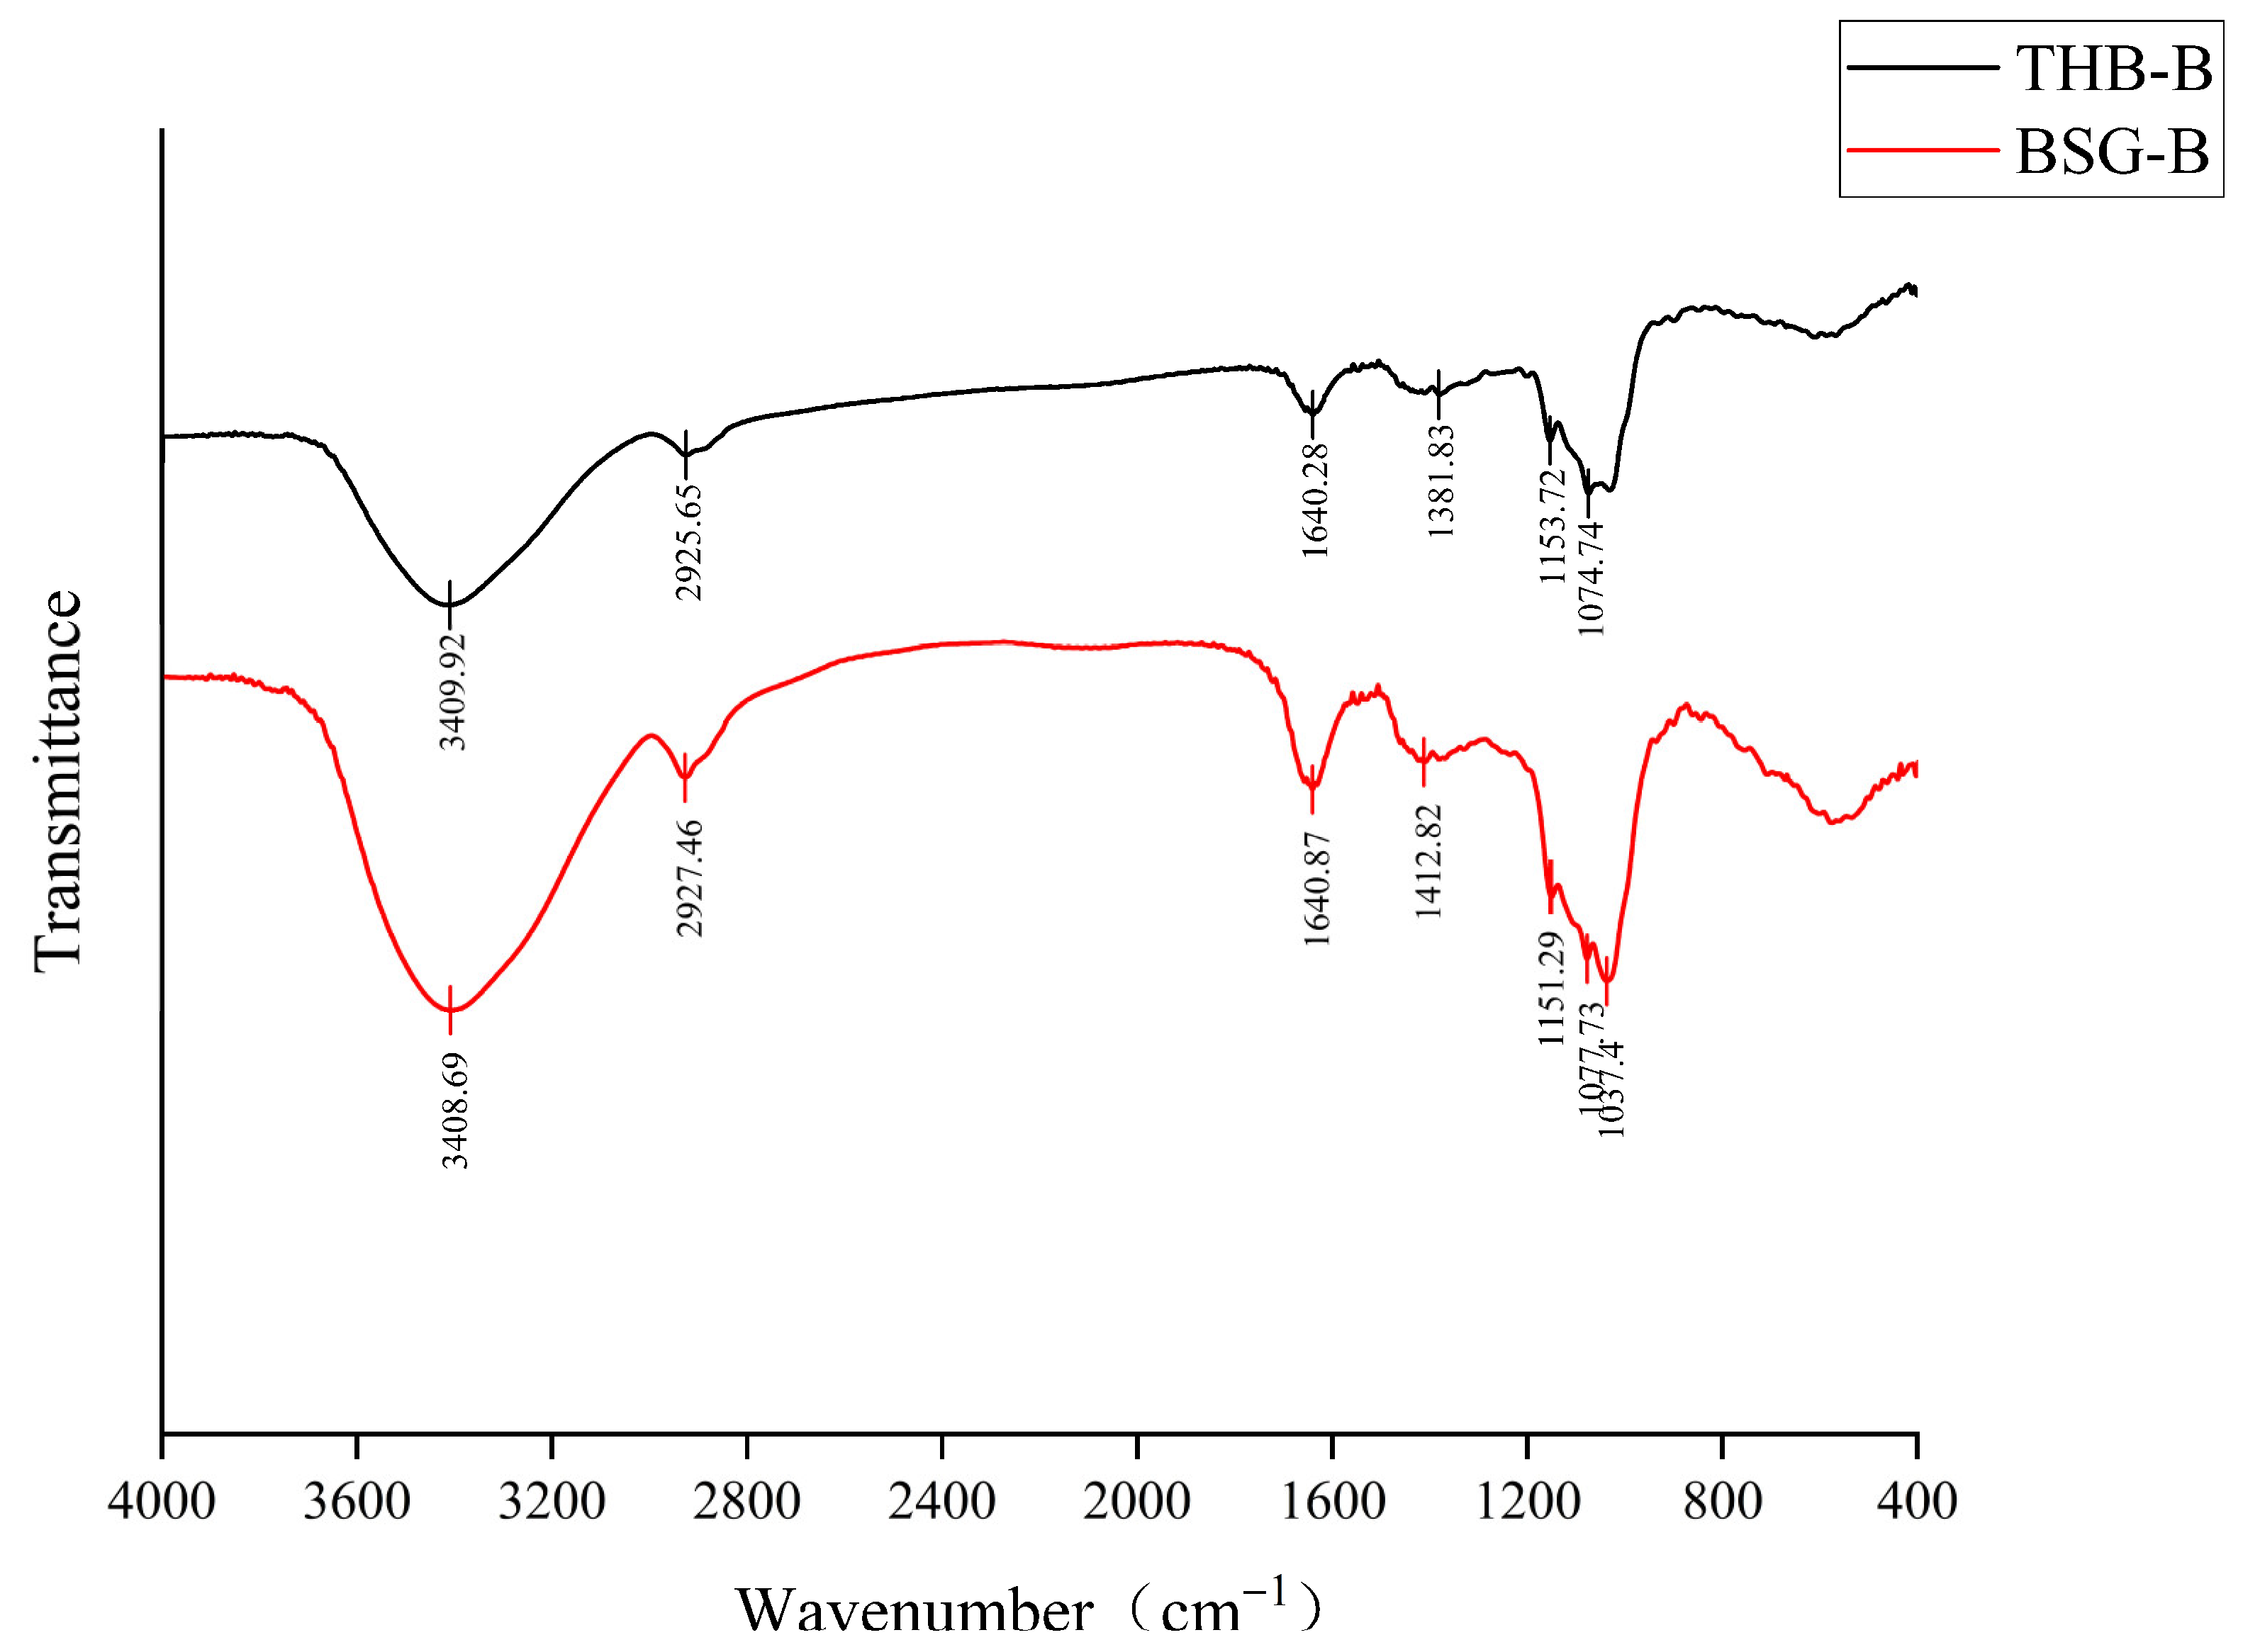
FT-IR analysis shows similar absorption peaks in BSG-B and THB-B (Figure 4). Specifically, the absorption peaks at 3409.92 cm−1 in THB-B and 3408.69 cm−1 in BSG-B are caused by the stretching vibration of hydroxyl groups [46], which indicate that there is no significant change in the hydroxyl in BSG-B after fermentation. The absorption peaks at 2925.65 cm−1 in THB-B and 2927.46 cm−1 in BSG-B are caused by asymmetric stretching vibration of C–H with a slight shift. This indicates that the environment of the C–H bond undergoes slight changes during the fermentation process, which remains stable overall. The similar absorption peaks at 1640.28 cm−1 and 1640.87 cm−1 are caused by the presence of water molecules in THB-B and BSG-B samples [47]. The absorption peaks at 1381.83 cm−1 in THB-B and 1412.82 cm−1 in BSG-B are caused by C–H angular vibrations [45], with the most significant alteration following fermentation, which indicate that the fermentation has exerted a considerable influence on the orientation of the C–H bonds within the β-glucan. This observation may be attributed to conformational shifts or minor structural modifications in the β-glucan chains. The absorption peaks at 1153.72 cm−1 and 1151.29 cm−1 in THB-B and BSG-B are typically associated with stretching vibrations of ether (C–O–C) or C–O bonds, which indicate the presence of glycosidic bonds (β-1,3 or β-1,4 bonds) in the sample. This peak is an important characteristic of β-glucan, which indicate the integrity of its long-chain structure. The absorption peak at 1074.74 cm−1 in THB-B is associated with the vibration of C–O–C and C–O–H of the pyran ring [48], which was split into 1077.73 cm−1 and 1037.40 cm−1 in fermented BSG-B. This suggests that the fermentation process results in alterations to the pyran ring structure, which may be attributed to modifications in the glycosidic bond configuration due to the action of enzymes during fermentation.

3.4. Morphologies of β-Glucan from BSG

3.4.1. Macroscopic Morphology

Figure 5A illustrates the macroscopic morphology of the two β-glucans from THB and BSG. The color of THB-B and BSG-B was milky white, while BSG-B was a little darker. In terms of texture, BSG-B exhibits a more compact structure, whereas THB-B is characterized by a delicate and fluffy consistency. Under the same weight, the volume of BSG-B is 29.4% of that of THB-B (Figure S3), which indicated that the texture of β-glucan was changed after R. oryzae fermentation.

3.4.2. Microscopic Morphology by SEM Analysis

In order to investigate the microscopic structural differences corresponding to the different textures at the macroscopic level, microscopic surface images were obtained using scanning electron microscopy (SEM). As illustrated in Figure 5B–D, the microstructures of the two β-glucan samples from BSG and THB are markedly distinct. THB-B exhibits a spongy form with a loose structure and a surface covered with micropores; however, BSG-B comprised primarily thick flakes with varying morphology, including fragments with an uneven surface and a compact structure, as well as depressions on the surface. The disparity in these microstructures may be attributed to the distinct molecular weights of the β-glucans present in THB-B and BSG-B, the varying lengths of the branched main chains, and the dissimilar van der Waals forces governing the interactions between the β-glucans [49].

3.4.3. Nanostructural Morphology by AFM Analysis

Atomic force microscopy (AFM) is a microscopic instrument used to observe the nanostructure and conformation of macromolecular polymers. The two- and three-dimensional graphs of β-glucan were plotted using AFM. As shown in Figure 6, the height of the THB-B (−24.1–29.4 nm) and BSG-B (−17.4–20.2 nm) aggregates were much greater than the thickness of the individual polysaccharide chains (0.1–1.0 nm) [50], suggesting that the hydroxyl groups in the polysaccharide chains form strong inter- and intramolecular interactions, leading to the formation of aggregates [51,52]. Moreover, the aggregation heights (−17.4–20.2 nm) of BSG-B were markedly lower than those of THB-B (Figure 6), which indicated that the inter- and intramolecular interactions formed by the hydroxyl groups in the polysaccharide chains of BSG-B were significantly weaker than those of THB-B. This hypothesis was also confirmed by the FT-IR spectra (Figure 4), which showed a shift in the absorption peaks from 1074.74 cm−1 in THB-B to 1077.73 cm−1 and 1037.40 cm−1 in BSG-B. As illustrated in Figure 6C,D, the aggregation width of BSG-B is approximately 74 nm, lower than that of THB-B (116 nm), which was determined by the molecular weight and structural differences between the β-glucans.

3.5. Antioxidant Activity of β-Glucan from BSG

Studies have shown that the molecular weight size of polysaccharides significantly affects its antioxidant activity [53]. Therefore, the antioxidant activity of two β-glucans, THB-B and BSG-B, was investigated. Figure 7 shows the antioxidant effect of two β-glucan solutions of THB-B and BSG-B in the concentration range of 2–10 mg/mL. The measured total reducing power of THB-B and BSG-B increased with the increase in concentration. Specifically, at a concentration of 10 mg/mL, BSG-B exhibited a total reducing power of 0.915 mg trolox/mL, higher than that of THB-B (0.441 mg trolox/mL) (Figure 7A). Figure 7B shows that the NO radical scavenging activity of BSG-B increased with the increase in concentration, and the scavenging activity at 10 mg/mL (24.05 ± 1.80%) was 3.25 times greater than that at 6 mg/mL, which were always higher than those of THB-B. Figure 7C shows that the DPPH radical scavenging activities of BSG-B remained above 45% and increased with the increase in concentration, which were also higher than those of THB-B. Figure 7D shows that the ABTS radical scavenging activity of BSG-B was significantly stronger than those of THB-B and increased in a concentration-dependent manner. Especially, the ABTS radical scavenging activities of BSG-B were 67.18 ± 0.89% at a concentration of 10 mg/mL, which was higher than that of THB-B (28.90 ± 1.03%). The antioxidant activity of polysaccharides is related to their molecular weight, monosaccharide composition, and functional groups [44], and the higher-molecular-weight β-glucan has strong antioxidant activity, which is consistent with the results in Table 2. The above results showed that the antioxidant activity of BSG-B was superior to those of THB-B.

3.6. Gel Characteristics of β-Glucan from BSG

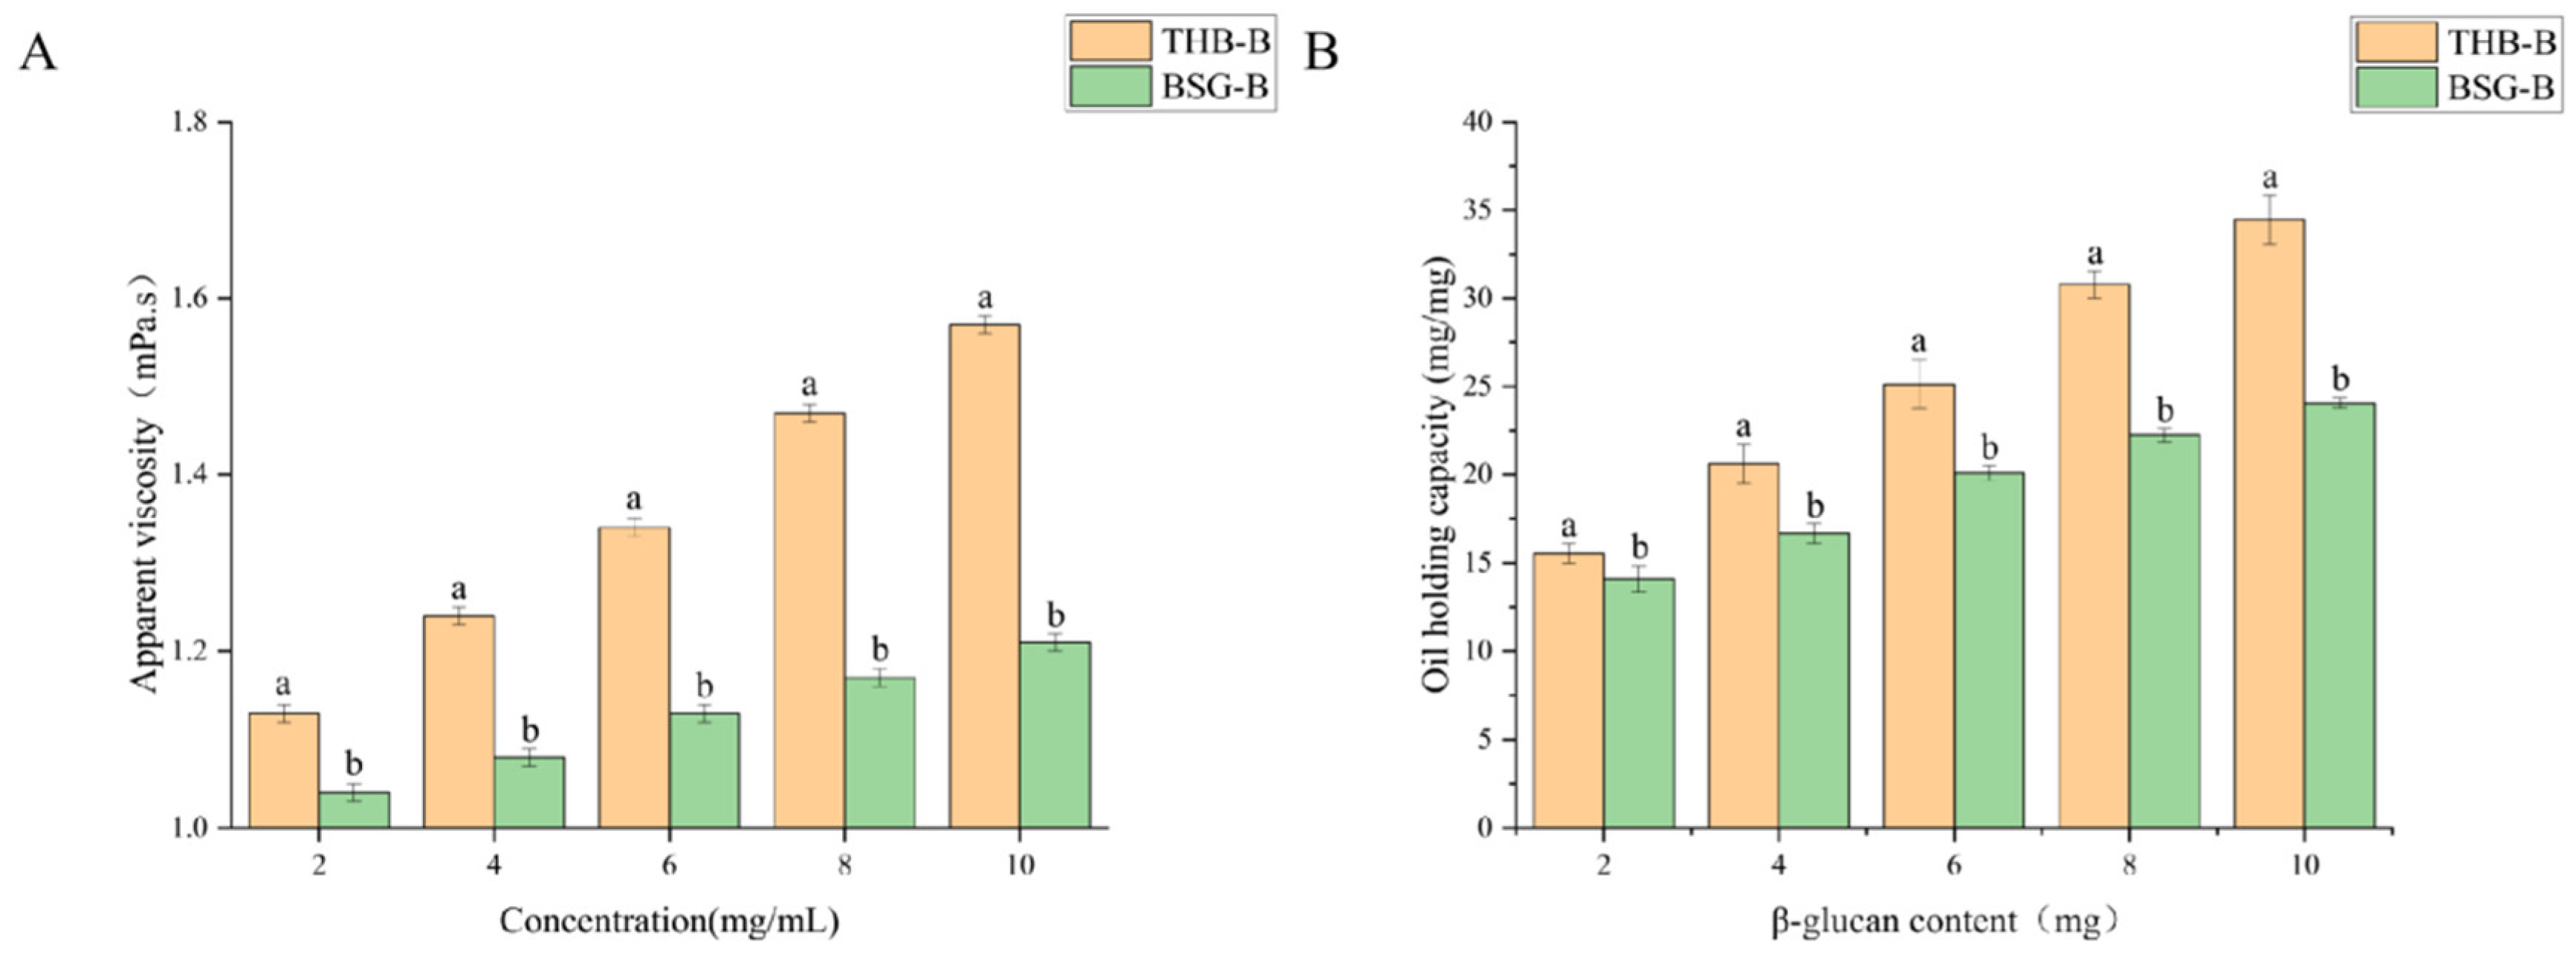
It has been demonstrated that the apparent viscosity of polysaccharides significantly influences their adsorption capacity for fats and oils [44,54,55,56]. Therefore, the apparent viscosity and oil-holding capacity of both THB-B and BSG-B were investigated in the concentration range of 2–10 mg/mL (Figure 8). The apparent viscosity of THB-B and BSG-B showed a gradual increasing trend with the increase in concentration, which indicated that the interaction forces between the polymer chains increased as the polymer concentration increased, resulting in an increase in the viscosity of the fluids and the formation of a more complex network structure. The apparent viscosity of BSG-B (1.21 ± 0.1 mPa·s) was lower than that of THB-B (1.57 ± 0.1 mPa·s) at 10 mg/mL, which indicated that BSG-B has a lower degree of chain cross-linking in solution than THB-B. This is likely due to the change in chain structure caused by the fermentation process, which then reduce the intermolecular interactions and the viscosity, which is consistent with the lower aggregation widths of BSG-B in the AFM analyses (Figure 6). As shown in Figure 8B, the oil adsorption capacity of BSG-B and THB-B increased with the increase in concentration and the adsorption capacity of BSG-B was lower than those of THB-B at all concentrations. The oil-binding capacity (OBC) of BSG-B (10 mg) was 24.1 ± 0.3 mg, significantly lower than that of THB-B (34.5 ± 1.3 mg per 10 mg). The fermentation process by R. oryzae likely changed the spatial configuration of β-glucan, which then resulted in a decrease in its oil-holding capacity, which was also confirmed by the SEM image due to the more compact structure of BSG-B than that of THB-B (Figure 5).

4. Conclusions

The yield, molecular weight, physicochemical properties, antioxidant capacity, and gel characteristics of BSG-B extracted from barley spent grain were analyzed and compared with THB-B extracted directly from Tibetan highland barley. The results showed that a β-glucan yield of 2.74% was obtained from BSG. Although this yield was lower than the 4.62% extraction rate from THB, it demonstrates the potential for BSG reuse. The molecular weight of BSG-B was 5.24 × 10⁶ Da, which increased by 124.89% compared to that of THB-B. FT-IR analyses showed that the pyran ring of β-glucan was altered after fermentation, likely resulting in a reduction in the height of the aggregates. Moreover, BSG-B showed higher antioxidant capacities and lower oil adsorption capacity than those of THB-B. In conclusion, the extraction of higher-molecular-weight β-glucan from BSG allows sustainable reuse of BSG and the production of high-value β-glucan with higher antioxidant properties, providing a new way to achieve green production.

Supplementary Materials

The following supporting information can be downloaded at https://www.mdpi.com/article/10.3390/fermentation11100600/s1, Table S1. Gradient elution program of mobile phase A and B in the analysis of monosaccharide composition. Figure S1. The procedure of extracting β-glucan from BSG/THB modified from the method of Laitinen et al. [27]. Figure S2. Molecular weight distribution of BSG-B and THB-B. Figure S3. The volume comparison of BSG-B and THB-B under the same weight.

Author Contributions

S.L.: Investigation, Methodology, Writing—Review and Editing; L.N.: Investigation, Visualization; S.C.: Methodology; Y.Z.: Methodology; A.N.: Editing; Z.Q.: Visualization; D.D.: Investigation, Funding Acquisition; L.S.: Investigation, Writing—Review and Editing, Funding Acquisition. All authors have read and agreed to the published version of the manuscript.

Funding

This study was financially supported by grants from the Xizang key research and development program (XZ202301ZY0010N) and the Zhenjiang Modern Agriculture Key R & D Project (grant no. NY2023008). The authors also thank Professor Zengjun Qi (Nanjing agricultural university) and Zhaojun Shi (Jiangsu university) for their assistance in the design and measurement of β-glucan experiments, respectively.

Institutional Review Board Statement

Not applicable.

Informed Consent Statement

Not applicable.

Data Availability Statement

The original data will be provided if necessary.

Conflicts of Interest

The authors declare no conflicts of interest.

References

  1. Obadi, M.; Sun, J.; Xu, B. Highland barley: Chemical composition, bioactive compounds, health effects, and applications. Food Res. Int. 2021, 140, 110065. [Google Scholar] [CrossRef]
  2. Ren, X.; Zhang, F.; Zhang, M.; Fang, Y.; Chen, Z.; Huan, M. Fecal microbiota transplantation: Whole grain highland barley improves glucose metabolism by changing gut microbiota. Food Sci. Hum. Wellness 2024, 13, 2014–2024. [Google Scholar] [CrossRef]
  3. Al-Ansi, W.; Mushtaq, B.S.; Mahdi, A.A.; Al-Maqtari, Q.A.; Al-Adeeb, A.; Ahmed, A.; Fan, M.; Li, Y.; Qian, H.; Jinxin, L.; et al. Molecular structure, morphological, and physicochemical properties of highlands barley starch as affected by natural fermentation. Food Chem. 2021, 356, 129665. [Google Scholar] [CrossRef] [PubMed]
  4. Al-Ansi, W.; Mahdi, A.A.; Al-Maqtari, Q.A.; Sajid, B.M.; Al-Adeeb, A.; Ahmed, A.; Fan, M.; Li, Y.; Qian, H.; Jinxin, L.; et al. Characterization of molecular, physicochemical, and morphological properties of starch isolated from germinated highland barley. Food Biosci. 2021, 42, 101052. [Google Scholar] [CrossRef]
  5. Al-Ansi, W.; Zhang, Y.; Alkawry, T.A.A.; Al-Adeeb, A.; Mahdi, A.A.; Al-Maqtari, Q.A.; Ahmed, A.; Mushtaq, B.S.; Fan, M.; Li, Y.; et al. Influence of germination on bread-making behaviors, functional and shelf-life properties, and overall quality of highland barley bread. LWT 2022, 159, 113200. [Google Scholar] [CrossRef]
  6. Ruirong, P.; Hamadou, A.H.; Xu, B. Germination in improving the nutrition, health benefits and processing of highland barley. Int. J. Food Sci. Technol. 2024, 59, 2162–2171. [Google Scholar] [CrossRef]
  7. Zhang, J.; Xiao, X.; Dong, Y.; Xu, T.; Wu, F. Dietary supplementation with Lactobacillus plantarum dy-1 fermented barley suppresses body weight gain in high-fat diet-induced obese rats. J. Sci. Food Agric. 2016, 96, 4907–4917. [Google Scholar] [CrossRef]
  8. Yan, J.-K.; Chen, T.-T.; Wang, Z.-W.; Wang, C.; Liu, C.; Li, L. Comparison of physicochemical characteristics and biological activities of polysaccharides from barley (Hordeum vulgare L.) grass at different growth stages. Food Chem. 2022, 389, 133083. [Google Scholar] [CrossRef]
  9. Zhang, J.; Wang, P.; Tan, C.; Zhao, Y.; Zhu, Y.; Bai, J.; Xiao, X.; Zhang, L.; Teng, D.; Tian, J.; et al. Effects of L. plantarum dy-1 fermentation time on the characteristic structure and antioxidant activity of barley β-glucan in vitro. Curr. Res. Food Sci. 2022, 5, 125–130. [Google Scholar] [CrossRef]
  10. Zhao, Y.; Wu, C.; Bai, J.; Li, J.; Cheng, K.; Zhou, X.; Dong, Y.; Xiao, X. Fermented barley extracts with Lactobacillus plantarum dy-1 decreased fat accumulation of Caenorhabditis elegans in a daf-2 -dependent mechanism. J. Food Biochem. 2020, 44, e13459. [Google Scholar] [CrossRef]
  11. Zhang, J.; Xiao, X.; Dong, Y.; Zhou, X. Fermented barley extracts with Lactobacillus plantarum dy-1 changes serum metabolomic profiles in rats with high-fat diet-induced obesity. Int. J. Food Sci. Nutr. 2019, 70, 303–310. [Google Scholar] [CrossRef] [PubMed]
  12. Li, J.; Zhou, Y.; Zhang, J.; Cui, L.; Lu, H.; Zhu, Y.; Zhao, Y.; Fan, S.; Xiao, X. Barley β-glucan inhibits digestion of soybean oil in vitro and lipid-lowering effects of digested products in cell co-culture model. Food Res. Int. 2023, 164, 112378. [Google Scholar] [CrossRef] [PubMed]
  13. Li, X.; Wu, Y.; Duan, R.; Yu, H.; Liu, S.; Bao, Y. Research Progress in the Extraction, Structural Characteristics, Bioactivity, and Commercial Applications of Oat β-Glucan: A Review. Foods 2024, 13, 4160. [Google Scholar] [CrossRef] [PubMed]
  14. Xiao, X.; Tan, C.; Sun, X.; Zhao, Y.; Zhang, J.; Zhu, Y.; Bai, J.; Dong, Y.; Zhou, X. Fermented barley β-glucan regulates fat deposition in Caenorhabditis elegans. J. Sci. Food Agric. 2020, 100, 3408–3417. [Google Scholar] [CrossRef]
  15. Guo, T.; Horvath, C.; Chen, L.; Chen, J.; Zheng, B. Understanding the nutrient composition and nutritional functions of highland barley (Qingke): A review. Trends Food Sci. Technol. 2020, 103, 109–117. [Google Scholar] [CrossRef]
  16. Moza, J.; Gujral, H.S. Influence of non-starchy polysaccharides on barley milling behavior and evaluating bioactive composition of milled fractions. Food Chem. 2017, 218, 137–143. [Google Scholar] [CrossRef]
  17. Tufail, T.; Saeed, F.; Tufail, T.; Ain, H.B.U.; Hussain, M.; Noreen, S.; Shah, M.A. Exploring the cholesterol-lowering effects of cereal bran cell wall-enriched diets. Food Sci. Nutr. 2024, 12, 4944–4951. [Google Scholar] [CrossRef]
  18. Yin, X.; Zhang, M.; Wang, S.; Wang, Z.; Wen, H.; Sun, Z.; Zhang, Y. Characterization and discrimination of the taste and aroma of Tibetan Qingke baijiu using electronic tongue, electronic nose and gas chromatography–mass spectrometry. Food Chem. X 2024, 22, 101443. [Google Scholar] [CrossRef]
  19. Guo, L.; Luo, Y.; Zhou, Y.; Bianba, C.; Guo, H.; Zhao, Y.; Fu, H. Exploring microbial dynamics associated with flavours production during highland barley wine fermentation. Food Res. Int. 2020, 130, 108971. [Google Scholar] [CrossRef]
  20. Ma, W.; Geng, X.; Jia, F.; Zhang, X.; Zhang, Y.; Xue, J. Investigation of microbial composition and functional characterization of Zangqu using high throughput sequencing. LWT 2021, 136, 110342. [Google Scholar] [CrossRef]
  21. Zhang, K.; Yang, J.; Qiao, Z.; Cao, X.; Luo, Q.; Zhao, J.; Wang, F.; Zhang, W. Assessment of β-glucans, phenols, flavor and volatile profiles of hulless barley wine originating from highland areas of China. Food Chem. 2019, 293, 32–40. [Google Scholar] [CrossRef]
  22. Chen, L.; Peng, Q.; Liu, B.; Zhang, Y.; Feng, S. Study on the dynamic changes of nutrient components and flavor compounds during the fermentation process of high-quality highland barley wine. Int. J. Gastron. Food Sci. 2024, 35, 100860. [Google Scholar] [CrossRef]
  23. Bai, J.; He, L.; Zhang, J.; Gu, X.; Wu, B.; Wang, A.; Zhu, Y.; Zhang, J.; Zhao, Y.; Yuan, J.; et al. Influences of Lactiplantibacillus plantarum and Saccharomyces cerevisiae fermentation on the nutritional components, flavor property and lipid-lowering effect of highland barley. J. Futur. Foods 2024, 4, 258–266. [Google Scholar] [CrossRef]
  24. Edo, G.I.; Ndudi, W.; Makia, R.S.; Ainyanbhor, I.E.; Yousif, E.; Gaaz, T.S.; Zainulabdeen, K.; Jikah, A.N.; Opiti, R.A.; Akpoghelie, P.O.; et al. Beta-glucan: An overview in biological activities, derivatives, properties, modifications and current advancements in food, health and industrial applications. Process Biochem. 2024, 147, 347–370. [Google Scholar] [CrossRef]
  25. Singla, A.; Gupta, O.P.; Sagwal, V.; Kumar, A.; Patwa, N.; Mohan, N.; Ankush; Kumar, D.; Vir, O.; Singh, J.; et al. Beta-Glucan as a Soluble Dietary Fiber Source: Origins, Biosynthesis, Extraction, Purification, Structural Characteristics, Bioavailability, Biofunctional Attributes, Industrial Utilization, and Global Trade. Nutrients 2024, 16, 900. [Google Scholar] [CrossRef]
  26. Fan, S.; Ding, Y.; Hu, Z.; Zhang, Z.; Fu, L.; Zhang, J.; Zhu, Y.; Bai, J.; Xiao, X. Inter-individual variation in human microbiota drives differential impacts on the fermentability of insoluble bran by soluble β-glucans from whole barley. Food Hydrocoll. 2025, 162, 111034. [Google Scholar] [CrossRef]
  27. Laitinen, M.; Mäkelä-Salmi, N.; Maina, N.H. Gelation of cereal β-glucan after partial dissolution at physiological temperature: Effect of molecular structure. Food Hydrocoll. 2023, 141, 108722. [Google Scholar] [CrossRef]
  28. Cui, Y.; Han, X.; Hu, X.; Li, T.; Li, S. Distinctions in structure, rheology, antioxidation, and α-glucosidase inhibitory activity of β-glucans from different species. Int. J. Biol. Macromol. 2023, 253, 127684. [Google Scholar] [CrossRef]
  29. Bai, J.; Ren, Y.; Li, Y.; Fan, M.; Qian, H.; Wang, L.; Wu, G.; Zhang, H.; Qi, X.; Xu, M.; et al. Physiological functionalities and mechanisms of β-glucans. Trends Food Sci. Technol. 2019, 88, 57–66. [Google Scholar] [CrossRef]
  30. Sujithra, S.; Arthanareeswaran, G.; Ismail, A.; Taweepreda, W. Isolation, purification and characterization of β-glucan from cereals—A review. Int. J. Biol. Macromol. 2024, 256, 128255. [Google Scholar] [CrossRef]
  31. Chen, W.; Gao, L.; Song, L.; Sommerfeld, M.; Hu, Q. An improved phenol-sulfuric acid method for the quantitative measurement of total carbohydrates in algal biomass. Algal Res. 2023, 70, 102986. [Google Scholar] [CrossRef]
  32. Bradford, M.M. A rapid and sensitive method for the quantitation of microgram quantities of protein utilizing the principle of protein-dye binding. Anal. Biochem. 1976, 72, 248–254. [Google Scholar] [CrossRef] [PubMed]
  33. Cheong, K.-L.; Wu, D.-T.; Zhao, J.; Li, S.-P. A rapid and accurate method for the quantitative estimation of natural polysaccharides and their fractions using high performance size exclusion chromatography coupled with multi-angle laser light scattering and refractive index detector. J. Chromatogr. A 2015, 1400, 98–106. [Google Scholar] [CrossRef] [PubMed]
  34. Kyomugasho, C.; Christiaens, S.; Shpigelman, A.; Van Loey, A.; Hendrickx, M.E. FT-IR spectroscopy, a reliable method for routine analysis of the degree of methylesterification of pectin in different fruit- and vegetable-based matrices. Food Chem. 2015, 176, 82–90. [Google Scholar] [CrossRef]
  35. Yang, M.; Shen, Q.; Li, L.-Q.; Huang, Y.-Q.; Cheung, H.-Y. Phytochemical profiles, antioxidant activities of functional herb Abrus cantoniensis and Abrus mollis. Food Chem. 2015, 177, 304–312. [Google Scholar] [CrossRef]
  36. Lee, H.-G.; Nagahawatta, D.; Amarasiri, R.; Jeon, Y.-J.; Kang, M.-C. Physico-chemical and DPPH-hydroxyl radical scavenging characteristics of crude polysaccharides from Sargassum thunbergii. Algal Res. 2023, 73, 103152. [Google Scholar] [CrossRef]
  37. Hua, D.; Zhang, D.; Huang, B.; Yi, P.; Yan, C. Structural characterization and DPPH· radical scavenging activity of a polysaccharide from Guara fruits. Carbohydr. Polym. 2014, 103, 143–147. [Google Scholar] [CrossRef]
  38. Guo, R.; Zhang, J.; Liu, X.; Li, X.; Sun, X.; Kou, Y.; Li, D.; Liu, Y.; Zhang, H.; Wu, Y. Pectic polysaccharides from Biluochun Tea: A comparative study in macromolecular characteristics, fine structures and radical scavenging activities in vitro. Int. J. Biol. Macromol. 2022, 195, 598–608. [Google Scholar] [CrossRef]
  39. Zhu, D.-Y.; Ma, Y.-L.; Thakur, K.; Wang, C.-H.; Wang, H.; Ren, Y.-F.; Zhang, J.-G.; Wei, Z.-J. Effects of extraction methods on the rheological properties of polysaccharides from onion (Allium cepa L.). Int. J. Biol. Macromol. 2018, 112, 22–32. [Google Scholar] [CrossRef]
  40. Jin, Q.; Yu, H.; Wang, X.; Li, K.; Li, P. Effect of the molecular weight of water-soluble chitosan on its fat-/cholesterol-binding capacities and inhibitory activities to pancreatic lipase. PeerJ 2017, 5, e3279. [Google Scholar] [CrossRef]
  41. Li, Y.; You, M.; Liu, H.; Liu, X. Comparison of distribution and physicochemical properties of β-glucan extracted from different fractions of highland barley grains. Int. J. Biol. Macromol. 2021, 189, 91–99. [Google Scholar] [CrossRef] [PubMed]
  42. Li, W.; Cui, S.W.; Wang, Q.; Yada, R.Y. Studies of aggregation behaviours of cereal β-glucans in dilute aqueous solutions by light scattering: Part I. Structure effects. Food Hydrocoll. 2011, 25, 189–195. [Google Scholar] [CrossRef]
  43. Sun, T.; Li, J.; Qin, Y.; Xie, J.; Xue, B.; Li, X.; Gan, J.; Bian, X.; Shao, Z. Rheological and functional properties of oat β-glucan with different molecular weight. J. Mol. Struct. 2020, 1209, 127944. [Google Scholar] [CrossRef]
  44. Nie, X.-R.; Li, H.-Y.; Du, G.; Lin, S.; Hu, R.; Li, H.-Y.; Zhao, L.; Zhang, Q.; Chen, H.; Wu, D.-T.; et al. Structural characteristics, rheological properties, and biological activities of polysaccharides from different cultivars of okra (Abelmoschus esculentus) collected in China. Int. J. Biol. Macromol. 2019, 139, 459–467. [Google Scholar] [CrossRef]
  45. Yan, Y.; Li, X.; Wan, M.; Chen, J.; Li, S.; Cao, M.; Zhang, D. Effect of extraction methods on property and bioactivity of water-soluble polysaccharides from Amomum villosum. Carbohydr. Polym. 2015, 117, 632–635. [Google Scholar] [CrossRef]
  46. Wang, R.; Chen, P.; Jia, F.; Tang, J.; Ma, F. Optimization of polysaccharides from Panax japonicus C.A. Meyer by RSM and its anti-oxidant activity. Int. J. Biol. Macromol. 2012, 50, 331–336. [Google Scholar] [CrossRef]
  47. Sourki, A.H.; Koocheki, A.; Elahi, M. Ultrasound-assisted extraction of β-d-glucan from hull-less barley: Assessment of physicochemical and functional properties. Int. J. Biol. Macromol. 2017, 95, 462–475. [Google Scholar] [CrossRef]
  48. Qian, J.-Y.; Bai, Y.-Y.; Tang, J.; Chen, W. Antioxidation and α-glucosidase inhibitory activities of barley polysaccharides modified with sulfation. LWT 2015, 64, 104–111. [Google Scholar] [CrossRef]
  49. Zhu, Z.-Y.; Liu, F.; Gao, H.; Sun, H.; Meng, M.; Zhang, Y.-M. Synthesis, characterization and antioxidant activity of selenium polysaccharide from Cordyceps militaris. Int. J. Biol. Macromol. 2016, 93, 1090–1099. [Google Scholar] [CrossRef]
  50. Fu, X.; Yang, H.; Ma, C.; Li, X.; Li, D.; Yang, Y.; Xu, Y.; Wang, L. Characterization and inhibitory activities on α-amylase and α-glucosidase of the polysaccharide from blue honeysuckle berries. Int. J. Biol. Macromol. 2020, 163, 414–422. [Google Scholar] [CrossRef]
  51. Zheng, Y.; Zhang, S.; Wang, Q.; Lu, X.; Lin, L.; Tian, Y.; Xiao, J.; Zheng, B. Characterization and hypoglycemic activity of a β-pyran polysaccharides from bamboo shoot (Leleba oldhami Nakal) shells. Carbohydr. Polym. 2016, 144, 438–446. [Google Scholar] [CrossRef]
  52. Shen, S.-G.; Jia, S.-R.; Wu, Y.-K.; Yan, R.-R.; Lin, Y.-H.; Zhao, D.-X.; Han, P.-P. Effect of culture conditions on the physicochemical properties and antioxidant activities of polysaccharides from Nostoc flagelliforme. Carbohydr. Polym. 2018, 198, 426–433. [Google Scholar] [CrossRef]
  53. Dong, H.; Lin, S.; Zhang, Q.; Chen, H.; Lan, W.; Li, H.; He, J.; Qin, W. Effect of extraction methods on the properties and antioxidant activities of Chuanminshen violaceum polysaccharides. Int. J. Biol. Macromol. 2016, 93, 179–185. [Google Scholar] [CrossRef] [PubMed]
  54. Zhang, H.; Zhang, N.; Xiong, Z.; Wang, G.; Xia, Y.; Lai, P.; Ai, L. Structural characterization and rheological properties of β-D-glucan from hull-less barley (Hordeum vulgare L. var. nudum Hook. f.). Phytochemistry 2018, 155, 155–163. [Google Scholar] [CrossRef] [PubMed]
  55. Xiao, X.; Li, X.; Bai, J.; Fan, S.; Daglia, M.; Li, J.; Ding, Y.; Zhang, Y.; Zhao, Y. Changes in the structural, physicochemical and functional properties and in vitro fecal fermentation characteristics of barley dietary fiber fermented by Lactiplantibacillus plantarum dy-1. Food Funct. 2024, 15, 4276–4291. [Google Scholar] [CrossRef]
  56. Li, S.; Bai, J.; Yuan, J.; Yang, Z.; Du, Q.; Pan, B.; Zhu, Y.; Xiao, X.; Li, Y.; Li, C. Comparing in vitro digestion-fermentation characteristics and in vivo lipid-lowering effects of hot water and alkali-extracted polysaccharides from Volvariella volvacea. J. Food Sci. 2025, 90, e70175. [Google Scholar] [CrossRef]
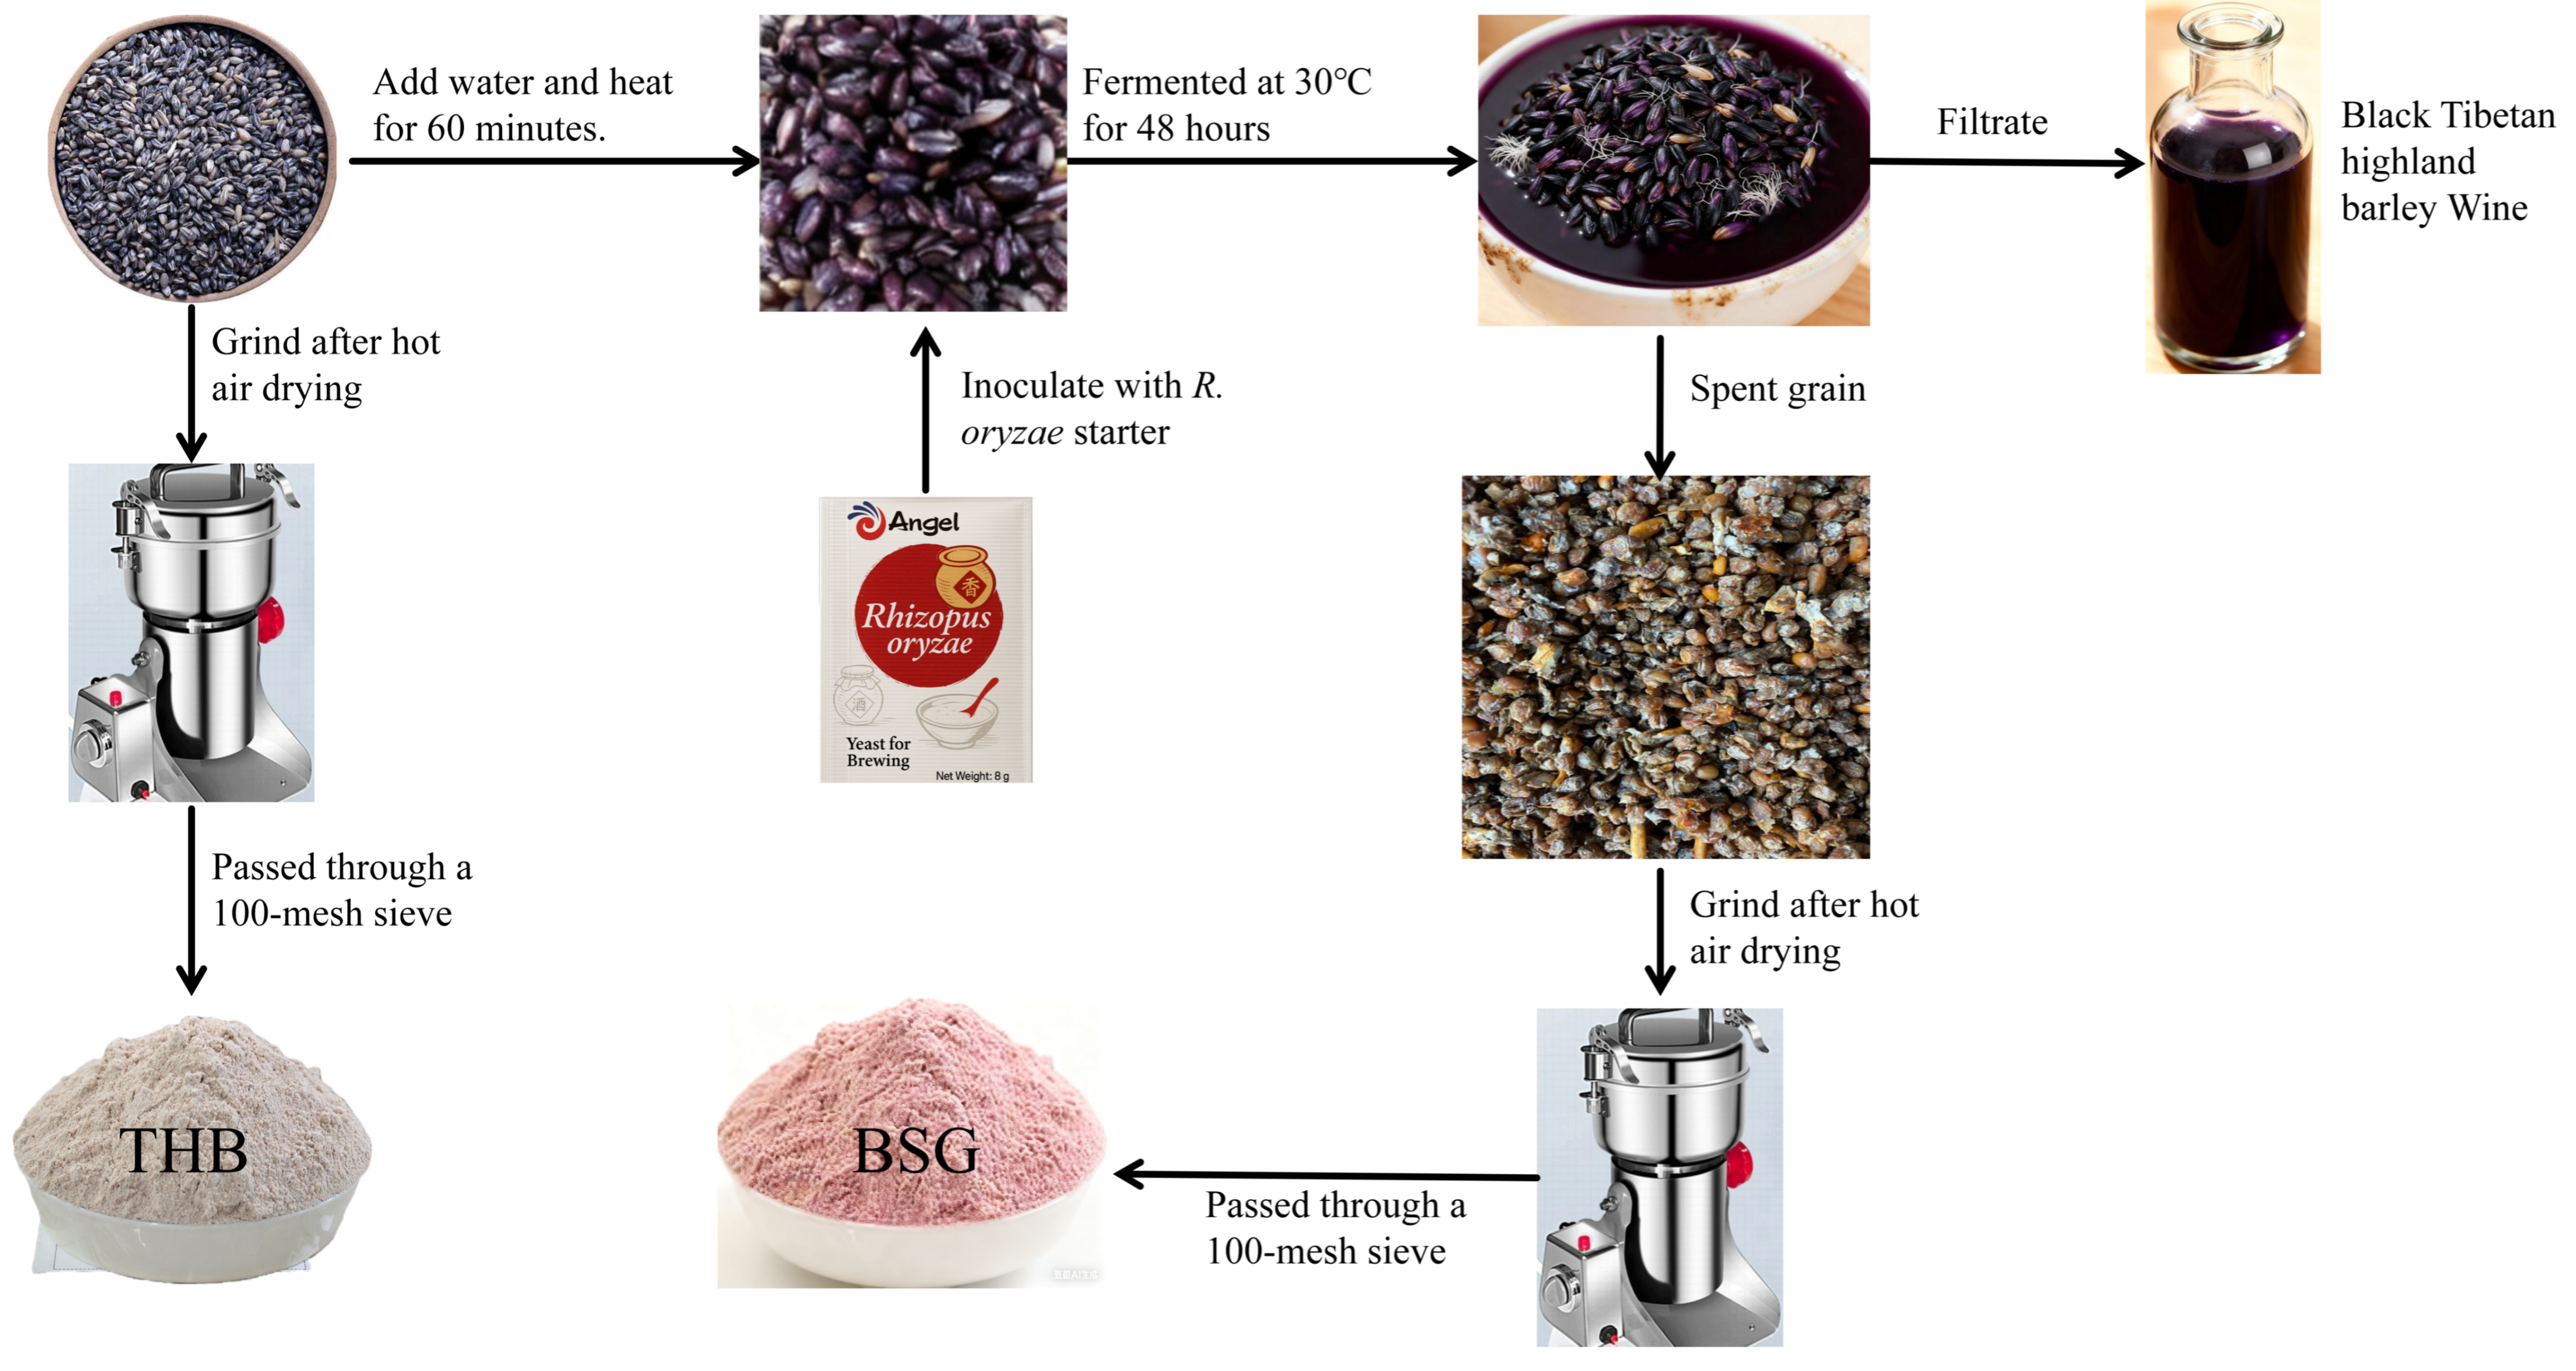
Figure 1. THB and BSG production workflow diagram.
Fermentation 11 00600 g001
Figure 2. Yield of β-glucan from THB and BSG. Data are presented as mean ± SD (n = 3 independent extractions). The symbol ** represents p < 0.01.
Fermentation 11 00600 g002
Figure 3. The chromatograms (A) and the monosaccharide composition (B) of THB-B and BSG-B by using the HPLC–PMP method. MD: The mixed PMP-derivatized monosaccharide standard comprising 14 monosaccharides (each 200 mg/L). Monosaccharide composition values of Figure 3B were transformed as log10(x + 10) − 1 (where x is the mass percentage from Table 3) to improve the visualization of low-abundance monosaccharides, which correspond to those in Table 3.
Fermentation 11 00600 g003
Figure 4. The Fourier transform infrared spectra of THB-B and BSG-B.
Fermentation 11 00600 g004
Figure 5. Macro-morphology (A) and SEM images of THB-B and BSG-B at magnifications of 1000× (B), 2000× (C), and 5000× (D).
Fermentation 11 00600 g005
Figure 6. The 2D and 3D morphologies of THB-B (A) and BSG-B (B) and its aggregate width (C,D) were observed using atomic force microscopy.
Fermentation 11 00600 g006
Figure 7. Antioxidant activity of THB-B and BSG-B solutions. (A) Total reducing power, (B) NO radical scavenging ability, (C) DPPH radical scavenging ability, and (D) ABTS radical scavenging ability. Data are presented as the mean ± SD (n = 3 independent extractions). Values with different lowercase letters in the same column indicate significant differences (p < 0.05).
Fermentation 11 00600 g007
Figure 8. Apparent viscosity (A) and oil-holding power (B) of THB-B and BSG-B solutions. Data are presented as mean ± SD ( n = 3 independent extractions). Values with different lowercase letters in the same column indicate significant differences (p < 0.05).
Fermentation 11 00600 g008
Table 1. Total yield and its total sugar, β-glucan, and protein content of the extracted THB-B and BSG-B.
ContentTHB-BBSG-B
Extracted yield (%)5.11 ± 0.21 a4.13 ± 0.10 b
Total sugar (%)92.69 ± 1.79 a81.79 ± 1.39 b
β-Glucan (%)90.46 ± 1.74 a66.35 ± 1.13 b
Protein (%)2.22 ± 0.34 a1.96 ± 0.26 a
Note: Different lowercase letters within a row indicate significant differences between samples (one-way ANOVA followed by Duncan’s multiple range test, p < 0.05).
Table 2. Molecular weight of β-glucan from THB and BSG.
THB-BBSG-B
Mw (Da)2.33 × 10⁶ (±2.34%) b5.24 × 106 (±6.34%) a
Mw/Mn5.40 (±2.98%)4.72 (±9.84%)
Mz/Mn39.16 (±5.74%)129.92 (±13.47%)
Note: Different lowercase letters within a row indicate significant differences between samples (one-way ANOVA followed by Duncan’s multiple range test, p < 0.05).
Table 3. Monosaccharide composition of β-glucan from THB-B and BSG-B by using the HPLC-PMP method.
Reducing MonosaccharideTHB-B (%)BSG-B (%)
Gulonic acid 0.0580.080
Mannuronic acid0.0000.000
Mannose0.2941.957
Glucosamine0.0560.587
Ribose0.0000.000
Rhamnose0.0230.194
Glucuronic acid0.0110.858
Galacturonic acid0.1190.315
Galactosamine0.0000.188
Glucose97.95981.128
Galactose0.4342.188
Xylose0.3855.153
Arabinose0.5626.770
Fucose0.0000.533
Note: Values are mass percentages (%), normalized to 100% of the total detected monosaccharides after acid hydrolysis and PMP derivatization. Data represent a single determination (compositional data; components are not independent).
Disclaimer/Publisher’s Note: The statements, opinions and data contained in all publications are solely those of the individual author(s) and contributor(s) and not of MDPI and/or the editor(s). MDPI and/or the editor(s) disclaim responsibility for any injury to people or property resulting from any ideas, methods, instructions or products referred to in the content.