Article

Metabolic Engineering for Efficient Synthesis of Patchoulol in Saccharomyces cerevisiae

1
Key Laboratory of Industrial Biotechnology, Ministry of Education, School of Biotechnology, Jiangnan University, 1800 Lihu Road, Wuxi 214122, China
2
Science Center for Future Foods, Jiangnan University, 1800 Lihu Road, Wuxi 214122, China
3
Engineering Research Center of Ministry of Education on Food Synthetic Biotechnology, Jiangnan University, 1800 Lihu Road, Wuxi 214122, China
4
Jiangsu Province Engineering Research Center of Food Synthetic Biotechnology, Jiangnan University, 1800 Lihu Road, Wuxi 214122, China
*
Authors to whom correspondence should be addressed.
Fermentation 2024, 10(4), 211; https://doi.org/10.3390/fermentation10040211
Submission received: 11 March 2024 / Revised: 5 April 2024 / Accepted: 7 April 2024 / Published: 12 April 2024
(This article belongs to the Section Microbial Metabolism, Physiology & Genetics)

Abstract

:
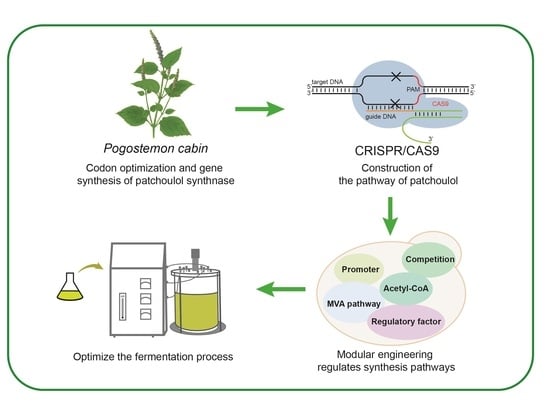
Patchoulol is a natural sesquiterpene alcohol with extensive applications in cosmetics and pharmaceuticals. In this study, we first constructed the synthesis pathway of patchoulol in Saccharomyces cerevisiae by expressing the patchoulol synthase PTS gene using the strong promoter GAL1. Afterward, the metabolic flux of the precursor was enhanced by strengthening the mevalonate pathway and balancing the precursor competition pathway, resulting in a 32.74-fold increase in patchoulol production. Subsequently, the supply of acetyl-CoA in yeast was increased by modifying transcriptional regulators and modulating the acetyl-CoA pathway, and the titer of patchoulol reached 155.94 mg/L. Finally, optimization of the fermentation conditions resulted in a titer of 195.96 mg/L in the shake flasks. Further, batch-fed fermentation in a 5 L bioreactor yielded 1.95 g/L. This work accelerated the development of a microbial cell factory for the production of patchoulol.

Graphical Abstract

1. Introduction

Patchoulol, a sesquiterpene alcohol present in Pogostemon cabin leaves, is widely used in cosmetics, skin care products and perfumes because of its unique aroma and lasting fragrance [1,2]. In addition, patchoulol has extensive pharmacological effects, such as neuroprotection, resistance to inflammation, anticancer, analgesia, etc. Patchoulol is also used in the synthesis of the chemotherapy drug Taxol, so it has great potential value in the field of medicine [3]. Due to the low and unstable annual production of patchoulol, the price of patchoulol fluctuates between $30–200/kg [4]. At present, patchoulol is mainly extracted from Pogostemon cabin by steam distillation. However, this method consumes a lot of electric energy and kerosene and is affected by plant growth, planting location and climate environment, so the product quality is unstable and the cost is high [5,6]. Compared with the plant extraction method, biosynthesis has the advantages of not being restricted by the environment, short cycle time and simple production operation, which is a very promising method that can be used for large-scale production.
Among existing engineered microorganisms, S. cerevisiae is extensively used in the production of terpenoids owing to its safety, high catabolic rate of glucose, clear genetic background and relatively fast growth rate [7]. S. cerevisiae cells contain the mevalonate (MVA) pathway, which can produce the common precursors of terpenoids, isopentenyl pyrophosphate (IPP) and dimethylallyl pyrophosphate (DMAPP). IPP and DMAPP are converted to farnesyl pyrophosphate (FPP) under the catalysis of endogenous farnesyl pyrophosphate synthase (FPPS), which is a direct precursor of patchoulol and converted to patchoulol under the catalysis of exogenous patchoulol synthase (PTS). In recent years, researchers have attempted to synthesize patchoulol using S. cerevisiae and have made significant progress. Asadollahi et al. [8] constructed a pathway for the synthesis of patchoulol in S. cerevisiae, and reduced the metabolic flow of squalene synthesis by regulating the ERG9 gene, so that the titer of patchoulol reached 16.9 mg/L. Ma et al. [9] achieved a patchoulol yield of 466.8 mg/L in a 5 L fermenter by fusing FPPS with PTS, enhancing the MVA pathway, and inhibiting the synthesis of farnesol and ergosterol. Liu et al. [6] modified the metabolic pathway of yeast, enhanced the expression of the ergosterol pathway, modified the synthase of patchoulol, and then obtained 1632 mg/L patchoulol by fed-batch fermentation. Despite the fact that the yield of patchoulol has been greatly improved, it still cannot meet the existing demand.
The study focused on enhancing patchoulol production in S. cerevisiae through combinatorial metabolic engineering (Figure 1). Initially, the gene PTS was heterogeneously expressed using the inducible promoter GAL1 to generate a patchoulol-producing strain. Subsequently, it was divided into four modules for systematic metabolic regulation of yeast strains, which involved strengthening the endogenous MVA synthesis pathway, reducing competition from the precursor FPP pathway, eliminating endogenous transcriptional regulatory factors and enhancing the acetyl-CoA pathway. The performance of the recombinant strains was assessed based on cell growth, squalene content and patchoulol yield. Through optimization of fermentation conditions and implementation of fed-batch fermentation, the patchoulol yield in S. cerevisiae was significantly increased.

2. Materials and Methods

2.1. Strains and Media

In this study, S. cerevisiae CEN.PK2-1C was used as the starting strain and cultivated at 30 °C with YPD medium. Nutritional deficiency medium SD/-Trp (20 g/L glucose, 6.7 g/L YNB, 80 mg/L his, 80 mg/L ura and 400 mg/L leu) and SD/Trp-Ura (SD/-Trp lacking ura) were used to screen and culture yeast inverters and SD/-Trp+5-FOA solid medium was used to reverse select URA3-labeled sgRNA expression plasmid [10]. E. coli DH5α was used for plasmid construction and cultured in LB medium supplemented with 100 mg/L ampicillin at 37 °C.
Prime STAR Max DNA polymerase was purchased from TaKaRa (Otsu, Japan). Plasmid extraction and DNA gel purification kits were purchased from Thermo Scientific (Wilmington, NC, USA). The standard of patchoulol, squalene and dodecane were purchased from Aladdin (Shanghai, China). YPD Broth was purchased from Haibo Biotechnology Co., LTD (Qingdao, China).

2.2. Plasmids Construction

All plasmids constructed in this study are listed in Table 1. The sequencing verification of DNA and the synthesis of primers were conducted by Sangon Biotech (Shanghai, China). The original plasmids pESC-URA, p426-SNR52p-gRNA and p414-TEF1p-Cas9-CYC1t were obtained from our laboratory store. The exogenous coding gene PTS was synthesized by GENEWIZ (Suzhou, China).
Construction of the pESC-PTS protein expression plasmid: the empty plasmid pESC-URA was transformed into a linear form with the primer pESC-F/R. Subsequently, the PTS fragment was amplified from E. coli DH5α-PTS using the primer PTS-F/R. The two fragments were then assembled via OE-PCR and introduced into E. coli DH5α. Verification of successful construction of the expression vector was conducted through colony PCR reactions and gene sequencing after single bacteria growth on an LB plate.
Construction of p426-sgRNA plasmid: crRNA sequence can be designed through an online website (CHOPCHOP (uib.no) (accessed 14 March 2023)) or independently based on CDS sequence. Primers were designed following the introduction of the crRNA sequence into the gRNA expression box. The full-length gRNA plasmid was amplified using a polymerase chain reaction, and the resulting product was then transformed into E. coli DH5α receptor cells to construct p426-sgRNA plasmid.
All of the primers and exogenous gene sequences used in this study are listed in Table S1 and Table S2, respectively.

2.3. Yeast Transformation and Strains Construction

This study utilized CRISPR/Cas9 gene editing technology to construct yeast strains. Initially, the Cas9 expression plasmid p414-TEF1p-Cas9-CYC1t was introduced into CEN.PK2-1C for subsequent gene editing. All strains constructed in this study are detailed in Table 2. Upstream and downstream homologous arms (approximately 500 bp), along with promoters, terminators and endogenous coding genes were amplified from the genomic DNA of S. cerevisiae. These components were then assembled into a fragment using OE-PCR to form either a gene knockout cassette or a gene expression cassette. The sgRNA plasmid and gene expression cassette were transferred into S. cerevisiae using the lithium acetate conversion method, and transformants were screened on SD/-Trp-Ura plates. Successfully transformed strains were cultivated on SD/-Trp+5-FOA plates to eliminate the sgRNA plasmid tagged with URA3 for subsequent transformations. The sgRNA plasmid-deleted strains were preserved in the SD/-Trp medium. The schematic representation of the strain construction process in this study is depicted in Figure S2.

2.4. Cultivation in Shaking Flask

A single colony of S. cerevisiae was inoculated into 50 mL culture tubes containing 5 mL YPD medium and cultured at 30 °C and 220 rpm for 18 h to obtain the primary seed solution. The solution was then transferred to 250 mL shake flasks containing 50 mL YPD medium at an inoculum of 1% and incubated under the same conditions. After 12 h, 10% filtered dodecane was added to initiate a two-phase fermentation lasting 120 h. At the end of the fermentation, the OD600 of the fermentation broth and the yield of patchoulol in the dodecane phase were measured.

2.5. Extraction and Detection Methods

To quantify patchoulol, the fermentation liquid was collected in a centrifuge tube and centrifuged at 8000 rpm for 5 min. The upper organic phase was then collected, an appropriate amount of anhydrous sodium sulfate was added, and the mixture was gently inverted several times before being left for approximately 30 min for dewatering. The upper organic phase was centrifuged at 12,000 rpm for 2 min, diluted with n-hexane, and filtered using an organic filter membrane of 0.22 μm [9,11]. Patchoulol was quantitatively determined using GC-MS (GC-2010 Plus and GCMS-QP2010, Shimadzu, Kyoto, Japan) with DB-5MS (30 m × 0.25 mm, 0.25 μm, Agilent, Santa Clara, CA, USA). The initial oven temperature was 50 °C for 1 min, then raised to 200 °C and 280 °C at rates of 10 °C/min and 20 °C/min, respectively, and held at 280 °C for 9 min. 1 μL sample was injected in a non-shunt manner, with helium as the carrier gas. The scanning range was set at 50–300 m/z, and selected ion monitoring (SIM) was employed for quantitative analysis, with mass charge ratios (m/z) of 138, 161 and 222 [2,6,12].
In order to detect the yield of squalene, 500 μL of the fermentation liquid was transferred to a 2 mL fragmentation tube, centrifuged at high speed for 10 min, the supernatant was removed, and the cell precipitation was mixed with an equal volume of grinding beads (0.5 mm), followed by the addition of 1.5 mL acetone. Yeast cell lysis was performed using Fast Prep of MP Biomedicals (Irvine, CA, USA), resulting in squalene being present in the upper organic phase [13,14]. Squalene was then detected by GC-MS, with the initial chamber temperature set at 90 °C for 1 min, followed by an increase to 280 °C at 20 °C/min, and a 15 min hold. The sample was injected in a non-shunt manner, and the scanning range was 35–500 m/z [15].
For the determination of cell dry weight (CDW), a 1.5 mL EP tube was dried in a 105 °C oven and weighed on an electronic balance, with the initial weight of the EP tube recorded. Following centrifugation of 1 mL fermentation broth at 10,000 rpm for 5 min, the supernatant was discarded, and the bacterial cells were washed with sterile water, dried until no further change in weight, and then weighed and recorded as the final weight. The difference between the final and initial weights was calculated, with three parallel experiments conducted for each group [16]. The relationship between cell dry weight and OD600 was determined as y = 0.2971x + 0.7756 (where y represents cell concentration in g DCW/L and x represents OD600) (Figure S1).
To determine the glucose and ethanol content in the fermentation solution, 1 mL of the solution was centrifuged at high speed for 2–3 min, the supernatant was diluted appropriately, filtered and tested using a biosensor analyzer (Shenzhen Hillman Technology Co., LTD, Shenzhen, China).

2.6. Fed-Batch Fermentation

In a fed-batch fermentation process using a 5-L bioreactor (Diebold Bioengineering Co., Ltd., Shanghai, China) with a liquid volume of 2.4 L, the primary and secondary seed solutions were cultured in a YPD medium with an inoculation amount of 4%. The fed-batch fermentation utilized an OYPD medium with an inoculation amount of 8%. The fermentation conditions were controlled with a temperature of 30 °C, stirring speed ranging from 300 to 800 rpm, dissolved oxygen (DO) maintained below 40% and pH between 5.5 and 6.0. After 20 h of fermentation, 270 mL of dodecane was added.
  • Supplementary medium Ⅰ for the first stage (1 L): 800 g glucose, 300 g yeast extract.
  • Supplementary medium Ⅱ for the second stage (1 L): 60% ethanol.
  • Metal ion solution A (1 L): 5.75 g ZnSO4∙7H2O, 0.32 g MnC12∙4H2O, 0.47 g CoC12∙6H2O, 0.48 g Na2MoO4∙2H2O, 2.9 g CaC12∙2H2O, 2.8 g FeSO4∙7H2O, 80 mL 0.5 M EDTA, Adjust pH = 8.0.
  • Vitamin solution B (1 L): 0.05 g biotin, 1 g calcium pantothenate, l g nicotinic acid, 25 g myo-inositol, 1 g thiamine HCl, 1 g pyridoxal HCl, 0.02 g p-aminobenzoic acid.

3. Results and Discussion

3.1. Construction of Synthetic Pathway of Patchoulol in Saccharomyces cerevisiae

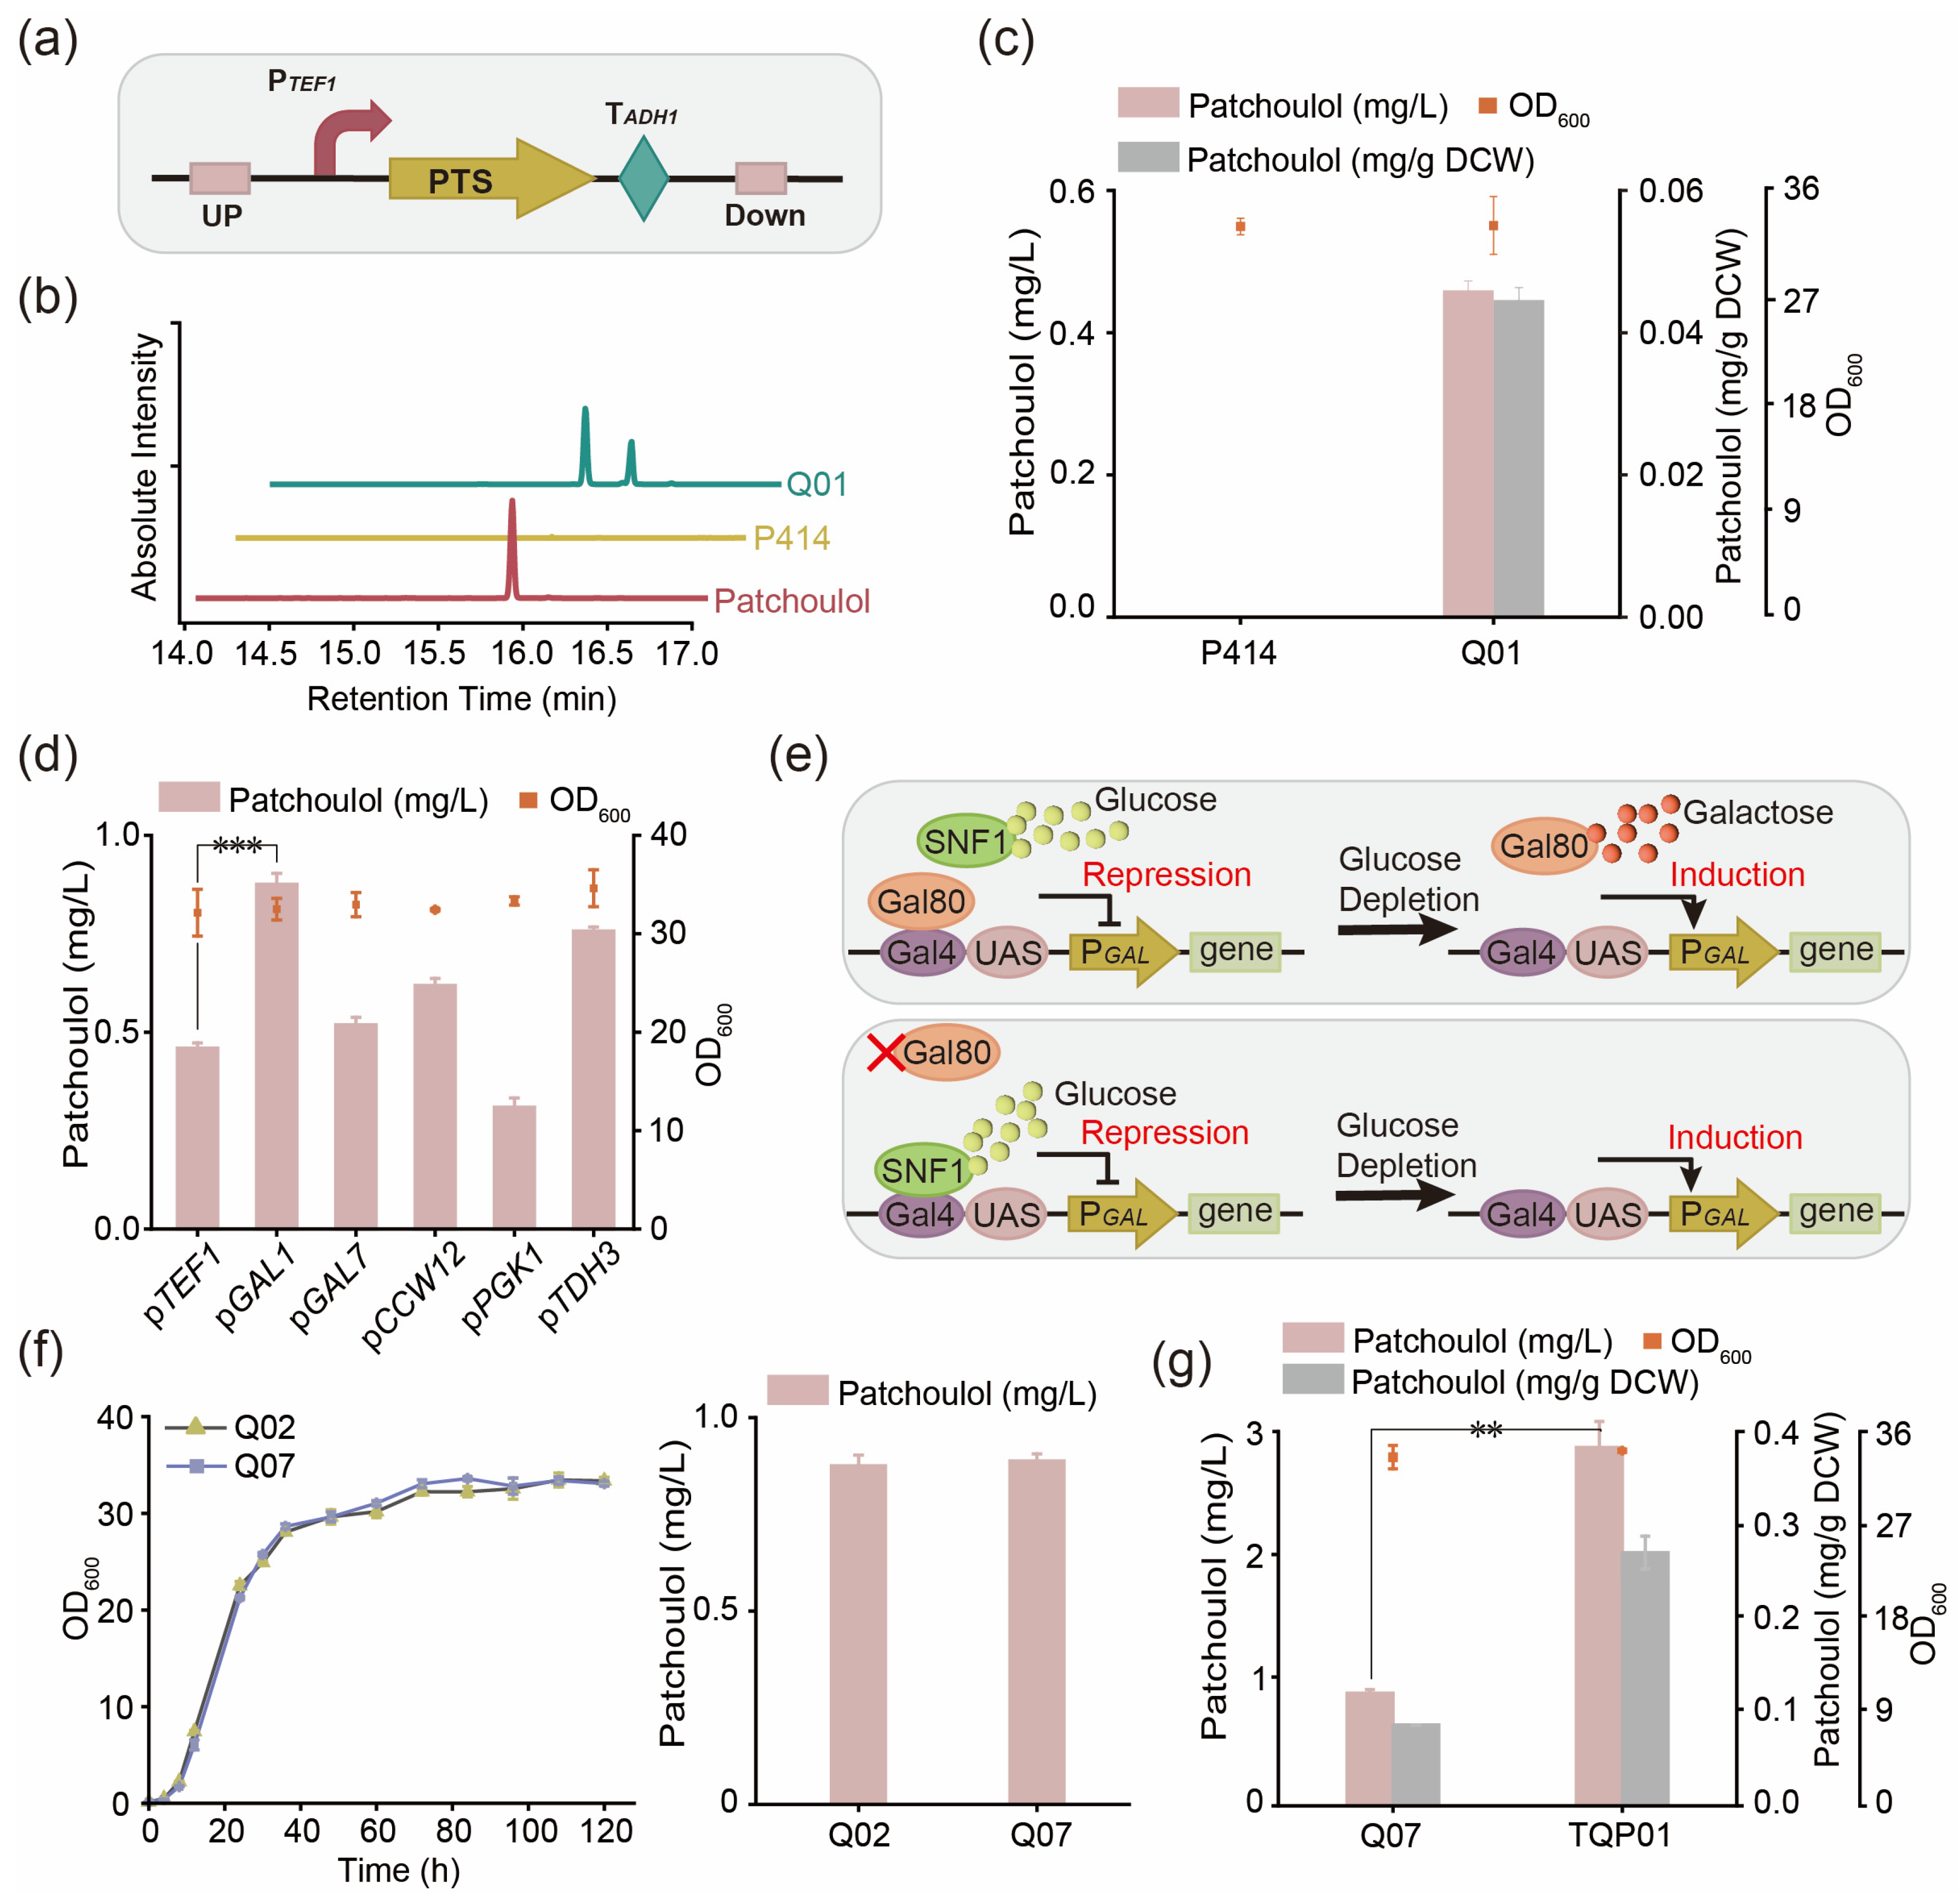
S. cerevisiae possesses a mevalonate pathway utilizing the intermediate metabolite acetyl-CoA as the precursor, which can synthesize the direct precursor FPP of patchoulol, and is a promising microorganism for the synthesis of patchoulol [9]. However, due to the lack of the essential gene for patchoulol synthesis in S. cerevisiae, external introduction of patchoulol synthase is necessary to enable patchoulol production [6]. In this study, patchoulol synthase (PTS) from Pogostemon cablin was selected for codon optimization and gene synthesis. PTS was heterologously expressed in the P414 strain using a strong promoter TEF1 (Figure 2a), resulting in the generation of the initial strain Q01. Following fermentation for 120 h, GC-MS analysis detected 0.46 ± 0.01 mg/L (0.04 ± 0.001 mg/g DCW) of patchoulol in the recombinant strain Q01, while no patchoulol was detected in the control strain (Figure 2b,c), indicating successful construction of a patchoulol synthesis pathway in strain Q01.

3.2. Promoter Screening for Rational Control of Patchoulol Biosynthesis

Promoters play a crucial role in microbial genetic systems by influencing gene transcription levels and ultimately impacting the production of metabolites [17]. In this study, the endogenous strong promoters GAL1, GAL10, CCW12, PGK1, TEF1 and TDH3 were selected to express PTS individually [18], with the yield of patchoulol shown in Figure 2d. Among these promoters, pGAL1 was identified as the most effective for expressing PTS, resulting in a patchoulol titer of 0.88 ± 0.03 mg/L (0.08 ± 0.001 mg/g DCW), which was 91.3% higher than that expressed by the pTEF1 strain. Consequently, pGAL1 was chosen for further experiments involving PTS expression.
The GAL1 promoter is a galactose-induced promoter that is tightly regulated by galactose and glucose. In the existence of glucose, transcription of the GAL1 promoter is suppressed, requiring the addition of galactose to alleviate this inhibition [19]. However, due to the high cost of galactose and its unsuitability for industrial use, knocking out the transcriptional suppressor GAL80 switches the regulatory sugars from galactose to glucose. This allows for the activation of exogenous genes controlled by the GAL1 promoter at low glucose concentrations, removing the dependence on galactose in the GAL induction system [20] (Figure 2e). The recombinant strain Q07, obtained by knocking out GAL80, was compared with strain Q02. The results, as depicted in Figure 2f, showed no negative effects on cell growth and yield accumulation upon knocking out GAL80. Subsequently, strain TQP01 was created by introducing PTS into strain Q07 using a high copy plasmid pESC-URA. Strain TQP01 yielded 2.78 ± 0.19 mg/L (0.26 ± 0.02 mg/g DCW), 3.16 times that of single copy strain Q07 (Figure 2g). Therefore, the engineering transformation will proceed with strain TQP01.

3.3. Strengthen the MVA Pathway in Saccharomyces cerevisiae

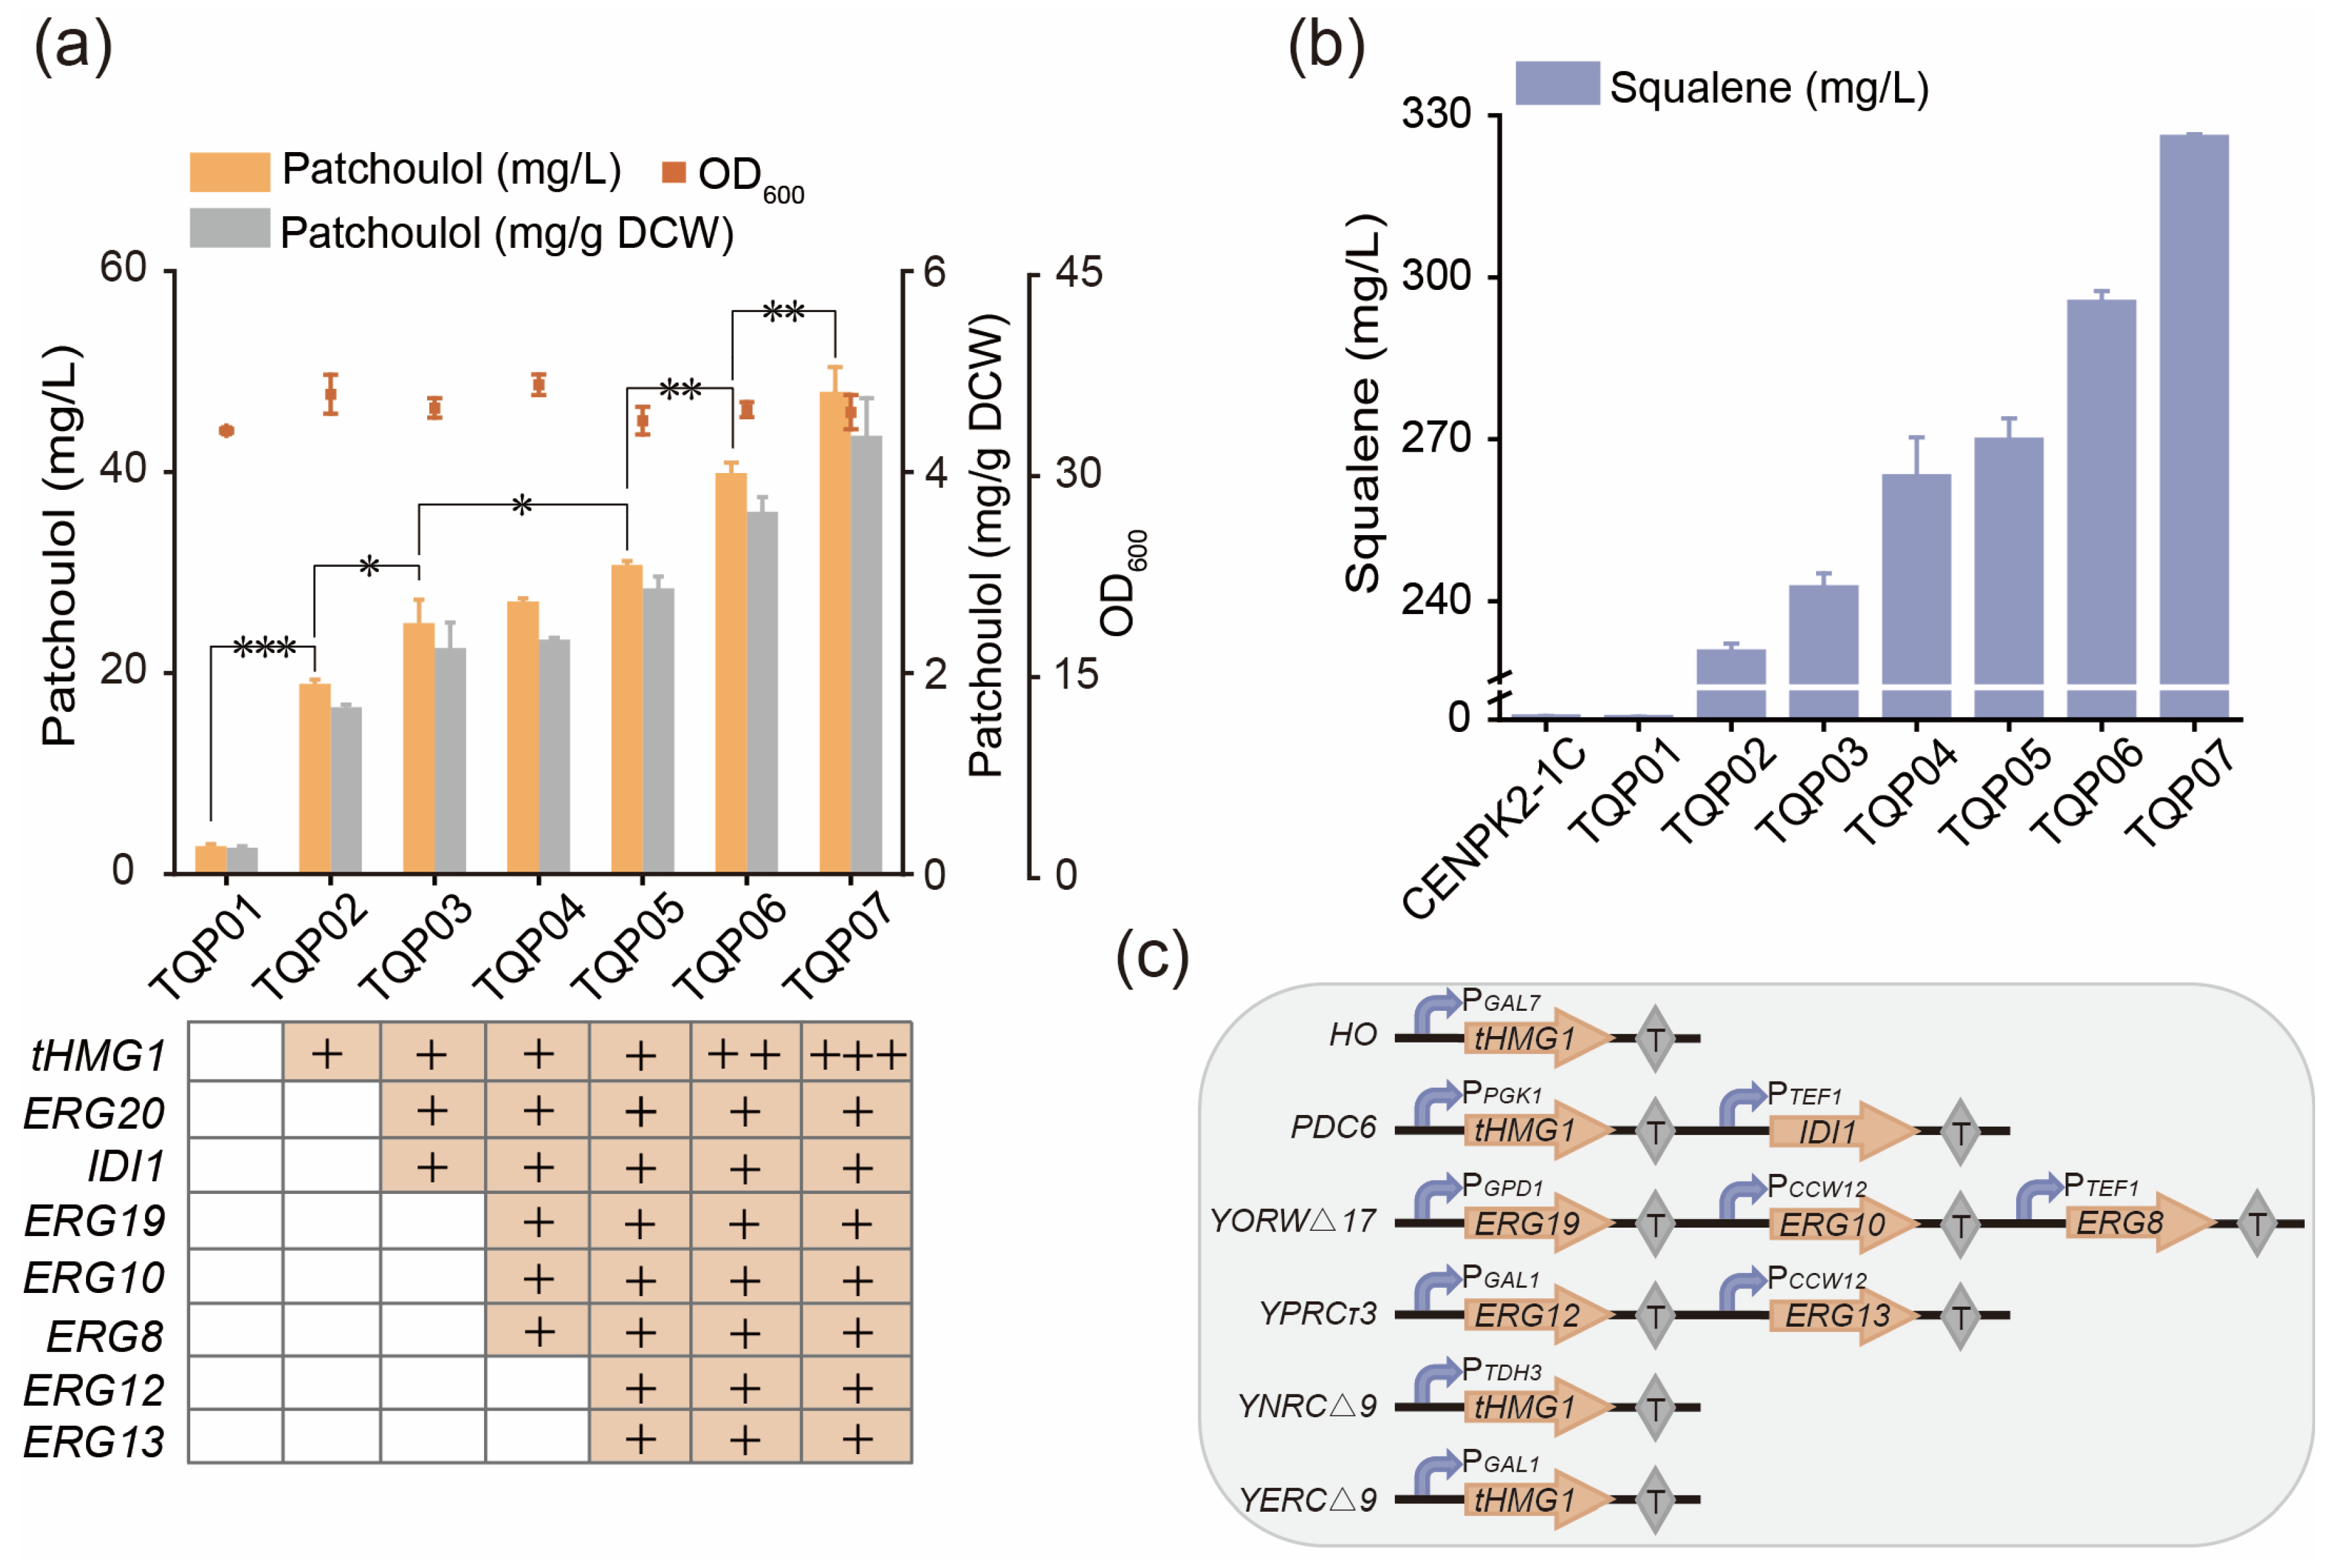
The MVA pathway in S. cerevisiae is an important synthesis pathway of terpenoid compounds, which provides the precursor substance FPP for the synthesis of patchoulol, so it is particularly necessary to strengthen the endogenous MVA synthesis pathway [21]. 3-Hydroxy-3-methylglutaryl-CoA reductase (HMG-CoA synthase, HMGR) is a key rate-limiting step in mevalonate synthesis. Previous studies have shown that overexpression of HMGR (tHMG1) with truncated N-terminal amino acid sequence can enhance the metabolic flow of the endogenous mevalonate pathway in engineered strains and provide a greater flow of five carbon units to the FPP [22,23]. In this study, the tHMG1 gene was overexpressed in strain TQP01 using a strong promoter, resulting in strain TQP02. After 120 h of fermentation, the yield of patchoulol increased by 4.8 times compared to strain TQP01, reaching 18.95 ± 0.42 mg/L (1.66 ± 0.03 mg/g DCW) (Figure 3a), while squalene yield was 230.68 ± 1.44 mg/L (20.22 ± 0.89 mg/g DCW) (Figure 3b). Subsequent integration of other MVA pathway genes, ERG20-IDI1, ERG19-ERG10-ERG8 and ERG12-ERG13 genes were divided into three groups (Figure 3c) and progressively integrated into the TQP02 strain to construct the TQP03, TQP04 and TQP05 strains, respectively. After 120 h of shaking, patchoulol yields reached 24.98 ± 2.32 mg/L (2.25 ± 0.25 mg/g DCW), 27.13 ± 0.31 mg/L (2.33 ± 0.0.02 mg/g DCW) and 30.77 ± 0.40 mg/L (2.84 ± 0.12 mg/g DCW), respectively. Strain TQP05 showed a 62.37% increase in patchoulol yield compared to TQP02, but this enhancement was lower than that achieved by overexpressing the rate-limiting enzyme gene (tHMG1). To boost the precursor substance FPP of patchoulol accumulation, two additional copies of tHMG1 were introduced into strain TQP05, resulting in strains TQP06 and TQP07, with TQP07 reaching a patchoulol yield of 48.00 ± 2.46 mg/L (4.36 ± 0.37 mg/g DCW) and a squalene yield of 326.02 ± 0.50 mg/L (29.61 ± 0.98 mg/g DCW) after 120 h of shaker culture.
In summary, by enhancing the expression of endogenous MVA pathway genes in S. cerevisiae, patchoulol yield increased significantly by 16.2 times (from 2.78 mg/L to 48.00 mg/L), and squalene production, utilizing FPP as a precursor, also increased from 0.48 mg/L to 326.02 mg/L (Figure 3b). These modifications did not negatively impact strain growth, suggesting that enhancing the metabolic flux of acetyl-CoA to FPP in the MVA pathway is beneficial for increasing patchoulol production.

3.4. Reduce the Consumption of Precursor FPP by Balancing Competition Pathway

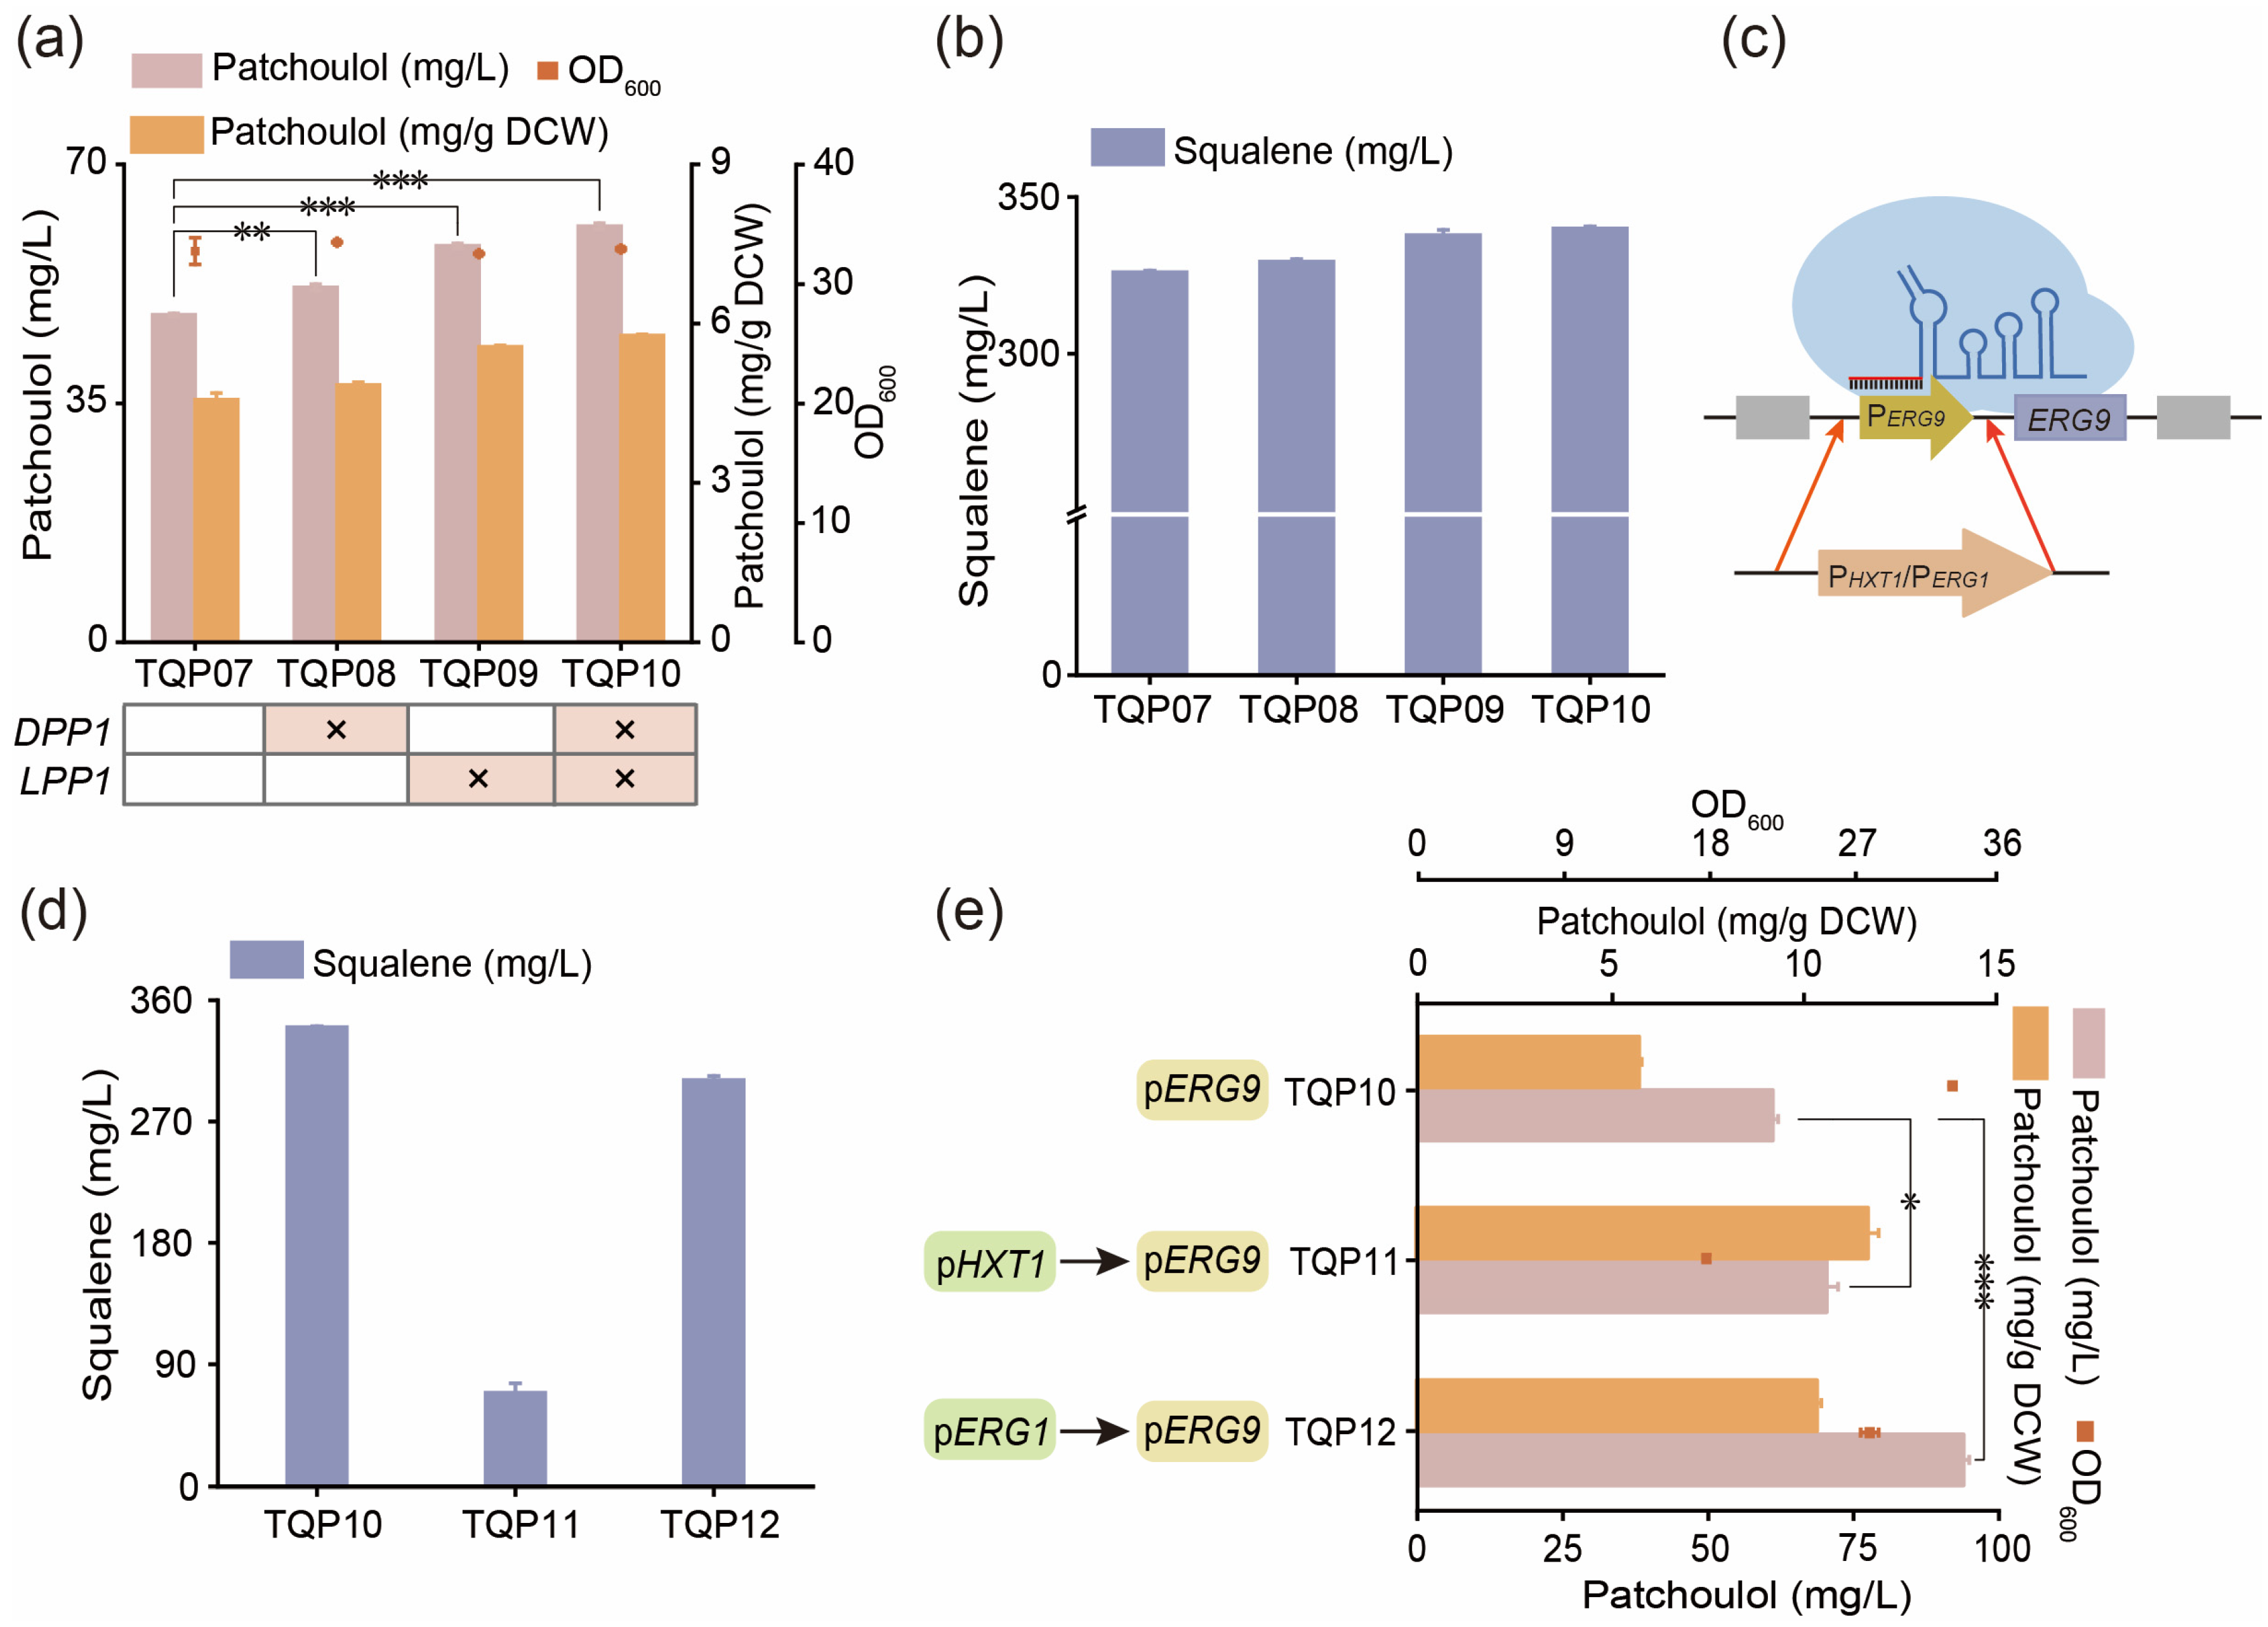
FPP plays a crucial role in the isoprene pathway as an intermediate, serving as a precursor for various metabolites. The farnesol pathway and squalene pathway, which use FPP as a precursor, compete with the patchoulol synthesis pathway for FPP and affect patchoulol synthesis [24,25]. Inhibiting the competition pathway of FPP is an important strategy to enhance patchoulol production. Previous research has indicated that the transformation of FPP to farnesol is primarily regulated by DPP1 and LPP1 genes, with their absence leading to increased sesquiterpene yields [26]. By sequentially knocking out DPP1 and LPP1 genes in the TQP07 strain, new strains TQP08, TQP09 and TQP10 were constructed. Experimental results (Figure 4a,b) showed that knocking out DPP1 and LPP1 genes boosted patchoulol production, with TQP10 achieving a yield of 60.94 ± 0.46 mg/L (5.77 ± 0.03 mg/g DCW), a 26% improvement over TQP07. However, the impact of the knockout of the farnesol pathway was not significant, especially in the strain with the DPP1 knockout alone. This is similar to the results obtained by Liu et al. [6] This is likely due to the proteins regulated by the DPP1 and LPP1 genes being small molecular weight integrated membrane proteins located on the Golgi apparatus and vacuole membranes, while the synthesis of patchoulol is mainly in the cytoplasm. There is a limited conversion of FPP to farnesol in the cytoplasm via DPP1 and LPP1, with more FPP flowing to other substances such as squalene, heme A and ubiquinone [24]. Therefore, reducing the metabolic flux of farnesol is limited to increasing the production of zebra mussels.
In S. cerevisiae, FPP is turned into squalene through squalene synthetase, which is further transformed into ergosterol through a series of enzymatic reactions. Since ergosterol plays a vital role in the cell membrane composition and S. cerevisiae is unable to uptake exogenous ergosterol in aerobic conditions, direct knockout of the gene is not feasible [8]. A common approach to address substrate competition issues involves regulating the expression of ERG9 through its promoter to modulate squalene metabolism (Figure 4c). To dynamically control ERG9 expression, we opted for the HXT1 promoter, which responds to changes in glucose levels [27]. By replacing the native ERG9 promoter in strain TQP10 with the HXT1 promoter to generate strain TQP11 (as depicted in Figure 4d,e), the production of patchoulol increased to 70.13 ± 1.95 mg/L (11.60 ± 0.21 mg/g DCW), while squalene content decreased significantly from 340.00 mg/L to 69.03 mg/L. However, this led to a 46.2% reduction in yeast biomass due to the decreased ergosterol flux, impacting cell growth. To mitigate this, we replaced the pERG9 promoter with ERG1, which is regulated by ergosterol levels, in strain TQP12. This adjustment resulted in a higher patchoulol yield of 93.79 ± 0.96 mg/L (10.33 ± 0.08 mg/g DCW), a decrease in squalene content from 340.00 mg/L to 300.65 mg/L and a reduction in OD600 from 32.92 to 27.94 (Figure 4e). Notably, pERG1 had a milder effect on cell growth compared to pHXT1, making it a better choice for balancing the squalene competition pathway.
In conclusion, knocking out the DPP1 and LPP1 genes, which regulate farnesol, led to a modest increase in patchoulol yield. Dynamic regulation of the ERG9 gene expression through the ergosterol-responsive promoter ERG1 enabled cells to adjust the metabolic flux of the squalene synthesis module in accordance with ergosterol levels, facilitating the production of patchoulol [7].

3.5. Improving the Production of Patchoulol by Modifying Transcription Regulatory Factors

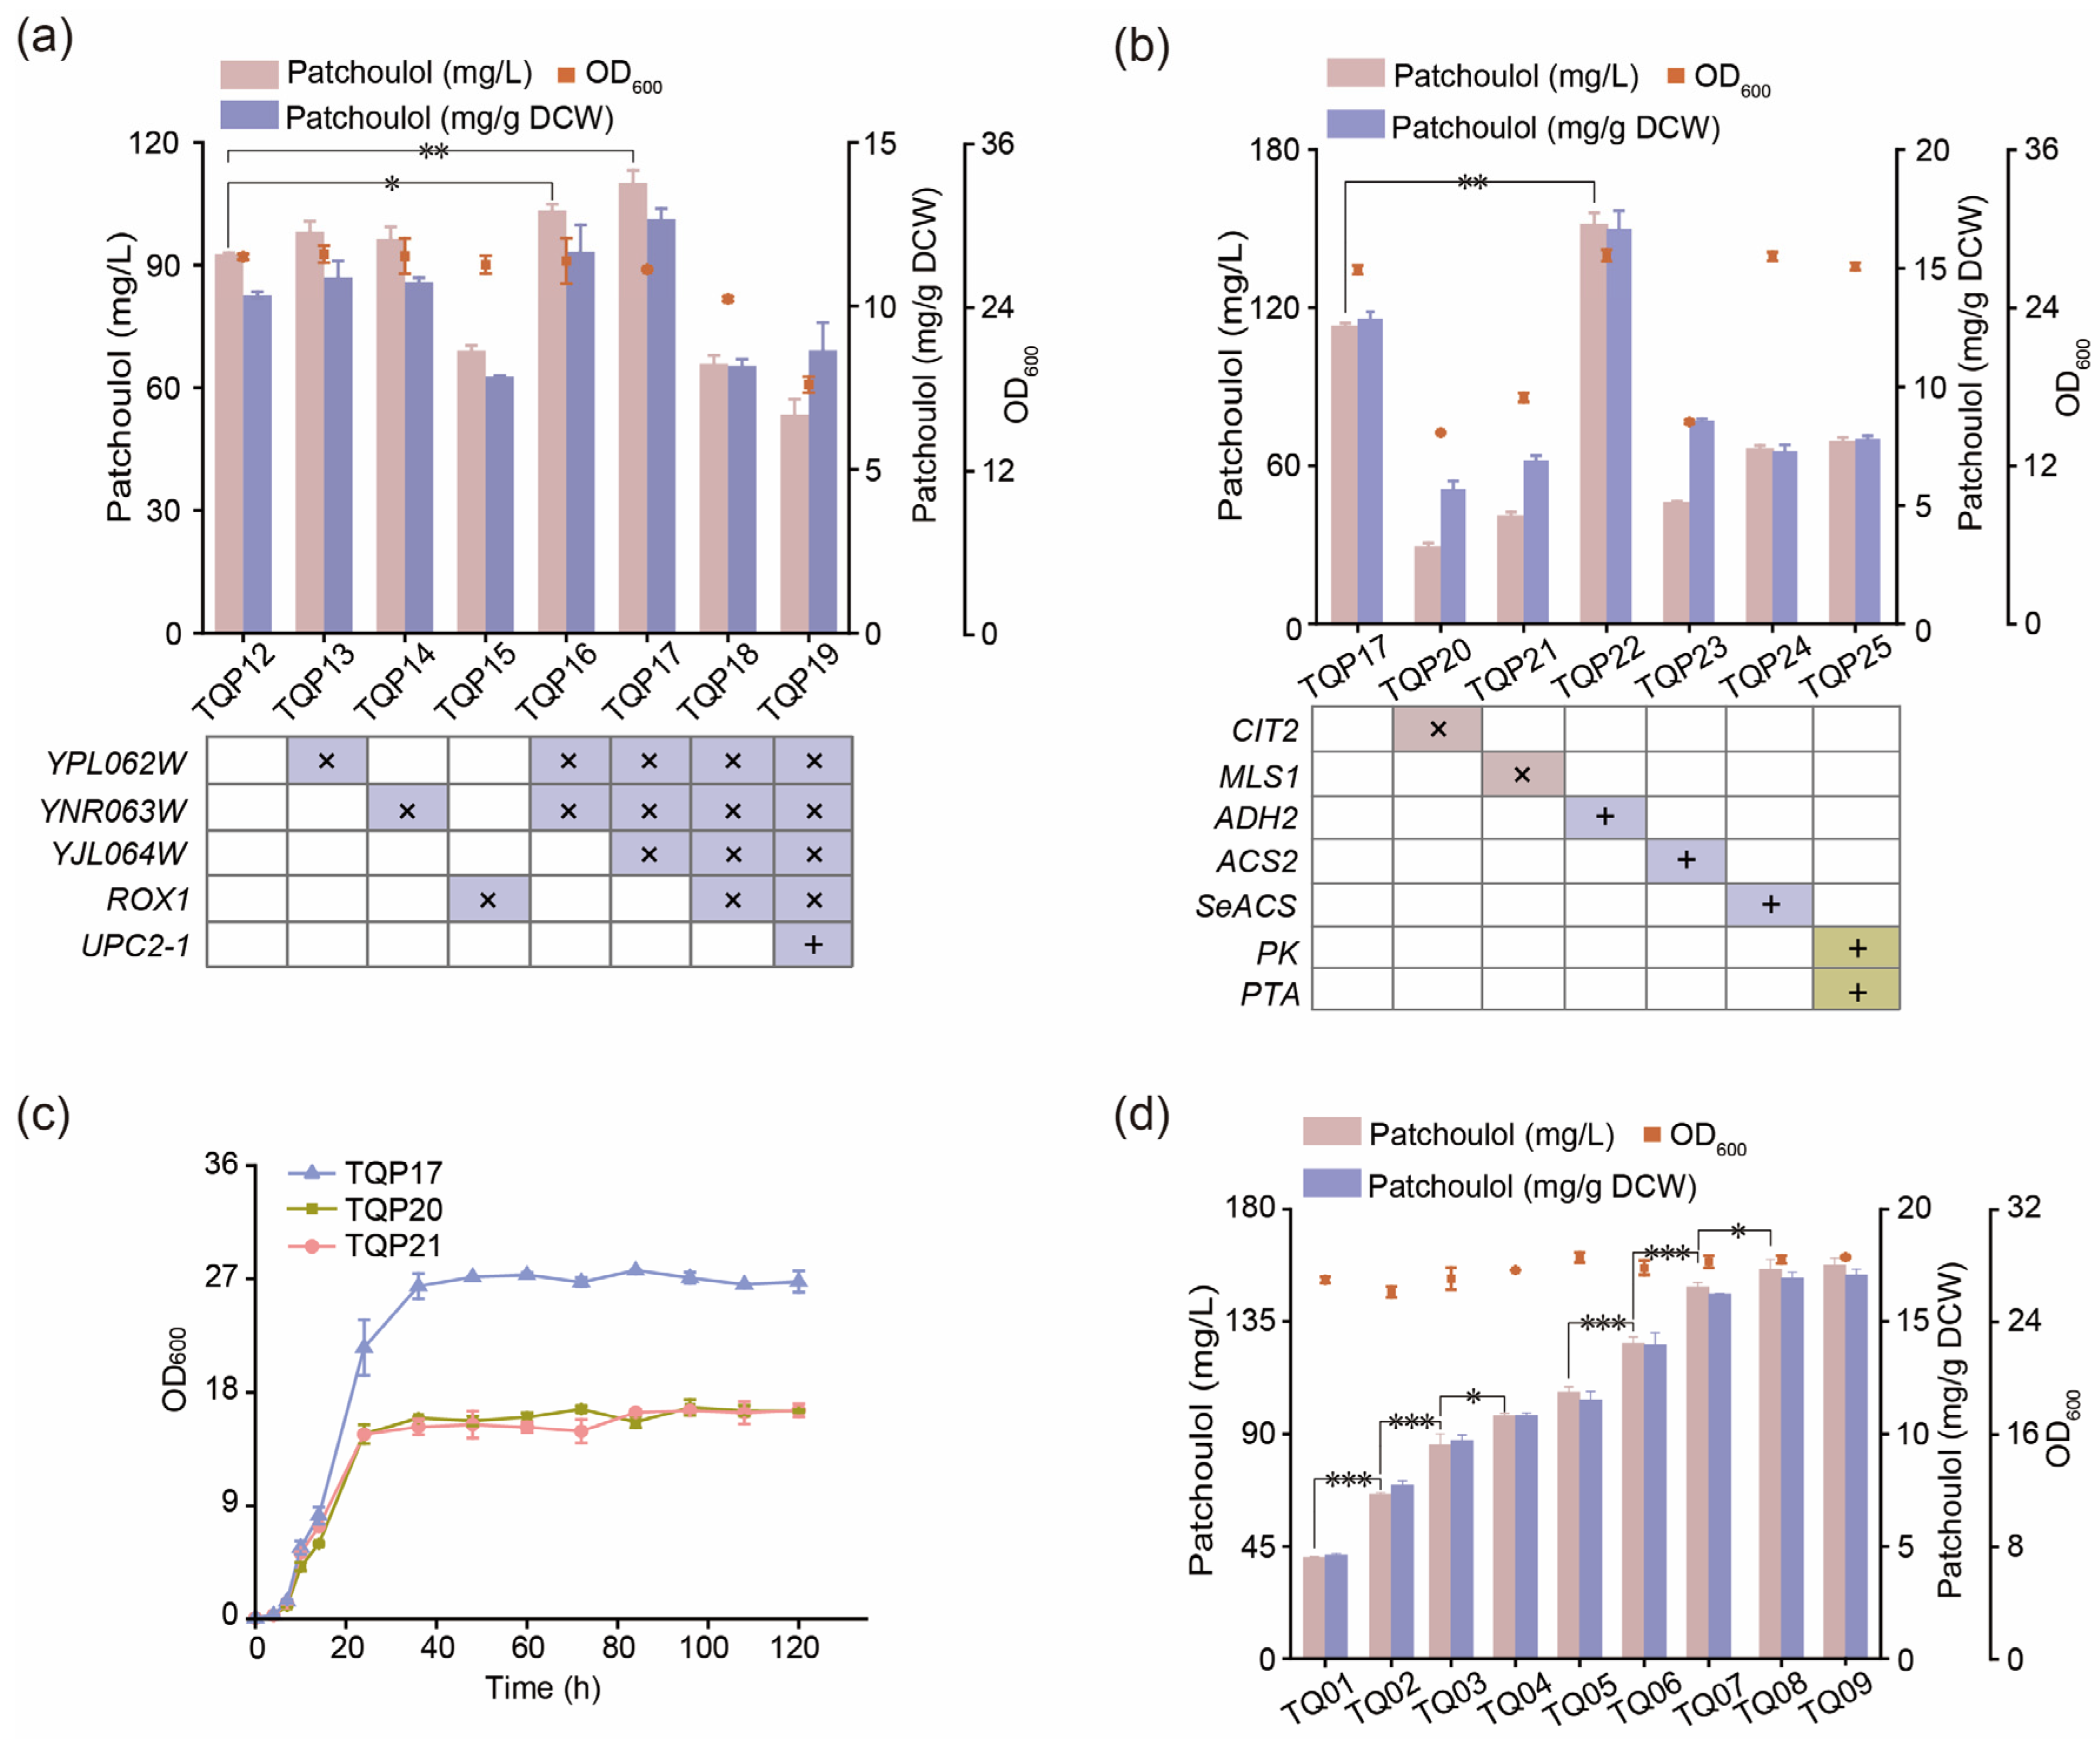
Modifying transcription regulatory factors in chassis cells has been shown to increase the yield of terpenoids in S. cerevisiae [28]. This study explored common transcriptional regulatory factors to increase the production of patchoulol. Knocking out ROX1, a transcriptional suppressor of hypoxic genes, was found to boost the transcription and translation of MVA pathway genes, thereby intensifying the mevalonate pathway [29]. Deficiency in YPL062W, YJL064W and YNR063W (transcription regulatory factors, their genetic functions and molecular mechanisms are currently unclear) yeast strains was observed to alter the carbon flow of acetyl-CoA, enhance glucose utilization, and improve energy metabolism [6,30,31]. The mutant gene UPC2-1, derived from UPC2, was found to enhance the absorption of exogenous sterols in cells under aerobic conditions and elevate the expression level of the sterol metabolic pathway [32]. In this study, YPL062W, YNR063W, YJL064W and ROX1 genes were individually or jointly knocked out in TQP12 strain, and the UPC2-1 gene was overexpressed, resulting in the creation of engineered strains TQP13, TQP14, TQP15, TQP16, TQP17, TQP18 and TQP19. The production of patchoulol in these strains was measured as 98.13 ± 2.57 mg/L, 96.42 ± 2.92 mg/L, 69.03 ± 1.31 mg/L, 103.34 ± 1.54 mg/L, 110.14 ± 3.05 mg/L, 65.83 ± 2.03 mg/L and 53.40 ± 3.77 mg/L, respectively (Figure 5a). The results indicated that knocking out YPL062W, YNR063W and YJL064W individually showed some increase in patchoulol accumulation, the combined deletion of these three genes significantly boosted patchoulol yield, suggesting a synergistic effect of these gene deletions on patchoulol accumulation.
Unexpectedly, the knockout of the ROX1 gene and overexpression of the UPC2-1 gene led to a decrease in patchoulol production. Jordá et al. [33] observed increased mRNA and protein levels of the ERG1 (squalene epoxygenase-encoding gene) gene after knocking down the ROX1 gene. We guessed that an enhancement in the metabolic pathway of epoxidized squalene may have competed with the patchoulol pathway for the precursor FPP, resulting in reduced patchoulol production. Leak et al. [34] noted that the UPC2-1 mutant strain displayed heightened sensitivity to metal cations and increased cell membrane permeability, which possibly makes a defective cytoplasmic membrane. Therefore, the decrease in patchoulol yield following the overexpression of the UPC2-1 gene could be attributed to cytoplasmic membrane defects in the recombinant strain, affecting yeast growth.

3.6. Regulating the Acetyl-CoA Pathway to Promote the Synthesis of Patchoulol

In yeast, the MVA pathway starts with acetyl-CoA as a precursor for synthesizing terpenoids, and insufficient acetyl-CoA supply can impact terpenoid biosynthesis in engineered S. cerevisiae [35]. Therefore, increasing the content of acetyl-CoA in S. cerevisiae could have a positive significance in patchoulol synthesis. This study primarily focused on three aspects: a. Reducing the consumption of cytoplasmic acetyl-CoA. The glyoxylate cycle in S. cerevisiae involves CIT2 and MLS1, which compete with the MVA pathway for acetyl-CoA [35]. To investigate this, the two genes were knocked out in the TQP17 strain to create TQP20 and TQP21, respectively. The results revealed a significant decrease in patchoulol production in strains TQP20 and TQP21 (Figure 5b), likely due to disruption of the glyoxylate cycle, impacting S. cerevisiae’s metabolic pathway and leading to growth arrest (Figure 5c). b. Strengthening the endogenous acetyl-CoA metabolic pathway in the cytoplasm of S. cerevisiae. During S. cerevisiae growth, a substantial amount of ethanol is produced, which can be converted to acetaldehyde by the ADH2 gene. However, the natural promoter of ADH2 is repressed in the presence of glucose [36]. In this study, a strong component promoter was utilized to overexpress the ADH2 and ACS2 genes of acetyl-CoA synthase in the TQP17 strain, resulting in the creation of TQP22 and TQP23 strains, respectively. Strain TQP22 exhibited a patchoulol yield of 151.27 ± 4.77 mg/L (16.66 ± 0.76 mg/g DCW), 1.34 times higher than that of TQP17, while the growth and yield of strain TQP23 decreased significantly (Figure 5b). According to the literature, the efficiency of the ACS variant SeACSL641P from Salmonella enterica was higher than that of endogenous ACS2 in S. cerevisiae [37]. SeACSL641P was overexpressed on strain TQP17, but the production of patchoulol still decreased. This outcome may be attributed to the regulation of acetyl-CoA synthase by S. cerevisiae and the enzyme’s activity. Increased expression of acetyl-CoA synthetase may lead to the excessive accumulation of toxic precursor acetyl-CoA in the strain, disrupting acetyl-CoA balance and impacting strain growth. c. Constructing a heterologous acetyl-CoA synthesis pathway. Under the catalysis of phosphotransferase (PK) and phosphotransferase (PTA), xylose 5-phosphate can be converted to acetyl-CoA without releasing carbon dioxide [38]. In this research, PK from Bifidobacterium longum and PTA from Clostridium kluyveri were co-expressed in S. cerevisiae. Consequently, the production of patchoulol decreased significantly. This outcome may be attributed to the fact that this pathway does not yield ATP and NADPH, suggesting that coupling with another pathway capable of producing NADPH may be necessary to enhance acetyl-CoA levels.
Considering the lack of genetic stability of strains overexpressing PTS using multicopy plasmids during long-term passage, the pESC-PTS plasmid was eliminated from the TQP22 strain using SD/- Trp+5-FOA solid culture medium to generate strain Q22. PTS was then gradually integrated into the chromosome of strain Q22, resulting in strains TQ01-TQ09. As shown in Figure 5d, the yield of patchoulol increased with the number of PTS copies integrated. When eight copies of PTS were integrated, the yield reached 155.94 ± 3.76 mg/L, similar to the plasmid-expressing strain. Further increases in PTS copies did not lead to higher yields. Therefore, strain TQ08 was selected for the next experiment.

3.7. Optimize the Fermentation Process to Improve the Production of Patchoulol

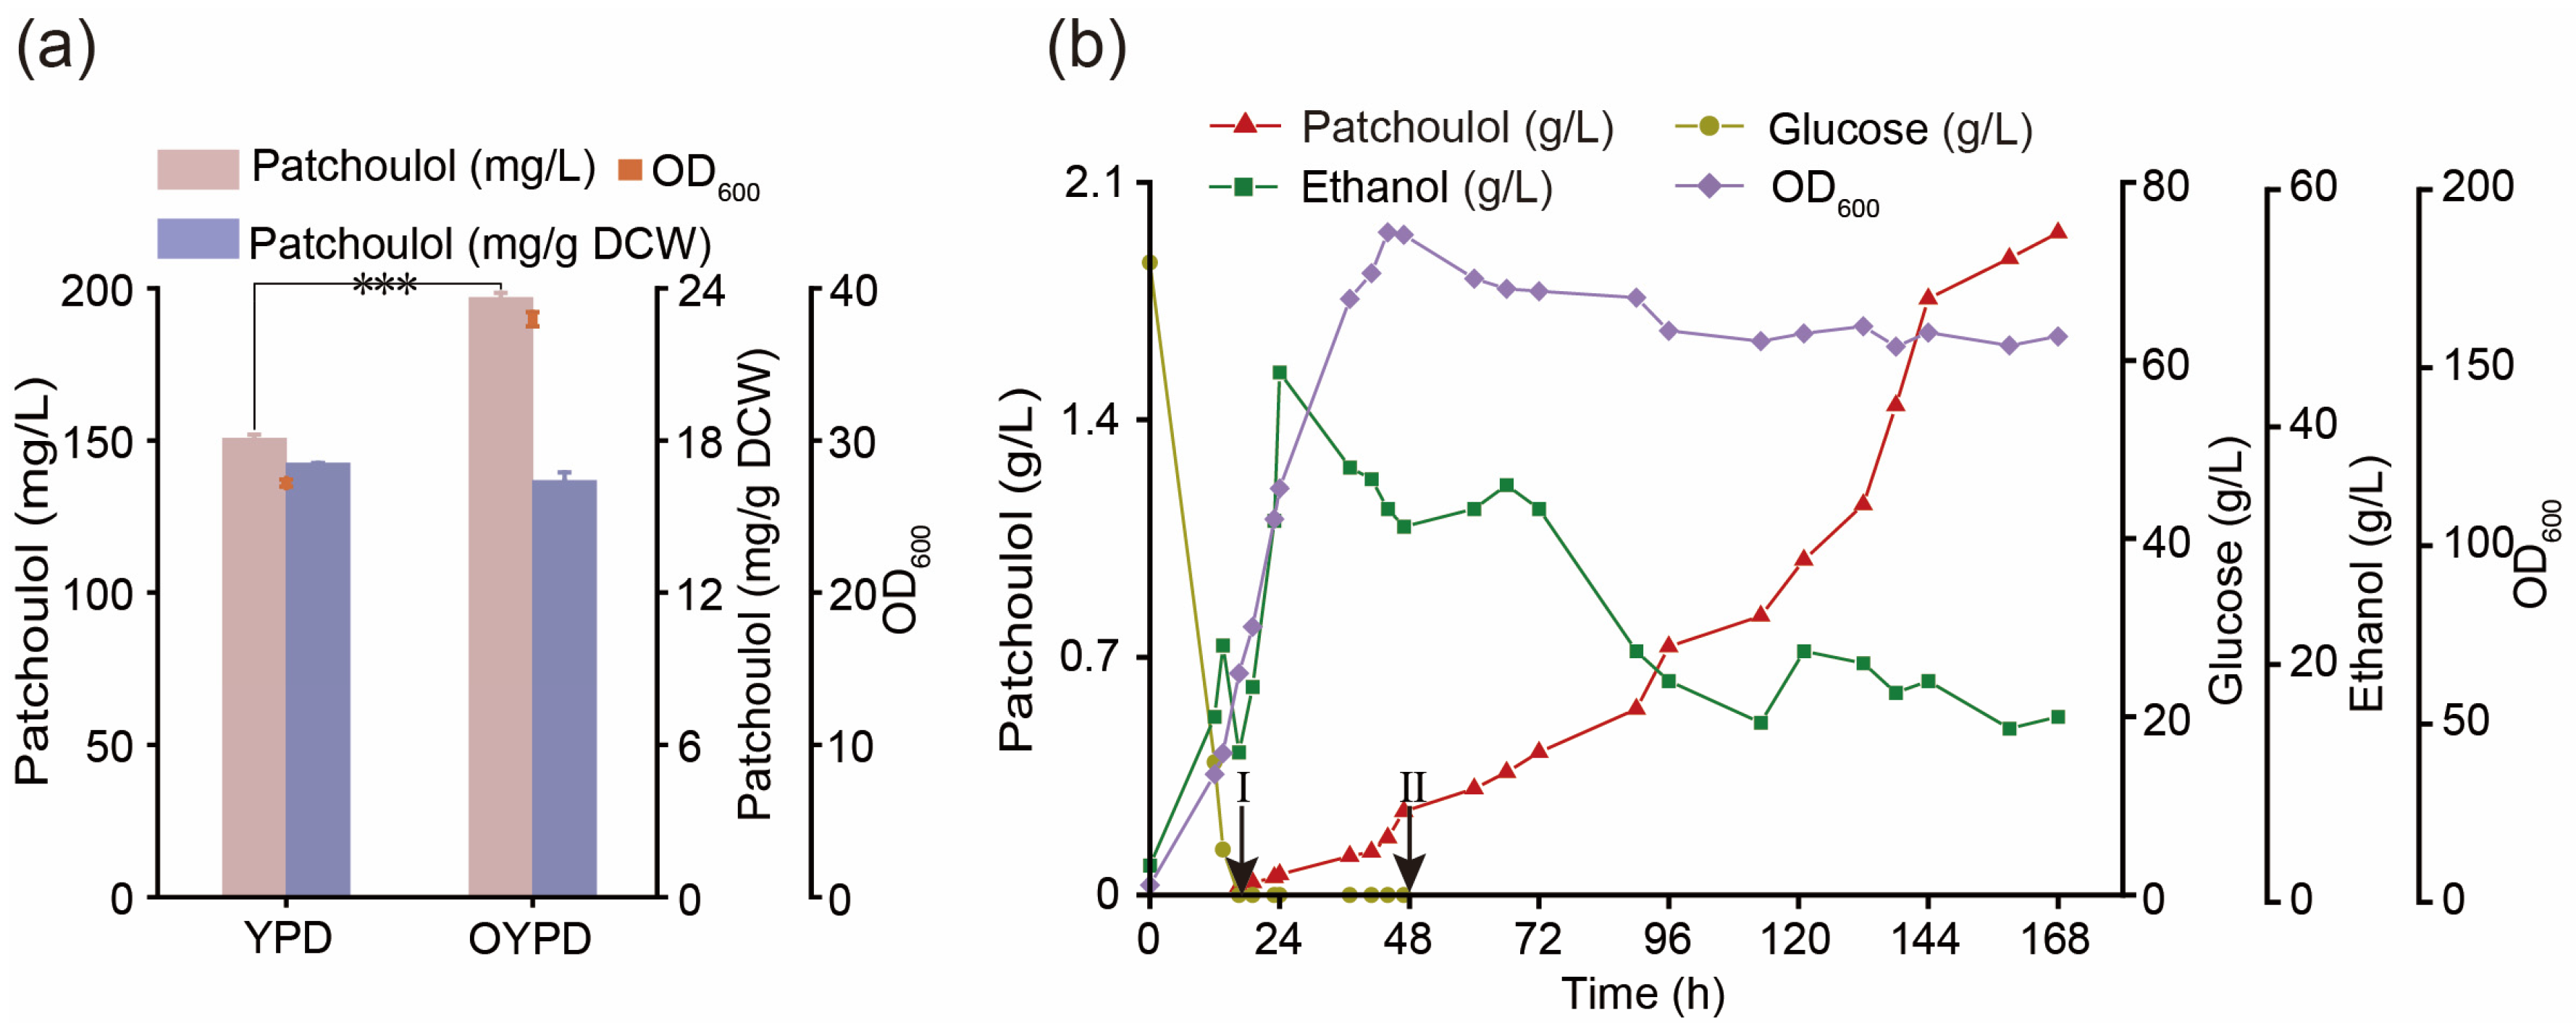
The growth of S. cerevisiae requires appropriate culture conditions. In order to optimize the synthesis of patchoulol from recombinant S. cerevisiae strain TQ08, the culture medium was adjusted based on YPD. The optimized culture conditions included 30 g/L glucose, 30 g/L yeast extract, 20 g/L tryptone, 1.232 g/L MgSO4∙7H20, 4.8 g/L KH2PO4, 10 mL/L metal ion solution A and 24 mL/L vitamin solutions B. Fermentation of strain TQ08 in shaking flasks using the optimized medium (OYPD) resulted in a yield of 195.96 ± 1.61 mg/L (16.33 ± 0.32 mg/g DCW), which was 30.74% higher than YPD.
To enhance patchoulol yields, strain TQ08 was fermented in a 5-L bioreactor. Given that strain TQ08 is a trophic mutant strain, the medium was supplemented with 1.0 g/L leucine, 1.0 g/L histidine and 1.0 g/L uracil to promote optimal growth of the strain.
The study utilized a two-stage fed-batch fermentation process with optimized conditions using 10% dodecane for the extraction of patchoulol (Figure 6b). In the first stage, the engineered strain consumed nutrients in the culture medium for 18 h until glucose depletion, followed by the addition of feed medium I to promote rapid cell growth. Glucose concentration was carefully controlled below 1.0 g/L by adjusting the flow rate of feed medium I. Ethanol is commonly used as a carbon source in terpenoid-producing S. cerevisiae during fed-batch fermentation and greatly increases terpenoid yields compared to glucose [23,39]. In the second stage, after 48 h, strain TQ08 biomass remained stable with an OD600 of 185.31 and ethanol content of 31.0 g/L. Subsequently, feed medium I was replaced with feed medium II to supplement the carbon source, with the ethanol flow rate adjusted to maintain a concentration of about 20 g/L. As shown in Figure 6b, the patchoulol yield gradually increased throughout the fermentation process. In the first stage, the cell concentration of the strain increased sharply, but the patchoulol yield increased slowly, reaching only 246.42 mg/L at 48 h. In the second stage, the strain stopped growing and the flow-added carbon source was shifted from glucose to ethanol to promote the synthesis of patchoulol, which was observed to increase significantly, reaching 1.95 g/L at 168 h.

4. Conclusions

In this study, a strain of S. cerevisiae was engineered to produce high levels of patchoulol using a combinational metabolic engineering strategy. By optimizing the patchoulol metabolic network, including screening the best promoter for PTS, strengthening the mevalonate pathway, balancing competing metabolic pathways, modifying transcriptional regulators and regulating the acetyl-CoA pathway, the patchoulol yield of S. cerevisiae was significantly increased. Further optimization of fermentation medium and fed-batch fermentation techniques ultimately resulted in a patchoulol yield of 195.96 mg/L in shake flasks and 1.95 g/L in a 5-L bioreactor. Among the strategies employed, overexpression of the tHMG1 gene, a key enzyme gene in the MVA synthesis pathway, along with downregulation of the ERG9 gene through the ERG1 promoter, and overexpression of the ADH2 gene using a strong promoter were key factors contributing to the increase in patchoulol yield, and these strategies provided more precursors for the synthesis of patchoulol, which resulted in a significant increase in the patchoulol yield. This study shows that an insufficient supply of precursors is one of the main factors limiting the synthesis of patchoulol in our background strain. Strengthening the precursor supply positively impacts patchoulol synthesis, crucial for S. cerevisiae. This study also holds relevance for other sesquiterpenoids.

Supplementary Materials

The following supporting information can be downloaded at: https://www.mdpi.com/article/10.3390/fermentation10040211/s1, Figure S1: The relationship between cell dry weight and OD600, y is the cell concentration, unit g DCW/L, x is OD600; Figure S2: Schematic diagram of strain construction. “Δ” indicates knocking out; “ΔA:: B” indicates overexpression of B gene at site A; Table S1: Primers Used in This Study; Table S2: Exogenous gene sequences used in this study.

Author Contributions

Conceptualization, Q.T. and Z.P.; Methodology, Q.T. and Z.P.; Validation, Q.T. and Z.P.; Writing—original draft, Q.T. and Z.P.; Writing—review & editing, Q.T., J.Z. and Z.P.; Supervision, G.D., J.C., J.Z. and Z.P. All authors have read and agreed to the published version of the manuscript.

Funding

This research received no external funding.

Data Availability Statement

Data are contained within the article and Supplementary Materials.

Conflicts of Interest

The authors declare no conflict of interest.

References

  1. Chen, Y.; Wu, Y.G.; Xu, Y.; Zhang, J.F.; Song, X.Q.; Zhu, G.P.; Hu, X.W. Dynamic accumulation of sesquiterpenes in essential oil of Pogostemon cablin. Rev. Bras. Farmacogn. 2014, 24, 626–634. [Google Scholar] [CrossRef]
  2. Aguilar, F.; Ekramzadeh, K.; Scheper, T.; Beutel, S. Whole-cell production of patchouli oil sesquiterpenes in Escherichia coli: Metabolic engineering and fermentation optimization in solid-liquid phase partitioning cultivation. Acs Omega 2020, 5, 32436–32446. [Google Scholar] [CrossRef] [PubMed]
  3. Lee, H.S.; Lee, J.; Smolensky, D.; Lee, S.H. Potential benefits of patchouli alcohol in prevention of human diseases: A mechanistic review. Int. Immunopharmacol. 2020, 89, 107056. [Google Scholar] [CrossRef]
  4. Swamy, M.K.; Sinniah, U.R. Patchouli (Pogostemon cablin Benth.): Botany, agrotechnology and biotechnological aspects. Ind. Crops Prod. 2016, 87, 161–176. [Google Scholar] [CrossRef]
  5. Mitsui, R.; Nishikawa, R.; Yamada, R.; Matsumoto, T.; Ogino, H. Construction of yeast producing patchoulol by global metabolic engineering strategy. Biotechnol. Bioeng. 2020, 117, 1348–1356. [Google Scholar] [CrossRef] [PubMed]
  6. Liu, M.; Lin, Y.C.; Guo, J.J.; Du, M.M.; Tao, X.; Gao, B.; Zhao, M.; Ma, Y.; Wang, F.Q.; Wei, D.Z. High-level production of sesquiterpene patchoulol in Saccharomyces cerevisiae. ACS Synth. Biol. 2021, 10, 158–172. [Google Scholar] [CrossRef] [PubMed]
  7. Wang, X.; Xu, X.H.; Liu, J.H.; Liu, Y.F.; Li, J.H.; Du, G.C.; Lv, X.Q.; Liu, L. Metabolic engineering of Saccharomyces cerevisiae for efficient retinol synthesis. J. Fungi 2023, 9, 512. [Google Scholar] [CrossRef] [PubMed]
  8. Asadollahi, M.A.; Maury, J.; Moller, K.; Nielsen, K.F.; Schalk, M.; Clark, A.; Nielsen, J. Production of plant sesquiterpenes in Saccharomyces cerevisiae: Effect of ERG9 repression on sesquiterpene biosynthesis. Biotechnol. Bioeng. 2008, 99, 666–677. [Google Scholar] [CrossRef] [PubMed]
  9. Ma, B.; Liu, M.; Li, Z.H.; Tao, X.; Wei, D.Z.; Wang, F.Q. Significantly enhanced production of patchoulol in metabolically engineered Saccharomyces cerevisiae. J. Agric. Food Chem. 2019, 67, 8590–8598. [Google Scholar] [CrossRef]
  10. Zhao, Y.J.; Zhang, Y.P.; Nielsen, J.; Liu, Z.H. Production of β-carotene in Saccharomyces cerevisiae through altering yeast lipid metabolism. Biotechnol. Bioeng. 2021, 118, 2043–2052. [Google Scholar] [CrossRef]
  11. Luo, G.J.; Lin, Y.; Chen, S.T.; Xiao, R.M.; Zhang, J.X.; Li, C.; Sinskey, A.J.; Ye, L.; Liang, S.L. Overproduction of patchoulol in metabolically engineered Komagataella phaffii. J. Agric. Food Chem. 2023, 71, 2049–2058. [Google Scholar] [CrossRef] [PubMed]
  12. Zhou, L.; Wang, Y.; Han, L.; Wang, Q.; Liu, H.; Cheng, P.; Li, R.; Guo, X.; Zhou, Z. Enhancement of patchoulol production in Escherichia coli via multiple engineering strategies. J. Agric. Food Chem. 2021, 69, 7572–7580. [Google Scholar] [CrossRef] [PubMed]
  13. Zhang, Y.; Wang, W.; Wei, W.; Xia, L.; Gao, S.; Zeng, W.; Liu, S.; Zhou, J. Regulation of ethanol assimilation for efficient accumulation of squalene in Saccharomyces cerevisiae. J. Agric. Food Chem. 2023, 71, 6389–6397. [Google Scholar] [CrossRef]
  14. Xia, L.; Lv, Y.B.; Liu, S.; Yu, S.Q.; Zeng, W.Z.; Zhou, J.W. Enhancing squalene production in Saccharomyces cerevisiae by metabolic engineering and random mutagenesis. Front. Chem. Sci. Eng. 2022, 3, 790261. [Google Scholar] [CrossRef]
  15. Rasool, A.; Ahmed, M.S.; Li, C. Overproduction of squalene synergistically downregulates ethanol production in Saccharomyces cerevisiae. Chem. Eng. Sci. 2016, 152, 370–380. [Google Scholar] [CrossRef]
  16. Li, T.; Liu, G.-S.; Zhou, W.; Jiang, M.; Ren, Y.-H.; Tao, X.-Y.; Liu, M.; Zhao, M.; Wang, F.-Q.; Gao, B.; et al. Metabolic engineering of Saccharomyces cerevisiae to overproduce squalene. J. Agric. Food Chem. 2020, 68, 2132–2138. [Google Scholar] [CrossRef]
  17. Xiong, L.; Zeng, Y.; Tang, R.Q.; Alper, H.S.; Bai, F.W.; Zhao, X.Q. Condition-specific promoter activities in Saccharomyces cerevisiae. Microb. Cell Factories 2018, 17, 58. [Google Scholar] [CrossRef]
  18. Tang, H.T.; Wu, Y.L.; Deng, J.L.; Chen, N.Z.; Zheng, Z.H.; Wei, Y.J.; Luo, X.Z.; Keasling, J.D. Promoter architecture and promoter engineering in Saccharomyces cerevisiae. Metabolites 2020, 10, 320. [Google Scholar] [CrossRef] [PubMed]
  19. Park, K.S.; Kim, J.S. Engineering of GAL1 promoter-driven expression system with artificial transcription factors. Biochem. Biophys. Res. Commun. 2006, 351, 412–417. [Google Scholar] [CrossRef]
  20. Wang, F.; Lv, X.M.; Xei, W.P.; Zhou, P.P.; Zhu, Y.Q.; Yao, Z.; Yang, C.C.; Yang, X.H.; Ye, L.D.; Yu, H.W. Combining Gal4p-mediated expression enhancement and directed evolution of isoprene synthase to improve isoprene production in Saccharomyces cerevisiae. Metab. Eng. 2017, 39, 257–266. [Google Scholar] [CrossRef]
  21. Promdonkoy, P.; Sornlek, W.; Preechakul, T.; Tanapongpipat, S.; Runguphan, W. Metabolic engineering of Saccharomyces cerevisiae for production of fragrant terpenoids from agarwood and sandalwood. Fermentation 2022, 8, 429. [Google Scholar] [CrossRef]
  22. Zha, W.L.; An, T.Y.; Li, T.; Zhu, J.X.; Gao, K.; Sun, Z.J.; Xu, W.D.; Lin, P.C.; Zi, J.C. Reconstruction of the biosynthetic pathway of santalols under control of the GAL regulatory system in yeast. ACS Synth. Biol. 2020, 9, 449–456. [Google Scholar] [CrossRef] [PubMed]
  23. Westfall, P.J.; Pitera, D.J.; Lenihan, J.R.; Eng, D.; Woolard, F.X.; Regentin, R.; Horning, T.; Tsuruta, H.; Melis, D.J.; Owens, A.; et al. Production of amorphadiene in yeast, and its conversion to dihydroartemisinic acid, precursor to the antimalarial agent artemisinin. Proc. Natl. Acad. Sci. USA 2012, 109, 111–118. [Google Scholar] [CrossRef] [PubMed]
  24. Xie, W.P.; Ye, L.D.; Lv, X.M.; Xu, H.M.; Yu, H.W. Sequential control of biosynthetic pathways for balanced utilization of metabolic intermediates in Saccharomyces cerevisiae. Metab. Eng. 2015, 28, 8–18. [Google Scholar] [CrossRef] [PubMed]
  25. Faulkner, A.; Chen, X.M.; Rush, J.; Horazdovsky, B.; Waechter, C.J.; Carman, G.M.; Sternweis, P.C. The LPP1 and DPP1 gene products account for most of the isoprenoid phosphate phosphatase activities in Saccharomyces cerevisiae. J. Biol. Chem. 1999, 274, 14831–14837. [Google Scholar] [CrossRef] [PubMed]
  26. Wang, J.; Jiang, W.; Liang, C.; Zhu, L.; Li, Y.; Mo, Q.; Xu, S.; Chu, A.; Zhang, L.; Ding, Z.; et al. Overproduction of α-farnesene in Saccharomyces cerevisiae by farnesene synthase screening and metabolic engineering. J. Agric. Food Chem. 2021, 69, 3103–3113. [Google Scholar] [CrossRef] [PubMed]
  27. Scalcinati, G.; Knuf, C.; Partow, S.; Chen, Y.; Maury, J.; Schalk, M.; Daviet, L.; Nielsen, J.; Siewers, V. Dynamic control of gene expression in Saccharomyces cerevisiae engineered for the production of plant sesquitepene α-santalene in a fed-batch mode. Metab. Eng. 2012, 14, 91–103. [Google Scholar] [CrossRef]
  28. Özaydin, B.; Burd, H.; Lee, T.S.; Keasling, J.D. Carotenoid-based phenotypic screen of the yeast deletion collection reveals new genes with roles in isoprenoid production. Metab. Eng. 2013, 15, 174–183. [Google Scholar] [CrossRef]
  29. Trikka, F.A.; Nikolaidis, A.; Athanasakoglou, A.; Andreadelli, A.; Ignea, C.; Kotta, K.; Argiriou, A.; Kampranis, S.C.; Makris, A.M. Iterative carotenogenic screens identify combinations of yeast gene deletions that enhance sclareol production. Microb. Cell Factories 2015, 14, 60. [Google Scholar] [CrossRef]
  30. Cao, X.; Yu, W.; Chen, Y.; Yang, S.; Zhao, Z.K.; Nielsen, J.; Luan, H.; Zhou, Y.J. Engineering yeast for high-level production of diterpenoid sclareol. Metab. Eng. 2022, 75, 19–28. [Google Scholar] [CrossRef]
  31. Chen, Y.; Wang, Y.; Liu, M.; Qu, J.Z.; Yao, M.D.; Li, B.; Ding, M.Z.; Liu, H.; Xiao, W.H.; Yuan, Y.J. Primary and secondary metabolic effects of a key gene deletion (delta YPL062W) in metabolically engineered terpenoid-producing Saccharomyces cerevisiae. Appl. Environ. Microb. 2019, 85, e01990-18. [Google Scholar] [CrossRef] [PubMed]
  32. Scalcinati, G.; Partow, S.; Siewers, V.; Schalk, M.; Daviet, L.; Nielsen, J. Combined metabolic engineering of precursor and co-factor supply to increase α-santalene production by Saccharomyces cerevisiae. Microb. Cell Factories 2012, 11, 117. [Google Scholar] [CrossRef] [PubMed]
  33. Jordá, T.; Martínez-Martín, A.; Martínez-Pastor, M.T.; Puig, S. Modulation of yeast Erg1 expression and terbinafine susceptibility by iron bioavailability. Microb. Biotechnol. 2022, 15, 2705–2716. [Google Scholar] [CrossRef] [PubMed]
  34. Leak, F.W.; Tove, S.; Parks, L.W. In yeast, upc2-1 confers a decrease in tolerance to LiCl and NaCl, which can be suppressed by the P-type ATPase encoded by ENA2. DNA Cell Biol. 1999, 18, 133–139. [Google Scholar] [CrossRef] [PubMed]
  35. Chen, Y.; Daviet, L.; Schalk, M.; Siewers, V.; Nielsen, J. Establishing a platform cell factory through engineering of yeast acetyl-CoA metabolism. Metab. Eng. 2013, 15, 48–54. [Google Scholar] [CrossRef] [PubMed]
  36. Lee, K.M.; DaSilva, N.A. Evaluation of the Saccharomyces cerevisiae ADH2 promoter for protein synthesis. Yeast 2005, 22, 431–440. [Google Scholar]
  37. Zhang, X.; Liu, X.; Meng, Y.; Zhang, L.; Qiao, J.; Zhao, G.-R. Combinatorial engineering of Saccharomyces cerevisiae for improving limonene production. Biochem. Eng. J. 2021, 176, 108155. [Google Scholar] [CrossRef]
  38. Qin, N.; Li, L.Y.; Ji, X.; Li, X.W.; Zhang, Y.M.; Larsson, C.; Chen, Y.; Nielsen, J.; Liu, Z.H. Rewiring central carbon metabolism ensures increased provision of acetyl-CoA and NADPH required for 3-OH-propionic acid production. ACS Synth. Biol. 2020, 9, 3236–3244. [Google Scholar] [CrossRef]
  39. Zhao, F.L.; Du, Y.H.; Bai, P.; Liu, J.J.; Lu, W.Y.; Yuan, Y.J. Enhancing Saccharomyces cerevisiae reactive oxygen species and ethanol stress tolerance for high-level production of protopanoxadiol. Bioresour. Technol. 2017, 227, 308–316. [Google Scholar] [CrossRef]
Figure 1. Schematic diagram of combining metabolic engineering to increase the production of patchoulol in S. cerevisiae. The red fonts indicate enhanced genes; the green fonts indicate the introduced foreign gene; the blue fonts indicate the knocked-out gene; and the yellow fonts indicate the weakened gene. Dashed arrows indicate multi-step reactions. ADH2, alcohol dehydrogenase; ACS2, acetyl-CoA synthetase; ERG10, acetoacetyl-CoA thiolase; ERG13, hydroxymethylglutaryl-CoA synthase; tHMG1, catalytic domain of hydroxymethylglutaryl-CoA reductase; ERG12, mevalonate kinase; ERG8, phosphomevalonate kinase; ERG19, mevalonate pyrophosphate decarboxylase; IDI1, isopentenyl diphosphate isomerase; ERG20, farnesyl pyrophosphate synthase; PK, phosphotransferase; PTA, phosphotransacetylase; SeACS, acetyl-CoA synthetase from Salmonella enterica; PTS, patchoulol synthase; CIT2, citrate synthase; MLS1, malate synthase; DPP1, diacylglycerol Pyrophosphate Phosphatase; LPP1, lipid phosphate phosphatase; and ERG9, squalene synthase.
Fermentation 10 00211 g001
Figure 2. Construct the synthetic pathway of patchoulol in S. cerevisiae. (a) Schematic diagram of the gene expression box of patchoulol synthase; (b) GC-MS chromatograms of the standard of patchoulol and the engineered strain products. The peak time of patchoulol produced by strain Q01 was consistent with that of patchoulol standard; (c) Production of patchoulol from P414 and Q01 strains; (d) The growth and yield of PTS expressed by different promoters in shaker; (e) Knocking out GAL80 removes the dependence of the inducible promoter on galactose. Red “X” indicates knockout; (f) The growth and yield of strains after knocking out GAL80; (g) The changes of yield after introduction of high copy plasmid pESC-PTS. Data presented as mean values ± SD from three independent biological replicates (n = 3). Statistical evaluation (p-value) compared to the control was conducted by a two-tailed t-test. ** p < 0.01, *** p < 0.001(p ≥ 0.05).
Fermentation 10 00211 g002
Figure 3. Strengthen the MVA pathway in S. cerevisiae. (a) Effects of overexpression of mevalonate pathway genes on the yield and cell growth of patchoulol; (b) Effects of overexpression of mevalonate pathway genes on squalene in S. cerevisiae; (c) Construction of gene expression frame of the mevalonate pathway. Data presented as mean values ± SD from three independent biological replicates (n = 3). Statistical evaluation (p-value) compared to the control was conducted by a two-tailed t-test. * p < 0.05, ** p < 0.01, *** p < 0.001 (p ≥ 0.05).
Fermentation 10 00211 g003
Figure 4. Reducing the consumption of precursor FPP by balancing the competitive pathway of patchoulol. (a) Effects of knockout of farnesol pathway genes DPP1 and LPP1 on production and growth; (b) The effect of knockout of farnesol pathway genes DPP1 and LPP1 on squalene; (c) Using CRISPR/Cas9 gene editing technology to replace the promoter of squalene synthase; (d) The effect of weakening squalene pathway on squalene in S. cerevisiae; and (e) Effects of weakening squalene pathway on the yield and cell growth of patchoulol. Data presented as mean values ± SD from three independent biological replicates (n = 3). Statistical evaluation (p-value) compared to the control was conducted by a two-tailed t-test. * p < 0.05, ** p < 0.01, *** p < 0.001 (p ≥ 0.05).
Fermentation 10 00211 g004
Figure 5. Effects of modified transcriptional regulators and regulation of acetyl CoA on cell growth and patchoulol production. (a) The effect of modified transcriptional regulators on yield and growth; (b) The influence of regulating the acetyl-CoA pathway on yield and growth; (c) The absence of acetyl-CoA competitive pathway genes CIT2 and MLS1 led to growth arrest in S. cerevisiae; and (d) Effects of PTS multi-copy integration on the production of patchoulol. Data presented as mean values ± SD from three independent biological replicates (n = 3). Statistical evaluation (p-value) compared to the control was conducted by a two-tailed t-test. * p < 0.05, ** p < 0.01, *** p < 0.001 (p ≥ 0.05).
Fermentation 10 00211 g005
Figure 6. Optimizing fermentation conditions to improve the production of patchoulol. (a) Effects of YPD and OYPD media on the yield and growth of strain TQ08; (b) Overproduction of patchoulol by TQ08 strain in batch feed fermentation. Data presented as mean values ± SD from three independent biological replicates (n = 3). Statistical evaluation (p-value) compared to the control was conducted by a two-tailed t-test. *** p < 0.001 (p ≥ 0.05).
Fermentation 10 00211 g006
Table 1. Plasmids used in this study.
NamesDescriptionReference
pESC-URA2 μ, URA3, AmpThis Lab
p414-TEF1p-Cas9-CYC1tCas9 expression vectorThis Lab
p426-SNR52p-gRNA.CAN1.Y-SUP4tgRNA expression vectorThis Lab
YEplac1812 μ, LEU2This Lab
YEplac181-PTSPTEF1-PTS-TADH1 cassette in YEplac181GENEWIZ
pESC-PTSPGAL1-PTS-TCYC1 cassette in pESC-URAThis work
p426-YMRWΔ15gRNA expressing vector carrying YMRWΔ15 crRNA sequenceThis work
p426-GAL80gRNA expressing vector carrying GAL80 crRNA sequenceThis work
p426-HOgRNA expressing vector carrying HO crRNA sequenceThis work
p426-PDC6gRNA expressing vector carrying PDC6 crRNA sequenceThis work
p426-YORWΔ17gRNA expressing vector carrying YORWΔ17 crRNA sequenceThis work
p426-YPRCτ3gRNA expressing vector carrying YPRCτ3 crRNA sequenceThis work
p426-YNRCΔ9gRNA expressing vector carrying YNRCΔ9 crRNA sequenceThis work
p426-YERCΔ8gRNA expressing vector carrying YERCΔ8 crRNA sequenceThis work
p426-DPP1gRNA expressing vector carrying DPP1 crRNA sequenceThis work
p426-LPP1gRNA expressing vector carrying LPP1 crRNA sequenceThis work
p426-YPL062WgRNA expressing vector carrying YPL062W crRNA sequenceThis work
p426-YNR063WgRNA expressing vector carrying YNR063W crRNA sequenceThis work
p426-ROX1gRNA expressing vector carrying ROX1 crRNA sequenceThis work
p426 -YJL064WgRNA expressing vector carrying YJL064W crRNA sequenceThis work
p426-CIT2gRNA expressing vector carrying CIT2 crRNA sequenceThis work
p426-MLS1gRNA expressing vector carrying MLS1 crRNA sequenceThis work
p426-XI-3gRNA expressing vector carrying XI-3 crRNA sequenceThis work
p426-YORWΔ22gRNA expressing vector carrying YORWΔ22 crRNA sequenceThis work
p426-YPRCΔ15gRNA expressing vector carrying YPRCΔ15 crRNA sequenceThis work
p426-NDT80gRNA expressing vector carrying NDT80 crRNA sequenceThis work
p426-X-2gRNA expressing vector carrying X-2 crRNA sequenceThis work
p426-YHRCΔ14gRNA expressing vector carrying YHRCΔ14 crRNA sequenceThis work
p426-XI-2gRNA expressing vector carrying XI-2 crRNA sequenceThis work
p426-X-4gRNA expressing vector carrying X-4 crRNA sequenceThis work
p426-XI-1gRNA expressing vector carrying XI-1 crRNA sequenceThis work
p426-YARCΔ8gRNA expressing vector carrying YARCΔ8 crRNA sequenceThis work
Table 2. Strains used in this study.
NamesDescriptionReference
S. cerevisiae CEN.PK2-1CMata; his3Δ1; leu2-3-112; ura3-52; trp1-289; MAL2-8c; SUC2This Lab
P414CEN.PK2-1C, contains p414-TEF1p-Cas9-CYC1t plasmidThis work
Q01CEN.PK2-1C, YMRWΔ15:: PTEF1-PTS-TADH1This work
Q02CEN.PK2-1C, YMRWΔ15:: PGAL1-PTS-TADH1This work
Q03CEN.PK2-1C, YMRWΔ15:: PGAL7-PTS-TADH1This work
Q04CEN.PK2-1C, YMRWΔ15:: PCCW12-PTS-TADH1This work
Q05CEN.PK2-1C, YMRWΔ15:: PPGK1-PTS-TADH1This work
Q06CEN.PK2-1C, YMRWΔ15:: PTDH3-PTS-TADH1This work
Q07Q02, ΔGAL80This work
TQP01Q07, pESC-PTSThis work
TQP02TQP01, ΔHO:: PGAL7–tHMG1-TCYC1This work
TQP03TQP02, ΔPDC6:: TGPM1-ERG20-PPGK1-PTEF1-IDI1-TACT1This work
TQP04TQP03, YORWΔ17:: PGPD1-ERG19-TPGK1-PCCW12-ERG10-TADH1-PTEF1-ERG8-TCYC1This work
TQP05TQP04, ΔYPRCτ3:: PTDH3-ERG12-TPGK1-PCCW12-ERG13-TADH1This work
TQP06TQP05, YNRCΔ9:: PTDH3–tHMG1-TCYC1This work
TQP07TQP06, YERCΔ8:: PGAL1–tHMG1-TCYC1This work
TQP08TQP07, ΔDPP1This work
TQP09TQP07, ΔLPP1This work
TQP10TQP08, ΔLPP1This work
TQP11TQP10, PERG9PHXT1This work
TQP12TQP10, PERG9PERG1This work
TQP13TQP12, ΔYPL062WThis work
TQP14TQP12, ΔYNR063WThis work
TQP15TQP12, ΔROX1This work
TQP16TQP13, ΔYNR063WThis work
TQP17TQP16, ΔYJL064WThis work
TQP18TQP17, ΔROX1This work
TQP19TQP17, ΔROX1:: PGAL1–UPC2-1-TCYC1This work
TQP20TQP17, ΔCIT2This work
TQP21TQP17, ΔMLS1This work
TQP22TQP17, ΔXI-3:: PTDH3-ADH2-TADH1This work
TQP23TQP17, YORWΔ22:: PTDH3-ACS2-TADH1This work
TQP24TQP17, YPRCΔ15:: PTEF1-SeACS-TCYC1This work
TQP25TQP17, ΔNDT80:: PGAL1-PK-TPGK1–TCYC1-PTA-PTDH3This work
Q22TQP22, discard the PESC-PTS plasmidThis work
TQ01Q22, ΔX-2:: PGAL1-PTS-TCYC1This work
TQ02TQ01, YHRCΔ14:: PGAL1-PTS-TCYC1This work
TQ03TQ02, ΔXI-2:: PGAL1-PTS-TCYC1This work
TQ04TQ03, ΔX-4:: PGAL1-PTS-TCYC1This work
TQ05TQ04, YPRCΔ15::PGAL1-PTS-TCYC1This work
TQ06TQ05, YORWΔ22:: PGAL1-PTS-TCYC1This work
TQ07TQ06, ΔNDT80:: PGAL1-PTS-TCYC1This work
TQ08TQ07, ΔXI-1:: PGAL1-PTS-TCYC1This work
TQ09TQ08, YARCΔ8:: PGAL1-PTS-TCYC1This work
E. coli DH5αThe strain for plasmid constructionThis Lab
Disclaimer/Publisher’s Note: The statements, opinions and data contained in all publications are solely those of the individual author(s) and contributor(s) and not of MDPI and/or the editor(s). MDPI and/or the editor(s) disclaim responsibility for any injury to people or property resulting from any ideas, methods, instructions or products referred to in the content.