Article

The Combined Effect of Four Nutraceutical-Based Feed Additives on the Rumen Microbiome, Methane Gas Emission, Volatile Fatty Acids, and Dry Matter Disappearance Using an In Vitro Batch Culture Technique

by
Kelechi A. Ike
1,
Deborah O. Okedoyin
1,
Joel O. Alabi
1,
Oludotun O. Adelusi
1,
Michael Wuaku
1,
Lydia K. Olagunju
1,
Chika C. Anotaenwere
1,
DeAndrea Gray
1,
Peter A. Dele
1,
Ahmed E. Kholif
1,
Misty D. Thomas
2 and
Uchenna Y. Anele
1,*
1
Department of Animal Sciences, North Carolina Agricultural and Technical State University, Greensboro, NC 27411, USA
2
Department of Biology, North Carolina Agricultural and Technical State University, Greensboro, NC 24711, USA
*
Author to whom correspondence should be addressed.
Fermentation 2024, 10(10), 499; https://doi.org/10.3390/fermentation10100499
Submission received: 3 September 2024 / Revised: 18 September 2024 / Accepted: 26 September 2024 / Published: 28 September 2024
(This article belongs to the Section Fermentation Process Design)

Abstract

This study aimed to investigate the effect of an essential oil/fumaric combination, mannan-oligosaccharide, galactooligosaccharide, and a mannan-oligosaccharide/galactooligosaccharide combination on the dry matter disappearance (DMD), gas production, greenhouse gasses, volatile fatty acid, and microbial community of a total mixed ration using a 24 h in vitro batch culture technique. The study design was a completely randomized design with four treatments as follows: a control treatment without any additives, the control treatment supplemented with galactooligosaccharide at 3% (Gos treatment), a galactooligosaccharide and mannan-oligosaccharide mixture at 1:1 at 3% (Gosmos treatment), or an essential oil blend (200 μL/g feed) and fumaric acid at 3% combination (Eofumaric treatment). The Gosmos treatment had the highest (p < 0.05) DMD (63.8%) and the numerical lowest acetate–propionate ratio (p = 0.207), which was 36.9% higher compared to the control. The lowest Shannon index, Simpson’s index, and all the diversity indices were recorded for the Eofumaric treatment, while the other treatments had similar Shannon index, Simpson’s index, and diversity index. The Z-score differential abundance between the Eofumaric and the control indicated that the inclusion of the Eofumaric treatment differentially increased the abundance of Patescibacteria, Synergistota, Chloroflexi, Actinobacteriota, Firmicutes, and Euryarchaeota while Verrucomicrobiota, WPS-2, Fibrobacterota, and Spirochaetota were decreased. The Random Forest Classification showed that the lower relative abundance of Fibrobacterota, Spirochaetota, and Elusimicrobiota and the higher relative abundance of Firmicutes and Chloroflexi were most impactful in explaining the microbial community data. Overall, the essential oil blend showed great potential as a methane gas mitigation strategy by modifying rumen fermentation through changes in the microbial community dynamics.

1. Introduction

Several feed additives have been employed in ruminant feeding, including essential oils [1], dicarboxylic acids (fumarate and malate) [2,3], prebiotics [2], and probiotics [3], all with mixed results. Conversely, the administration of individual essential oils or essential oil blends (EOBs) in diets of ruminants showed good effects on ruminal fermentation resulting from their antibacterial properties [1]. The response to EOBs has shown varied effects on animal performance due to several factors, including the relevant molecular structures, biologically active constituents, plants sources, and level of administration, making them good alternative prospects to antibiotics [4]. In an in vitro experiment, Alabi et al. [5] observed that an EOB at 100 µL/g lowered diet DM disappearance and methane (CH4) production and increased the microbial mass and total volatile fatty acids (VFAs) and propionate.
Another feed additive gaining increasing interest from animal nutritionists is prebiotics which, as feed supplement, confer health advantages to the host animal by influencing the modulation of gut microbiota [6,7]. Prebiotics mostly have an indirect effect on animals since they preferentially multiply one or a small number of bacteria, resulting in a selective change of the gut (particularly colonic) microflora of the host [8]. The effects of the prebiotic are not due to the prebiotic itself, but rather to the modifications in the makeup of the microbiota. Commonly employed prebiotics include oligosaccharides such as mannan-oligosaccharides, fructo-oligosaccharides, and galactooligosaccharides, in addition to other plant extracts [9]. Oligosaccharides are relatively stable during feed processing and granulation and can maintain their structural and functional integrity to improve livestock growth performance, intestinal microflora, antioxidant capacity, and immune function [10]. Oligosaccharides have been reported to enhance growth performance and improved colonization of the rumen at the expense of less beneficial bacteria, resulting in promoting ruminal fermentation and microbial protein synthesis [11,12].
Fumarate is another feed additive with the ability to manipulate rumen microflora and improve the in vitro and in vivo efficiency of the fermentation process [5,13]. Fumarate is a hydrogen acceptor that can be utilized by rumen microorganisms as a propionate precursor [14], and is an intermediate of the propionate–succinate pathway, making it an option to enhance ruminal propionate production by competing with methanogens for available hydrogen [13]. Such effects may lower CH4 production [5]. Guo et al. [15] showed that the addition of sodium nitrate and disodium fumarate reduces CH4 production and optimized ruminal VFA composition.
In vitro batch culture technology is extensively employed in animal nutrition and microbiology research, particularly for studying the digestion of feedstuffs in the rumen of livestock under controlled conditions [16,17]. Recent advancements in batch culture protocols have enhanced the accuracy and consistency of in vitro studies by optimizing key factors such as temperature, pH, and gas composition to better replicate the rumen environment, culminating in comparable results to in vivo studies [18,19]. This technology is commonly used for rapid evaluation of feed and supplement quality, methane mitigation in ruminants, testing the impact of feed additives, and investigating the microbial dynamics in the rumen that influence fermentation efficiency and nutrient absorption.
Limited data are currently available describing the effect of EOBs, fumaric acid, and oligosaccharides on ruminal fermentation and the ruminal microbiome. Therefore, this study aimed to employ in vitro batch culture technology to investigate the effect of an essential oil–fumaric acid combination and an oligosaccharide combination on in vitro gas production, dry matter (DM) disappearance (DMD), undegraded DM, greenhouse gas emissions (CH4), carbon dioxide (CO2), ammonia (NH3) and hydrogen sulfide (H2S), and total VFA and its molar proportion. We propose that active components in the additives will work synergistically to improve ruminal fermentation and reduce greenhouse gas production.

2. Materials and Methods

Most of the experimental procedure for this study was carried out in the same laboratory using the same protocols as previous published articles [2,5,20].

2.1. Experimental Site

This experiment was carried out in the Ruminant Nutrition Laboratory at the Animal Sciences Department, North Carolina Agricultural Technical State University, Greensboro. Three canulated Holstein Friesian dairy cows from the North Carolina Agricultural and Technical State University Dairy Research Farm were used for this experiment. The cows were healthy and free from any diseases, and allowed to graze freely on pasture and were supplemented with grass hay and a mineral mixture. Cows were under IACUC approved protocol # LA22-0019.

2.2. Treatments

Treatments were as follows: The control treatment consisted of a total mixed ration (TMR) composed of 60% corn silage, 20% alfalfa hay, and 20% concentrate without any additives. The control treatments were then supplemented with galactooligosaccharide (Milk Specialties, Eden Prairie, MN, USA) at 3% (Gos treatment), a galactooligosaccharide and mannan-oligosaccharide mixture at 1:1 at 3% (Gosmos treatment), or an EOB comprised of garlic, lemongrass, cumin, lavender, and nutmeg in the ratio 4:2:2:1:1 (200 μL/g feed) and fumaric acid (St. Louis, MO, USA) at 3% combination (Eofumaric treatment). The TMR was the same as in a previously reported study [2]. The nutrient contents of the TMR are shown in Table 1.

2.3. In Vitro Batch Culture

Prior to the start of the experiment, 100 mL sample bottles were washed thoroughly and allowed to dry before use. Ankom F57 (Ankom Technology Corp., Macedon, NY, USA) fiber filter bags were labeled and soaked in acetone under a fume hood for about 10 min before being transferred into an oven set at a temperature of 55 °C and dried to constant weight after 48 h. Upon retrieving the bags from the oven, the bags were placed in a desiccator for about 10 min and then weighed on a sensitive scale and recorded accordingly. Feed samples (total mixed ration) were weighed into the bags at approximately 0.50 ± 0.05 with a sensitive scale. The bags were sealed with an impulse sealer machine to prevent losing part of the samples and immediately inserted into the labeled 100 mL serum bottles.
The in vitro batch culture technique, as described by Anele et al. [21], was used for this study. Ruminal contents were collected from the three Holstein Friesian cannulated cows who were fed a high-forage diet. Prior to the collection of ruminal inoculum, hot water was collected inside a plastic container and the cap of the cannular was removed and placed inside the hot water. About 20 L of ruminal contents were collected, mixed for 10 s, squeezed through 4 layers of cheesecloth, placed inside an insulated thermos, and covered immediately after collection to maintain the normal rumen temperature. This was transported immediately to the North Carolina Agricultural Technical State University Nutrition laboratory, which is approximately 10 min from the dairy farm unit, and placed in a water bath at 39 °C under continuous CO2 flushing until inoculation [22].
Artificial saliva was prepared according to McDougall’s recipe containing (per L): 9.83 g NaHCO3, 3.69 g Na2HPO4, 0.60 g KCl, 0.47 g NaCl, 0.30 g (NH4)2SO4, 0.061 g MgCl2.6H2O, and 0.0293 g CaCl2.2H2O and maintained in a water bath at 39 °C. The initial pH of the artificial saliva was 7.06. The ruminal contents were also placed in water bath before 45 mL of the artificial saliva and 15 mL of the rumen fluid were dispensed into the serum bottles containing the substrate [21]. The serum bottles were capped with butyl rubbers and crimped with aluminum seals. The serum sample bottles were then placed inside the incubator using an orbital shaker set to 39 °C and 125 rpm for 24 h. Shortly after dispensing, the pH of the artificial saliva and rumen fluid was collected using a bench top pH meter (model B10P, VWR International, Randor, PA, USA).
Sampling and analysis of gas were carried out 24 h after the incubation period. Headspace gas pressure was measured by inserting a 22 G × 1 ½ (0.7 mm × 40 mm) needle to determine the gas pressure, with the use of a manometer (VWR International, Randor, PA, USA) as described by Theodorou et al. [22]. Concentrations of CH4, CO2, NH3, and hydrogen sulfide (H2S) were determined using a portable gas analyzer (Biogas 5000, Landtec, Dexter, MI, USA). Rumen fluid samples were stored at −80 °C for other studies.
After the gas pressure and analysis readings, the liquid content of each bottle was transferred into centrifuge tubes to be centrifuged for 15 min at 10,000 rpm. The filter bags in the sample bottles were removed and rinsed under cold water thoroughly until the water was clear enough. The bags were oven-dried for 48 h at 55 °C. After drying, the bags were placed inside a desiccator for 10 min and weighed for the determination of DMD. All treatments were tested in two incubation runs with 4 replicates in each run. In each incubation run, 4 bottles with inoculum but without feed (blanks) were also included to establish baseline fermentation gas production.
At the end of incubation, 15 mL samples of ruminal liquid from each bottle were decanted and treated with 3 mL of a 25% (w/w) metaphosphoric solution and promptly frozen at −20 °C for VFA determination. Gas chromatography (Agilent 7890B GC system/5977B GC-MSD/7693 autosampler, Agilent Technologies, Santa Clara, CA, USA) employing a capillary column (Zebron ZB-FFP, Phenomenex Inc., Torrance, CA, USA) was utilized for VFA profiling in the ruminal liquid, as previously outlined in Olagunju et al. [23]. An internal standard mixture of metaphosphoric acid and crotonic acid (trans-2-butenoic acid) was employed, while acetic (C2), propionic (C3), butyric (C4), isobutyric (iso-4), valeric (C5), and isovaleric (iso-C5) acid served as quantitative external standards [24].
The chemical composition of the TMR was determined by employing established procedures of the AOAC [25]. Dry matter determination (#930.15) involved oven drying at 55 °C until a constant weight was achieved, using the Thermo Scientific Heratherm OGS100 (Thermo Electron LED GmbH, Langenselbold, Germany). Nitrogen (N) quantifcation (#954.01) was carried out using an organic elemental analyzer (2400 CHNS, PerkinElmer, Waltham, MA, USA), and crude protein (CP) was calculated as N multiplied by 6.25. Ether extract (EE; #920.39) was analyzed using an ANKOM XT15 extractor (ANKOM, Macedon, NY, USA). The ash content (#942.05) was determined by combusting samples in a muffle furnace at 550 °C for 12 h (Lindberg Blue M, Thermo Fisher Scientific, Pittsburgh, PA, USA). Organic matter (OM) was calculated by subtracting the weight of the ash after combustion. Neutral detergent fiber (NDF) was determined with alpha amylase and sodium sulfite following the procedure of Van Soest et al. [26], while acid detergent fiber (ADF; #973.18) content was analyzed using the ANKOM fiber analyzer (F57 Fiber Filter Bags, 200 Fiber Analyzer, ANKOM Technology, Macedon, NY, USA) according to the AOAC method [25]. Acid detergent lignin (ADL) was obtained by eliminating cellulose from ADF through soaking it with concentrated H2SO4, following ANKOM Technologies’ recommended analytical methods.

2.4. DNA Extraction

When still in a frozen state, 0.2 g of the pellets were measured into microcentrifuge tubes, followed by the addition of lysis buffer to each sample and subsequent resuspension of the pellets. DNA extraction was then performed on each homogenized sample using the QIAamp Fast DNA Stool Mini Kit (QIAGEN, Hilden, Germany). The concentration of DNA (measured in ng/L) in each sample was determined using the Quantus Fluorometer (Promega, Madison, WI, USA) and the samples were stored at −20 °C for 16S rRNA sequencing.

2.5. Sequencing of the 16S rRNA Gene

The DNA samples were sent to SeqCenter (Pittsburgh, PA, USA) for 2 × 301 bp sequencing on an Illumina NextSeq 2000 instrument (Illumina San Diego, CA, USA) at 100k reads depth using a modification of the standard Illumina Nextera tagmentation protocol. Analysis of the resulting amplicon sequencing data was conducted using Quantitative Insights Into Microbial Ecology 2 (QIIME2, version 2022.2). Taxonomic classification was carried out using the SILVA database (v138), employing a 99% sequence similarity threshold [27].

2.6. Statistical Analysis

The rumen fermentation data were spread out using the GLM of SAS (SAS 9.4 version; SAS Institute Inc., Cary, NC, USA) in a completely randomized design and analyzed using one-way analysis of variance with the effect of treatment as a fixed effect. The model used was as follows: Yij = μ + Ti + εij, where Yij is the observation, μ is the mean, Ti is the treatment effect, and εij is the residual error. The Tukey test was used to separate the means and statistical significance was set at differences between means with p < 0.05. The microbial diversity, normalization, and differential abundance data were analyzed using MicrobiomeAnalyst 2.0 [28].

3. Results

3.1. Gas Production, Greenhouse Gases, and Dry Matter Disappearance

The Eofumaric treatment had the lowest (p < 0.001) DMD, gas production, and GHG production values compared to the other additives (Table 2). The other treatments did not affect these parameters compared to the control.

3.2. Volatile Fatty Acids

The inclusion of Eofumaric in the diets decreased the production of total VFA (p = 0.047) with no significant effect with the other additives compared to the control treatment (Table 3). Treatments did not affect C2 proportion; however, the Eofumaric additive decreased the proportions of C3 (p = 0.005), C5 (p = 0.049), iso-C4 (p < 0.001), and iso-C5 (p = 0.004), and increased the C2:C3 ratio (p = 0.207), and the proportions of C4 (p = 0.015) and C5 (p = 0.049).

3.3. Ruminal Bacteria

The microbiome results showed a total of 735,744 reads, with an average read counts per sample of 91,968 ranging from 79,711 to 103,917. The abundance revealed 520 Operational Taxonomic Units (OTUs) with 366 OTUs having counts greater than 2. There was no significant (>0.05) difference in total bacteria and archaea with different additives compared to the control treatment (Table 4). Bacteria abundance ranged from 80,217 for Gosmos to 91,635 for the control while archaea ranged from 5154 to 6098 for the Gos and Eofumaric treatments, respectively.

3.4. Heatmap of Phylum Abundance

The heatmap of the phylum relative abundance is shown in Figure 1. A total of 24 different phyla were observed. Across the treatments, firmicutes dominated the microbial community, followed by bacteroidota. Eofumaric had the highest (76%) and lowest (6%) relative abundance for firmicutes and bacteroidota, respectively.

3.5. Microbiome

There were no significant differences (p > 0.05) in Euryachaeota, Proteobacteria, Patescibacteria, Actinobacteriota, Thermoplasmatota, Campilobacterota, Synergistota, and Planctomycetota. Firmicutes and Chloroflexi were significantly increased (p < 0.05) by 30% and 48%, respectively, when Eofumaric was administered to the control diet (Table 5). The other treatments were similar for these microbial groups. Eofumaric treatment also significantly decreased (p < 0.05) bacteroidota by 77% and Verrucomicrobiota, Spirochaetota and Desulfobacterota, by 84%, 86%, and 74%, respectively. Most notably, Eofumaric reduced (p < 0.05) the abundance of Fibrobacterota by 100% when compared to the control while the other treatments, again were similar for these microbial taxa.
Figure 2 shows the PCA plot for the phylum abundance and a clear separation between Eofumaric and the other treatments with PC1 explaining 98.8% of the variation in the data.
Alpha diversity indices at the phylum level are shown in Figure 3 and Figure 4 and Table 6. The Eofumaric treatment had the lowest Shannon index compared to the other treatments. The Simpson’s index and all the diversity indices maintained the same trend as the Shannon index, with Eofumaric having the lowest values. Moreover, the Faith diversity showed that Gosmos treatment had a lower value (p = 0.005) compared to the control treatment.
Beta diversity was carried out using Bray–Curtis Dissimilarity and visualized using the Bray–Curtis 2D plot (Figure 5). Both replicates of Eofumaric were closely aligned with each other and clearly separated from the other samples, which were more clustered together.
Figure 6 shows the Random Forest Classification. Five phyla (Fibrobacterota, Spirochaetota, Firmicutes, Elusimicrobiota, Chloroflexi) were above 0.01 mean decrease accuracy. Eight phyla had mean decrease accuracy values ranging from 0.005 to 0.01, while six phyla had values between 0.000 and 0.005. Four phyla had values less than 0.000. For the five phyla with mean decrease accuracy above 0.01, Eofumaric had a highly lower relative abundance for Fibrobacterota, Spirochaetota, and Elusimicrobiota and a higher relative abundance for Firmicutes and Chloroflexi.
The differential abundance between the control and Eofumaric at the phylum level is shown in Figure 7. Patescibacteria, Synergistota, Chloroflexi, Actinobacteriota, Firmicutes, and Euryarchaeota were enriched by Eofumaric inclusion. Verrucomicrobiota, WPS-2, Fibrobacterota, and Spirochaetota were depressed by the inclusion of Eofumaric treatment.
The heatmap of the relative abundance of the top twenty genera is shown in Figure 8. Eofumaric had the highest (76%) and lowest (6%) relative abundance for Firmicutes and Bacteroidota, respectively.
The abundance of genera belonging to the archaea phylum is shown in Table 7. There were no significant differences in Methanobrevibacter and the unresolved Methanomethylophilaceae. The uncultured genus of the Methanomethylophilaceae was significantly lower with Eofumaric while the other treatments were not significant. Methanosphaera was significantly higher for Eofumaric compared to the other treatments.
Differential abundance was carried out between the control and the individual treatments by filtering the data based on a Log2 fold-change greater than one and adjusted p value less than 0.05. Based on the data from Table 3 and Table 4, with Gos and Gosmos generally having no statistical significance compared to the control for the parameters shown in those tables, the focus for the differential abundance was on the control vs. Eofumaric. Based on the above-mentioned filtering, Eofumaric had a total of 62 differentially abundant taxa (Table 8).
The Z-scores for the top twenty differentially abundant genera based on adjusted p values between the control and Eofumaric treatments are shown in Figure 9. Streptococcus, Vibrio, and Catenibacterium were higher when Eofumaric was added to the diet while the rest of the observed taxa were differentially lower in abundance.

4. Discussion

4.1. Gas Production, Greenhouse Gases, and Dry Matter Disappearance

Dry matter disappearance is an indication that the diet would be better utilized and release more nutrients to the animal [29]. In this study, we did not observe any significant effect with the inclusion of Gos and Gosmos on the DMD of the substrate. The values for gas volume maintained a similar trend as the DMD values and corroborated the findings as gas production is an indication of microbial activity on the substrate and is a marker for digestibility. Recently, Alabi et al. [16] reported similar weak effects of galactooligosaccharides and/or mannan-oligosaccharides on in vitro gas production and nutrient degradability (i.e., DM, NDF, ADF, and ADL degradabilities). Several forms of oligosaccharides are useful during digestion where they have positive influences and reduce the activities of unfavorable microbes in the rumen that could impede feed breakdown [30]. One possible explanation for the weak effects of the oligosaccharides on DMD is that the inclusion level of the oligosaccharides was too low to elicit an effect and the low quantities may have simply been degraded by rumen microbes. This observation may also be corroborated by the trend observed in the abundance of the phyla in this study, which followed the same trend as the fermentation parameters, with the oligosaccharide treatments having statistically similar values as the control.
The inclusion of Eofumaric reduced the DMD and in vitro gas volume. However, Alabi et al. [2] reported inconsistent results compared to the present study, where the administration of EOB and fumaric acid mixture at 10 µL EO/g feed and 3% fumaric into diets had no negative effects on in vitro gas production or DMD. The differences in results may be attributed to the higher dose of additives in the present study (200 μL EO/g feed and fumaric acid at 3%), as well as the variation in the experimental methods (RUSITEC vs. batch culture) and incubation period (9 days in the previous study vs. 24 h in the present study). The negative effects of EOBs and fumaric acids on DMD were previously observed [5]. It was expected that mixing fumaric acid with EOBs would work synergistically to increase gas production and DMD; however, this effect was not observed, indicating that the antimicrobial effects of EOBs masked the positive effects of fumaric on ruminal microbes. The active biomolecules in the EOB in the Eofumaric treatment could potentially have diminished the microbial population involved in the degradation of feed. Essential oils comprise terpenes and terpenoids, and these compounds possess antimicrobial properties [1,31] against some ruminal microbes. These compounds in the essential oil blend may have caused the marked significant reduction in the phylum Fibrobacterota in this study. Fibrobacterota currently includes one officially recognized genus, which is Fibrobacter. One common species found in cattle notable for degradation of fibrous materials is Fibrobacter succinogenes [32]. Kobayashi et al. [33] reported that Fibrobacter succinogenes is the primary fibrolytic species crucial for rumen fiber digestion. Fibrolytic bacteria could be adversely affected by elevated levels of phenolic compounds found in EOBs, potentially leading to a reduction in fiber disappearance when these EOB supplements are used [1].
The inclusion of Eofumaric caused a reduction in greenhouse gasses. Consistent with these findings, Alabi et al. [5] observed that the combination of EOBs and fumaric acid decreased CH4 and CO2 emissions during in vitro fermentation of a beef cow diet. However, Alabi [2,16] reported minimal effect with the administration of a mixture of EOBs at 3 µL or 10 µL/g and fumaric acid at 3% on CH4, CO2, NH3, and H2S production. As previously mentioned, the differences in experimental conditions could be the primary reason for inconsistency in the results. Methane is a byproduct of ruminal fermentation and is an indication of a loss of the total energy consumed by ruminants, accounting for 2–12% of the total energy [34]. Fumaric acid has an important role in the succinate–propionate pathway and propionic acid precursor, which acts as an alternative H2 sink to reduce enteric CH4 production. Moreover, essential oils impact rumen fermentation by modifying microbial communities [1,30]. In their experiment, Kouazounde et al. [35] reported rumen microbial communities were modified with the administration of essential oils, positively impacting rumen fermentation and reducing greenhouse gas emissions. Surprisingly, the abundance of total archaea was not significantly different between the treatments. However, there were some significant differences at the family/genus level. Overall, the pattern showed that the abundance of the members of Euryarchaeota was higher with the inclusion of Eofumaric while members of Thermoplasmatota were lower. It therefore seems logical that the abundance of archaea would exhibit the strongest correlation with methane emissions. However, studies have contradicted this assumption indicating that CH4 production is not based solely on methanogen abundance but on the interaction between the community dynamics and abundance. For example, it has been shown that there is no significant relationship between the abundance of methanogens and CH4 emissions in dairy cows [36]. One implication could be that the metabolic potential of individual methanogens holds more credibility in explaining CH4 output rather than the abundance.
In the present study, Methanobrevibacter was the dominant methanogen, and its abundance was numerically higher than that of the control. Next to the Methanobrevibacter group, members of the order Methanomassiliicoccales were the most abundant in the rumen. Despite their lower abundance, Methanomassiliicoccales are believed to be very efficient CH4 producers due to their lower hydrogen threshold, which allows them to function at lower H concentrations [37]. It is possible that the EOB in the Eofumaric treatment was able to inhibit the activities of this group of methanogens shown by their significantly lower abundance compared to the control and resulted in lower methane levels in this study. To buttress this, a 2.3 negative fold-change for an uncultured genus belonging to the family Methanomethylophilaceae (order Methanomassiliicoccales) was also observed in this study. High abundance of Methanobrevibacter spp. has been reported to have a positive correlation with low CH4, indicating a less contributory role of this group of methanogens to CH4 emission [36]. The trend observed in this study for CH4 production and methanogen abundance is very similar to the findings of Liu et al. [38] with 3NOP and fumarate where 3NOP in combination with fumarate increased the abundance of a given OTU and reduced the abundance of another, thereby buttressing the equal importance of archaea composition and structure in explaining ruminal CH4 production dynamics. Overall, it is possible that the EOB used in this study functioned similarly to 3NOP in deactivating methyl-coenzyme M reductase but additionally directly inhibited the growth of the members of the Methanomassiliicoccales order.
The reduced production of ruminal NH3 with Eofumaric treatment indicates less dietary protein degradation and amino acid deamination. Essential oils have the ability to terminate the activity and growth of Gram-positive proteolytic bacteria [1,39]. Alabi et al. [5] reported significant decreases in ruminal NH3 production with an EOB and fumaric acid. Methane and CO2 production in the present study showed that the Eofumaric inclusion in livestock diets could reduce energy loss and reduce greenhouse gas emissions from cattle that play an important role in global warming due to their harmful effects on the ozone layer [40].

4.2. Volatile Fatty Acids

The inclusion of Eofumaric additives decreased total VFA, which may be due to their negative effects on DMD and other nutrient disappearance and the efficiency of microbial mass production. An inverse relationship between the concentration of total VFA and efficiency of microbial mass production has been reported previously [41]. Similar findings were reported by Alabi et al. [5], who observed that the combination of EOBs and fumaric acid decreased total VFA concentration during in vitro fermentation of a beef cow diet. The reduction in propionate observed in the present study was unexpected as this treatment had improved propionate in a previous study [17]. Essential oils are touted to have more antimicrobial effects against Gram-positive bacteria than Gram-negative bacteria, which favors the growth of Gram-negative bacteria [1,39], but this was not generally observed in this study as the bacteroidota phylum, which are mostly Gram-negative, was significantly reduced. Gram-negative bacteria in the rumen are more often associated with the propionate pathway [42]. A possible explanation may be due to the modified batch culture system used in this study where the rumen solid was included in the rumen content used for the experiment, which might have introduced an additional microbial consortium. Regular fermentation and digestion in the rumen include close interactions between the microbes that attach to the fibrous plant materials and those suspended in the rumen fluid and this interaction is facilitated by the contractions and subsequent mixing of digesta fractions, which leads to a closer relationship between the communities [43]. Sbardellati et al. [44] reported that there are variations in the microbial community among the different rumen geographic regions.
The major rumen fiber degraders are known to mostly attach to the feed materials. Overall, the lower total VFAs and propionate are a reflection of the lower digestibility values recorded for Eofumaric and might have been a result of the marked lower abundance of several taxa observed in this study, including Prevotella, Fibrobacter, Succinimonas, Treponema, Selenomonas and Ruminobacter. Prevotella is among the most abundant rumen microbes and this taxon can degrade diverse polysaccharides and possess the ability to produce VFAs, with propionate being the major VFA, which serves as a crucial substrate for gluconeogenesis in the livers of ruminant animals [45]. Selenomonas enhances fiber digestion when it is cultured alongside R. flavefaciens and Fibrobacter succinogenes by converting succinate, a metabolite produced by R. flavefaciens and Fibrobacter succinogenes, into propionate [46]. Succinimonas is also a succinate producer and contributes to the succinate pool in the rumen [47]. At the phylum level, the marked decrease in Bacteroidota and Proteobacteria phyla, both of which participate in the succinate pathway, might have contributed to the lower propionate value of the Eofumaric treatment [48]. Ranilla et al. [49] reported propionate molar fractions of 13.6–15.0 and 12.0–13.7, which are lower than the values recorded in this current study. It had been reported that the inclusion of dietary oligosaccharides could regulate the composition of ruminal microbiota and alter rumen fermentation [50] but this was not exactly the case in this study as the oligosaccharides used in this study recorded statistically similar total and individual VFA molar fractions as the control.

4.3. Ruminal Bacteria

There were no significant differences in the bacteria and archaea domains observed in this study. According to Thomas et al. [
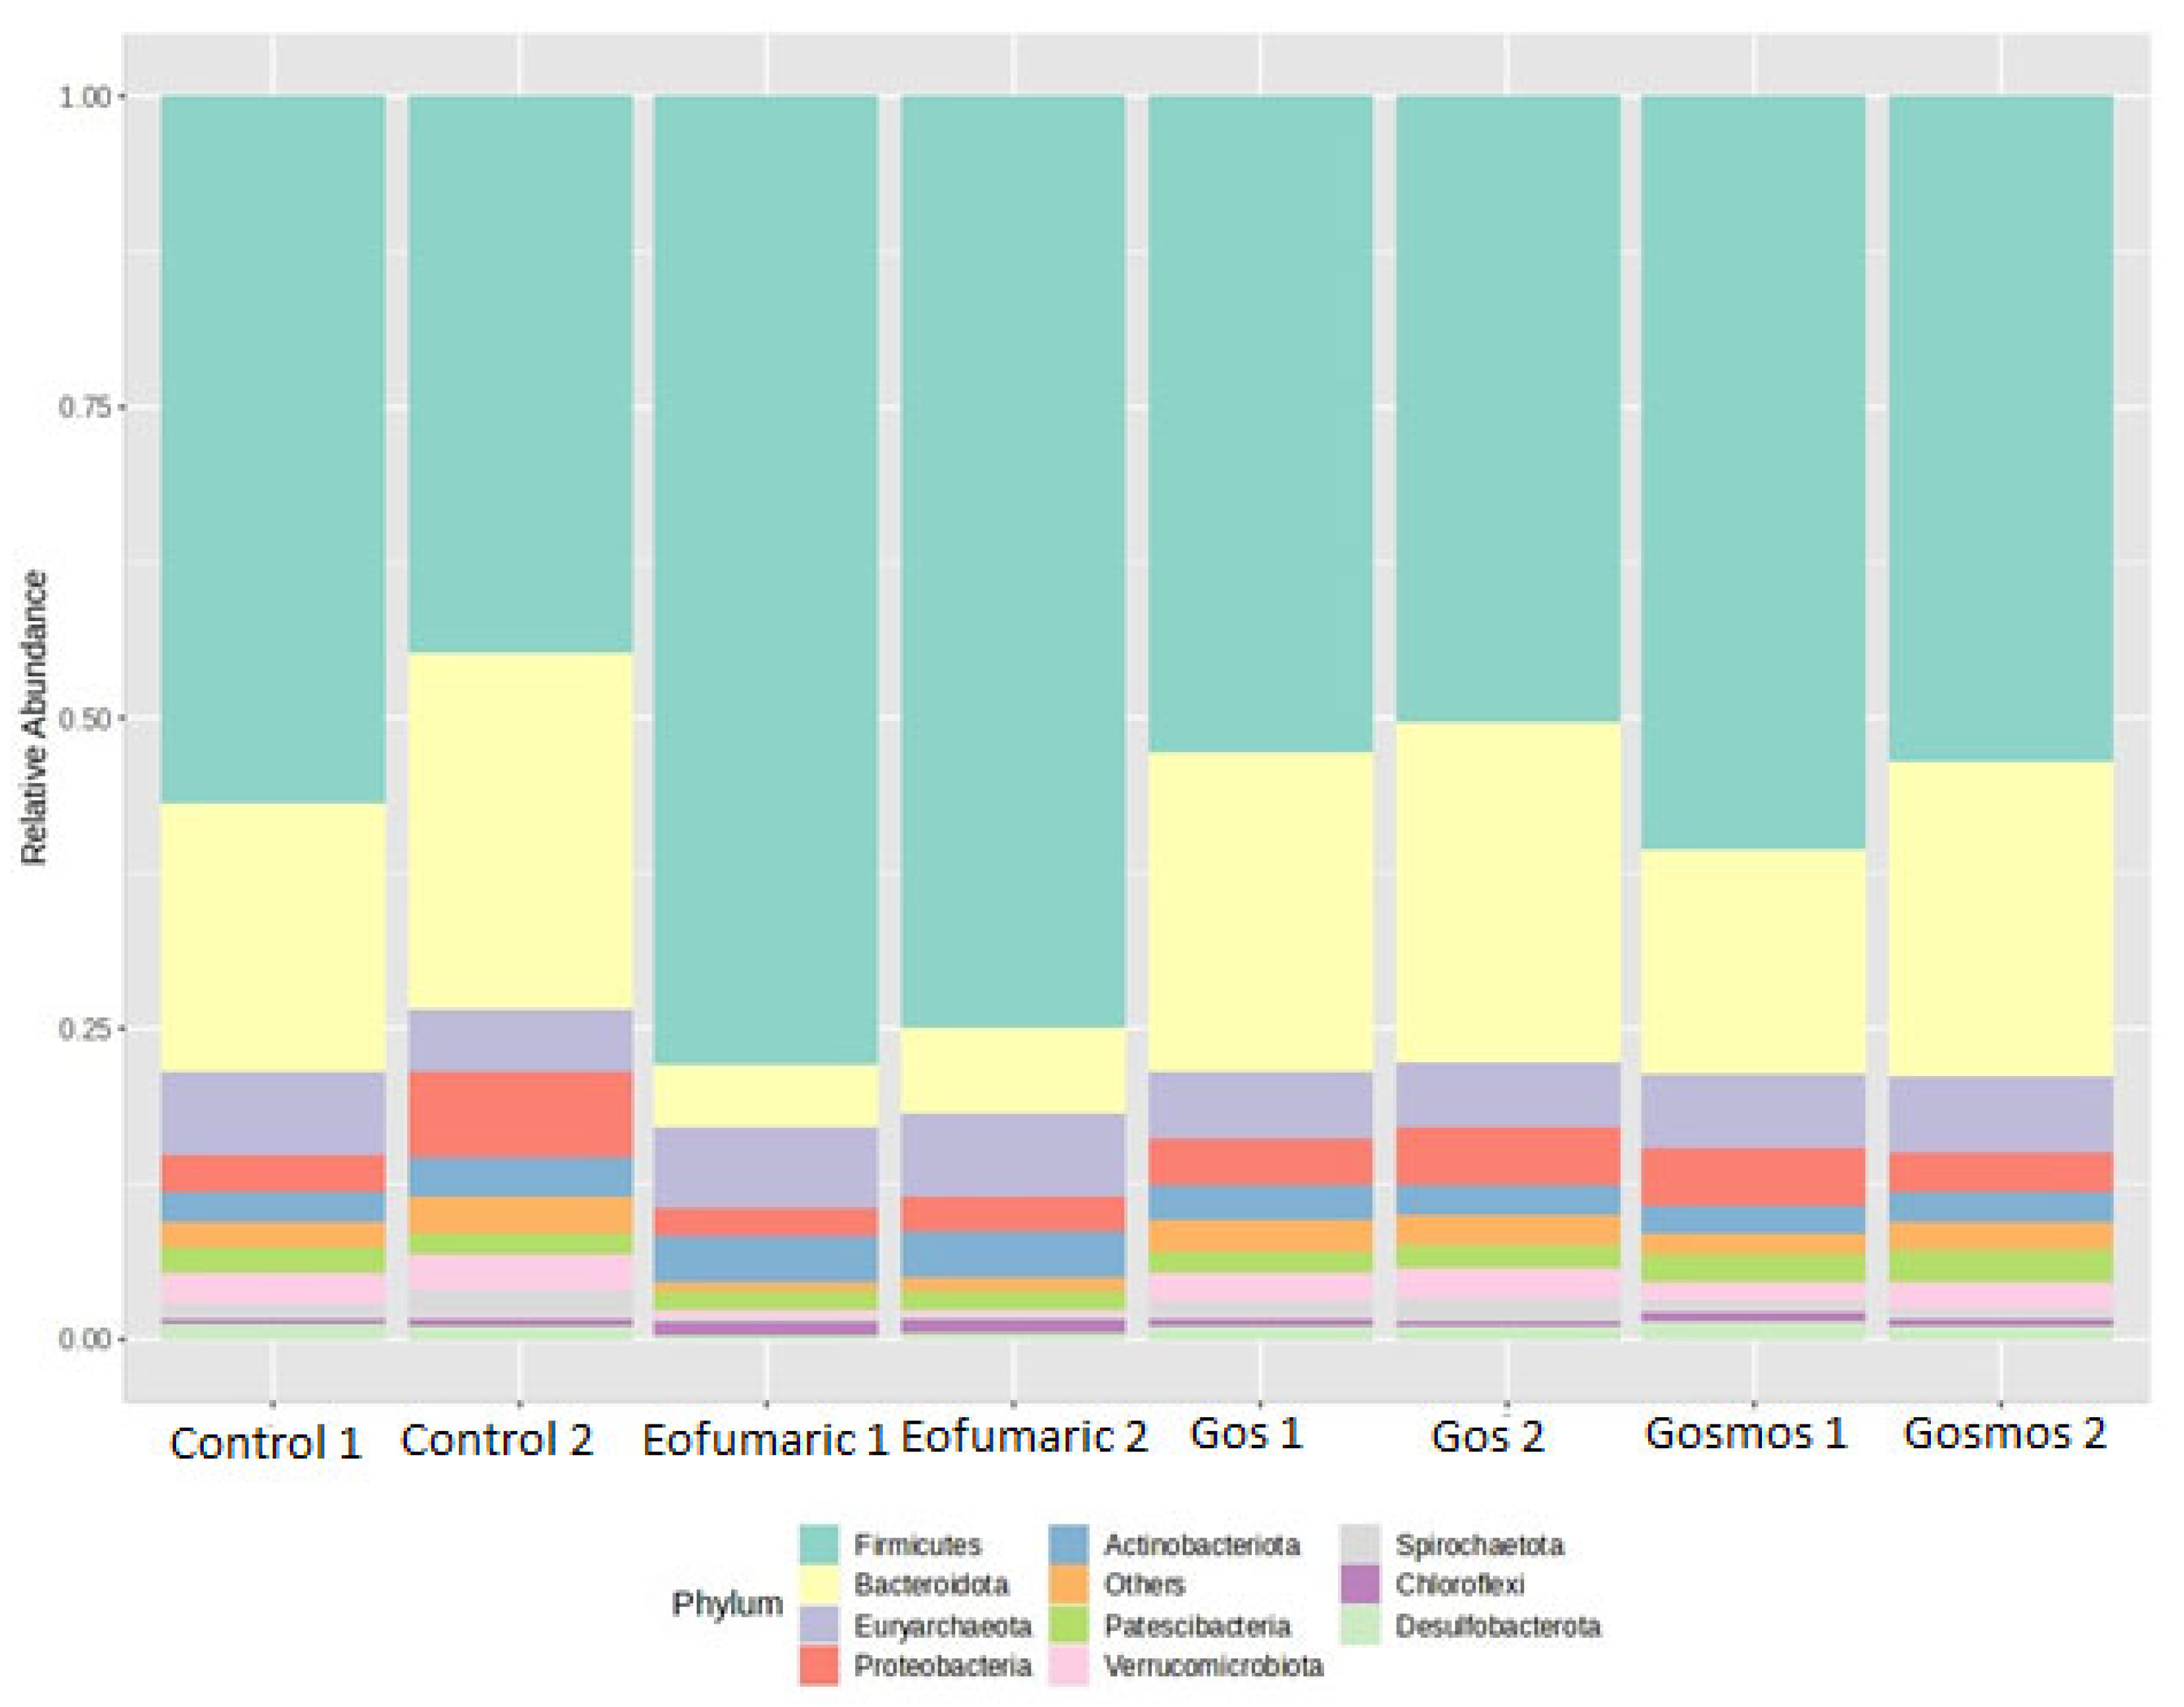
51], the use of additives at higher taxonomic levels such as the phylum level may not bring about a significant effect. Results in the present study showed that Firmicutes was the dominant phylum. This is in contrast to the results of Deusch et al. [52] where Bacteroidetes was the most abundant phyla in a corn silage-based diet. Animal differences may account for the differences as that study used lactating Jersey cows. The inclusion of Eofumaric significantly increased the abundance of Firmicutes by 30% and Bacteroidota by 77% compared to the control. Essential oils are known to exhibit strong antibacterial properties with more antimicrobial activity against Gram-positive bacteria compared to Gram-negative bacteria [53]. This, however, negates the trend observed in the current study. Though most rumen microbes occur in both the rumen liquid and solid fractions, it is noteworthy that Bacteroidota (Gram-negative) are more established in the rumen fluid while firmicutes (Gram-positive) more often adhere to the plant fiber. The in vitro batch culture set up used in this study is such that the essential oils have greater access and surface area to interact with the planktonic microbes compared to the solids and this may have caused the marked reduction in Bacteroidota. Tavares et al. [39] reported that cinnamon leaf essential oil inhibited both Gram-positive and Gram-negative bacteria even at low concentrations. Eofumaric also significantly reduced the abundance of Spirochaetota, Fibrobacterota, Verrucomicrobiota, and Desulfobacterota compared to the control based on the Z-score differential abundance. These are known to be fiber-adherent taxa [54] but have less ruminal presence compared to firmicutes. It is also possible that the reduction in the abundance of these fewer taxa created a competitive advantage for the Firmicutes to proliferate, hence the increase in abundance of this phylum. Microbes belonging to the Verrucomicrobiota phylum exhibit extensive activity in breaking down lignocellulose and utilizing sugars, producing an array of VFAs, indicating their potential to play a substantial role in the functioning of the rumen [55]. Rubino et al. [56] indicated that the rumen microbiome is in constant competition for environmental conditions and resources. On the contrary, Patescibacteria, Synergistota, Chloroflexi, Actinobacteriota, Firmicutes, and Euryarchaeota were differentially higher than the control based on the Z-score heatmap. Patescibacteria was recently found to be a dominant phylum in Holstein dairy cow for the first time [57]. They indicated a notable finding that total protein was significantly positively correlated with the abundance of Patescibacteria, indicating that this phylum may indirectly facilitate the absorption of total protein.
The inclusion of Eofumaric resulted in a decrease in alpha and beta diversity indices measured in the present study. This was expected due to the significant reduction in the abundance of several taxa. This is similar to the findings of Thomas et al. [51] where the inclusion of antibiotic feed additives had an inverse relationship with Shannon and Simpson indices, which had lower values for the antibiotic treatments. In another study, monensin also reduced bacteria diversity [58]. The Shannon Diversity Index serves as a measure of biodiversity or species diversity within a specific ecosystem or community and is popularly used to assess the diversity and distribution of species in a given area [59]. By providing a single numerical value, the Shannon Diversity Index effectively encapsulates the complexity and diversity of a community, taking into consideration both the total number of individual species present in a given microbial community, which is the species richness, and the relative abundance or proportion of each species, known as the species evenness [60]. Higher values of the Shannon index indicate greater species diversity, implying that more species are present in relatively equal abundance. On the contrary, lower values indicate less diversity, either due to fewer species present where one or a few species dominate the community. This trend was observed in the present study with Eofumaric treatment being dominated by firmicutes. Faith’s Phylogenetic Diversity assesses the evolutionary relatedness of species within a population or ecosystem and while valuable, this measurement does not consider features crucial to ecosystem stability and functional diversity [61]. Hence, the variety of functions carried out by species could be missed and therefore, it is often paired with other metrics to gain a comprehensive understanding of biodiversity. The higher the phylogenetic diversity value, the greater the diversity of the features observed in the community. A single organism is incapable of fully metabolizing all the organic material ingested by host animals. Instead, this process relies on the functional capabilities and cooperative interactions of diverse microorganisms working sequentially. Bacterial populations work together to produce a spectrum of fibrolytic enzymes, which are subsequently metabolized into volatile fatty acids and microbial proteins, and therefore a more diverse microbial community is generally preferred [62].
The trend for beta diversity, visualized using the Bray–Curtis 2D plot, showed that Eofumaric and the control were closely aligned with each other and clearly separated from the other samples, which were more clustered together. This means that the species composition when Eofumaric was added was more dissimilar than the other treatments. In a Bray–Curtis 2D plot, which is a Principal Coordinate Analysis (PCoA) plot, both axes explain an aspect of variation among the samples with the horizontal axis, often referred to as the first principal component explaining the largest amount of the variation [63]. Every point on the x-axis represents a distinct sample from the dataset. The species composition of samples is more similar when they are closer together along the x-axis, while samples that are farther away show less similarity. PCoA is a useful tool for exploring and visualizing relationships and clusters between samples based on their pairwise dissimilarities [64].
The Random Forest Classification showed that five phyla (Fibrobacterota, Spirochaetota, Firmicutes, Elusimicrobiota, Chloroflexi) were above 0.01 mean decrease accuracy. Out of these, Eofumaric showed lower relative abundances for Fibrobacterota, Spirochaetota, and Elusimicrobiota and higher relative abundances for Firmicutes and Chloroflexi, indicating that these features had more importance in explaining the observations in this study, therefore corroborating the previously observed trends so far. Spirochaetota primarily engages in the breakdown of complex polysaccharides found in plant cell walls, proteins, and the synthesis of B vitamins within the rumen [65]. Treponema, which is a genus in the Spirochaetota phylum, produces propionate as the major VFA [66]. Generally, B vitamins obtained from the TMR and synthesized by the rumen microflora of lactating dairy cows are often sufficient to meet the nutritional needs of the animal [67]. The Random Forest Classification plot is a visualization tool used to understand the importance of different features in classifying sample groups. The Mean Decrease Accuracy values on the x-axis measures the importance of each feature, with higher values indicating that a feature contributes more to the accuracy of the classification model and is considered more important for distinguishing between sample groups [68].
The observations from the Z-score-based top twenty differentially abundant genera based on adjusted p value between the control and Eofumaric samples further corroborate the findings from the present study. Streptococcus, Coprococcus, Vibrio, and Catenibacterium were higher when Eofumaric was added to the diet while the rest of the observed taxa were differentially lower in abundance. Coprococcus are Gram-positive bacteria involved in the breakdown of complex carbohydrates such as cellulose, hemicellulose, and pectin yielding butyric acid, followed by acetic and propionic acids in decreasing proportions [69]. This observation may also explain the higher value of butyrate obtained in this study for Eofumaric. Butyric acid, a short-chain fatty acid, serves as a vital energy source for the epithelial cells lining the rumen and holds significant importance in rumen fermentation and overall digestive well-being in ruminant species [70]. Catenibacterium is a Gram-positive that has shown a positive correlation with lactate and may utilize a wide range of substrates [71]. Lactate and formate are substrates that compete for the same active site on methyl-coenzyme M reductase such that elevated lactate levels interfere with formate which is the preferred substrate in methanogenesis, reducing formate availability and hence the potential to inhibit methane production [72]. Ruminobacter, Fibrobacter, Prevotella, and Treponema were all differentially reduced with the inclusion of Eofumaric. These genera are involved actively in the propionate pathway encoding succinate CoA synthetase and propionyl CoA carboxylase, which are key enzymes involved in this pathway [8,66]. Ruminobacter is mainly known for amylolytic activities [73]. Z-scores enable the normalization of abundance values across various features and sample groups, facilitating the identification of features that consistently exhibit differential abundance across multiple comparisons [74].

5. Conclusions

This study showed that combining an essential oil blend with fumaric acid has a significant effect on rumen fermentation and microbial communities. While oligosaccharide administration had minimal impact, the essential oil blend combined with fumaric acid significantly reduced dry matter disappearance, total volatile fatty acids, methane production, and the abundance of certain rumen microbes such as Fibrobacter, Prevotella, and Bacteroidota. It also affected the diversity of the rumen microbial community. These findings suggest essential oil blends could be useful for improving rumen fermentation and reducing methane emissions in ruminant animals. However, more research is needed to understand how these supplements work and their long-term effects on animal performance and environmental impact.

Author Contributions

Conceptualization: U.Y.A.; methodology: K.A.I., P.A.D., M.D.T., and U.Y.A.; formal analysis and investigation: K.A.I., C.C.A., M.W., J.O.A., O.O.A., D.O.O., L.K.O., D.G., A.E.K., and U.Y.A.; writing—original draft preparation, K.A.I. and A.E.K.; writing—review and editing: A.E.K., M.D.T., and U.Y.A.; funding acquisition: U.Y.A.; resources: U.Y.A.; supervision: U.Y.A. All authors have read and agreed to the published version of the manuscript.

Funding

This research was funded by USDA National Institute of Food and Agriculture, Evans-Allen project 1023327. Project # NC.X338-5-21-120-1.

Institutional Review Board Statement

The animal study was approved by the Institutional Animal Care and Use Committee, North Carolina A&T State University, Greensboro (protocol #: LA22-0019; approved 31 July 2022).

Informed Consent Statement

Not applicable.

Data Availability Statement

The raw data supporting the conclusions of this article will be made available by the authors on request.

Conflicts of Interest

The authors declare no conflicts of interest.

References

  1. Kholif, A.E.; Olafadehan, O.A. Essential Oils and Phytogenic Feed Additives in Ruminant Diet: Chemistry, Ruminal Microbiota and Fermentation, Feed Utilization and Productive Performance. Phytochem. Rev. 2021, 20, 1087–1108. [Google Scholar] [CrossRef]
  2. Alabi, J.O.; Dele, P.A.; Okedoyin, D.O.; Wuaku, M.; Anotaenwere, C.C.; Adelusi, O.O.; Gray, D.; Ike, K.A.; Oderinwale, O.A.; Subedi, K.; et al. Synergistic Effects of Essential Oil Blends and Fumaric Acid on Ruminal Fermentation, Volatile Fatty Acid Production and Greenhouse Gas Emissions Using the Rumen Simulation Technique (RUSITEC). Fermentation 2024, 10, 114. [Google Scholar] [CrossRef]
  3. Gouda, G.A.; Kholif, A.E.; Hamdon, H.A.; Kassab, A.Y.; Patra, A.K. Utilization of Waste Date Palm Leaves Biomass Ensiled with Malic or Lactic Acids in Diets of Farafra Ewes under Tropical Conditions. Animals 2022, 12, 1432. [Google Scholar] [CrossRef] [PubMed]
  4. Kholif, A.E.; Kassab, A.Y.; Azzaz, H.H.; Matloup, O.H.; Hamdon, H.A.; Olafadehan, O.A.; Morsy, T.A. Essential Oils Blend with a Newly Developed Enzyme Cocktail Works Synergistically to Enhance Feed Utilization and Milk Production of Farafra Ewes in the Subtropics. Small Rumin. Res. 2018, 161, 43–50. [Google Scholar] [CrossRef]
  5. Alabi, J.O.; Okedoyin, D.O.; Anotaenwere, C.C.; Wuaku, M.; Gray, D.; Adelusi, O.O.; Ike, K.A.; Olagunju, L.K.; Dele, P.A.; Anele, U.Y. Essential Oil Blends with or without Fumaric Acid Influenced In Vitro Rumen Fermentation, Greenhouse Gas Emission, and Volatile Fatty Acids Production of a Total Mixed Ration. Ruminants 2023, 3, 373–384. [Google Scholar] [CrossRef]
  6. Al-Shawi, S.G.; Dang, D.S.; Yousif, A.Y.; Al-Younis, Z.K.; Najm, T.A.; Matarneh, S.K. The Potential Use of Probiotics to Improve Animal Health, Efficiency, and Meat Quality: A Review. Agriculture 2020, 10, 452. [Google Scholar] [CrossRef]
  7. Kholif, A.E. The Impact of Varying Levels of Laurus nobilis Leaves as a Sustainable Feed Additive on Ruminal Fermentation: In Vitro Gas Production, Methane and Carbon Dioxide Emissions, and Ruminal Degradability of a Conventional Diet for Ruminants. Fermentation 2024, 10, 387. [Google Scholar] [CrossRef]
  8. Wang, Y. Prebiotics: Present and Future in Food Science and Technology. Food Res. Int. 2009, 42, 8–12. [Google Scholar] [CrossRef]
  9. Davani-Davari, D.; Negahdaripour, M.; Karimzadeh, I.; Seifan, M.; Mohkam, M.; Masoumi, S.; Berenjian, A.; Ghasemi, Y. Prebiotics: Definition, Types, Sources, Mechanisms, and Clinical Applications. Foods 2019, 8, 92. [Google Scholar] [CrossRef]
  10. Diaz, T.G.; Branco, A.F.; Jacovaci, F.A.; Jobim, C.C.; Daniel, J.L.P.; Bueno, A.V.I.; Ribeiro, M.G. Use of Live Yeast and Mannan-Oligosaccharides in Grain-Based Diets for Cattle: Ruminal Parameters, Nutrient Digestibility, and Inflammatory Response. PLoS ONE 2018, 13, e0207127. [Google Scholar] [CrossRef]
  11. Zheng, C.; Zhou, J.; Zeng, Y.; Liu, T. Effects of Mannan Oligosaccharides on Growth Performance, Nutrient Digestibility, Ruminal Fermentation and Hematological Parameters in Sheep. PeerJ 2021, 9, e11631. [Google Scholar] [CrossRef] [PubMed]
  12. Chang, M.; Wang, F.; Ma, F.; Jin, Y.; Sun, P. Supplementation with Galacto-Oligosaccharides in Early Life Persistently Facilitates the Microbial Colonization of the Rumen and Promotes Growth of Preweaning Holstein Dairy Calves. Anim. Nutr. 2022, 10, 223–233. [Google Scholar] [CrossRef] [PubMed]
  13. Remling, N.; Riede, S.; Meyer, U.; Beineke, A.; Breves, G.; Flachowsky, G.; Dänicke, S. Influence of Fumaric Acid on Ruminal Parameters and Organ Weights of Growing Bulls Fed with Grass or Maize Silage. Animal 2017, 11, 1754–1761. [Google Scholar] [CrossRef] [PubMed]
  14. Newbold, C.J.; López, S.; Nelson, N.; Ouda, J.O.; Wallace, R.J.; Moss, A.R. Propionate Precursors and Other Metabolic Intermediates as Possible Alternative Electron Acceptors to Methanogenesis in Ruminal Fermentation in Vitro. Br. J. Nutr. 2005, 94, 27–35. [Google Scholar] [CrossRef] [PubMed]
  15. Guo, Y.; Hassan, F.; Li, M.; Tang, Z.; Peng, L.; Peng, K.; Yang, C. Effect of Hydrogen-Consuming Compounds on In Vitro Ruminal Fermentation, Fatty Acids Profile, and Microbial Community in Water Buffalo. Curr. Microbiol. 2022, 79, 220. [Google Scholar] [CrossRef]
  16. Alabi, J.O.; Wuaku, M.; Anotaenwere, C.C.; Okedoyin, D.O.; Adelusi, O.O.; Ike, K.A.; Gray, D.; Kholif, A.E.; Subedi, K.; Anele, U.Y. A Mixture of Prebiotics, Essential Oil Blends, and Onion Peel Did Not Affect Greenhouse Gas Emissions or Nutrient Degradability, but Altered Volatile Fatty Acids Production in Dairy Cows Using Rumen Simulation Technique (RUSITEC). Fermentation 2024, 10, 324. [Google Scholar] [CrossRef]
  17. Ike, K.A.; Adelusi, O.O.; Alabi, J.O.; Olagunju, L.K.; Wuaku, M.; Anotaenwere, C.C.; Okedoyin, D.O.; Gray, D.; Dele, P.A.; Subedi, K.; et al. Effects of Different Essential Oil Blends and Fumaric Acid on in Vitro Fermentation, Greenhouse Gases, Nutrient Degradability, and Total and Molar Proportions of Volatile Fatty Acid Production in a Total Mixed Ration for Dairy Cattle. Agriculture 2024, 14, 876. [Google Scholar] [CrossRef]
  18. Hassan, O.G.A.; Hassaan, N.A.; Kholif, A.E.; Chahine, M.; Mousa, G.A. Influence of Replacing Soybean Meal with Nigella sativa Seed Meal on Feed Intake, Digestibility, Growth Performance, Blood Metabolites, and Antioxidant Activity of Growing Lambs. Animals 2024, 14, 1878. [Google Scholar] [CrossRef]
  19. Mousa, G.A.; Kholif, A.E.; Hassaan, N.A.; El-Garhy, G.M.; Hassan, O.G.A. Effect of Replacing Cottonseed Meal with Fenugreek Seed Meal on Feed Intake, Digestibility, Growth, Blood Parameters and Economics of Fattening Lambs. Small Rumin. Res. 2024, 236, 107305. [Google Scholar] [CrossRef]
  20. Brice, R.M.; Dele, P.A.; Ike, K.A.; Shaw, Y.A.; Olagunju, L.K.; Orimaye, O.E.; Subedi, K.; Anele, U.Y. Effects of Essential Oil Blends on In Vitro Apparent and Truly Degradable Dry Matter, Efficiency of Microbial Production, Total Short-Chain Fatty Acids and Greenhouse Gas Emissions of Two Dairy Cow Diets. Animals 2022, 12, 2185. [Google Scholar] [CrossRef]
  21. Anele, U.Y.; Refat, B.; Swift, M.L.; He, Z.X.; Zhao, Y.L.; McAllister, T.A.; Yang, W.Z. Effects of Bulk Density, Precision Processing and Processing Index on in Vitro Ruminal Fermentation of Dry-Rolled Barley Grain. Anim. Feed Sci. Technol. 2014, 195, 28–37. [Google Scholar] [CrossRef]
  22. Theodorou, M.K.; Williams, B.A.; Dhanoa, M.S.; McAllan, A.B.; France, J. A Simple Gas Production Method Using a Pressure Transducer to Determine the Fermentation Kinetics of Ruminant Feeds. Anim. Feed Sci. Technol. 1994, 48, 185–197. [Google Scholar] [CrossRef]
  23. Olagunju, L.K.; Isikhuemhen, O.S.; Dele, P.A.; Anike, F.N.; Ike, K.A.; Shaw, Y.; Brice, R.M.; Orimaye, O.E.; Wuaku, M.; Essick, B.G.; et al. Effects of the Incubation Period of Pleurotus Ostreatus on the Chemical Composition and Nutrient Availability of Solid-State-Fermented Corn Stover. Animals 2023, 13, 2587. [Google Scholar] [CrossRef] [PubMed]
  24. Ruiz-Moreno, M.; Binversie, E.; Fessenden, S.W.; Stern, M.D. Mitigation of in Vitro Hydrogen Sulfide Production Using Bismuth Subsalicylate with and without Monensin in Beef Feedlot Diets. J. Anim. Sci. 2015, 93, 5346–5354. [Google Scholar] [CrossRef] [PubMed]
  25. AOAC. Official Methods of Analysis of AOAC International, 21st ed.; Oxford University Press: Washington DC, USA, 2019; ISBN 9780197610138. [Google Scholar]
  26. Van Soest, P.J.; Robertson, J.B.; Lewis, B.A. Methods for Dietary Fiber, Neutral Detergent Fiber, and Nonstarch Polysaccharides in Relation to Animal Nutrition. J. Dairy Sci. 1991, 74, 3583–3597. [Google Scholar] [CrossRef]
  27. Bolyen, E.; Rideout, J.R.; Dillon, M.R.; Bokulich, N.A.; Abnet, C.C.; Al-Ghalith, G.A.; Alexander, H.; Alm, E.J.; Arumugam, M.; Asnicar, F.; et al. Reproducible, Interactive, Scalable and Extensible Microbiome Data Science Using QIIME 2. Nat. Biotechnol. 2019, 37, 852–857. [Google Scholar] [CrossRef]
  28. Lu, Y.; Zhou, G.; Ewald, J.; Pang, Z.; Shiri, T.; Xia, J. MicrobiomeAnalyst 2.0: Comprehensive Statistical, Functional and Integrative Analysis of Microbiome Data. Nucleic Acids Res. 2023, 51, W310–W318. [Google Scholar] [CrossRef]
  29. Zhou, H.; Yu, B.; He, J.; Mao, X.; Zheng, P.; Yu, J.; Luo, J.; Luo, Y.; Yan, H.; Chen, D. The Optimal Combination of Dietary Starch, Non-Starch Polysaccharides, and Mannan-Oligosaccharide Increases the Growth Performance and Improves Butyrate-Producing Bacteria of Weaned Pigs. Animals 2020, 10, 1745. [Google Scholar] [CrossRef]
  30. Foskolos, A.; Cavini, S.; Ferret, A.; Calsamiglia, S. Effects of Essential Oil Compounds Addition on Ryegrass Silage Protein Degradation. Can. J. Anim. Sci. 2016, 96, 100–103. [Google Scholar] [CrossRef]
  31. Masyita, A.; Mustika Sari, R.; Dwi Astuti, A.; Yasir, B.; Rahma Rumata, N.; Emran, T.B.; Nainu, F.; Simal-Gandara, J. Terpenes and Terpenoids as Main Bioactive Compounds of Essential Oils, Their Roles in Human Health and Potential Application as Natural Food Preservatives. Food Chem. X 2022, 13, 100217. [Google Scholar] [CrossRef]
  32. Ransom-Jones, E.; Jones, D.L.; McCarthy, A.J.; McDonald, J.E. The Fibrobacteres: An Important Phylum of Cellulose-Degrading Bacteria. Microb. Ecol. 2012, 63, 267–281. [Google Scholar] [CrossRef]
  33. Kobayashi, Y.; Shinkai, T.; Koike, S. Ecological and Physiological Characterization Shows That Fibrobacter Succinogenes Is Important in Rumen Fiber Digestion—Review. Folia Microbiol. (Praha) 2008, 53, 195–200. [Google Scholar] [CrossRef]
  34. Tatsuoka, N.; Mohammed, N.; Mitsumori, M.; Hara, K.; Kurihara, M.; Itabashi, H. Phylogenetic Analysis of Methyl Coenzyme-M Reductase Detected from the Bovine Rumen. Lett. Appl. Microbiol. 2004, 39, 257–260. [Google Scholar] [CrossRef] [PubMed]
  35. Kouazounde, J.B.; Jin, L.; Assogba, F.M.; Ayedoun, M.A.; Wang, Y.; Beauchemin, K.A.; Mcallister, T.A.; Gbenou, J.D. Effects of Essential Oils from Medicinal Plants Acclimated to Benin on in Vitro Ruminal Fermentation of Andropogon Gayanus Grass. J. Sci. Food Agric. 2015, 95, 1031–1038. [Google Scholar] [CrossRef] [PubMed]
  36. Danielsson, R.; Dicksved, J.; Sun, L.; Gonda, H.; Müller, B.; Schnürer, A.; Bertilsson, J. Methane Production in Dairy Cows Correlates with Rumen Methanogenic and Bacterial Community Structure. Front. Microbiol. 2017, 8, 00226. [Google Scholar] [CrossRef] [PubMed]
  37. Pitta, D.W.; Indugu, N.; Melgar, A.; Hristov, A.; Challa, K.; Vecchiarelli, B.; Hennessy, M.; Narayan, K.; Duval, S.; Kindermann, M.; et al. The Effect of 3-Nitrooxypropanol, a Potent Methane Inhibitor, on Ruminal Microbial Gene Expression Profiles in Dairy Cows. Microbiome 2022, 10, 146. [Google Scholar] [CrossRef] [PubMed]
  38. Liu, Z.; Wang, K.; Nan, X.; Cai, M.; Yang, L.; Xiong, B.; Zhao, Y. Synergistic Effects of 3-Nitrooxypropanol with Fumarate in the Regulation of Propionate Formation and Methanogenesis in Dairy Cows In Vitro. Appl. Environ. Microbiol. 2022, 88, e01908-21. [Google Scholar] [CrossRef] [PubMed]
  39. Tavares, T.D.; Antunes, J.C.; Padrão, J.; Ribeiro, A.I.; Zille, A.; Amorim, M.T.P.; Ferreira, F.; Felgueiras, H.P. Activity of Specialized Biomolecules against Gram-Positive and Gram-Negative Bacteria. Antibiotics 2020, 9, 314. [Google Scholar] [CrossRef]
  40. Rossi, C.A.S.; Grossi, S.; Dell’anno, M.; Compiani, R.; Rossi, L. Effect of a Blend of Essential Oils, Bioflavonoids and Tannins on In Vitro Methane Production and In Vivo Production Efficiency in Dairy Cows. Animals 2022, 12, 728. [Google Scholar] [CrossRef]
  41. Ungerfeld, E.M. Shifts in Metabolic Hydrogen Sinks in the Methanogenesis-Inhibited Ruminal Fermentation: A Meta-Analysis. Front. Microbiol. 2015, 6, 37. [Google Scholar] [CrossRef]
  42. Wang, K.; Xiong, B.; Zhao, X. Could Propionate Formation Be Used to Reduce Enteric Methane Emission in Ruminants? Sci. Total Environ. 2023, 855, 158867. [Google Scholar] [CrossRef] [PubMed]
  43. Stockler, R.M.; Hallowell, H.; Higgins, K.V.; Groover, E.S.; Hiltbold, E.M.; Newcomer, B.; Walz, P.H. Characterization and Comparison of the Rumen Luminal and Epithelial Microbiome Profiles Using Metagenomic Sequencing Technique. Front. Vet. Sci. 2022, 9, 799063. [Google Scholar] [CrossRef] [PubMed]
  44. Sbardellati, D.L.; Fischer, A.; Cox, M.S.; Li, W.; Kalscheur, K.F.; Suen, G. The Bovine Epimural Microbiota Displays Compositional and Structural Heterogeneity across Different Ruminal Locations. J. Dairy Sci. 2020, 103, 3636–3647. [Google Scholar] [CrossRef] [PubMed]
  45. Wu, Q.C.; Wang, W.K.; Zhang, F.; Li, W.J.; Wang, Y.L.; Lv, L.K.; Yang, H.J. Dietary Cysteamine Supplementation Remarkably Increased Feed Efficiency and Shifted Rumen Fermentation toward Glucogenic Propionate Production via Enrichment of Prevotella in Feedlot Lambs. Microorganisms 2022, 10, 1105. [Google Scholar] [CrossRef] [PubMed]
  46. Sawanon, S.; Koike, S.; Kobayashi, Y. Evidence for the Possible Involvement of Selenomonas ruminantium in Rumen Fiber Digestion. FEMS Microbiol. Lett. 2011, 325, 170–179. [Google Scholar] [CrossRef]
  47. Hespell, R.B. The Genera Succinivibrio and Succinimonas. In The Prokaryotes: A Handbook on the Biology of Bacteria: Ecophysiology, Isolation, Identification, Applications; Balows, A., Trüper, H.G., Dworkin, M., Harder, W., Schleifer, K.H., Eds.; Springer: New York, NY, USA, 1992; pp. 3979–3982. [Google Scholar]
  48. Louis, P.; Flint, H.J. Formation of Propionate and Butyrate by the Human Colonic Microbiota. Environ. Microbiol. 2017, 19, 29–41. [Google Scholar] [CrossRef]
  49. Ranilla, M.J.; Andrés, S.; Gini, C.; Biscarini, F.; Saro, C.; Martín, A.; Mateos, I.; López, S.; Giráldez, F.J.; Abdennebi-Najar, L.; et al. Effects of Thymbra Capitata Essential Oil on in Vitro Fermentation End-Products and Ruminal Bacterial Communities. Sci. Rep. 2023, 13, 4153. [Google Scholar] [CrossRef]
  50. Garcia Diaz, T.; Ferriani Branco, A.; Jacovaci, F.A.; Cabreira Jobim, C.; Bolson, D.C.; Pratti Daniel, J.L. Inclusion of Live Yeast and Mannan-Oligosaccharides in High Grain-Based Diets for Sheep: Ruminal Parameters, Inflammatory Response and Rumen Morphology. PLoS ONE 2018, 13, e0193313. [Google Scholar] [CrossRef]
  51. Thomas, M.; Webb, M.; Ghimire, S.; Blair, A.; Olson, K.; Fenske, G.J.; Fonder, A.T.; Christopher-Hennings, J.; Brake, D.; Scaria, J. Metagenomic Characterization of the Effect of Feed Additives on the Gut Microbiome and Antibiotic Resistome of Feedlot Cattle. Sci. Rep. 2017, 7, 12257. [Google Scholar] [CrossRef]
  52. Deusch, S.; Camarinha-Silva, A.; Conrad, J.; Beifuss, U.; Rodehutscord, M.; Seifert, J. A Structural and Functional Elucidation of the Rumen Microbiome Influenced by Various Diets and Microenvironments. Front. Microbiol. 2017, 8, 1605. [Google Scholar] [CrossRef]
  53. Preuss, H.G.; Echard, B.; Enig, M.; Brook, I.; Elliott, T.B. Minimum Inhibitory Concentrations of Herbal Essential Oils and Monolaurin for Gram-Positive and Gram-Negative Bacteria. Mol. Cell. Biochem. 2005, 272, 29–34. [Google Scholar] [CrossRef] [PubMed]
  54. Soltis, M.P.; Henniger, M.T.; Egert-McLean, A.M.; Voy, B.H.; Moorey, S.E.; Schnieder, L.G.; Shepherd, E.A.; Christopher, C.; Campagna, S.R.; Smith, J.S.; et al. Rumen Biogeographical Regions and Their Impact on Microbial and Metabolome Variation. Front. Anim. Sci. 2023, 4, 1154463. [Google Scholar] [CrossRef]
  55. Gharechahi, J.; Sarikhan, S.; Han, J.L.; Ding, X.Z.; Salekdeh, G.H. Functional and Phylogenetic Analyses of Camel Rumen Microbiota Associated with Different Lignocellulosic Substrates. NPJ Biofilms Microbiomes 2022, 8, 46. [Google Scholar] [CrossRef] [PubMed]
  56. Rubino, F.; Carberry, C.; Waters, S.M.; Kenny, D.; McCabe, M.S.; Creevey, C.J. Divergent Functional Isoforms Drive Niche Specialisation for Nutrient Acquisition and Use in Rumen Microbiome. ISME J. 2017, 11, 932–944. [Google Scholar] [CrossRef] [PubMed]
  57. Zhu, J.; Wu, Y.; Jiang, A.; Li, B.; Ran, T.; Zhou, C.; Xiao, D.; Tan, Z. Effects of Dietary N-Carbamylglutamate on Rumen Fermentation Parameters, and Bacterial Community Diversity of Holstein Dairy Cows in Tibet. Front. Microbiol. 2023, 14, 1101620. [Google Scholar] [CrossRef]
  58. Johnson, M.C.; Devine, A.A.; Ellis, J.C.; Grunden, A.M.; Fellner, V. Effects of Antibiotics and Oil on Microbial Profiles and Fermentation in Mixed Cultures of Ruminal Microorganisms. J. Dairy Sci. 2009, 92, 4467–4480. [Google Scholar] [CrossRef]
  59. Agrawal, A.; Gopal, K. Application of Diversity Index in Measurement of Species Diversity. In Biomonitoring of Water and Waste Water; Springer India: Delhi, India, 2013; pp. 41–48. ISBN 978-81-322-0864-8. [Google Scholar]
  60. Porreca, A.; Maturo, F. Identifying Anomalous Patterns in Ecological Communities’ Diversity: Leveraging Functional Boxplots and Clustering of Normalized Hill’s Numbers and Their Integral Functions. Qual. Quant. in press. 2024, 1–28. [Google Scholar] [CrossRef]
  61. Biodiversity Conservation and Phylogenetic Systematics; Pellens, R., Grandcolas, P., Eds.; Springer International Publishing: Cham, Switzerland, 2016; Volume 14, ISBN 978-3-319-22460-2. [Google Scholar]
  62. Xu, Q.; Qiao, Q.; Gao, Y.; Hou, J.; Hu, M.; Du, Y.; Zhao, K.; Li, X. Gut Microbiota and Their Role in Health and Metabolic Disease of Dairy Cow. Front. Nutr. 2021, 8, 701511. [Google Scholar] [CrossRef]
  63. Podani, J.; Miklos, I. Resemblance Coefficients and the Horseshoe Effect in Principal Coordinates Analysis. Ecology 2002, 83, 3331. [Google Scholar] [CrossRef]
  64. Wang, L.; Zhang, G.; Li, Y.; Zhang, Y. Effects of High Forage/Concentrate Diet on Volatile Fatty Acid Production and the Microorganisms Involved in VFA Production in Cow Rumen. Animals 2020, 10, 223. [Google Scholar] [CrossRef]
  65. Hernández, R.; Chaib De Mares, M.; Jimenez, H.; Reyes, A.; Caro-Quintero, A. Functional and Phylogenetic Characterization of Bacteria in Bovine Rumen Using Fractionation of Ruminal Fluid. Front. Microbiol. 2022, 13, 813002. [Google Scholar] [CrossRef] [PubMed]
  66. Guo, T.; Guo, T.; Guo, L.; Li, F.; Li, F.; Ma, Z. Rumen Bacteria Abundance and Fermentation Profile during Subacute Ruminal Acidosis and Its Modulation by Aspergillus oryzae Culture in RUSITEC System. Fermentation 2022, 8, 329. [Google Scholar] [CrossRef]
  67. Girard, C.L.; Duplessis, M. The Importance of B Vitamins in Enhanced Precision Nutrition of Dairy Cows: The Case of Folates and Vitamin B12. Can. J. Anim. Sci. 2022, 102, 201–210. [Google Scholar] [CrossRef]
  68. García-Carretero, R.; Holgado-Cuadrado, R.; Barquero-Pérez, Ó. Assessment of Classification Models and Relevant Features on Nonalcoholic Steatohepatitis Using Random Forest. Entropy 2021, 23, 763. [Google Scholar] [CrossRef] [PubMed]
  69. Holdeman, L.V.; Moore, W.E.C. New Genus, Coprococcus, Twelve New Species, and Emended Descriptions of Four Previously Described Species of Bacteria from Human Feces. Int. J. Syst. Bacteriol. 1974, 24, 260–277. [Google Scholar] [CrossRef]
  70. Baaske, L.; Gäbel, G.; Dengler, F. Ruminal Epithelium: A Checkpoint for Cattle Health. J. Dairy Res. 2020, 87, 322–329. [Google Scholar] [CrossRef]
  71. Ma, Y.; Zhu, L.; Ma, Z.; Gao, Z.; Wei, Y.; Shen, Y.; Li, L.; Liu, X.; Ren, M. Distinguishing Feature of Gut Microbiota in Tibetan Highland Coronary Artery Disease Patients and Its Link with Diet. Sci. Rep. 2021, 11, 18486. [Google Scholar] [CrossRef]
  72. de Bok, F.A.M.; Harmsen, H.J.M.; Plugge, C.M.; de Vries, M.C.; Akkermans, A.D.L.; de Vos, W.M.; Stams, A.J.M. The First True Obligately Syntrophic Propionate-Oxidizing Bacterium, Pelotomaculum schinkii Sp. Nov., Co-Cultured with Methanospirillum hungatei, and Emended Description of the Genus Pelotomaculum. Int. J. Syst. Evol. Microbiol. 2005, 55, 1697–1703. [Google Scholar] [CrossRef]
  73. Hua, D.; Hendriks, W.H.; Xiong, B.; Pellikaan, W.F. Starch and Cellulose Degradation in the Rumen and Applications of Metagenomics on Ruminal Microorganisms. Animals 2022, 12, 3020. [Google Scholar] [CrossRef]
  74. Von Meijenfeldt, F.A.B.; Hogeweg, P.; Dutilh, B.E. A Social Niche Breadth Score Reveals Niche Range Strategies of Generalists and Specialists. Nat. Ecol. Evol. 2023, 7, 768–781. [Google Scholar] [CrossRef]
Figure 1. Effect of dietary inclusion of galactooligosaccharide, galactooligosaccharide and mannan-oligosaccharide mixture, or essential oil and fumaric acid mixture on ruminal heatmap of phylum abundance. Treatments: Control treatment without any additives, control treatment supplemented with galactooligosaccharide at 3% (Gos treatment), galactooligosaccharide and mannan-oligosaccharide mixture at 1:1 at 3% (Gosmos treatment), or EOB (200 μL/g feed) and fumaric acid at 3% combination (Eofumaric treatment).
Fermentation 10 00499 g001
Figure 2. Effect of dietary inclusion of galactooligosaccharide, galactooligosaccharide and mannan-oligosaccharide mixture, or essential oil and fumaric acid mixture on ruminal phylum abundance PCA plot. Treatments: Control treatment without any additives, control treatment supplemented with galactooligosaccharide at 3% (Gos treatment), galactooligosaccharide and mannan-oligosaccharide mixture at 1:1 at 3% (Gosmos treatment), or EOB (200 μL/g feed) and fumaric acid at 3% combination (Eofumaric treatment).
Fermentation 10 00499 g002
Figure 3. Effect of dietary inclusion of galactooligosaccharide, galactooligosaccharide and mannan-oligosaccharide mixture, or essential oil and fumaric acid mixture on ruminal alpha diversity Shannon index. Treatments: Control treatment without any additives, control treatment supplemented with galactooligosaccharide at 3% (Gos treatment), galactooligosaccharide and mannan-oligosaccharide mixture at 1:1 at 3% (Gosmos treatment), or EOB (200 μL/g feed) and fumaric acid at 3% combination (Eofumaric treatment).
Fermentation 10 00499 g003
Figure 4. Effect of dietary inclusion of galactooligosaccharide, galactooligosaccharide and mannan-oligosaccharide mixture, or essential oil and fumaric acid mixture on ruminal alpha diversity Simpson index. Treatments: Control treatment without any additives, control treatment supplemented with galactooligosaccharide at 3% (Gos treatment), galactooligosaccharide and mannan-oligosaccharide mixture at 1:1 at 3% (Gosmos treatment), or EOB (200 μL/g feed) and fumaric acid at 3% combination (Eofumaric treatment).
Fermentation 10 00499 g004
Figure 5. Effect of dietary inclusion of galactooligosaccharide, galactooligosaccharide and mannan-oligosaccharide mixture, or essential oil and fumaric acid mixture on ruminal Bray Curtis 2-D PCoA plot. Treatments: Control treatment without any additives, control treatment supplemented with galactooligosaccharide at 3% (Gos treatment), galactooligosaccharide and mannan-oligosaccharide mixture at 1:1 at 3% (Gosmos treatment), or EOB (200 μL/g feed) and fumaric acid at 3% combination (Eofumaric treatment).
Fermentation 10 00499 g005
Figure 6. Effect of dietary inclusion of galactooligosaccharide, galactooligosaccharide and mannan-oligosaccharide mixture, or essential oil and fumaric acid mixture on ruminal phylum Random Forest Classification. Treatments: Control treatment without any additives, control treatment supplemented with galactooligosaccharide at 3% (Gos treatment), galactooligosaccharide and mannan-oligosaccharide mixture at 1:1 at 3% (Gosmos treatment), or EOB (200 μL/g feed) and fumaric acid at 3% combination (Eofumaric treatment).
Fermentation 10 00499 g006
Figure 7. Control vs. Eofumaric phylum differential abundance. Treatments: Control treatment without any additives, control treatment supplemented with galactooligosaccharide at 3% (Gos treatment), galactooligosaccharide and mannan-oligosaccharide mixture at 1:1 at 3% (Gosmos treatment), or EOB (200 μL/g feed) and fumaric acid at 3% combination (Eofumaric treatment).
Fermentation 10 00499 g007
Figure 8. Effect of dietary inclusion of galactooligosaccharide, galactooligosaccharide and mannan-oligosaccharide mixture, or essential oil and fumaric acid mixture on ruminal relative abundance of top twenty genera. Treatments: Control treatment without any additives, control treatment supplemented with galactooligosaccharide at 3% (Gos treatment), galactooligosaccharide and mannan-oligosaccharide mixture at 1:1 at 3% (Gosmos treatment), or EOB (200 μL/g feed) and fumaric acid at 3% combination (Eofumaric treatment).
Fermentation 10 00499 g008
Figure 9. Z-score heatmap of top 20 differentially abundant genera of control vs. Eofumaric at 24 h of incubation.
Fermentation 10 00499 g009
Table 1. Proximate composition and fiber analysis (%) of the total mixed ration.
NutrientTotal Mixed Ration 1
Dry matter66.7
Organic matter93.0
Crude protein13.4
Ether extract4.88
Nonstructural carbohydrates12.7
Neutral detergent fiber62.0
Acid detergent fiber13.8
Acid detergent lignin11.9
1 Contained (DM basis): 60% corn silage, 20% alfalfa hay, and 20% concentrates.
Table 2. Effect of dietary inclusion of galactooligosaccharide, galactooligosaccharide and mannan-oligosaccharide mixture, and essential oil and fumaric acid mixture on in vitro gas, dry matter disappearance, and greenhouse gas production at 24 h of incubation.
Treatment 1GasDMDCH4CO2NH3H2S
Control192.2 a62.3 a9.79 a40.3 a208.2 a933.00 a
Gos205.6 a62.5 a10.49 a42.0 a202.6 a920.5 a
Gosmos196.7 a63.8 a11.78 a48.8 a196.9 a1059.0 a
Eofumaric66.2 b39.7 b0.62 b12.0 b47.9 b225.8 b
SEM12.272.480.9903.3715.7079.04
p value<0.001<0.001<0.001<0.001<0.001<0.001
a,b Means with different superscripts along the same column are significantly (p < 0.05) different. SEM, standard error of means. DMD is dry matter disappearance (%); gas is gas production (mL/g DM); NH3 is ammonia (mmol/g DM); CH4 is methane (mg/g DM); CO2 is carbon dioxide (mg/g DM); H2S is hydrogen sulfide (mmol/g DM).1 Control treatment without any additives, control treatment supplemented with galactooligosaccharide at 3% (Gos treatment), galactooligosaccharide and mannan-oligosaccharide mixture at 1:1 at 3% (Gosmos treatment), or EOB (200 μL/g feed) and fumaric acid at 3% combination (Eofumaric treatment).
Table 3. Effect of dietary inclusion of galactooligosaccharide, galactooligosaccharide and mannan-oligosaccharide mixture, or essential oil and fumaric acid mixture on total and individual volatile fatty acids at 24 h of incubation.
Treatment 1VFAC2C3C2:C3C4C5Iso-C4Iso-C5
Control83.18 a66.518.1 a3.7113.6 ab1.02 b0.52 a0.34 a
Gos82.04 a67.517.7 a3.8913.0 b1.00 b0.47 a0.31 a
Gosmos77.15 ab64.419.4 a3.3214.3 ab1.11 b0.55 a0.37 a
Eofumaric61.81 b67.113.9 b5.8817.1 a1.40 a0.31 b0.21 b
SEM3.331.001.000.4601.000.0010.0010.020
p value0.0470.7780.0050.2070.0380.049<0.0010.004
a,b Means with different superscripts along the same column are significantly (p < 0.05) different. SEM, standard error of means. VFA is volatile fatty acids (mmol/L), C2 is acetate (%), C3 is propionate (%), C4 is butyrate (%), and C5 is valerate (%).1 Control treatment without any additives, the control treatment supplemented with galactooligosaccharide at 3% (Gos treatment), the galactooligosaccharide and mannan-oligosaccharide mixture at 1:1 at 3% (Gosmos treatment), or the EOB (200 μL/g feed) and fumaric acid at 3% combination (Eofumaric treatment).
Table 4. Effect of dietary inclusion of galactooligosaccharide, galactooligosaccharide and mannan-oligosaccharide mixture, or essential oil and fumaric acid mixture on ruminal bacteria and archaea counts at 24 h of incubation.
Treatment 1Bacteria, OTUsArchaea, OTUs
Control91,6355908
GOS88,3135154
Gosmos80,2175383
Eofumaric85,7606098
SEM5122.0386.0
p value0.6800.560
1 Control treatment without any additives, the control treatment supplemented with galactooligosaccharide at 3% (Gos treatment), the galactooligosaccharide and mannan-oligosaccharide mixture at 1:1 at 3% (Gosmos treatment), or the EOB (200 μL/g feed) and fumaric acid at 3% combination (Eofumaric treatment).
Table 5. Effect of dietary inclusion of galactooligosaccharide, galactooligosaccharide and mannan-oligosaccharide mixture, or essential oil and fumaric acid mixture on ruminal microbial abundance.
Treatment 1 SEMp Value
ControlGosGosmosEofumaric
d__Archaea_p__Euryarchaeota5643.549535210.56053247.80.505
d__Bacteria_p__Firmicutes49,124 b48,106 b48,555 b69,934 a3750.00.031
d__Bacteria_p__Patescibacteria1855.0176420261383110.10.198
d__Bacteria_p__Bacteroidota24,921 a2497 a18,891 ab5822 b3231.00.049
d__Bacteria_p__Verrucomicrobiota2337.0 a2023 a1354 ab374.5 b300.40.020
d__Bacteria_p__Spirochaetota1876.0 a1524 ab821.5 ab254.5 b265.80.043
d__Bacteria_p__Desulfobacterota1037.50 a900.0 a916.5 a272.5 b115.90.005
d__Bacteria_p__Proteobacteria4711379132292097573.00.534
d__Bacteria_p__Chloroflexi644.0 b588.5 b754.5 b1241 a105.30.038
d__Bacteria_p__Actinobacteriota2985.5256021573618267.50.276
d__Archaea_p__Thermoplasmatota260.50200.5172.545.039.880.309
d__Bacteria_p__Campilobacterota216.5258.081.528.545.940.256
d__Bacteria_p__Synergistota236.00229.0235.0271.516.140.863
d__Bacteria___202.00 a134.0 ab100.5 ab46.5 b23.450.045
d__Bacteria_p__Planctomycetota615.0499.5603.5326.565.140.448
d__Bacteria_p__Fibrobacterota416.0 a519.0 a265.0 ab0.0 b82.040.043
d__Bacteria_p__Elusimicrobiota140.00 ab156.0 a105.0 ab30.50 b21.370.012
d__Bacteria_p__Bdellovibrionota41.0090.0017.506.0019.840.552
d__Bacteria_p__Cyanobacteria181.5 a140.0 ab46.50 b31.50 b26.030.049
d__Bacteria_p__Acidobacteriota36.5014.519.014.04.530.276
d__Bacteria_p__SAR324_clade_Mari15.026.022.01.54.300.179
d__Bacteria_p__WPS_221.5 a11.5 a16.00.0 b3.180.025
d__Bacteria_p__Deinococcota10.01.00.08.02.930.646
Unassigned24.016.08.00.04.760.376
a,b Means with different superscripts along the same row are significantly (p < 0.05) different. Standard error of means.1 Control treatment without any additives, control treatment supplemented with galactooligosaccharide at 3% (Gos treatment), galactooligosaccharide and mannan-oligosaccharide mixture at 1:1 at 3% (Gosmos treatment), or EOB (200 μL/g feed) and fumaric acid at 3% combination (Eofumaric treatment).
Table 6. Effect of dietary inclusion of galactooligosaccharide, galactooligosaccharide and mannan-oligosaccharide mixture, or essential oil and fumaric acid mixture on ruminal alpha diversity parameters.
Treatment 1ShannonObserved FeaturesFaith Diversity
Control8.47 a510 a43.57 a
Gos8.50 a498 ab43.83 a
Gosmos8.41 ab489 ab40.65 b
Eofumaric8.23 b459 b32.57 c
SEM0.038.251.73
p value0.0420.0500.005
a,b,c Means with different superscripts along the same column are significantly (p < 0.05) different. Standard error of means.1 Control treatment without any additives, control treatment supplemented with galactooligosaccharide at 3% (Gos treatment), galactooligosaccharide and mannan-oligosaccharide mixture at 1:1 at 3% (Gosmos treatment), or EOB (200 μL/g feed) and fumaric acid at 3% combination (Eofumaric treatment).
Table 7. Effect of dietary inclusion of galactooligosaccharide, galactooligosaccharide and mannan-oligosaccharide mixture, or essential oil and fumaric acid mixture on ruminal archaea abundance.
Treatment 1ControlGosGosmosEofumaricSEMp Value
Euryarchaeota_Methanobrevibacter5299463548235500155.60.15
Euryarchaeota_Methanosphaera345 b319 b388 b554 a30.50.003
Thermoplasmatota_Methanomethylophilaceae unresolved38221106.50.19
Thermoplasmatota_Methanomethylophilaceae uncultured genus220 a179 a162 a44 b24.00.02
a,b Means with different superscripts along the same row are significantly (p < 0.05) different. Standard error of means.1 Control treatment without any additives, control treatment supplemented with galactooligosaccharide at 3% (Gos treatment), galactooligosaccharide and mannan-oligosaccharide mixture at 1:1 at 3% (Gosmos treatment), or EOB (200 μL/g feed) and fumaric acid at 3% combination (Eofumaric treatment).
Table 8. Differential abundance of all taxa between control and Eofumaric 1 at 24 h of incubation.
No Base MeanLog2 Fold-Changep ValueAdjusted p Value
1Firmicutes_Catenibacterium2443.494.342.17 × 10−602.69 × 10−58
2Firmicutes_Streptococcus2225.792.014.74 × 10−96.92 × 10⁻⁸
3Firmicutes_Christensenellaceae_R-7_group10,398.991.046.59 × 10−65.45 × 10⁻⁵
4Clostridia_UCG1604.791.263.77 × 10−73.89 × 10⁻⁶
5Vibrio171.7110.911.33 × 10−123.68 × 10⁻¹¹
6Flexilinea896.841.062.30 × 10−50.00
7Firmicutes_Marvinbryantia434.841.223.26 × 10−62.97 × 10⁻⁵
8Firmicutes_Moryella289.581.650.000.00
9Firmicutes_Butyrivibrio407.861.537.61 × 10−77.55 × 10⁻⁶
10Firmicutes_Coprococcus302.622.141.92 × 10−113.96 × 10⁻¹⁰
11Firmicutes_Lachnospira84.501.860.000.02
12Firmicutes_Blautia208.781.458.79 × 10−50.00
13Actinobacteriota_f_Eggerthellaceae515.371.225.71 × 10−64.89 × 10⁻⁵
14Proteobacteria_Escherichia-Shigella59.069.370.010.03
15Firmicutes_Erysipelothrix9.886.790.010.04
16Actinobacteriota_f_Coriobacteriaceae40.212.910.000.01
17F08252379077922956488658833503.30−5.252.96 × 10−282.45 × 10⁻²⁶
18Prevotella2885.14−4.702.66 × 10−946.59 × 10−92
19Pedosphaeraceae382.92−4.412.06 × 10−171.02 × 10⁻¹⁵
20Fibrobacter196.05−11.077.27 × 10−121.80 × 10⁻¹⁰
21Treponema634.63−3.732.84 × 10−161.01 × 10⁻¹⁴
22Desulfovibrio512.92−2.336.96 × 10−99.59 × 10⁻⁸
23Proteobacteria_Ruminobacter497.34−5.272.30 × 10−251.43 × 10⁻²³
24Bacteroidales_BS11_gut_group425.27−3.954.12 × 10−171.70 × 10⁻¹⁵
25Lachnospiraceae_Anaerosporobacter216.51−11.218.49 × 10−132.63 × 10⁻¹¹
26Bacteroidales_UCG170.29−10.871.69 × 10−113.81 × 10⁻¹⁰
27Firmicutes_Selenomonas375.48−1.040.000.00
28Bacteroidota_Prevotellaceae_UCG437.52−3.048.02 × 10−111.42 × 10⁻⁹
29Proteobacteria_Endozoicomonas195.91−5.280.000.01
30Firmicutes_f_Dethiobacteraceae_uncultured75.67−9.709.41 × 10−91.23 × 10⁻⁷
31Thermoplasmatota_f_Methanomethylophilaceae_uncultured124.29−2.330.000.01
32Verrucomicrobiota_c_Kiritimatiellae747.83−1.903.83 × 10−84.32 × 10⁻⁷
33d__Bacteria_176228405313213614556120.23−2.091.19 × 10−59.24 × 10⁻⁵
34Bacteroidota_o_Bacteroidales116.48−3.599.60 × 10−67.68 × 10⁻⁵
35Firmicutes_Rummeliibacillus42.23−8.850.000.00
36Planctomycetota_CPla-4_termite_group113.96−1.650.000.01
37Spirochaetota_Sediminispirochaeta106.32−10.191.02 × 10−91.69 × 10⁻⁸
38Bacteroidota_f_Marinilabiliaceae_uncultured92.17−9.981.02 × 10−81.26 × 10⁻⁷
39Firmicutes_Colidextribacter157.15−2.361.48 × 10−50.00
40Bacteroidota_Prevotellaceae_UCG259.39−2.945.19 × 10−119.91 × 10⁻¹⁰
41Bacteroidota_Prevotellaceae_UCG52.05−5.250.000.00
42Firmicutes_Lachnospiraceae_ND3007_group144.66−1.560.000.01
43Proteobacteria_Succinimonas42.61−3.460.000.00
44Proteobacteria_Shimia61.75−4.930.000.01
45Bacteroidota_Bacteroidales_RF16_group38.03−8.702.65 × 10−62.52 × 10⁻⁵
46Firmicutes_Izemoplasmatales48.96−9.072.16 × 10−72.33 × 10⁻⁶
47Proteobacteria_o_Rhodospirillales_uncultured73.25−2.744.42 × 10−50.00
48Verrucomicrobiota_vadinBE80.70−9.793.53 × 10−95.47 × 10⁻⁸
49Spirochaetota_Leptospira82.88−2.250.000.01
50Firmicutes_Clostridia_vadinBB60_group109.80−1.410.010.04
51Bacteroidota_Prevotellaceae_YAB2003_group35.88−8.623.36 × 10−62.97 × 10⁻⁵
52Proteobacteria_Kordiimonas40.88−5.910.000.01
53Proteobacteria_Kiloniella18.30−7.650.000.02
54Firmicutes_Anaeroplasma53.73−6.041.35 × 10−50.00
55Bdellovibrionota_c_Oligoflexia15.79−7.430.000.02
56Firmicutes_f_Erysipelatoclostridiaceae62.89−9.432.02 × 10−82.38 × 10⁻⁷
57Elusimicrobiota_Elusimicrobium11.39−6.970.010.03
58Proteobacteria_Candidatus_Endobugula28.65−8.300.000.00
59Cyanobacteria_Gastranaerophilales74.50−2.140.000.00
60Verrucomicrobiota_Victivallaceae29.82−8.352.08 × 10−50.00
61d__Bacteria;p__WPS-2;c__WPS-2;o__WPS-2;f__WPS-2;g__WPS-2172600815171510.30−6.820.010.04
62Bacteroidota_f_Prevotellaceae10.26−6.810.010.04
63Proteobacteria_f_Methyloligellaceae_uncultured11.84−7.020.010.03
1 Control treatment without any additives, control treatment supplemented with fumaric acid at 3% combination (Eofumaric treatment).
Disclaimer/Publisher’s Note: The statements, opinions and data contained in all publications are solely those of the individual author(s) and contributor(s) and not of MDPI and/or the editor(s). MDPI and/or the editor(s) disclaim responsibility for any injury to people or property resulting from any ideas, methods, instructions or products referred to in the content.

