Article

Optimizing the Brewing Process, Metabolomics Analysis, and Antioxidant Activity Analysis of Complexed Hongqu Rice Wine with Kiwiberry

by
Mengze Wang
1,2,
Yuxin Liu
1,
Xing Guo
2,
Yuping Ding
1,* and
Dejiang Liu
1,*
1
College of Biology and Agriculture, Jiamusi University, Jiamusi 154007, China
2
Yichun Branch of Heilongjiang Academy of Forestry Sciences, Yichun 153000, China
*
Authors to whom correspondence should be addressed.
Fermentation 2024, 10(10), 494; https://doi.org/10.3390/fermentation10100494
Submission received: 9 September 2024 / Revised: 22 September 2024 / Accepted: 23 September 2024 / Published: 26 September 2024
(This article belongs to the Topic Fermented Food: Health and Benefit)

Abstract

:
Hongqu rice wine is a traditional Chinese yellow wine produced from a single ingredient. To enhance the competitiveness of the product and better adapt to market development trends, the development of a complexed Hongqu rice wine using a variety of ingredients is necessary to enhance the nutritional value of the product and diversify its flavor. This study explored production technology for the development of a complexed Hongqu rice wine using kiwiberry as the raw material. The mixed fermentation process was optimized using single-factor experiments and response surface methodology (RSM). The optimal conditions were a juice addition time of 93 h, a fermentation temperature of 31 °C, and a juice addition amount of 75 g/100 g. Under these conditions, the complexed Hongqu rice wine had an alcohol content of 8.7% vol, a total phenolic content of 0.42 mg GAE/mL, and a total flavonoid content of 0.32 mg CE/mL. In total, 27 metabolites were identified. The relative levels of 15 metabolites, including quercetin-3-glucoside and rutin, increased significantly after the adding of the kiwiberry (VIP > 1.0, p < 0.05, FC > 2). Antioxidant activity experiments showed that the Hongqu rice wine had notable antioxidant capacity and that adding the kiwiberry significantly enhanced this capacity. Additionally, the complexed Hongqu rice wine exhibited hypoglycemic and bile acid-binding properties. It achieved 78.68 ± 0.44% inhibition of α-amylase and 58.02 ± 0.50% inhibition of α-glucosidase. The binding activities with sodium glycocholate, sodium cholate, and sodium taurocholate were 40.25 ± 0.64%, 49.08 ± 1.05%, and 60.58 ± 0.80%, respectively. Consequently, a complexed Hongqu rice wine rich in quercetin-3-glucoside and rutin, with notable antioxidant activities, was developed. This wine has potential applications in functional food development.

1. Introduction

Hongqu rice wine is a traditional Chinese yellow rice wine made from glutinous rice and fermented with Hongqu. It features a bright red color, a delicate sweetness, and a mellow flavor [1]. Hongqu contains substances such as Monascus pigments and flavonoids, which promote blood circulation, alleviate stasis, and exhibit antioxidant effects [2]. Hongqu is also known to contain high levels of lovastatin, which can lower blood lipid levels [3]. Currently, Hongqu is primarily used as an additive and fermentation agent in medical and food products. Many health products on the market include Hongqu as an active ingredient. Chen et al. used Hongqu as a fermenting agent and glutinous rice as a main raw material to compare the effects of different types of koji on Hongqu rice wine. They identified the key flavor compounds in Hongqu rice wine as 3-methylbutanol, isobutanol, and phenylethanol [4]. Que et al. found that the antioxidant activity of yellow rice wine is strongly correlated with its total phenolic content. Cinnamic acid and (+)-catechin are the main contributors to phenolic compounds and are highly correlated with antioxidant activity (r2 > 0.75) [5]. However, traditional Hongqu rice wine is fermented from a single raw material, resulting in a monotonous flavor and relatively low nutritional value. By contrast, complexed Hongqu rice wine is fermented from a combination of raw materials, offering richer nutrition, superior quality, and a more robust flavor. Currently, there are few studies on complexed Hongqu rice wine, highlighting the urgent need to develop and refine a mature production process and technology to meet the demand for healthy beverages.
Kiwiberry (Actinidia arguta) is a large deciduous vine of the Actinidia genus. It is dioecious and prefers fertile soil with ample water [6]. Kiwiberry is increasingly used in medicine and food, owing to its rich nutritional composition and health benefits [7]. Polyphenols and flavonoids are the major active components of kiwiberry [8]. Kiwiberry has various beneficial effects, including enhancing immunity; preventing diseases; and providing anti-cancer, anti-inflammatory, antioxidant, and blood sugar-lowering properties, making it an excellent raw material for functional foods [9,10,11,12,13]. Flavonoids are plant pigments with multiple health benefits. Because the human body cannot produce them, they must be obtained from plant sources [14]. Zhang et al. compared the total phenolic and flavonoid contents among different kiwiberry varieties and found a significant positive correlation between these contents and antioxidant activity [15]. Consequently, kiwiberry exhibits potent antioxidant activity because of its flavonoid content. Additionally, studies have shown that kiwiberry provides various health benefits, including hypoglycemic and antihypertensive effects [16].
Despite recent studies demonstrating the nutritional value and health benefits of kiwiberry and Hongqu rice wine, there has been no research on their combination. Kiwiberry has a thin skin and soft texture, limiting its shelf life. Therefore, there is an urgent need to develop products that can extend its shelf life [17]. Increasing attention is being paid to the nutritional value of raw materials, with a growing demand for pure, natural antioxidant products. Therefore, kiwiberry can serve as a raw material for healthy foods and be incorporated into other functional products to develop new items with high antioxidant activity. This study is the first to use kiwiberry as a raw material in Hongqu rice wine production, adding kiwiberry juice to the fermentation process, optimizing the mixed fermentation, and assessing its nutritional value to create a uniquely flavored functional beverage. We aimed to enhance the nutritional value of Hongqu rice wine and effectively utilize kiwiberry. Additionally, this study provides new insights into the sustainable development of the kiwiberry industry.

2. Materials and Methods

2.1. Materials and Chemicals

Hongqu was purchased from Gutian Hongxin Winery Co., Ltd. (Ningde, China). Glutinous rice was purchased from Heilongjiang Canadian Natural Ecological Agriculture Co., Ltd. (Harbin, China). Kiwiberry was provided by the Agricultural and Forestry Experimental Base of Jiamusi University.
Folin–Ciocalteu reagent, 1,1-diphenyl-2-picrylhydrazyl (DPPH), and α-glucosidase were purchased from Shanghai Yuanye Biotechnology Co., Ltd. (Shanghai, China). 2,2′-Azino-bis (3-ethylbenzothiazoline-6-sulphonic acid) (ABTS) was purchased from Shanghai Merck Biochemical Technology Co., Ltd. (Shanghai, China). α-Amylase was purchased from Shanghai Aladdin Reagent Co., Ltd. (Shanghai, China). p-Nitrophenyl-α-D-glucopyranoside (PNPG) and sodium cholate were purchased from Shanghai Bide Pharmaceutical Technology Co., Ltd. (Shanghai, China). Sodium taurocholate and sodium glycocholate were purchased from Nanjing Dulei Biotechnology Co., Ltd. (Nanjing, China). HPLC-grade methanol, acetonitrile, and isopropanol were purchased from Thermo Fisher Scientific (Cambridge, MA, USA). HPLC-grade formic acid was purchased from Honeywell International (Charlotte, NC, USA). Apigenin, biochanin A, butin, catechin, dihydrokaempferol, epicatechin, epigallocatechin, eriodictyol, ferulic acid, gallocatechin, genistein, isorhamnetin, vitexin, kaempferide, kaempferol, luteolin, luteolin-7-O-glucoside, naringenin, naringin, p-Coumaric acid, phenylalanine, quercetin, quercetin-3-glucoside, quercitrin, rutin, sakuranetin, and taxifolin were purchased from Shanghai Sigma Aldrich Trading Co. (Shanghai, China).

2.2. The Preparation of Complexed Hongqu Rice Wine

Based on preliminary experiments, the fermentation process for Hongqu rice wine was optimized with 120 g/kg Hongqu rice, a saccharification fermentation temperature of 35 °C, and a material-to-water ratio of 1:4.5. The mixed fermentation process involved adding kiwiberry juice during Hongqu rice wine fermentation and was optimized based on these conditions. The kiwiberry was centrifuged at 6000× g for 10 min to obtain the supernatant, which was then pasteurized at 60 °C for 30 min. The pasteurized juice was added to the Hongqu rice wine in a specific proportion, and the temperature was adjusted to optimal levels for mixed fermentation. After 7 days of static fermentation, the mixture was centrifuged at 6000× g for 10 min. The supernatant was then filtered through a 0.45 μm membrane to remove microorganisms and collected into sterile bottles for final packaging.

2.2.1. Single-Factor Experimental Design

A preliminary investigation into the factors affecting the taste and quality of fermented complexed Hongqu rice wine was conducted using single-factor experiments on three variables: juice addition times (0, 24, 48, 72, 96, and 120 h), fermentation temperatures (20, 25, 30, 35, and 40 °C), and juice addition amounts (CK, 25, 50, 75, and 100 g/100 g). The experiments were conducted using the control variable method. Alcohol content and sensory scores were used as measurement indices.

2.2.2. Response Surface Experimental Design

A Box–Behnken design (BBD) was employed to optimize fermentation, involving three factors, each at three levels. Based on the single-factor experiment results, the response surface methodology was selected to determine the optimal fermentation conditions for the complexed Hongqu rice wine. The BBD assessed the combined effects of the three independent variables. The design involved 12 experimental runs, with the central point (5 replicates) used to optimize the fermentation conditions. The independent variables were set at three levels, coded −1, 0, and +1, as shown in Table 1. The dependent variables measured were the alcohol content (Y1) and sensory score (Y2). The independent variable levels and the design matrix are detailed in Table 2.

2.3. Alcohol Content

The alcohol content was measured following the GB/T 15038–2006 standard “Analytical Methods of Wine and Fruit Wine” [18].

2.4. Sensory Score

Based on a literature review, ten sensory evaluation panelists consisting of five men and five women were trained in the analytical methods for assessing complexed Hongqu rice wine. They evaluated the wine based on the following properties: aroma (0–20 points), clarity (0–20 points), color (0–20 points), taste (0–20 points), and typicality (0–20 points). Detailed rules are provided in Table S1.

2.5. Analysis of Major Nutritional Components

The total polyphenol and flavonoid contents in the Hongqu rice wine were analyzed both before (RW) and after adding kiwiberry (CW). The total polyphenol content was measured using the Folin–Ciocalteu reagent [19]. The results were expressed as millimolar gallic acid equivalents (GAEs) based on the linear regression from the gallic acid calibration curve. The total flavonoid content was measured using a colorimetric assay, following the method of Pisani et al. [20] with modifications. The results were expressed as millimolar rutin equivalents (CEs) based on the linear regression from the rutin calibration curve.

2.6. Metabolic Analysis

2.6.1. Sample Treatment

Metabolites from the RW and CW were extracted using ultrasonic-assisted solvent extraction [21]. To 100 μL of each sample, 200 μL of extraction solvent and 10 μL of internal standard (10 μg/mL) were added. The mixture was vortexed for 30 s, sonicated in a water bath for 30 min, and centrifuged (14,000× g, 10 °C, 20 min). The supernatant was transferred to an Ostro 25 mg 96-well plate and filtered using a positive pressure device. The wells were eluted with 200 μL of extraction solvent, and the eluate was stored at −80 °C [22].

2.6.2. Sample Identification and Quantification

Metabolite quantification in the RW and CW was conducted using an Agilent 1290 UPLC system (Santa Clara, CA, USA) coupled with a SCIEX 5500 QTRAP mass spectrometer (Framingham, MA, USA). The metabolites were separated using a Waters ACQUITY UPLC HSS T3 column (2.1 mm × 100 mm, 1.8 μm, Milford, MA, USA) at 40 °C. The mobile phase consisted of 0.1% formic acid in water (A) and acetonitrile with formic acid (B), with a flow rate of 0.3 mL/min. The injection volume was 3 μL. Gradient elution was performed as follows: 0–3 min, 5–20% B; 3–9 min, 20–45% B; 9–11 min, 45–95% B; 11–13 min, 95% B; 13–13.1 min, 95–10% B; and 13.1–15 min, 10% B.
Mass spectrometry analysis was conducted in the positive and negative ion modes using a 5500 QTRAP mass spectrometer (SCIEX). The ESI source conditions for the positive ion mode were as follows: source temperature: 550 °C; Ion Source Gas1 (Gas1): 55; Ion Source Gas2 (Gas2): 50; Curtain Gas (CUR): 30; ISVF: 5500 V. For the negative ion mode, the conditions were as follows: source temperature: 550 °C; Ion Source Gas1 (Gas1): 55; Ion Source Gas2 (Gas2): 50; Curtain Gas (CUR): 30; ISVF: −4500 V. Detection of analyte ion pairs was performed in the MRM mode, with the ion-pair information for all target substances listed in Table S2. The retention times for metabolite identification in the RW and CW were calibrated using the standards for 38 target substances [23]. The calibration curves for the 38 standardized compounds are detailed in Table S3.

2.7. In Vitro Antioxidant Activity Assays

2.7.1. Determination of DPPH Radical Scavenging Activity

The method used was adapted from Yang et al. [24]. Vitamin C (VC) was the positive control. In total, 1 mL of the sample was incubated with 2 mL of DPPH solution in the dark for 20 min. The absorbance measured at 517 nm was recorded as As. The absorbance of the sample mixed with ethanol was denoted as Ai, and the absorbance of ethanol mixed with DPPH solution was denoted as Ao. The scavenging rate was calculated using Formula (1):
Scavenging   rate   ( % ) = [ 1 A s A i A o ] × 100

2.7.2. Determination of ABTS Radical Scavenging Activity

The method used was adapted from Blaszczak et al. [25]. VC was the positive control. In total, 0.1 mL of the sample was incubated with 4.9 mL of ABTS stock solution in the dark for 10 min. The absorbance measured at 734 nm was recorded as As. The absorbance of the sample mixed with ethanol was denoted as Ai, and the absorbance of ethanol mixed with the ABTS solution was denoted as Ao. The scavenging rate was calculated using Formula (1).

2.7.3. Determination of Hydroxyl Radical (OH) Scavenging Activity

The method used was adapted from Liu et al. [26]. VC was the positive control. In total, 2 mL of ferrous sulfate solution and 2 mL of salicylic acid solution were mixed, followed by adding 2 mL of the sample and 2 mL of H2O2 solution. The reaction was conducted at 37 °C for 30 min, and the absorbance measured at 510 nm was recorded as As. The absorbance of the sample mixed with H2O was denoted as Ai, and the absorbance of the reaction solution mixed with H2O was denoted as Ao. The scavenging rate was calculated using Formula (1).

2.7.4. Determination of Fe3+ Reducing Power (TCA)

The method used was adapted from Que et al. [5]. VC was the positive control. In total, 1 mL of the sample, 2.5 mL of PBS buffer (pH 6.6), and 2.5 mL of potassium ferricyanide solution were mixed and incubated at 50 °C for 20 min. After the adding of 2.5 mL of trichloroacetic acid solution and allowing of the mixture to stand for 10 min, 2.5 mL of the supernatant was mixed with 0.5 mL of ferric chloride solution and 2.5 mL of H2O. The absorbance was measured at 700 nm after 5 min. The absorbance of the sample mixed with the reaction solution was denoted as As, and the absorbance of the sample mixed with ethanol was denoted as Aj. The reducing power was calculated using Formula (2):
Fe 3 + reducing   capacity   ( A ) = A s A j

2.8. In Vitro Assay for the Inhibition of Key Enzymes Involved in Glucose and Lipid Metabolism

2.8.1. Determination of α-Amylase Inhibition Rate

The method used was adapted from Sylla et al., with acarbose as the positive control [27]. In total, 0.1 mL of the sample, 0.1 mL of α-amylase solution (1 U/mL), and 0.1 mL of soluble starch solution were mixed and incubated at 37 °C for 6 min. The reaction was terminated by adding 0.1 mL of DNS solution, followed by a boiling water bath for 5 min. After cooling to room temperature, the volume was adjusted to 5 mL with H2O, and the absorbance measured at 540 nm was recorded as As. The enzyme solution was replaced with PBS buffer (pH 6.8) for the absorbance control (Ai), and the sample was replaced with H2O for the absorbance void (Ao). The absorbance of the PBS buffer mixed with H2O was denoted as Ao’. The inhibition rate was calculated using Formula (3):
Inhibition   rate   ( % ) = [ 1 A s   A i A o A o , ]

2.8.2. Determination of α-Glucosidase Inhibition Rate

The method used was adapted from Zhu et al., with acarbose as the positive control [28]. In total, 0.1 mL of the sample, 0.1 mL of α-glucosidase solution (1 U/mL), and 0.1 mL of PNPG solution were mixed and incubated at 37 °C for 20 min. The reaction was terminated by adding 3 mL of sodium carbonate solution, and the absorbance measured at 405 nm was recorded as As. The enzyme solution was replaced with PBS buffer (pH 6.8) for the absorbance control (Ai), and the sample was replaced with H2O for the absorbance void (Ao). The absorbance of the PBS buffer mixed with H2O was denoted as Ao’. The inhibition rate was calculated using Formula (3).

2.9. Bile Acid Binding Capacity

The method used was adapted from Li et al. [29]. The standard curves for three bile acid standard compounds were first constructed. In total, 1 mL of the sample, 1 mL of 0.01 M HCl, and 3 mL of pepsin were added to a 10 mL test tube and incubated in a 37 °C shaker at 120 rpm for 1 h to simulate gastric digestion. Next, 4 mL of pancreatin was added, and the pH was adjusted to 6.3 with 0.1 M NaOH solution. The mixture was further incubated in a 37 °C shaker at 120 rpm for 1 h to simulate intestinal digestion. In total, 4 mL of each bile acid stock solution was added to separate test tubes, and the mixtures were incubated in a 37 °C shaker at 120 rpm for 1 h. After centrifugation at 4000 rpm for 20 min, 2 mL of the supernatant was collected, and the absorbance was measured at 387 nm. The bile acid content in the sample was determined using the linear regression equation. The calibration curves for the three bile acid standard compounds are shown in Figure S1. The binding rate was calculated using Formula (4):
Binding   rate   ( % ) = C o   C i C o × 100
Ci: mass concentration of residual cholate after sample addition (mM); Co: mass concentration of original cholate (mM).

2.10. Data Statistics and Analysis

Analysis of variance (ANOVA) was performed with GraphPad Prism 10, and bar charts were created. Response surface experiments were designed and analyzed with Design Expert 12.0. Principal component analysis (PCA) and orthogonal partial least squares discriminant analysis (OPLS-DA) were conducted with MetaboAnalyst 6.0.

3. Results

3.1. Process Optimization

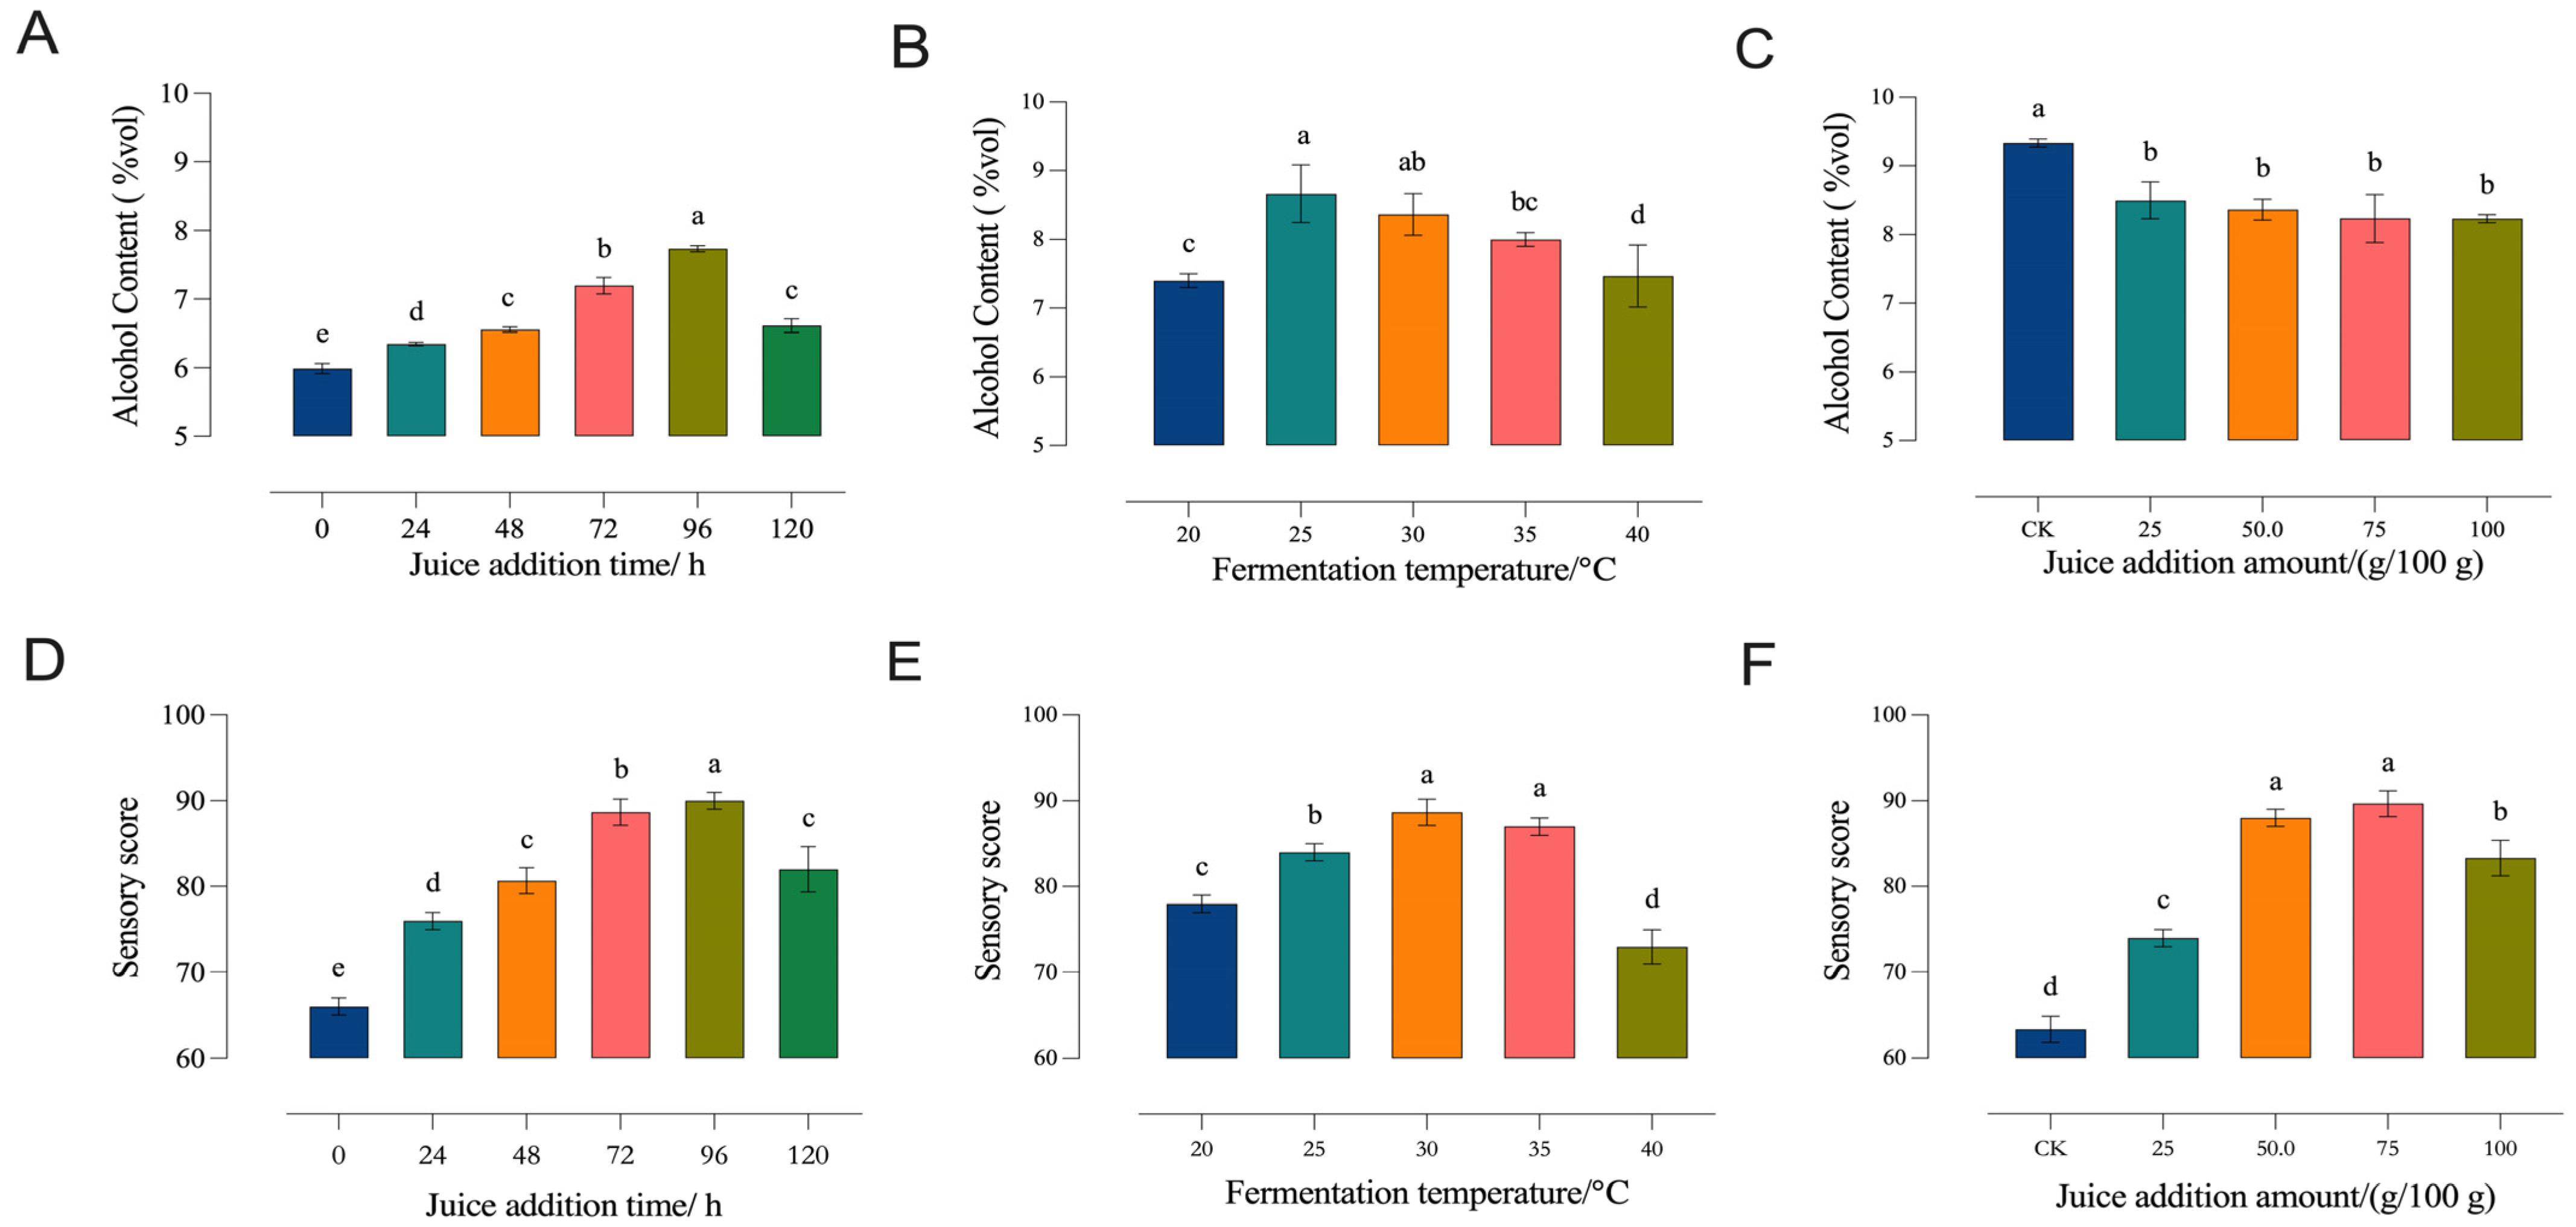
3.1.1. Single-Factor Experiments

(a)
Juice Addition Time
The juice addition time significantly impacted the fermentation of the Hongqu rice wine by affecting starch saccharification and alcohol fermentation, producing metabolites that influence the wine’s quality. The alcohol content (Figure 1A) and sensory scores (Figure 1D) initially increased and then decreased with longer juice addition times (p < 0.05). The peak alcohol content and sensory scores were observed with a juice addition time of 96 h, indicating that this duration is optimal for further experiments.
(b)
Fermentation Temperature
Fermentation relies on the metabolic activities of microorganisms and enzymes, each having an optimal temperature range. Therefore, temperature significantly affected the fermentation process. As the fermentation temperature increased, the alcohol content (Figure 1B) and sensory scores (Figure 1E) initially rose and then declined (p < 0.05). The highest sensory rating was observed at 30 °C, indicating that this temperature is suitable for further experiments.
(c)
Juice Addition Amount
Adding kiwiberry juice affected the product’s flavor, taste, and nutritional value, with a negligible effect on alcohol content (Figure 1C) (p > 0.05). Increasing the amount of added juice initially improved the sensory score (Figure 1F), but further increases eventually decreased the score (p < 0.05). The optimal sensory rating was achieved with the addition of 75 g/100 g juice, indicating that this amount is suitable for subsequent experiments.

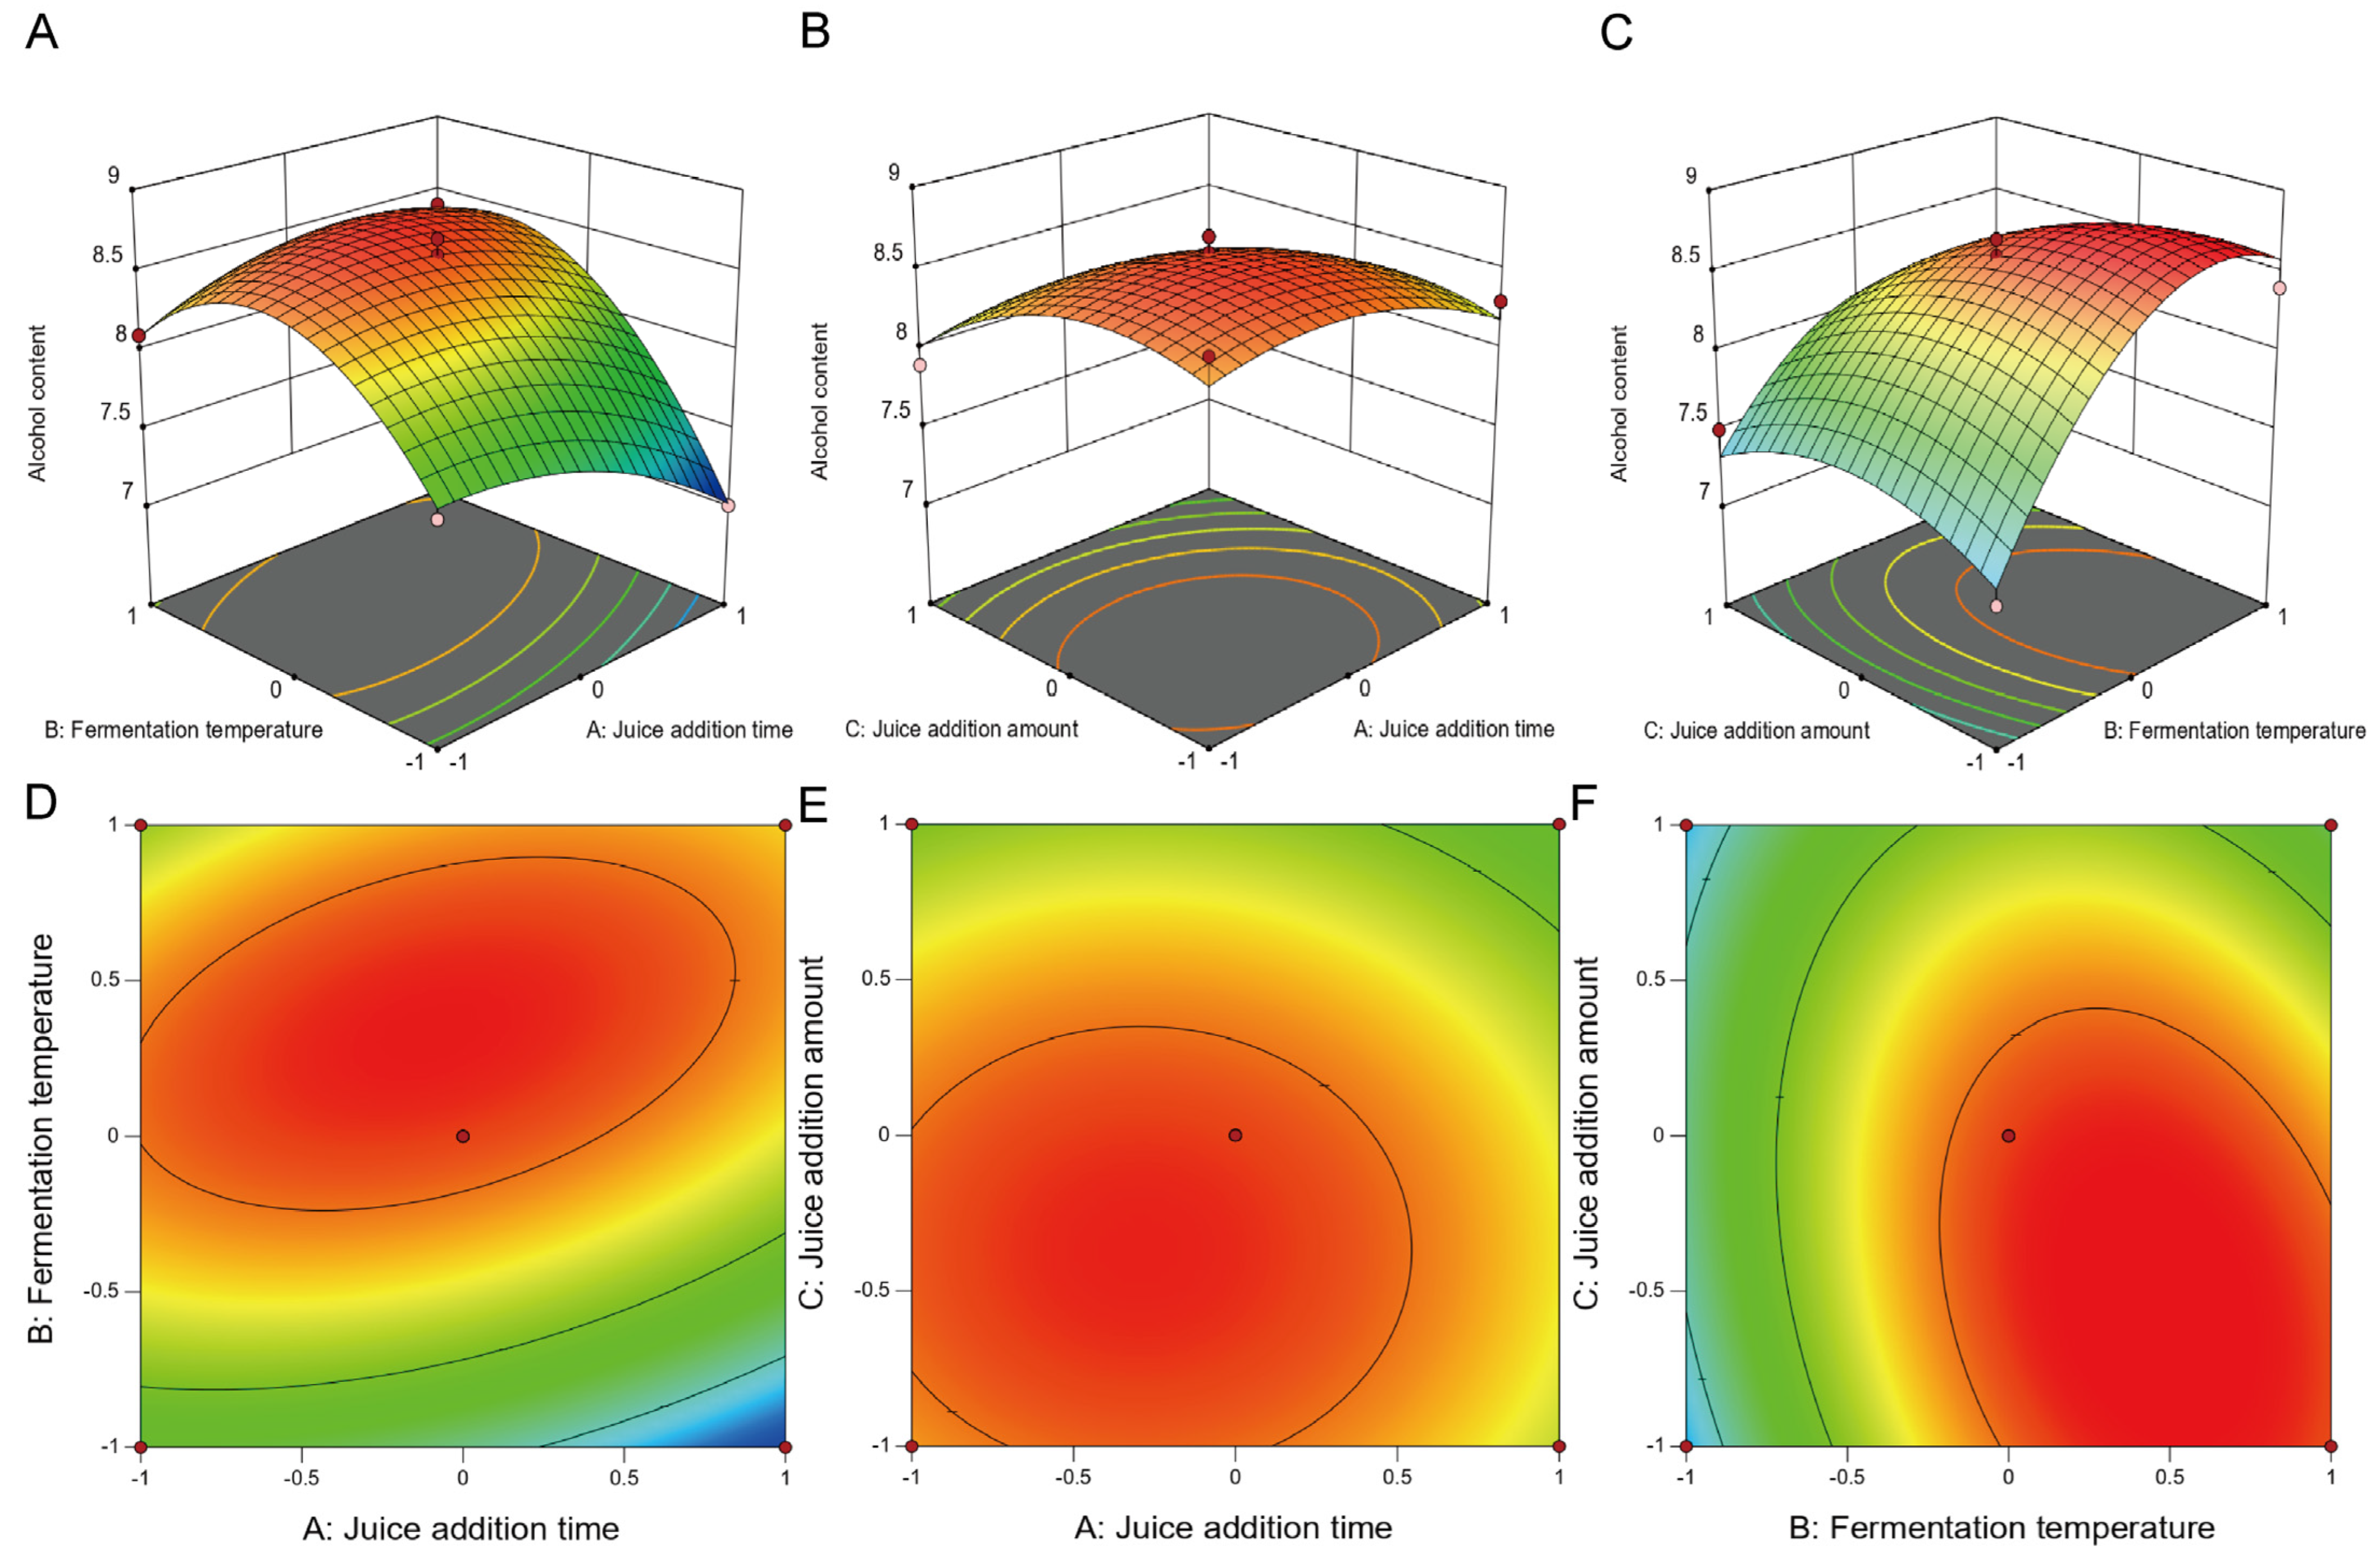
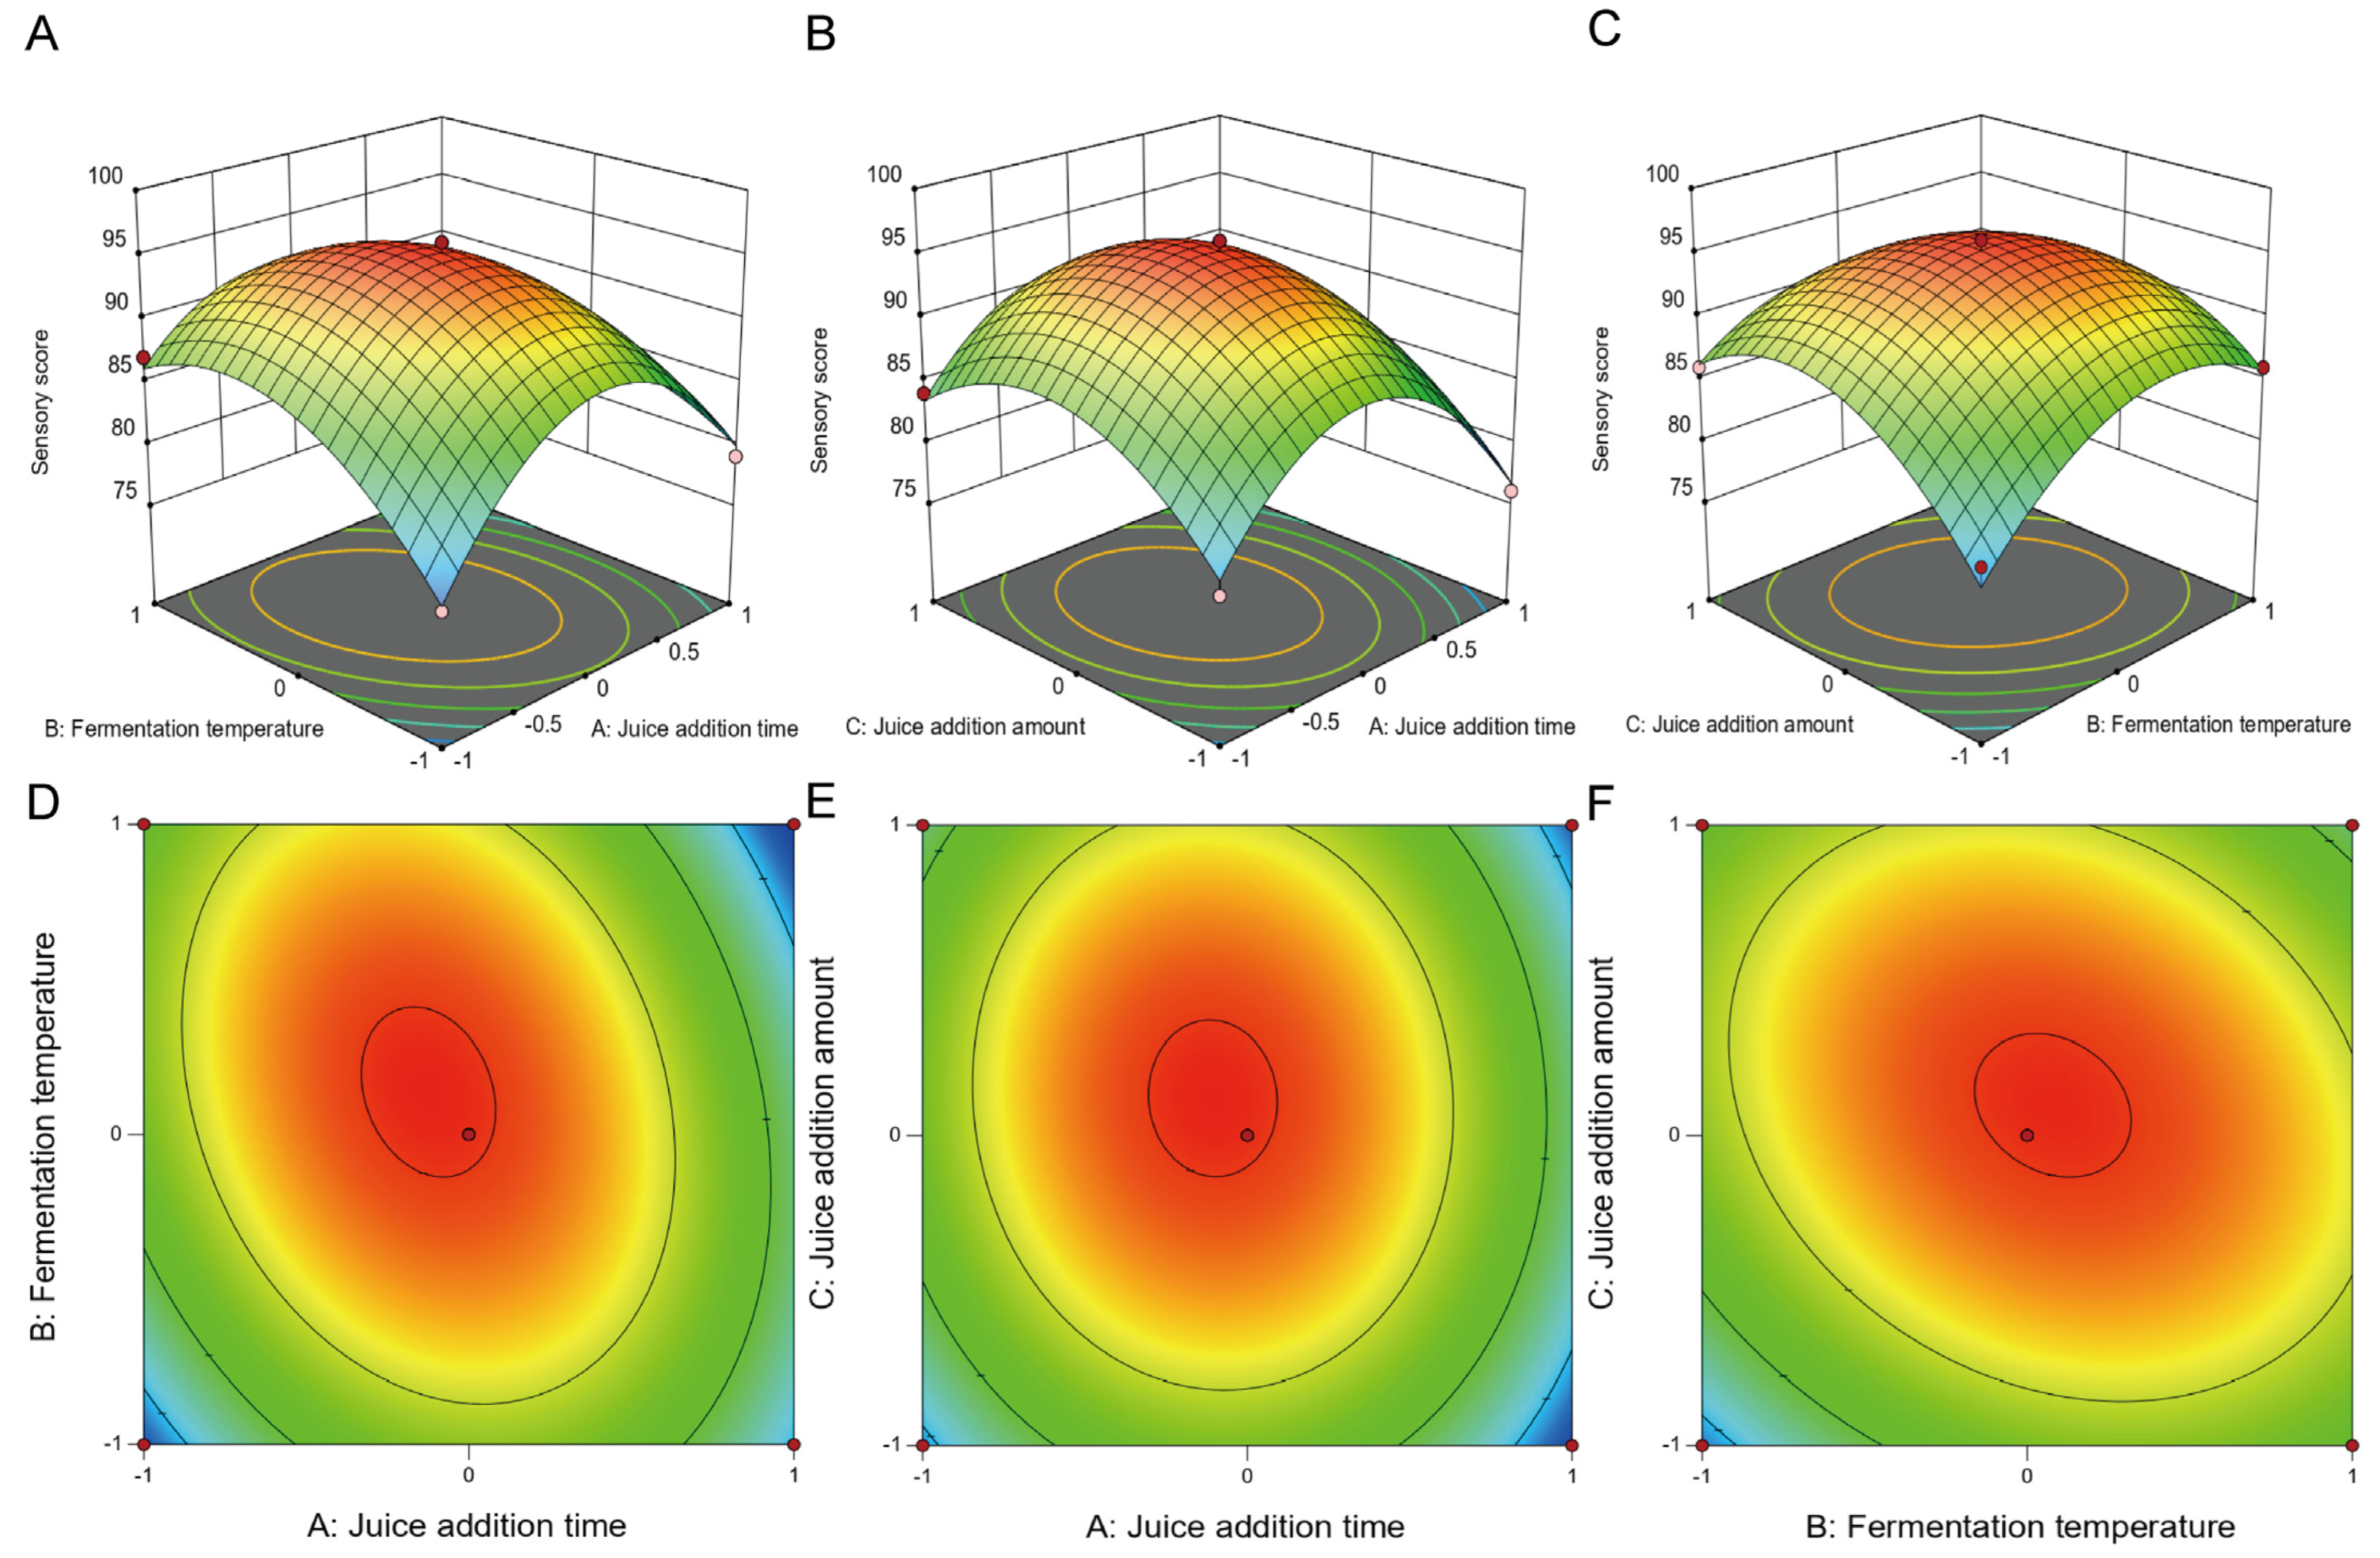
3.1.2. Fitting the Response Surface Models

Based on the results of the single-factor experiments, the response surface methodology was used with Design-Expert 13 to optimize the mixed fermentation process of complexed Hongqu rice wine. The ANOVA is detailed in Table 3, showing that the significance tests for the regression models are significant (p < 0.01) while the lack-of-fit terms are insignificant (p > 0.05), confirming the model’s reliability.
The regression analysis yielded the following equations for Y1 and Y2:
Y1 = 8.6 − 0.125A + 0.4125B − 0.2125C + 0.25AB − 0.225BC − 0.2125A2 − 0.5875B2 − 0.2875C2
Y2 = 95.2 − 2A − 1.13B − 1.38C − 3.25AB − 0.75AC − 2.5BC − 39.85A2 − 5.6B2 − 6.1C2
(a)
RSM Model for Alcohol Content
The gradient of the 3D response surface plots indicates how the variables affect the response values. These plots visually depict the impact of the juice addition time, fermentation temperature, and juice quantity on alcohol content. Figure 2A–C show that alcohol content initially increased and then decreased with changes in juice addition time and fermentation temperature. An optimal fermentation temperature enhances Monascus activity, improving sugar-to-alcohol conversion efficiency and increasing the product’s alcohol content.
The 2D contour plots show the interactions between the factors. The elliptical contours between the juice addition time and fermentation temperature in Figure 2D–F indicate significant interactions. Similarly, the elliptical contours for the fermentation temperature versus the juice addition amount suggest significant interactions, consistent with the variance analysis results.
(b)
RSM model for Sensory Score
Figure 3A–C show an initial increase followed by a decrease in sensory scores with changes in juice addition time, fermentation temperature, and juice addition amount, indicating significant variation. This suggests that the timing and quantity of juice addition, as well as the fermentation temperature, are crucial in shaping the sensory profile of the product. Figure 3D–F show significant interactions between the juice addition time and fermentation temperature, as well as between the fermentation temperature and juice addition amount. By contrast, the nearly circular contours between the juice addition time and juice addition amount suggest a lack of significant interaction, consistent with the variance analysis findings.

3.1.3. Validation and Verification of the Optimized Conditions

Using the regression equations from the established models, the optimal process parameters were identified as a juice addition time of 93 h, a fermentation temperature of 31 °C, and a juice addition amount of 75 g/100 g. Verification experiments with these parameters yielded a product with an alcohol content of 8.7%vol and a sensory score of 95. These results closely align with the predicted values, confirming the model’s accuracy. The resulting complexed Hongqu rice wine exhibited a rich aroma and well-balanced taste, making it an ideal candidate for further research.

3.2. Analysis of Main Functional Components in Complexed Hongqu Rice Wines

Research shows that polyphenols and flavonoids are key functional components of kiwiberry, crucial for their biological activities and effects on a product’s efficacy and safety. Comparing the polyphenol and flavonoid contents between Hongqu rice wine and complexed Hongqu rice wine directly reflects their health benefits. The polyphenol contents in the RW and CW were 0.26 ± 0.02 mg GAE/mL and 0.42 ± 0.03 mg GAE/mL, respectively (Figure 4A), while the flavonoid contents were 0.06 ± 0.01 mg CE/mL and 0.32 ± 0.01 mg CE/mL, respectively (Figure 4B). The polyphenol and flavonoid contents in the CW were 1.7 and 5.2 times higher than those in the RW, respectively. This increase in content suggests that adding kiwiberry enhances the levels of these functional components in the complexed Hongqu rice wine.

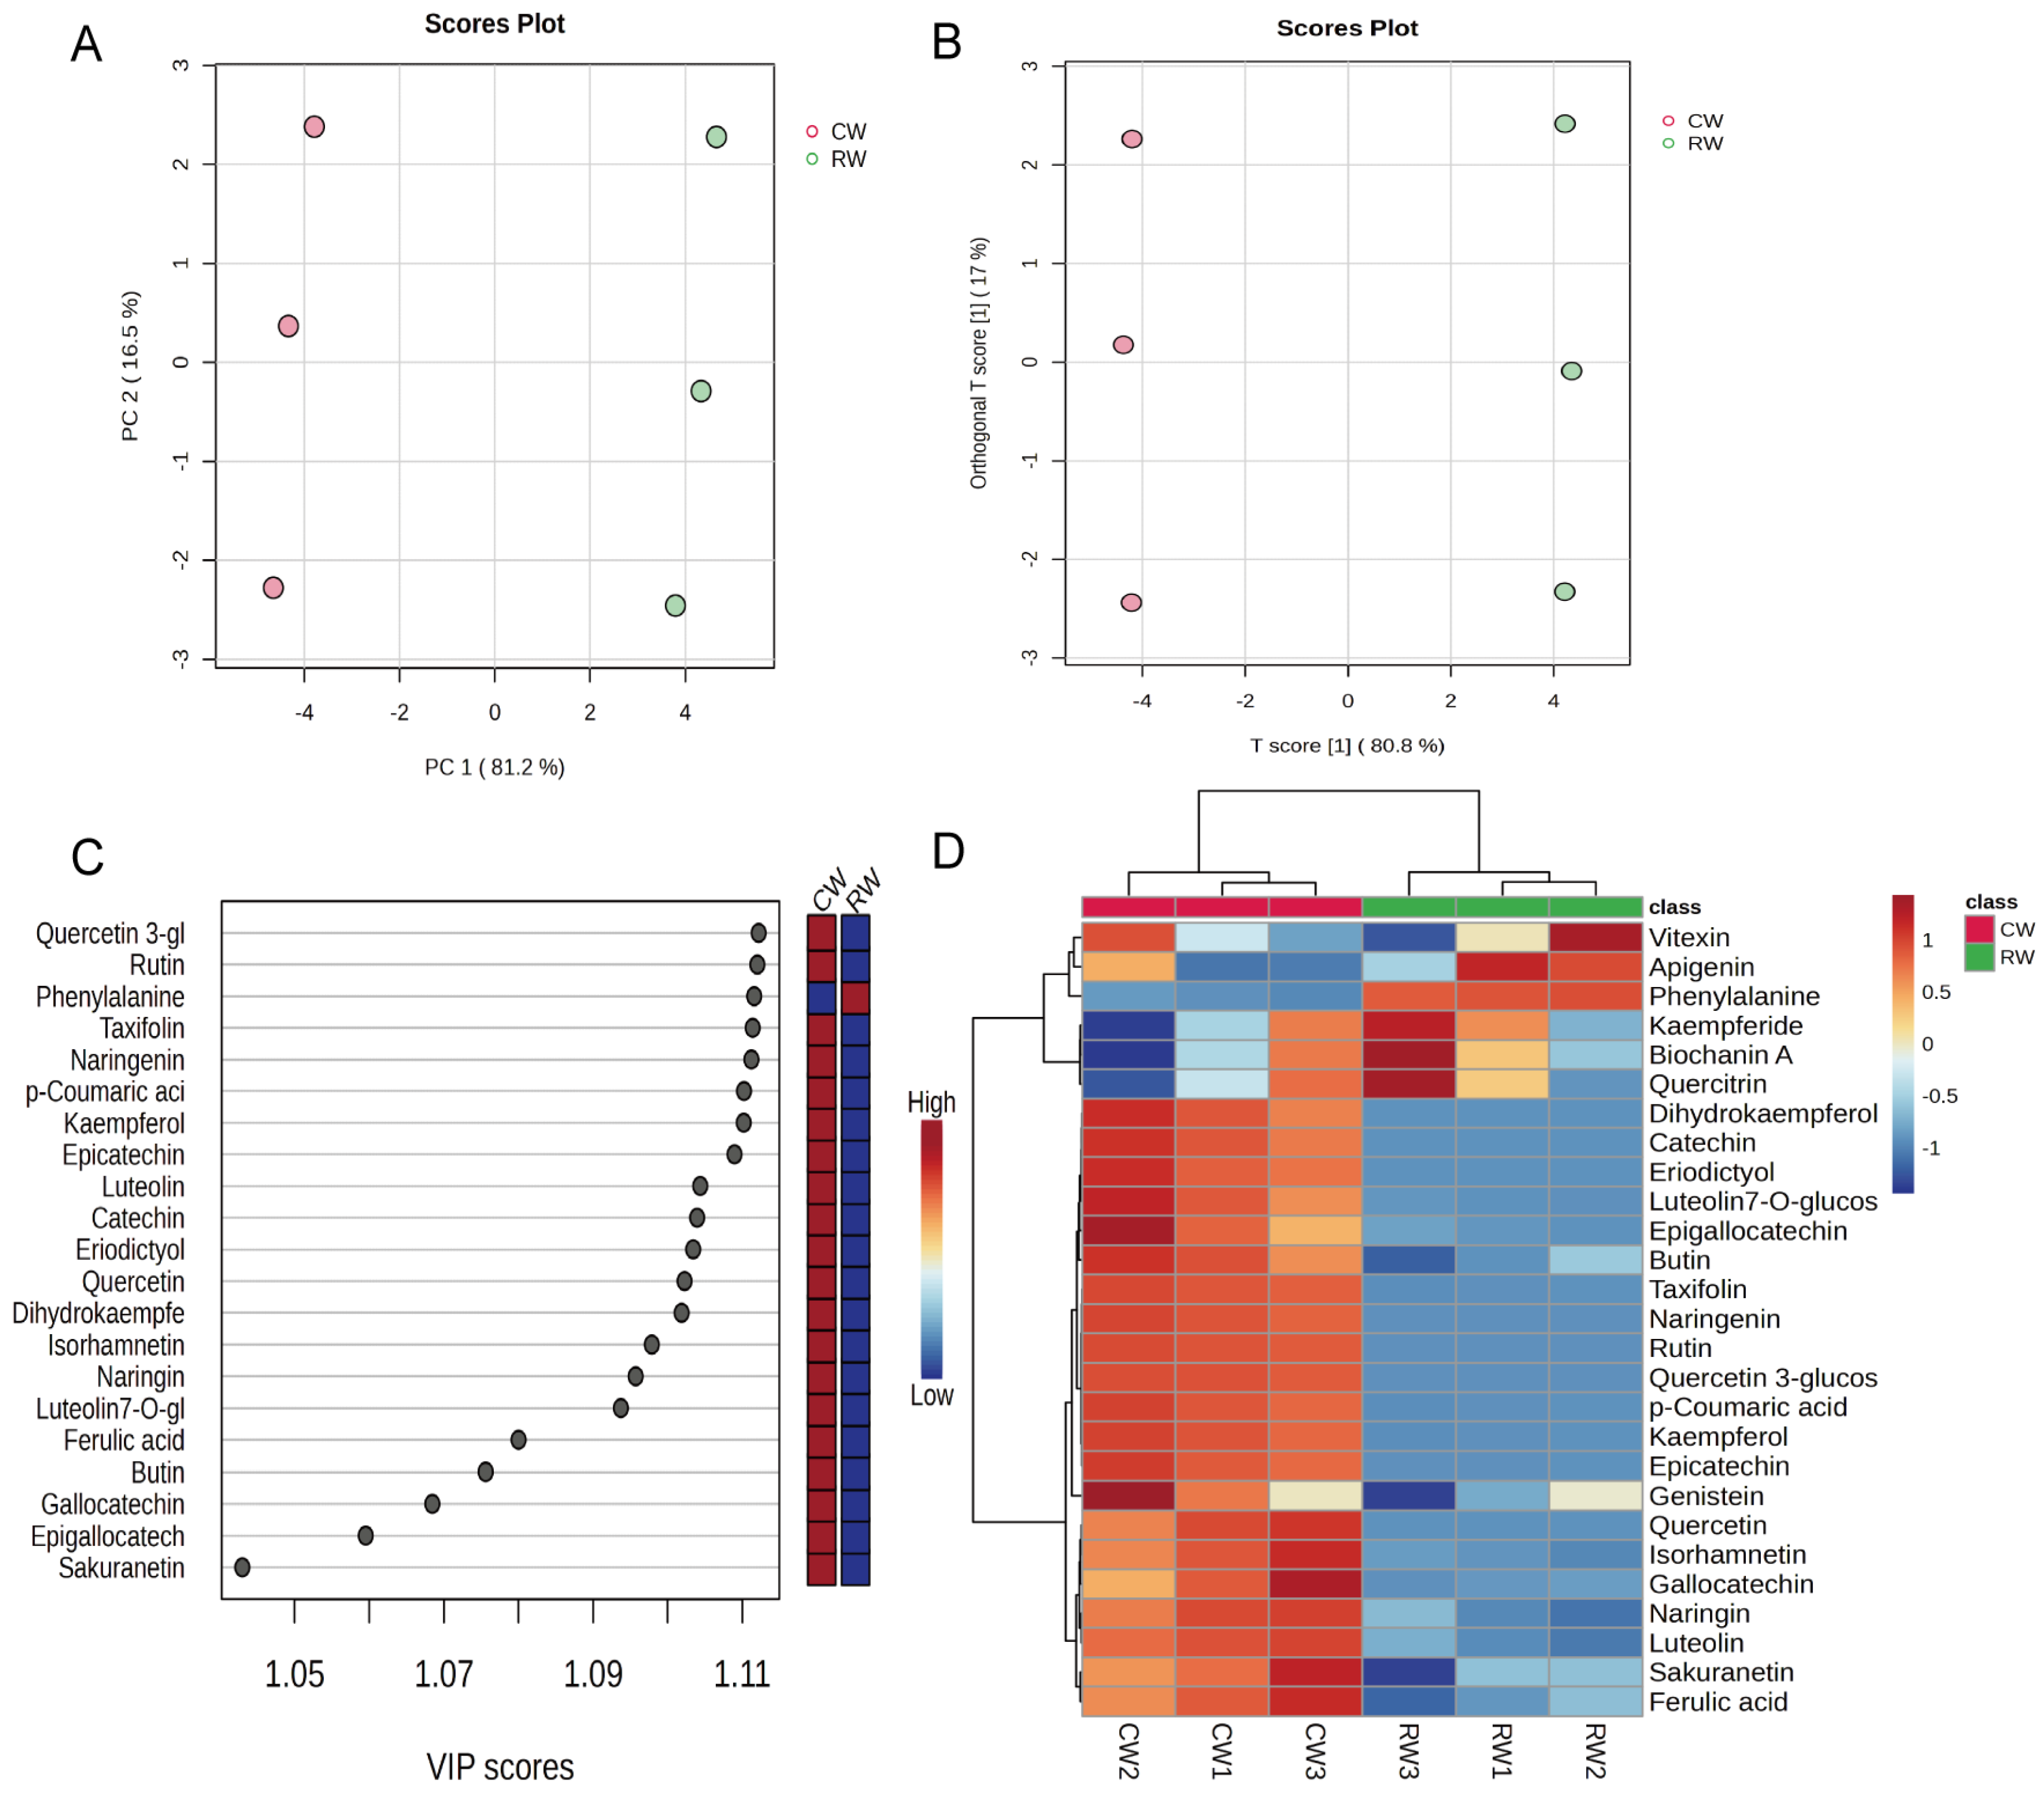
3.3. Analysis of Metabolites in Complexed Hongqu Rice Wine Using Metabolomics Approach

To further elucidate the flavonoid metabolites in the developed complexed Hongqu rice wine, UHPLC-MS technology was employed to analyze both Hongqu rice wine and the complexed Hongqu rice wine. A total of 27 flavonoid compounds were detected, and their contents are listed in Table 4.
A PCA of the two Hongqu rice wine groups showed that PC1 and PC2 contributed 81.2% and 16.5%, respectively (Figure 5A). To further determine the variability of the metabolites between the two groups, an OPLS-DA analysis of the information matrix was performed (Figure 5B). The model parameters were R2X = 0.998 and R2Y = 1, and the prediction index was Q2 = 0.999. The R2 and Q2 values were both greater than 0.5 and close to 1, indicating that the OPLS-DA model was stable and reliable, with strong predictive ability.
Variable importance for projection (VIP) is a key indicator for screening differential metabolites (Figure 5C). Higher VIP values indicate greater contributions to the differences between groups. Using the criteria of VIP > 1, p < 0.05, and FC < 0.5 (FC > 2) for comprehensive screening, 15 upregulated significantly differential metabolites and 1 downregulated significantly differential metabolite were identified as quality markers distinguishing the RW and CW. These markers include quercetin-3-glucoside, rutin, phenylalanine, taxifolin, naringenin, p-coumaric acid, kaempferol, epicatechin, luteolin, catechin, eriodictyol, quercetin, dihydrokaempferol, luteolin-7-O-glucoside, epigallocatechin, and gallocatechin.
A clustered heatmap was drawn based on the relative content of each metabolite (Figure 5D). The heatmap comparison of the differences in metabolites between the RW and CW groups revealed that kiwiberry addition significantly increased the metabolite contents of the CW group. Adding kiwiberry increased the quercetin-3-glucoside, rutin, taxifolin, naringenin, p-coumaric acid, kaempferol, epicatechin, luteolin, catechin, eriodictyol, quercetin, dihydrokaempferol, luteolin-7-O-glucoside, epigallocatechin, and gallocatechin contents in the Hongqu rice wine.

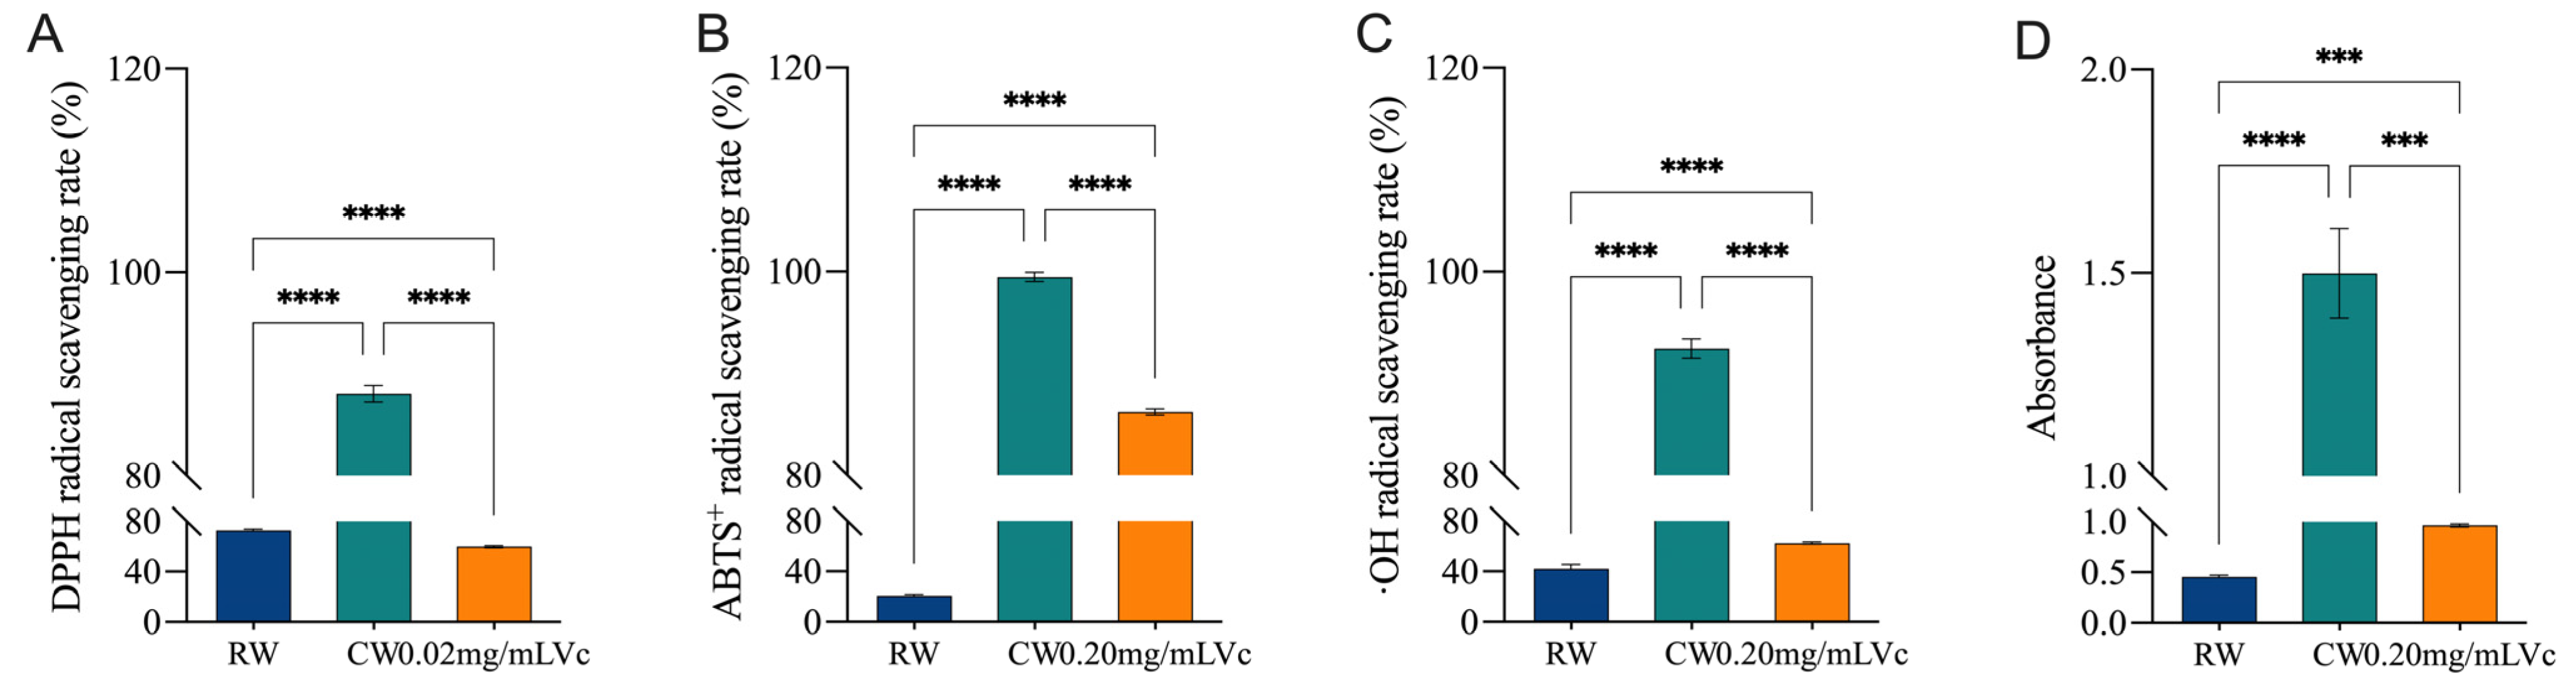
3.4. In Vitro Antioxidant Capacity of Complexed Hongqu Rice Wine

The antioxidant properties of the complexed Hongqu rice wine were evaluated in four respects: DPPH radical scavenging capacity (Figure 6A), ABTS radical scavenging capacity (Figure 6B), OH radical scavenging capacity (Figure 6C), and Fe3⁺ reducing capacity (Figure 6D). The results demonstrated that the antioxidant capacity of the complexed Hongqu rice wine was enhanced by the addition of kiwiberry compared to the RW.
The CW exhibited significantly higher DPPH, ABTS, and ·OH radical scavenging activities and greater Fe3⁺ reduction capacity (p < 0.05) than the RW and the positive control. Specifically, the DPPH radical scavenging rate of the CW was 88.05 ± 0.95%, 1.2 times higher than that of the RW (72.67 ± 1.48%); the ABTS radical scavenging rate was 99.47 ± 0.48%, 4.8 times higher than that of the RW (20.94 ± 0.77%); and the ·OH radical scavenging rate was 92.46 ± 0.93%, 2.8 times higher than that of the RW (42.14 ± 1.48%). The -OH radical scavenging rate was 92.46 ± 0.93%, 2.2 times higher than that of the RW (42.14 ± 3.52%), and the Fe3⁺ reduction capacity was 1.499 ± 0.113 Abs, 3.3 times higher than that of the RW (0.454 ± 0.021 Abs). This indicates that adding kiwiberry endowed the Hongqu rice wine with a stronger antioxidant capacity.

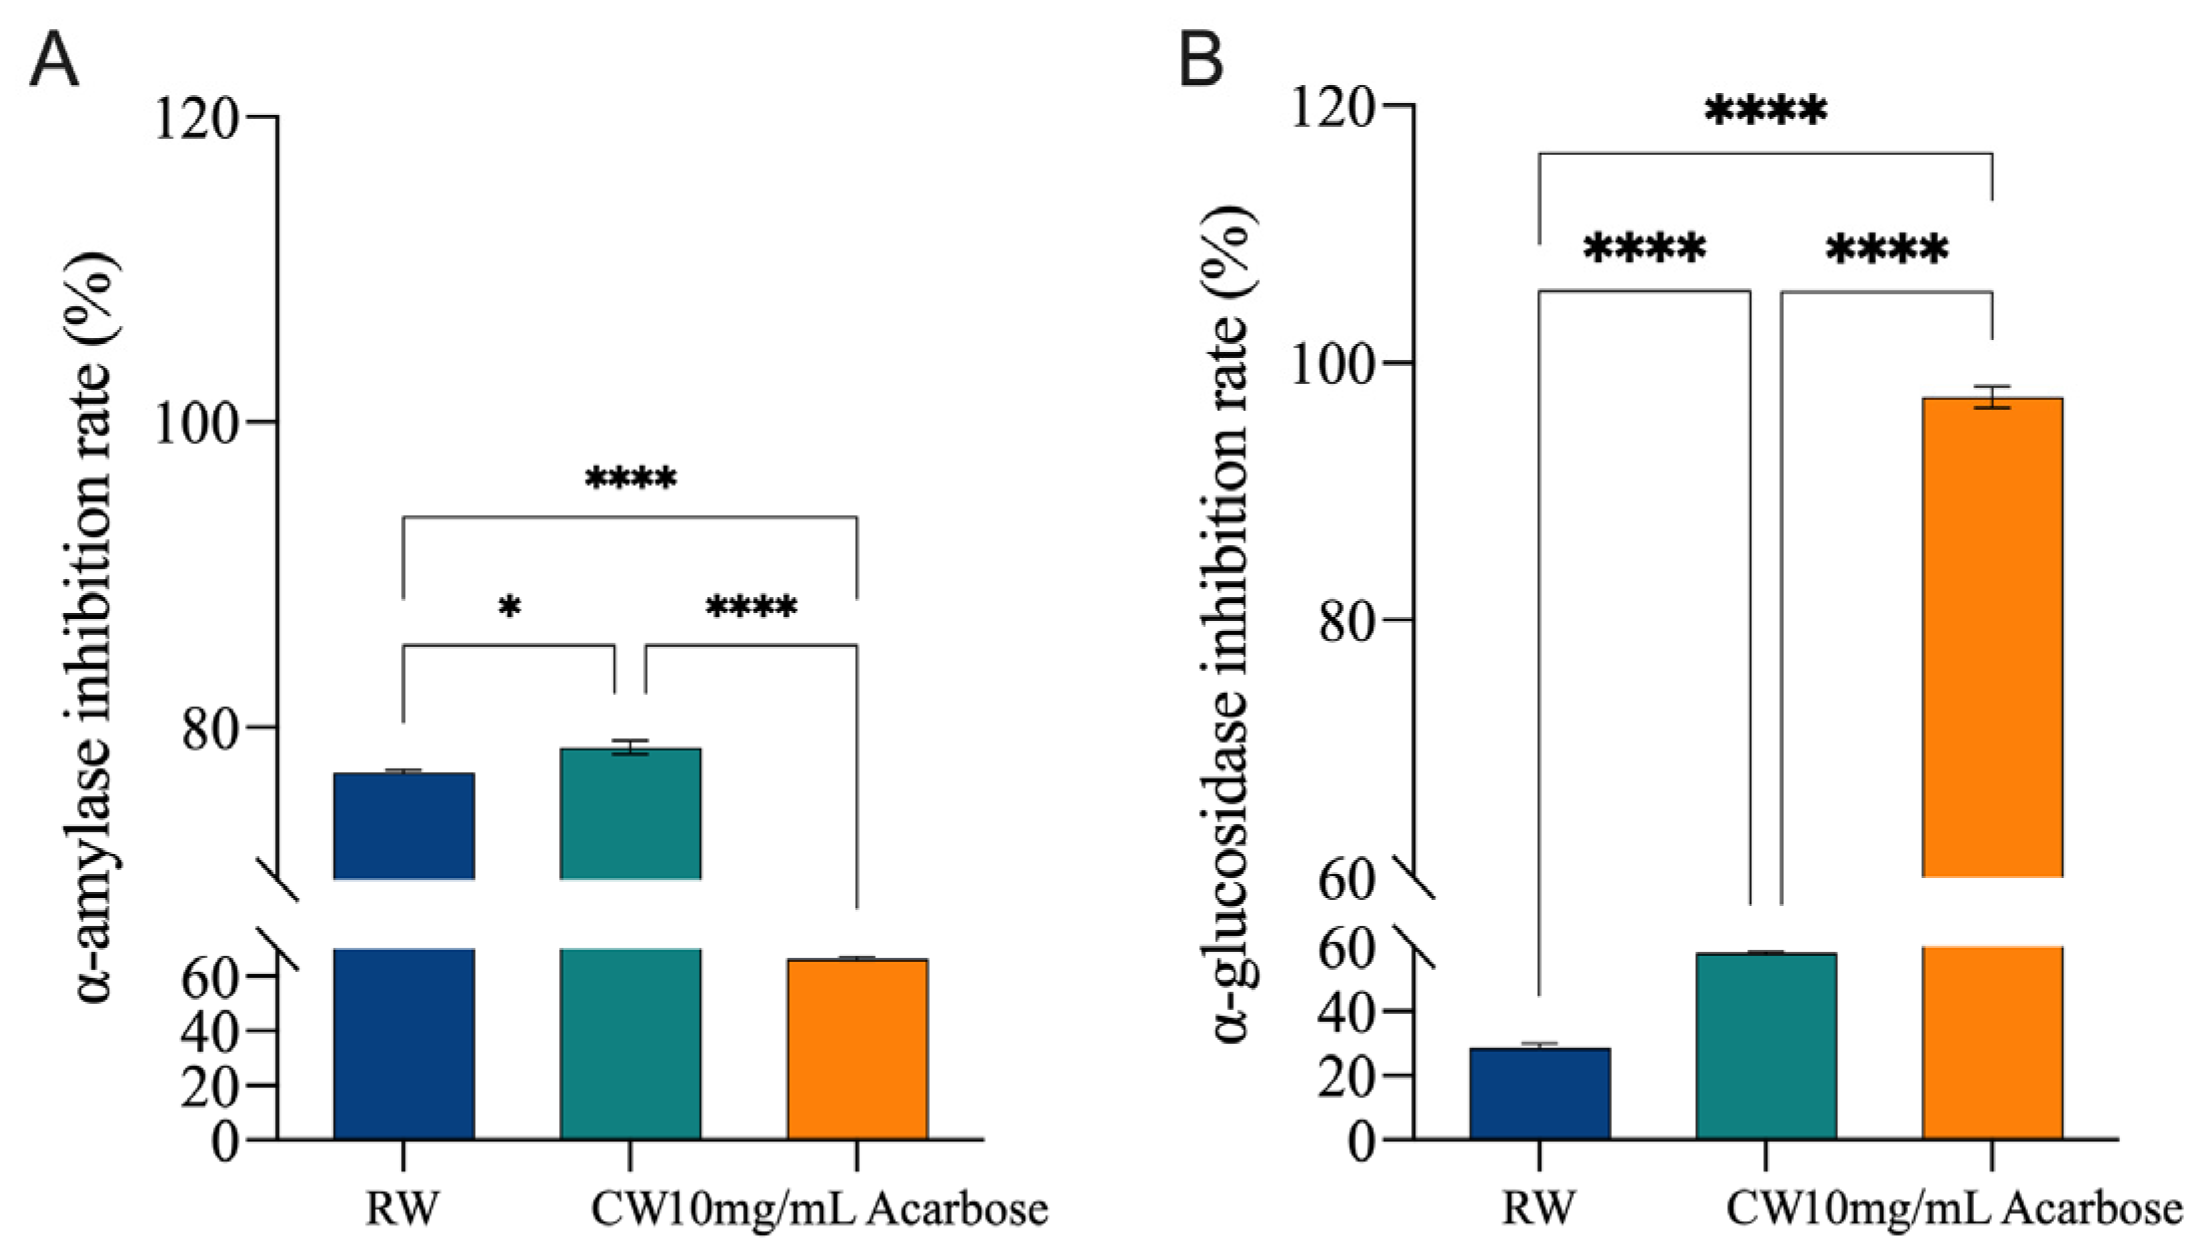
3.5. In Vitro Ability of Complexed Hongqu Rice Wine to Inhibit Key Enzymes Involved in Glucose and Lipid Metabolism

α-Amylase and α-glucosidase activities directly affect the rate of carbohydrate digestion. Inhibiting α-amylase and α-glucosidase activities can slow starch and sugar absorption, which helps in managing type 2 diabetes. The inhibitory activities of α-amylase (Figure 7A) and α-glucosidase (Figure 7B) were measured in vitro for both Hongqu rice wine and complexed Hongqu rice wine. The results show that both products exhibit inhibitory effects on α-amylase and α-glucosidase, with the CW demonstrating significantly higher inhibitory activity than the RW (p < 0.05). The inhibition rates of the RW and CW on α-amylase were 77.05 ± 0.19% and 78.68 ± 0.44%, respectively: significantly higher than that of the positive control (p < 0.05). The inhibition rates for α-glucosidase were 28.57 ± 1.64% and 58.02 ± 0.50%, corresponding to 29.36% and 59.62% of the inhibition rate of acarbose (97.32 ± 0.90%), respectively. This indicates that complexed Hongqu rice wine inhibits α-amylase and α-glucosidase more effectively, owing to the addition of the kiwiberry.

3.6. Bile Acid-Binding Capacity of Complexed Hongqu Rice Wine

Decreasing the bile acid content can enhance the decomposition and metabolism of cholesterol, reducing blood lipids. The binding capacities of Hongqu rice wine and the complexed Hongqu rice wine to sodium cholate (Figure 8A), sodium taurocholate (Figure 8B), and sodium glycocholate (Figure 8C) were analyzed in a simulated human gastrointestinal environment. The CW’s binding rates to sodium glycocholate (40.25 ± 0.64%) and sodium cholate (49.08 ± 1.05%) were 1.04 and 1.27 times higher than those of the RW, respectively. The binding rate of the CW to sodium taurocholate (60.58 ± 0.80%) was 1.18 times higher than that of the RW, indicating that the complexed Hongqu rice wine effectively binds bile acids.

4. Conclusions

In summary, this study is the first to use kiwiberry as a raw material in Hongqu rice wine production. The complexed Hongqu rice wine production process was optimized based on existing Hongqu rice wine techniques. We found that the complexed Hongqu rice wine exhibited significant increases in polyphenol and flavonoid content compared with Hongqu rice wine, with 15 upregulated metabolites identified through metabolic analysis. Additionally, the complexed Hongqu rice wine demonstrated exceptional biological activities, including antioxidant capacity, the inhibition of key enzymes in glucose metabolism, and bile acid-binding ability. Adding an appropriate amount of kiwiberry juice during Hongqu rice wine fermentation significantly increases the nutrient content and enhances biological activities such as antioxidant and hypoglycemic effects. This study opens new avenues for improving Hongqu rice wine quality and utilizing kiwiberry, providing valuable references for research in related fields.

Supplementary Materials

The following supporting information can be downloaded at: https://www.mdpi.com/article/10.3390/fermentation10100494/s1, Table S1: Sensory scoring criteria; Table S2: The UHPLC-MS acquisition parameters for 38 standards; Table S3: The linear equation, Regression coefficient, and Linear range of 38 standards; Figure S1: The linear equation of bile acid standards. (A) Sodium cholate. (B) Sodium taurocholate. (C) Sodium glycocholate.

Author Contributions

Conceptualization, M.W. and Y.D.; methodology, M.W., Y.L. and Y.D.; formal analysis, M.W. and Y.L.; resources, D.L. and X.G.; data curation, M.W.; writing—original draft preparation, M.W. and Y.L.; writing—review and editing, X.G., Y.D. and D.L.; supervision, Y.D. and D.L.; project administration, Y.D. and D.L.; funding acquisition, D.L. All authors have read and agreed to the published version of the manuscript.

Funding

This research was funded by the Basic Research Project of Basic Research Operating Expenses of Heilongjiang Provincial Department of Education (22KYYWF0655) and the Outstanding Young Talents Project of Central Support for Reform and Development Funds of Local Universities (2020YQ09).

Institutional Review Board Statement

Not applicable.

Informed Consent Statement

Not applicable.

Data Availability Statement

The original contributions presented in this study are included in the article; further inquiries can be directed to the corresponding authors.

Conflicts of Interest

The authors declare no conflicts of interest.

References

  1. Chen, G.-M.; Li, W.-L.; Tong, S.-G.; Qiu, Y.-T.; Han, J.-Z.; Lv, X.-C.; Ai, L.-Z.; Sun, J.-Y.; Sun, B.-G.; Ni, L. Effects of the microbial community on the formation of volatile compounds and biogenic amines during the traditional brewing of hongqu rice wine. Curr. Res. Food Sci. 2022, 5, 1433–1444. [Google Scholar] [CrossRef] [PubMed]
  2. Lin, Y.; Yang, H.; Jiang, L.; Zhang, Y.; Li, J.; Zhu, X. Analysis of the flavour components, total phenolic content and antioxidant capacity between rice wine from two raw rice and starters. Int. J. Food Sci. Technol. 2024, 59, 129–141. [Google Scholar] [CrossRef]
  3. Li, Z.; Liu, Y.; Li, Y.; Lin, F.; Wu, L. Screening and identification of Monascus strains with high-yield monacolin K and undetectable citrinin by integration of HPLC analysis and pksCT and ctnA genes amplification. J. Appl. Microbiol. 2020, 129, 1410–1418. [Google Scholar] [CrossRef] [PubMed]
  4. Chen, G.; Yuan, Y.; Tang, S.; Yang, Z.; Wu, Q.; Liang, Z.; Chen, S.; Li, W.; Lv, X.; Ni, L. Comparative analysis of microbial communities and volatile flavor components in the brewing of Hongqu rice wines fermented with different starters. Curr. Res. Food Sci. 2023, 7, 100628. [Google Scholar] [CrossRef]
  5. Que, F.; Mao, L.C.; Pan, X. Antioxidant activities of five Chinese rice wines and the involvement of phenolic compounds. Food Res. Int. 2006, 39, 581–587. [Google Scholar] [CrossRef]
  6. Wang, Y.; Wang, L.X.; Lu, W.P.; Ning, X.; Li, J.Y.; Wu, L. Study on Ploidy Variation and Fruit Evaluation of actinidia arguta (SIEB. & ZUCC) PLANCH. EX MIQ. Fresenius Environ. Bull. 2022, 31, 817–822. [Google Scholar]
  7. Zheng, R.-L.; Ren, T.; Niu, C.-T.; Zheng, F.-Y.; Wang, J.-J.; Liu, C.-F.; Li, Q. Anthocyanins composition and antioxidant activity of purple rice and color degradation under sunlight exposure of purple rice wine. J. Food Meas. Charact. 2022, 16, 1889–1900. [Google Scholar] [CrossRef]
  8. Tan, C.; Wang, Z.; Feng, X.; Pan, B.; Irfan, M.; Liu, C. Transcriptomic and metabolomics of flavonoid compounds in actinidia arguta var. arguta. J. King Saud Univ. Sci. 2021, 33, 101605. [Google Scholar] [CrossRef]
  9. Sawicki, T.; Blaszczak, W.; Latocha, P. In vitro anticholinergic and antiglycaemic properties of frost-hardy Actinidia fruit extracts and their polyphenol profile, L-ascorbic acid content and antioxidant capacity. Food Res. Int. 2023, 173, 113324. [Google Scholar] [CrossRef]
  10. Macedo, C.; Silva, A.M.; Ferreira, A.S.; de la Luz Cádiz-Gurrea, M.; Fernández-Ochoa, Á.; Segura-Carretero, A.; Delerue-Matos, C.; Costa, P.; Rodrigues, F. Insights into the polyphenols extraction from Actinidia arguta fruit (kiwiberry): A source of pro-healthy compounds. Sci. Hortic. 2023, 313, 111910. [Google Scholar] [CrossRef]
  11. Lian, L.; Zhang, S.; Yu, Z.; Ge, H.; Qi, S.; Zhang, X.; Long, L.; Xiong, X.; Chu, D.; Ma, X.; et al. The dietary freeze-dried fruit powder of Actinidia arguta ameliorates dextran sulphate sodium-induced ulcerative colitis in mice by inhibiting the activation of MAPKs. Food Funct. 2019, 10, 5768–5778. [Google Scholar] [CrossRef] [PubMed]
  12. Ahn, J.H.; Ryu, S.H.; Yeon, S.W.; Lee, S.; Kim, S.B.; Hwang, B.Y.; Lee, M.K. Phenyldilactones from the leaves of hardy kiwifruit (Actinidia arguta). Biochem. Syst. Ecol. 2023, 108, 104636. [Google Scholar] [CrossRef]
  13. Ha, J.S.; Kang, J.Y.; Kang, J.E.; Park, S.K.; Kim, J.M.; Kim, C.-W.; Oh, S.-I.; Lee, U.; Kim, D.-O.; Heo, H.J. Pentacyclic triterpenoid-rich fraction of the hardy kiwi (Actinidia arguta) improves brain dysfunction in high fat diet-induced obese mice. Sci. Rep. 2020, 10, 5788. [Google Scholar] [CrossRef]
  14. Wang, Y.; Zhang, M.; Dong, K.; Yin, X.; Hao, C.; Zhang, W.; Irfan, M.; Chen, L.; Wang, Y. Metabolomic and transcriptomic exploration of the uric acid-reducing flavonoids biosynthetic pathways in the fruit of Actinidia arguta Sieb. Zucc. Front. Plant Sci. 2022, 13, 1025317. [Google Scholar] [CrossRef] [PubMed]
  15. Zhang, J.; Tian, J.; Gao, N.; Gong, E.S.; Xin, G.; Liu, C.; Si, X.; Sun, X.; Li, B. Assessment of the phytochemical profile and antioxidant activities of eight kiwiberry (Actinidia arguta (Siebold & Zuccarini) Miguel) varieties in China. Food Sci. Nutr. 2021, 9, 5616–5625. [Google Scholar] [PubMed]
  16. Błaszczak, W.; Latocha, P.; Jeż, M.; Wiczkowski, W. The impact of high-pressure processing on the polyphenol profile and anti-glycaemic, anti-hypertensive and anti-cholinergic activities of extracts obtained from kiwiberry (Actinidia arguta) fruits. Food Chem. 2021, 343, 128421. [Google Scholar] [CrossRef]
  17. Han, N.; Park, H.; Kim, C.-W.; Kim, M.-S.; Lee, U. Physicochemical quality of hardy kiwifruit (Actinidia arguta L. cv. Cheongsan) during ripening is influenced by harvest maturity. For. Sci. Technol. 2019, 15, 187–191. [Google Scholar]
  18. GB/T 15038-2006; Analytical Methods of Wine and Fruit Wine. Standardization Technical Committee of the National Food Industry Brewing Technical Committee: Beijing, China, 2006.
  19. Pashazadeh, H.; Ozdemir, N.; Zannou, O.; Koca, I. Antioxidant capacity, phytochemical compounds, and volatile compounds related to aromatic property of vinegar produced from black rosehip (rosa pimpinellifolia L.) juice. Food Biosci. 2021, 44, 101318. [Google Scholar] [CrossRef]
  20. Pisani, M.; Astolfi, P.; Sabbatini, S.; Carloni, P. Antioxidant activity level, bioactive compounds, colour and spectroscopic analysis (UV-vis and FT-IR) of flavoured drinks made with wine and sour cherries (prunus cerasus var. austera). Foods 2021, 10, 1953. [Google Scholar] [CrossRef]
  21. Yu, X.; Wang, Y.; Yan, X.; Leng, T.; Xie, J.; Yu, Q.; Chen, Y. Metabolomics combined with correlation analysis revealed the differences in antioxidant activities of lotus seeds with varied cultivars. Foods 2024, 13, 1084. [Google Scholar] [CrossRef]
  22. Ren, N.; Gong, W.; Zhao, Y.; Zhao, D.; Xu, Y. Innovation in sweet rice wine with high antioxidant activity: Eucommia ulmoides leaf sweet rice wine. Front. Nutr. 2023, 9, 1108843. [Google Scholar] [CrossRef] [PubMed]
  23. Li, Z.; Qin, C.; He, X.; Chen, B.; Tang, J.; Liu, G.; Li, L.; Yang, Y.; Ye, D.; Li, J.; et al. Development of green banana fruit wines: Chemical compositions and in vitro antioxidative activities. Antioxidants 2023, 12, 93. [Google Scholar] [CrossRef]
  24. Yang, P.; Huang, K.; Zhang, Y.; Li, S.; Cao, H.; Song, H.; Zhang, Y.; Guan, X. Biotransformation of quinoa phenolic compounds with Monascus anka to enhance the antioxidant capacity and digestive enzyme inhibitory activity. Food Biosci. 2022, 46, 101568. [Google Scholar] [CrossRef]
  25. Shi, F.; Wang, L.; Li, S. Enhancement in the physicochemical properties, antioxidant activity, volatile compounds, and non-volatile compounds of watermelon juices through lactobacillus plantarum JHT78 fermentation. Food Chem. 2023, 420, 136146. [Google Scholar] [CrossRef]
  26. Liu, K.; Liu, X.; Wang, T.; Wang, Q.; Feng, L.; Su, R.; Zhang, M.; Xu, B.; Chen, F.; Li, P. Optimization of main ingredient ratio, metabolomics analysis, and antioxidant activity analysis of lycopene-enriched compound fruit wine. Fermentation 2023, 9, 591. [Google Scholar] [CrossRef]
  27. Sylla, N.; Bouyahya, A.; Taha, D.; Dakka, N.; Elhajji, H. Study of the antioxidant and antidiabetic activity in vitro of free and encapsulated phenolic compounds of olive pomace. Biocatal. Agric. Biotechnol. 2021, 36, 102126. [Google Scholar] [CrossRef]
  28. Zhu, Z.-Y.; Luo, Y.; Dong, G.-L.; Ren, Y.-Y.; Chen, L.-J.; Guo, M.-Z.; Wang, X.-T.; Yang, X.-Y.; Zhang, Y. Effects of the ultra-high pressure on structure and α-glucosidase inhibition of polysaccharide from Astragalus. Int. J. Biol. Macromol. 2016, 87, 570–576. [Google Scholar] [CrossRef]
  29. Li, Q.-Y.; Dou, Z.-M.; Duan, Q.-F.; Chen, C.; Liu, R.-H.; Jiang, Y.-M.; Yang, B.; Fu, X. A comparison study on structure-function relationship of polysaccharides obtained from sea buckthorn berries using different methods: Antioxidant and bile acid-binding capacity. Food Sci. Hum. Wellness 2024, 13, 494–505. [Google Scholar] [CrossRef]
Figure 1. Single-factor experiment results. Values with different letters indicate significant differences (p < 0.05). (A) effect of juice addition time on alcohol content, (B) effect of fermentation temperature on alcohol content, (C) effect of juice addition amount on alcohol content, (D) effect of juice addition time on sensory score, (E) effect of fermentation temperature on sensory score, and (F) effect of juice addition amount on sensory scores.
Fermentation 10 00494 g001
Figure 2. Response surface and contour plots of alcohol content: (A,D) effects of juice addition time and fermentation temperature, (B,E) effects of juice addition time and juice addition amount, and (C,F) effects of fermentation temperature and juice addition amount.
Fermentation 10 00494 g002
Figure 3. Response surface and contour plots for sensory score: (A,D) effects of juice addition time and fermentation temperature, (B,E) effects of juice addition time and juice addition amount, and (C,F) effects of fermentation temperature and juice addition amount.
Fermentation 10 00494 g003
Figure 4. Functional component contents in Hongqu rice wine and complexed Hongqu rice wine: (A) polyphenol content and (B) flavonoid content. “***” represents “p < 0.001”.“****” represents “p < 0.0001”.
Fermentation 10 00494 g004
Figure 5. Metabolomic analysis of Hongqu rice wine and complexed Hongqu rice wine: (A) PCA score plot, (B) OPLS-DA score plot, (C) VIP plot, and (D) clustering heatmap.
Fermentation 10 00494 g005
Figure 6. Antioxidant capacities of Hongqu rice wine and complexed Hongqu rice wine: (A) DPPH radical scavenging capacity, (B) ABTS radical scavenging capacity, (C) OH radical scavenging capacity, and (D) Fe3⁺ reducing power. “***” represents “p < 0.001”.“****” represents “p < 0.0001”.
Fermentation 10 00494 g006
Figure 7. In vitro inhibitory activities of Hongqu rice wine and complexed Hongqu rice wine on key metabolic enzymes for carbohydrates and lipids: (A) α-Amylase inhibitory activity and (B) α-Glucosidase inhibitory activity. “*” represents “p < 0.05”.“****” represents “p < 0.0001”.
Fermentation 10 00494 g007
Figure 8. Bile acid-binding capacities of Hongqu rice wine and complexed Hongqu rice wine: (A) sodium cholate-binding capacity, (B) sodium taurocholate-binding capacity, and (C) sodium glycocholate-binding capacity. “*” represents “p < 0.05”.“****” represents “p < 0.0001”.
Fermentation 10 00494 g008
Table 1. Coded and actual values of BBD factors.
FactorTitleLevel
−101
AJuice addition time (h)7296120
BFermentation temperature (°C)253035
CJuice addition amount (g/100 g)5075100
Table 2. BBD matrix and response values.
RunDependent VariableResponse Value
ABCY1Y2
10008.794
2−1017.984
30−1−17.280
41017.679
50008.696
60−117.586
70008.795
8−10−18.678
90117.882
100008.596
110008.595
12−1108.187
131−10779
141108.476
1501−18.486
16−1−107.777
1710−18.376
Table 3. ANOVA evaluation of linear, interaction, and quadratic terms for sensory score and alcohol content response variables and the coefficients of the model prediction.
SourceSSDFMSF Valuep-ValueSSDFMSF Valuep-Value
Alcohol Content (Y1) (a)Sensory Score (Y2) (b)
Model4.4790.496716.760.0006898.39999.8255.68<0.0001
A0.12510.1254.220.079132.00132.0017.850.0039
B1.3611.3645.920.000310.13110.135.650.0491
C0.361310.361312.190.010115.13115.138.440.0228
AB0.2510.258.430.022942.25142.2523.570.0018
AC010012.2512.251.250.2995
BC0.202510.20256.830.034725.00125.0013.940.0073
A20.190110.19016.410.0391408.521408.52227.86<0.0001
B21.4511.4549.030.0002132.041132.0473.65<0.0001
C20.34810.34811.740.011156.671156.6787.39<0.0001
Residual0.207570.0296 12.5571.79
Lack of fit0.167530.05585.580.0659.7533.254.640.0861
Pure error0.0440.01 2.8040.70
Total4.6816 910.9416
Note: SS, DF, and MS stand for sum of squares, degree of freedom, and mean square, respectively. (a) ANOVA results for the quadratic response surface model for sensory score. (b) ANOVA results for the quadratic response surface model for alcohol content.
Table 4. Flavonoid compound contents in Hongqu rice wine and complexed Hongqu rice wine.
RunMetabolite NameCWRWp-ValueFold Change (FC)
1Apigenin0.99 ± 0.11.11 ± 0.1Not0.5 < FC < 2
2Biochanin A0.49 ± 0.040.52 ± 0.04Not0.5 < FC < 2
3Butin0.43 ± 0.030.23 ± 0.04<0.010.5 < FC < 2
4Catechin972.54 ± 104.1210.52 ± 0.41<0.01>2
5Dihydrokaempferol61.24 ± 7.340.65 ± 0.09<0.01>2
6Epicatechin938.67 ± 62.4212.42 ± 2.6<0.01>2
7Epigallocatechin29.53 ± 4.313.96 ± 0.42<0.01>2
8Eriodictyol430.36 ± 46.761.21 ± 0.16<0.01>2
9Ferulic acid18.44 ± 0.8612.66 ± 0.88<0.010.5 < FC < 2
10Gallocatechin25.89 ± 5.444.08 ± 0.51<0.01>2
11Genistein4.1 ± 0.223.66 ± 0.2Not0.5 < FC < 2
12Isorhamnetin10.5 ± 0.625.97 ± 0.16<0.010.5 < FC < 2
13Vitexin1.82 ± 0.151.83 ± 0.21Not0.5 < FC < 2
14Kaempferide0.39 ± 0.10.46 ± 0.09Not0.5 < FC < 2
15Kaempferol22.41 ± 1.151.75 ± 0.13<0.01>2
16Luteolin29.32 ± 0.9912.17 ± 1.53<0.01>2
17Luteolin-7-O-glucoside37.96 ± 5.652.86 ± 0.43<0.01>2
18Naringenin215.35 ± 9.020.02 ± 0.002<0.01>2
19Naringin0.46 ± 0.010.41 ± 0.01<0.010.5 < FC < 2
20p-Coumaric acid27.38 ± 1.431.29 ± 0.19<0.01>2
21Phenylalanine7145.31 ± 213.9514,966.61 ± 160.5<0.01<0.5
22Quercetin963.11 ± 113.5618.86 ± 0.41<0.01>2
23Quercetin-3-glucoside11,917.27 ± 263.026.59 ± 0.2<0.01>2
24Quercitrin5.69 ± 0.465.92 ± 0.52Not0.5 < FC < 2
25Rutin8164.22 ± 207.7628.39 ± 1.83<0.01>2
26Sakuranetin3.24 ± 0.013.17 ± 0.02<0.010.5 < FC < 2
27Taxifolin231.58 ± 7.9920.66 ± 0.83<0.01>2
Note: The experiment was carried out in triplicate, and all data are expressed as means ± standard deviation (SD).
Disclaimer/Publisher’s Note: The statements, opinions and data contained in all publications are solely those of the individual author(s) and contributor(s) and not of MDPI and/or the editor(s). MDPI and/or the editor(s) disclaim responsibility for any injury to people or property resulting from any ideas, methods, instructions or products referred to in the content.

