Article

Designing the Properties of Probiotic Kefir with Increased Whey Protein Content

by
Aslı Yiğit Ziolkowski
1,
Paulina Bielska
2,*,
Dorota Cais-Sokolińska
2,* and
Gülhan Samur
3
1
Nutrition and Dietetics, Süleyman Demirel University, Isparta 32260, Turkey
2
Department of Dairy and Process Engineering, Faculty of Food Science and Nutrition, Poznań University of Life Sciences, ul. Wojska Polskiego 31/33, 60-624 Poznań, Poland
3
Nutrition and Dietetics, Hacettepe University, Ankara 06532, Turkey
*
Authors to whom correspondence should be addressed.
Fermentation 2024, 10(10), 495; https://doi.org/10.3390/fermentation10100495
Submission received: 6 September 2024 / Revised: 24 September 2024 / Accepted: 26 September 2024 / Published: 26 September 2024
(This article belongs to the Section Fermentation for Food and Beverages)

Abstract

This research unveiled new insights on the impact of incorporating whey proteins into kefir produced using three different methods. This aims to improve its quality and health benefits, primarily as a result of optimal proliferation of probiotic bacteria. In the initial part of the experiment, samples were prepared using three different methods (methods 1, 2, and 3) to examine the impact of introducing whey protein on bacterial count, the content of L(+)-lactic acid, lactase activity, and the lactic acid and ethanol levels. The methods differed primarily in the sequence of the inoculation milk with probiotic bacteria stage in the production cycle, as well as incubation time and temperature. No significant differences were found in the number of yeasts and bacteria between samples with and without whey proteins. However, it was revealed that the 5% addition of whey proteins enhanced the number of probiotic bacteria in kefir produced with method 2 (from 4.86 to 5.52 log cfu/mL) and method 3 (from 3.68 to 4.01 log cfu/mL). The second part of the research investigated the impact of whey proteins on firmness, consistency, cohesiveness, viscosity, color, and water activity of kefir. This part focused on testing samples with lower whey protein contents (1 and 3%, w/v). We found that the addition of 1% and 3% whey proteins resulted in decreased firmness, consistency, cohesiveness, and viscosity compared to the control kefir. On the other hand, the addition of 5% whey proteins resulted in increased firmness and consistency compared to the addition of 1% and 3% whey proteins. The addition of whey protein decreased the white index WI of the kefir samples. Overall, our results revealed that incorporating whey protein concentrate (WPC) in the production of probiotic kefir can enhance its health benefits while maintaining its rheological properties and overall quality.

1. Introduction

Kefir is a popular fermented drink produced by the activity of microorganisms present in kefir grains [1]. Kefir grains, which serve as the starter culture of kefir, include acetic acid and lactic acid bacteria (LAB), as well as yeast, all embedded in a matrix of polysaccharides and proteins [2]. Kefir has a high nutritional value and is consumed for its health benefits [3,4]. Health benefits associated with kefir include antimicrobial properties [5], cholesterol-lowering effects [6], and regulation of the gastrointestinal tract [7,8]. The microorganisms and their metabolites formed during fermentation are believed to be responsible for these health benefits. Kefir is also rich in vitamins, minerals, and essential amino acids [8,9]. The various species of microorganisms and their metabolites give kefir a unique taste and aroma [10]. Considering the positive nutritional and sensory properties of kefir as well as the tendency of people to eat healthier, it is necessary to investigate the factors influencing its sensory quality and subsequently its acceptance among consumers. The desirability of food products for the majority of consumers depends on their attractive sensory properties, which are greatly influenced by their rheological properties [11]. Rheological behavior of kefir is primarily determined by the size and type of the starter culture, the composition of the substrate, and the fermentation conditions [12]. Different kefir production processes include different temperature–time combinations such as 20 °C for 20 h, 20 °C for 48 h, 22 °C for 11 h, 22–23 °C for 20 h, and 22–25 °C for 8–12 h. There exists also a two-stage fermentation process for kefir production, involving 28 °C for 5 h followed by 20 °C for 16 h. It is crucial to optimize the time and temperature during the fermentation process to achieve the best possible quality of kefir [13].
The growing popularity of kefir consumption creates opportunities for fortification with various ingredients to boost its health benefits and improve its sensory quality [14]. Whey proteins can be added to enhance the nutritional value of kefir during processing [15]. Whey, previously seen as a waste in cheese production, is now accepted as a high-quality nutritional resource [16]. Whey proteins are rich in branched-chain amino acids such as leucine, valine, and isoleucine, as well as bioactive peptides [17]. Whey proteins also possess functional properties that play an important role in food processing, serving as an emulsifier, fat replacer, gelling agent, and encapsulating agent. Therefore, whey proteins are known to improve the sensory and textural properties of food [18]. Recent research has shown that the fortification of yogurt with modified-fermented whey protein concentrate (FWPC) has demonstrated significant enhancements in various aspects of yogurt quality, including functional, physical, microstructural, and sensory properties [19]. Another research showed that addition of WPC (whey protein concentrate) to yogurt as a substitute for non-fat dry milk resulted in increased flavor and overall liking scores compared to the control yogurts [20]. Research has also explored the physicochemical and textural properties of kefir with the addition of whey protein [21].
The growing trend in kefir consumption has led to a rise in research on fortifying kefir with different bioactive substances to boost its health benefits and improve its quality. One of the options to enhance the nutritional value of kefir is the addition of whey proteins. Based on interesting findings in the literature, we examined the effects of adding whey proteins during kefir production. In the first part of the experiment, kefir with increased whey protein content (5%, w/v) was obtained using three distinct fermentation methods. We investigated the impact of adding whey protein on bacterial count, yeast count, L(+) lactic acid levels, lactase activity, and the concentrations of lactic acid and ethanol. To ensure optimal proliferation of probiotic bacteria, we decided to choose the production process based on variable fermentation conditions. The second part of the study investigated the effects of adding whey protein on the firmness, consistency, cohesiveness, viscosity, color, and water activity of kefir. Additionally, two other levels of whey protein addition (1% and 3%) were introduced and a 14-day storage period for kefir was investigated on these parameters. The probiotic kefir samples obtained were compliant with the Codex Alimentarius standards for fermented milk [22]. This research explores the integration of whey protein into kefir, aiming to improve its health benefits and quality. By examining various production methods and whey protein content, we seek to establish the most effective approach, contributing valuable insights to the field of functional foods and dairy product innovation.

2. Materials and Methods

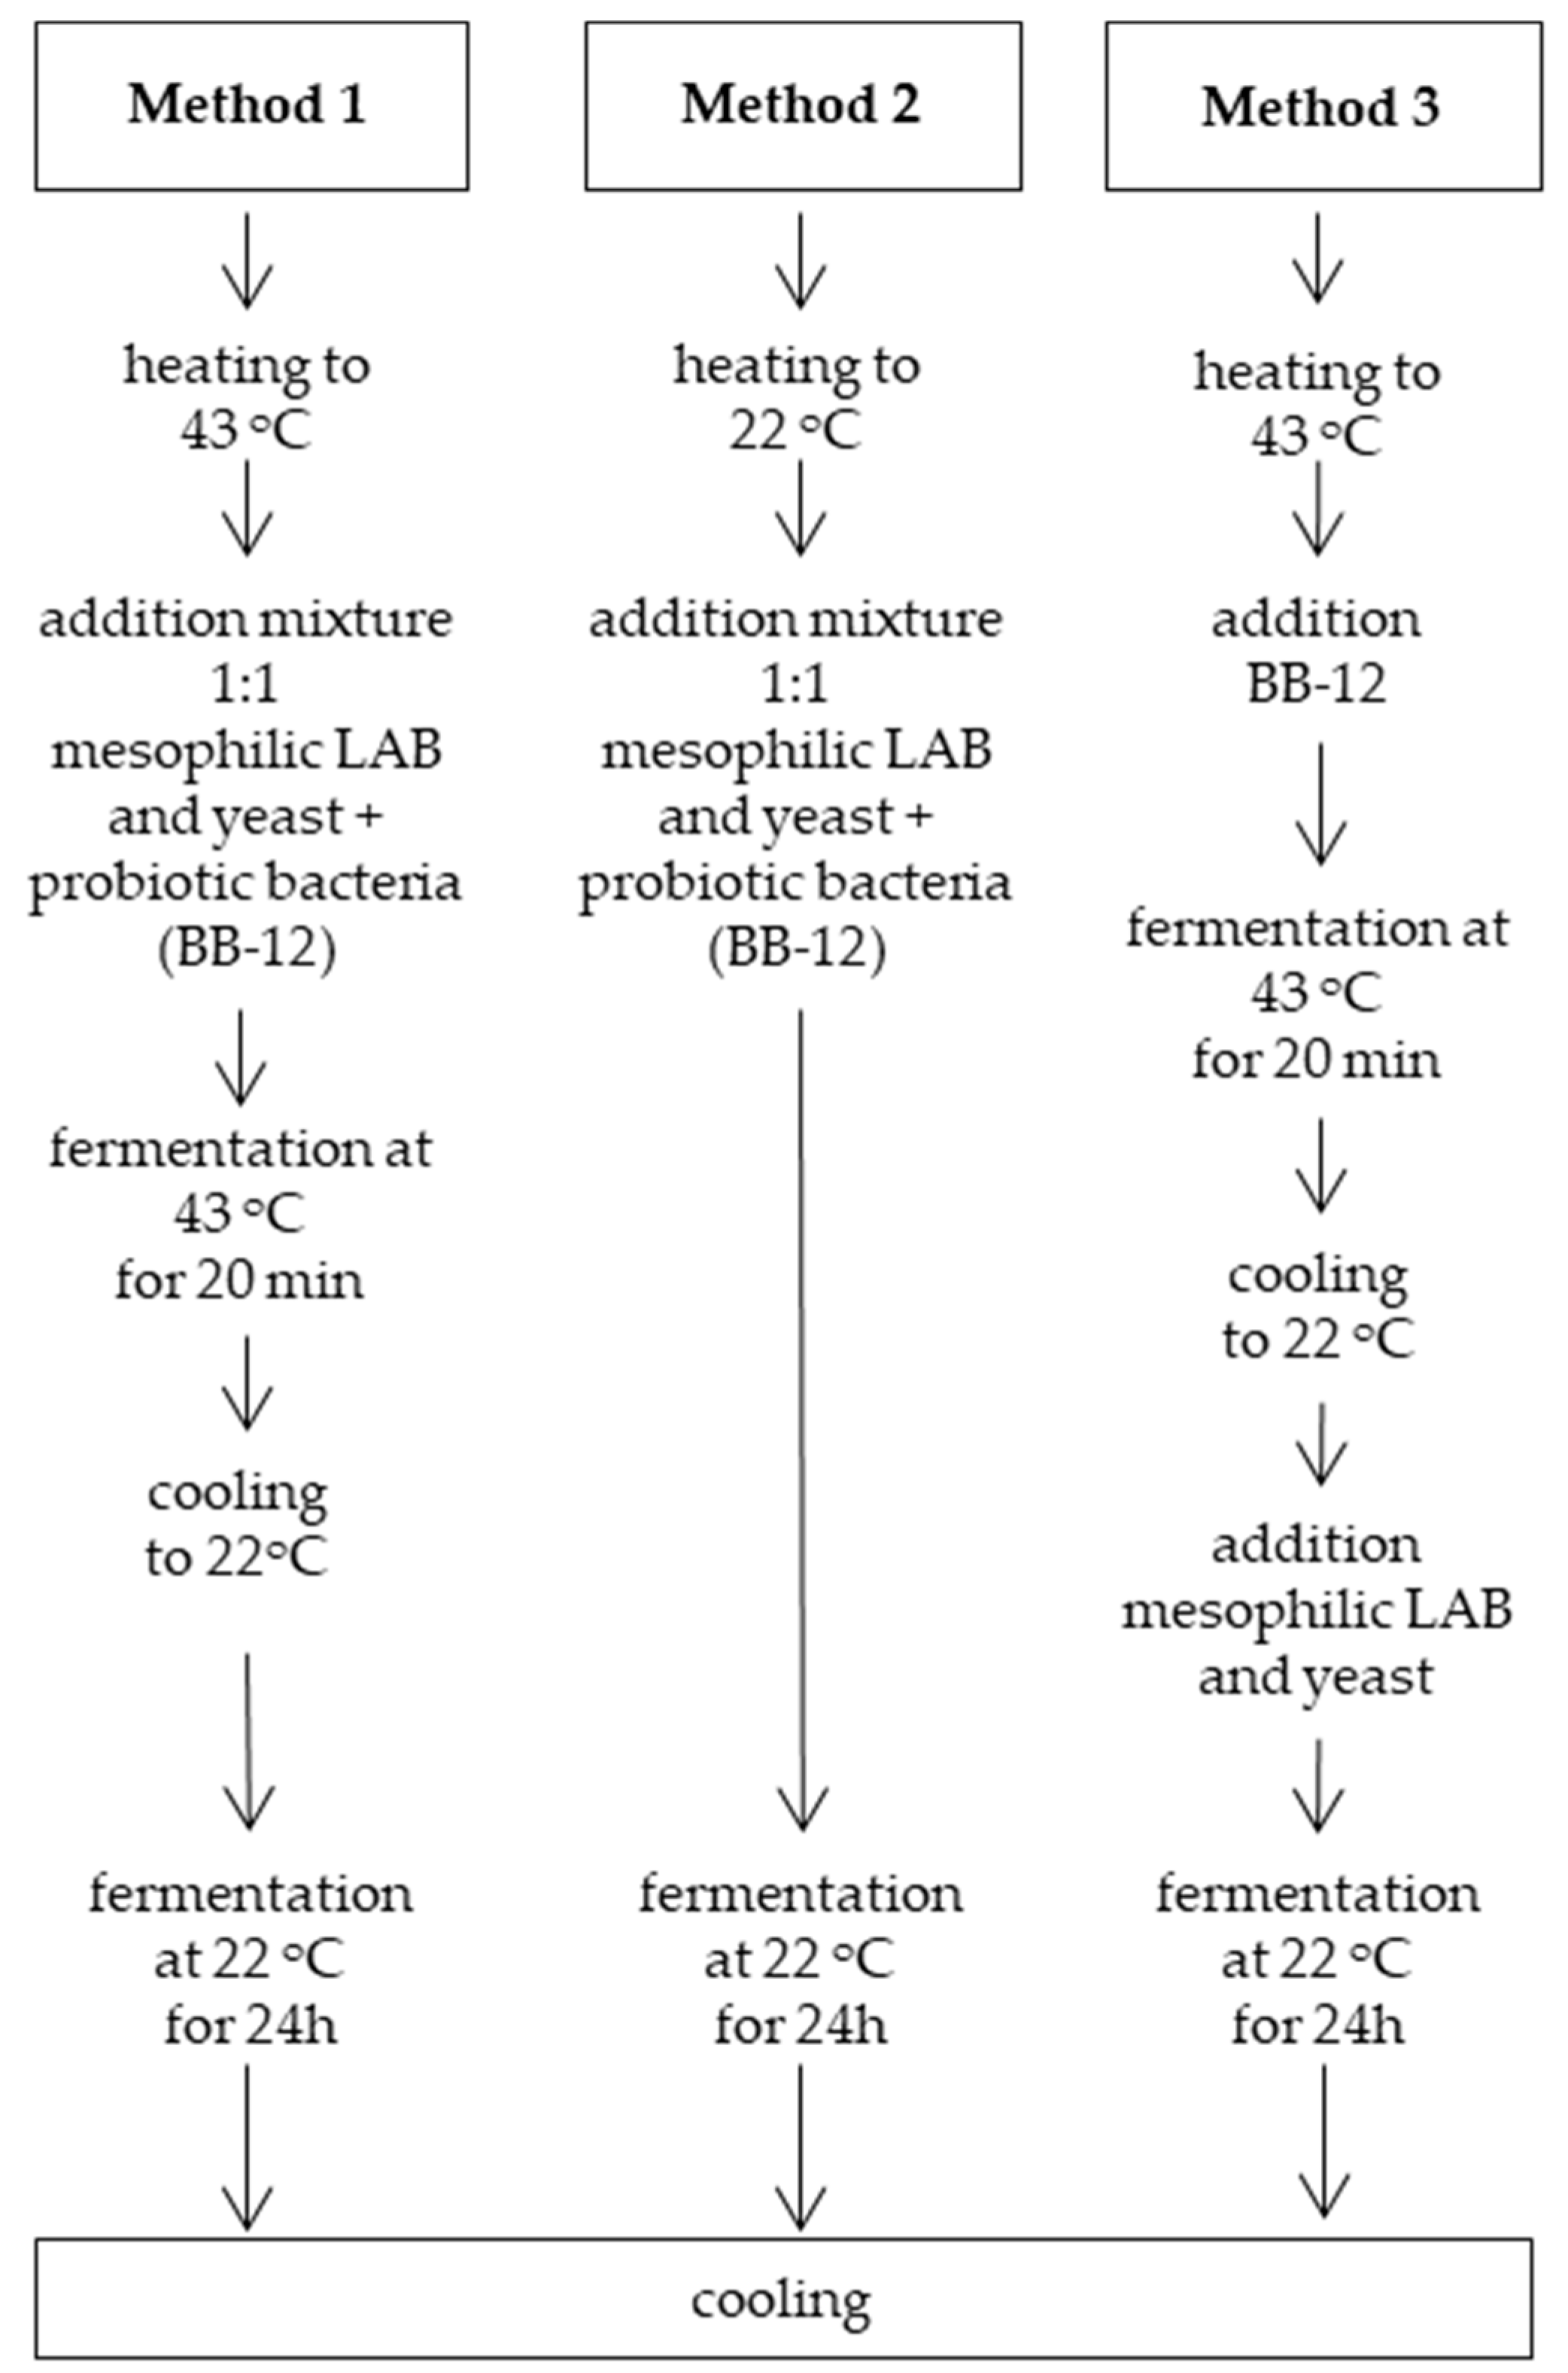
2.1. Preparation of Probiotic Kefir Samples

Commercial pasteurized cow’s milk (OSM, Głubczyce, Poland) with solid fat-free (SNF) content of 9.07% and 1.50% fat was used in this research. Milk underwent a lacto-alcoholic fermentation process using mesophilic strains of lactic acid bacteria (LAB). The strain with the joint trade code 75106 from the Abiasa Inc. (Quebec, QC, Canada) collection consisting of Lactococcus lactis subsp. lactis, Lactococcus lactis subsp. cremoris, Lactococcus lactis subsp. lactis biovar diacetylactis, Leuconostoc mesenteroides subsp. cremoris, Lactiplantibacillus plantarum, Lacticaseibacillus casei, and yeast Kluyveromyces fragilis (Kluyveromyces marxianus subsp. marxianus) were used. The probiotic bacteria used in the study were Bifidobacterium BB-12® Probio-Tec™, identified as Bifidobacterium animalis subsp. lactis, (Chr. Hansen, Hørsholm, Dania). Samples were prepared using three different methods according to Figure 1. In the first part of the experiment, samples were prepared following methods 1, 2, and 3. The kefir samples were prepared as follows: milk without additives (K_0); milk fortified with WPC80 5% (w/v; SM Spomlek, Radzyn Podlaski, Poland; K_5). The next part of the experiment was extended to include fermentation in accordance with method 1. The kefir samples were prepared as follows: milk without additives (K_0); milk fortified with WPC80 1% (K_1), 3% (K_3), and 5% (w/v; K_5). The lyophilized form of the starter cultures was added at 30 units of activity per 100 L of milk. The fermentation process was conducted at 22 °C for a duration of 24 h. The fermentation process took place in a thermally insulated coagulation tank with a beam stirrer positioned asymmetrically. The dosage of the introduced cultures was selected to produce a final fermentation product with a pH value of 4.4−4.5. The products were poured into PS (polystyrene) packaging. The container had capacity for 150 g of the product. After packaging, the products were cooled to 5 ± 1 °C. The process was conducted at the pilot plant scale.

2.2. Proportion of L(+)-Lactic Acid

The proportion of L(+)-lactic acid was determined using an enzymatic reaction in which L(+)-lactic acid is oxidized to pyruvate using nicotinamide adenine dinucleotide (NAD+) and l-lactate dehydrogenase (L-LDH). The resulting pyruvate was spin-tapped using d-glutamic pyruvate transaminase (D-GPT) [23,24]. The K-DLATE experimental set produced by Megazyme was used for this assessment (Wicklow, Ireland). The kefir sample (0.1 mL) to be classified was mixed with 0.5 mL of glycylglycine buffer (0.5 M, pH 10.0), 0.1 mL of NAD+, and 0.02 mL of D-GPT suspension (1300 U/mL). The classification of samples was carried out as follows: 1 g of kefir was added to a 100 mL volumetric flask containing 60 mL of distilled water. Next, 2 mL of Carrez I reagent, 2 mL of Carrez II reagent, and 4 mL of NaOH solution (100 mM) were added. The concentration of L(+)-lactic acid was determined by measuring the change in absorbance at a wavelength of 340 nm before and after the addition of 0.02 mL of l-LDH (2000 U/mL) to the previously prepared suspended matter.

2.3. Lactase Activity

Lactase activity was determined using the method proposed by Passerat and Desmaison [25]. The results were reported in microkatals per one hundred grams (μkat/100 g) of sample. One unit of enzyme was defined as the quantity of catalyst that converted 1 mol of the substrate within 1 s under the specified reaction conditions.

2.4. Determination of the Lactic Acid and Ethanol Content

The HPLC method was used to determine the levels of lactic acid, ethanol, lactose, and galactose in the fermented samples [26,27]. Thermal acid hydrolysis was performed to eliminate protein from the assays. Samples (0.3 g) were mixed with 0.3 mL of 0.01 M H2SO4 (for samples collected after fermentation) or with 0.013 M H2SO4 (for samples collected before fermentation). The hydrolysis was conducted at 80 °C for 20 min, after which the samples were processed in a centrifuge for 10 min at 3500× g at 25 °C, and the resulting supernatant was filtered using a Millex filter (LCR PTFE 0.45 nm; Millipore Co., Carrigtwohill, Ireland). The filtrate was injected into an HPX 87H column (BioRad, Hercules, CA, USA) combined with a refractive index (RI) detector. The volume of the injected sample was 20 μL. The mobile phase consisted of a 5 mM H2SO4 solution. The analysis was conducted for a duration of 30 min at 30 °C using a flow rate of 0.6 mL/min [28].

2.5. Determination of the Number of Mesophilic Lactic Acid Bacteria, Yeast, and Probiotic Bacteria

Isolation and determination of the number of lactic acid bacteria of the genera Lactobacillus, Pediococcus, and Leuconostoc were performed on the MRS agar medium de Man, Rogos and Sharp no. 110660 from Merck KgaA (Darmstadt, Germany) [29]. The medium (68.2 g/L) was characterized by a pH value of 5.7 at 25 °C following dissolution and autoclaving (15 min at 121 °C). The substrate was contaminated with the tested material using the cast tile method. Incubation was carried out at 37 ± 1 °C for 72 h under anaerobic conditions in a WTB Binder thermostat (Tuttlingen, Germany). TOS-Agar from Yakult Pharmaceutical Ind. was used to determine the number of Bifidobacterium probiotic bacteria. What. Ltd. (Tokyo, Japan) [30]. Selective YGC agar with yeast extract, glucose, and chloramphenicol (0.1 g/L) no. 116000.0500 from Merck KgaA (Darmstadt, Germany) was used to isolate and quantify yeasts. The 40.0 g/L of medium was sterilized at 121 °C for 15 min and adjusted to pH 6.6. The incubation process was conducted at 25 ± 1 °C for 96 h in a WTB Binder thermostat (Tuttlingen, Germany) [31]. The test sample was prepared following the principles of microbiological practice using an isotonic physiological solution with peptone (1.0 g/L) No. 112535 from Merck KgaA (Darmstadt, Germany) [32].

2.6. Texture Analysis

The texture parameters, including firmness, consistency, cohesiveness, and viscosity were measured using a TA.XT-plus texture analyzer by Stable Micro Systems (Surrey, UK). The analyzer was compatible with the Texture Exponent E32 software version 4.0.9.0 and the measurements were obtained using back extrusion. The samples were placed inside a cylinder of Ø = 50 mm (75% filled). The A/BE attachment with compression disc (Ø = 35 mm) was used. The measurements were taken at a distance of 30 mm, with a pre-test speed of 1.0 mm/s, and a post-test speed of 10.0 mm/s. The apparent viscosity of the kefir samples was measured using a Viscotester VT5L rheoviscometer (HAAKE, Karlsruhe, Germany) equipped with an L3 rotor rotating at a speed of 60 rpm. The samples were measured at 12 ± 1 °C.

2.7. Color Measurements

The color measurements were conducted using an X-Rite SP-60 camera (X-Rite, Grandville, MI, USA). The whiteness index (WI), yellowness index (YI), and chroma (C*) were calculated using the following equation:
WI = 100 − [(100 − L*)2 + a*2 + b*2]0.5
YI = 142.86b*·L*−1
C* = (a*2 + b*2)0.5
The calculations assumed L = 100, a* = 0, and b* = 0.

2.8. Water Activity

The water activity was determined using an AquaLab Series 4TE instrument (Decagon Devices Inc., Pullman, WA, USA) based on pf (T), the value of the water vapor that was in equilibrium with the sample maintained at a constant level during the measurement at temperature T, and ps (T), the vapor pressure of saturated pure water at the same temperature T, as aw = pf (T)/ps (T). Samples of 15 mL were placed in DE 501 vessels (Decagon Devices Inc., Pullman, WA, USA) and tested at 15 °C.

2.9. Statistical Evaluation

The statistical hypotheses were verified at a significance level of α = 0.05. A two-way ANOVA test was conducted in the first part of the experiment for the comparisons between the methods and the whey protein addition, followed by multiple post hoc comparisons using a Tukey Honestly Significant Difference (HSD) test. In the second part of the experiment, repeated measures of ANOVA were conducted for the comparison between the whey protein groups and the storage time. The statistical calculations were performed using IBM SPSS analysis software, version 23.

3. Results and Discussion

3.1. Number of Bacteria in Probiotic Kefir with Whey Protein Addition

The quantification of microorganisms in kefir is necessary for quality control of commercial kefir products and for establishing optimal fermentation and storage conditions [33]. Yeast and lactobacilli grow in balanced proportions in kefir grains, and a symbiosis between yeast, lactobacilli, and streptococci has been observed during kefir production [34]. The LAB and yeast levels in kefir grains vary widely and might range from 6.4 × 10⁴ to 8.5 × 10⁸ and 1.5 × 10⁵ to 3.7 × 10⁸ cfu/mL, respectively [34,35]. A study showed that in addition to 108 cfu/mL of lactobacilli and lactococci and 105 cfu/mL of yeast, kefir also contained 106 cfu/mL of acetic acid bacteria [34,36]. The levels of yeast in kefir vary, with reported values ranging from 103 to 106 [34,36].
We conducted a study to examine the impact of incorporating whey protein into kefir production using three different methods on the amounts of yeast, bacteria, and probiotic bacteria. For the yeast enumeration, method 1 (K_0 = 4.23 ± 0.57 and K_5 = 4.28 ± 0.47 log cfu/mL) showed significantly higher values compared to method 3 (2.87 ± 0.38 and 3.00 ± 0.32 log cfu/mL) for both K_0 and K_5 (Table 1; p < 0.05). The reason behind this finding could be that the initial high-temperature fermentation (43 °C for 20 min) may selectively favor the initial growth and activation of yeast cells, giving them a head start before other microorganisms begin to dominate. Yeasts are generally more thermotolerant compared to many lactic acid bacteria, so this temperature might provide a competitive advantage to the yeast. In the study Corbu et al. conducted, the strains H. (O.) polymorpha Y-CMGB 233 and C. krusei Y-SM3 demonstrated robust growth at 42 °C, a noteworthy trait since this temperature is considered optimal for thermotolerant and thermophilic yeasts [37]. The yeast used in our study was Kluyveromyces fragilis known for its ability to grow well at higher temperatures, with an optimal growth range of 30–37 °C [38]. K_0 and K_5 showed no significant difference in yeast enumeration for all of the methods. A study examining the microbiological characteristics of Brazilian kefir yeast revealed that the enumeration of yeast ranged from min. 6.21 ± 0.01 to max. 8.11 ± 0.03 log10 cfu/mL. The same study also showed that LAB enumeration ranged from min. 3.51 ± 0.01 to max. 12.41 ± 0.03 log10 cfu/mL [39]. Kim et al. discovered that LAB enumeration in kefir milk was 9.62 ± 0.19 log cfu/mL [33]. No significant difference was observed for the bacteria enumeration between the methods used in the current study. Also, whey protein addition had no statistically significant effect on bacteria enumeration for any of the methods. A higher probiotic bacteria count was observed for method 1 followed by method 2 and then method 3 (p < 0.05). The K_5 probiotic bacteria count, however, showed no difference between method 1 and method 2. Whey protein addition resulted in a higher probiotic bacteria count for method 2 and method 3 but a lower probiotic bacteria count for method 1 (p < 0.05). In the study Ziarno et al. [40] conducted, whey protein concentrate addition showed no impact on the LAB count in kefir samples. Addition of various forms of milk proteins, including WPC, sweet whey, demineralized whey, and non-demineralized whey, may affect the LAB population in the resulting kefirs. However, the type of starter culture, as well as temperature, may also influence the bacterial count. Depending on the starter culture used, milk protein preparations may affect parameters such as hardness and viscosity in kefir samples. Therefore, in order to obtain kefir with the desired and expected quality standards, it is important to carefully select the appropriate starter culture when using additives in industrial production [40].

3.2. Lactase Enzymatic Activity and Changes in Lactic Acid and Ethanol Contents

Kefir is a fermented milk with unique sensory properties due to the mixture of lactic acid, acetaldehyde, ethanol, and other fermentation byproducts from various microorganisms present in kefir grains [41]. Kefir grains undergo fermentation, a process that results in the release of numerous components such as lactic acid, acetic acid, ethanol, and CO2 [42]. During the process of kefir fermentation, lactic acid bacteria (LAB) convert lactose into lactic acid, while yeasts ferment lactose to produce CO2 and small quantities of ethanol [41]. L(+) lactic acid reaches its highest concentrations after fermentation and is derived from 25% of the lactose originally present in the starter milk. The ethanol concentration of kefir is influenced by factors such as fermentation duration, temperature, and the type of starter culture used [42]. A study analyzing organic acids in kefir showed that lactic acid had the highest concentration (7.30 mg/mL), followed by acetic acid (6.50 mg/mL). It was also found in this study that ethanol production reached a concentration value of 0.22% (w/w) [42].
Fermentation parameters such as the type of kefir culture, temperature, and duration affect the final microbial, chemical, and sensory quality of kefir [41]. We conducted a comparative analysis of three different methods for kefir production and investigated the effects of the different methods on the changes in lactic acid content, the proportion of L(+) in total lactic acid content, and changes in ethanol content. Higher values for changes in lactic acid content were observed in kefirs (K_0 and K_5) produced using method 3 compared to kefirs (K_0 and K_5) produced using method 1 (Table 2; p < 0.05). The changes in the lactic acid content of K_0 produced using method 2 exhibited a greater increase compared to K_0 produced using method 1. These results could be due to initial heating and fermentation temperature at 43 °C in method 1, as this temperature might cause a lower lactase enzyme activity [43]. Supporting this, we observed a higher lactase enzymatic activity with method 2 compared to method 1 (Table 2; p < 0.05). Lactic acid provides a pleasant taste and inhibits the development of undesirable or pathogenic microorganisms due to the increase in the acidity of the medium; therefore, the levels of lactic acid in kefir are of great importance [39]. Dimitreli et al. found that the addition of 5% whey protein resulted in higher lactic acid concentrations in kefir [11]. On the other hand, we discovered that the addition of 5% whey protein had no effects on lactic acid concentration in methods 1 and 3. Only in method 2 did we observe a lower lactic acid concentration when compared to kefir without the whey protein addition. The kefirs (K_0 and K_5) produced using method 2 had the largest proportion of L(+) form in total content, followed by methods 1 and 3 (p < 0.05). K_5 had significantly higher values compared to K_0 across all the methods (methods 1, 2, and 3). Therefore, addition of whey protein resulted in an increased proportion of L(+) form in total content. A study comparing the effects of fermentation temperature on lactic acid content revealed that an elevated temperature (37 °C) resulted in a higher lactic acid concentration compared to the standard room temperature. The authors concluded that temperature above 30 °C enabled optimal growth of lactic acid bacteria, resulting in increased production of lactic acid [44]. A study investigating the chemical composition of Brazilian kefir showed that lactic acid concentration increased during the 24 h fermentation process, reaching a value of 17.4 mg/mL. The same study also showed that the ethanol concentration reached 0.5 mg/mL after 24 h of fermentation [39]. In our study, we found that kefirs (K_0 and K_5) produced using method 2 exhibited higher changes in ethanol content compared to those generated using methods 1 and 3 (p < 0.05). K_0 showed significantly higher values than K_5 across all of the methods (methods 1, 2, and 3). In another study, WPC supplementation resulted in higher ethanol concentration (0.32 mL/100 mL) compared to control kefir [45]. It is reported that traditional kefir typically contains 0.04−0.3 mL/100 mL of ethanol. However, by mixing milk throughout the fermentation stage and ensuring optimal ripening conditions, the product can contain 0.8−1.3 mL/100 mL of ethanol [46].
On the other hand, whey protein addition (5%, w/v) to kefir showed no significant difference in lactase enzymatic activity, regardless of the method used. Lactase belongs to the β-galactosidase enzyme family and is involved in the hydrolysis of the disaccharide lactose into its component galactose and glucose [47]. Improvement of digestibility is generally attributed to lactase activity associated with LAB and other probiotic organisms that are isolated from kefir [47].

3.3. Texture and Color of Probiotic Kefir with Whey Protein Addition

Maintaining the optimal texture of kefir can pose challenges in the commercial production of alternative fermented dairy products. Therefore, rheological measurements are of great importance in revealing various interactions in fermented milk [48]. The findings of this study demonstrated that K_0 and K_5 led to significantly lower firmness, consistency, cohesiveness, and viscosity during cold storage (p < 0.05; Table 3; day 0 vs. day 14). As shown in Table 3, no statistically significant difference was observed for firmness, consistency, cohesiveness, and viscosity during cold storage of K_1 and K_3 (p > 0.05; day 0 vs. day 14). On the other hand, K_1 and K_3 showed significantly lower firmness, consistency, cohesiveness, and viscosity on day 0 compared to K_0 (p < 0.05), while K_5 showed higher firmness and consistency compared to K_1 and K_3 on day 0 (p < 0.05). In the study conducted by Dimitreli et al., WPC addition increased the apparent viscosity of kefir samples. According to their results, the consistency index increased gradually in the following order: WPC 0% < WPC 1% < WPC 3% < WPC 5% [11]. In the study by Bierzuńska et al., the addition of WPC80 (5.6%; w/v) to yogurt resulted in increased firmness but reduced cohesiveness compared to control yogurt [49]. In another study, the addition of whey protein to kefir resulted in decreased firmness and cohesiveness. The viscosity of kefir with WPC80 was found to be 70% lower compared to that of kefir with SMP (skim milk powder). The study found that the consistency of kefirs containing a higher concentration of whey proteins remained constant throughout the storage period [50]. In another study, when WPC was added to yogurt, lower firmness levels were observed with increased WPC concentrations [51]. The texture of kefir plays a crucial role in determining the acceptability of the product; therefore, it is imperative that the textural properties remain consistent throughout the storage period [48].
The viscosity of kefir is primarily determined by the proportion and size of casein micelles [52,53]. Moreover, the content of acetic acid bacteria, lactic acid bacteria, and exopolysaccharides was found to have an impact on the viscosity [53,54]. In the study conducted by İnce-Çoşkun et al. [53], plain kefir showed almost no change in viscosity during the storage period. Conversely, the addition of whey protein particles to kefir resulted in decreased viscosity through the storage time. The authors concluded that during storage, the microorganisms in the kefir metabolized the protein particles, which caused the volume fraction to decrease. Moreover, the disintegration of protein particles might have also reduced the volume fraction of particles during storage, leading to a reduction in the viscosity values [53]. Consistent with the aforementioned study, we observed a significantly lower viscosity with kefir prepared with whey protein addition during the storage period (Table 3; p < 0.05). Furthermore, our results showed that the addition of whey protein increased the viscosity on day 0, as K_1, K_3, and K_5 had significantly higher viscosity levels compared to the starting level observed in sample K_0 (p < 0.05). The study conducted by Wang et al. [15] showed that the addition of polymerized whey protein to kefir increased the viscosity. Consistent with our findings, the viscosity levels of the samples decreased during the storage period in their study [15]. Similarly, in another study, whey protein concentrate addition (WPC 1%, 3%, and 5%) to kefir samples resulted in increased apparent viscosity [11]. The viscosity of protein solutions generally increases exponentially with increasing protein concentration. Therefore, the increase in the viscosity of kefir samples prepared with the addition of WPC, as opposed to the kefir sample prepared without the addition of WPC, can be attributed to the increased concentration of native whey proteins [11].
Color is one of the important determinants of quality and can significantly influence the acceptability of the product by the consumer. Color changes may take place at all stages of milk processing. The Maillard reaction, which occurs during the heating process, exemplifies the phenomenon of color changes that take place during food processing. The phenomenon of color change can be also observed during the fermentation process. Therefore, instrumental color measurement becomes important. Moreover, based on the color measurement, it is possible to optimize and select the conditions of the technological processes [48]. Our results showed that the addition of whey protein decreased the white index WI of the kefir samples on day 0. K_0 had the highest WI, followed by K_1, K_3, and K_5 on day 0 (Table 4; p < 0.05). On day 14, it was observed that the WI was highest in sample K_1 followed by K_0, K_5, and K_3. K_0 showed a decrease in the WI between day 0 and day 14 (Table 4; p < 0.05). For the yellowing index (YI), K_1 had a significantly higher value on day 0 compared to K_0 (p < 0.05). No significant difference was observed in the YI of the kefir samples throughout the storage period (p > 0.05). On day 0, K_3 had a lower chrome (C) value compared to K_1 (p < 0.05). We observed increased C values for both K_3 and K_5 during the storage period (Day 0 vs. Day 14; p < 0.05). In the study Bierzuńska et al. [49] conducted, the addition of WPC80 (5.6%; w/v) to milk during yogurt production resulted in increased WI values compared to the control yogurt (p < 0.05). Moreover, WPC80 addition also increased the YI index compared to control yogurt (p < 0.05). Color measurements of the dairy products allow for the optimization and selection of conditions in the production process. Additional research is needed in this context to conduct color measurements and optimize the production process of fermented milk products with kefir addition [49].

3.4. Water Activity

Water is an important ingredient influencing appearance, consistency, and taste, and acts as a solvent in the metabolism process in dairy products [55]. Water exerts a significant impact on the chemical, physical, and microbiological changes that occur in dairy products. Water activity (aw) is defined as the ratio of the water vapor pressure exerted by water in the food system (p) to the pressure of pure water (po) at the same temperature [56]. Our results showed that the addition of whey protein resulted in increased water activity in the K_3 and K_5 groups compared to K_0 on day 0 (Table 5; p < 0.05). The water activity of the kefir samples remained stable during the storage period, resulting in no significant difference observed between the kefir samples on day 14. In a study conducted on yogurt with WPC addition aw was shown to decrease as the WPC content increased [51]. The water activity measurement (aw) can be performed to assess the stability of the sensory properties of food, microbial changes, and the stability of dairy products during storage. The quality of food can be adversely affected by reactions that are dependent on the condition of the water, rather than the water’s presence in the product. For example, the higher the aw index, the faster the growth rate of undesirable microorganisms. The aw value of food products can be controlled through drying and adjusting the osmotic pressure of the food products. For dairy products, the pH of the product can be adjusted to values that will limit the growth of undesirable microorganisms [51].

4. Conclusions

We examined the effects of adding whey protein concentrate (WPC) on the rheological properties, color, water activity, bacterial count, and viscosity of probiotic kefir since these characteristics have a significant impact on the acceptability and the quality of the product. Our investigations suggested that the addition of whey proteins may increase the count of probiotic bacteria in specific production methods. The manufacturing method that resulted in the greatest quantity of probiotic bacteria in kefir immediately after production and storage was chosen from the three available methods for the second part of the research. This method employs a two-step fermentation process, initially at a higher temperature for a short time, followed by a lower temperature for a longer time. In the second part of the research, whey protein concentrate was added at 1, 3, and 5% to the kefir with the selected method of processing. We observed decreased firmness with 1 and 3% whey protein addition but increased firmness with 5% whey protein addition. The addition of whey protein decreased the whiteness index, WI. Overall, our results confirmed that WPC can be added to probiotic kefir to enhance its health benefits while preserving the rheological properties and the quality of kefir.

Author Contributions

Conceptualization, A.Y.Z., P.B., D.C.-S. and G.S.; methodology, A.Y.Z., P.B. and D.C.-S.; formal analysis, A.Y.Z. and P.B.; investigation, A.Y.Z. and P.B.; writing—original draft preparation, A.Y.Z. and P.B., supervision, D.C.-S. and G.S.; writing—review and editing, P.B., D.C.-S. and G.S. All authors have read and agreed to the published version of the manuscript.

Funding

Part of the study was supported by the Task entitled “The Research Network of Life Sciences Universities for the Development of the Polish Dairy Industry—Research Project” funded under the designated subsidy of the Minister of Science and Higher Education (MEiN2023/DPI/280) and grant No. 506.784.03.00/UPP-KMIP from the Ministry of Science and Higher Education (Poznań, Poland).

Institutional Review Board Statement

Not applicable

Informed Consent Statement

Not applicable

Data Availability Statement

The authors confirm that the data supporting the findings of this study are available within the article.

Conflicts of Interest

The authors declare no conflicts of interest.

References

  1. Saleem, K.; Ikram, A.; Saeed, F.; Afzaal, M.; Ateeq, H.; Hussain, M.; Raza, A.; Rasheed, A.; Asghar, A.; Asif Shah, M. Nutritional and functional properties of kefir: Review. Int. J. Food Prop. 2023, 26, 3261–3274. [Google Scholar] [CrossRef]
  2. Bengoa, A.A.; Iraporda, C.; Garrote, G.L.; Abraham, A.G. Kefir Micro-organisms: Their role in grain assembly and health properties of fermented milk. J. Appl. Microbiol. 2019, 126, 686–700. [Google Scholar] [CrossRef]
  3. Azizi, N.F.; Kumar, M.R.; Yeap, S.K.; Abdullah, J.O.; Khalid, M.; Omar, A.R.; Osman, M.A.; Mortadza, S.A.S.; Alitheen, N.B. Kefir and its biological activities. Foods 2021, 10, 1210. [Google Scholar] [CrossRef] [PubMed]
  4. Al-Mohammadi, A.R.; Ibrahim, R.A.; Moustafa, A.H.; Ismaiel, A.A.; Abou Zeid, A.; Enan, G. Chemical constitution and antimicrobial activity of kefir fermented beverage. Molecules 2021, 26, 2635. [Google Scholar] [CrossRef] [PubMed]
  5. Miao, J.; Liu, G.; Ke, C.; Fan, W.; Li, C.; Chen, Y.; Dixon, W.; Song, M.; Cao, Y.; Xiao, H. Inhibitory effects of a novel antimicrobial peptide from kefir against Escherichia coli. Food Control 2016, 65, 63–72. [Google Scholar] [CrossRef]
  6. da Silva Ghizi, A.C.; de Almeida Silva, M.; de Andrade Moraes, F.S.; da Silva, C.L.; Endringer, D.C.; Scherer, R.; Lenz, D.; de Lima, E.M.; Brasil, G.A.; Maia, J.F.; et al. Kefir improves blood parameters and reduces cardiovascular risks in patients with metabolic syndrome. PharmaNutrition 2021, 16, 100266. [Google Scholar] [CrossRef]
  7. da Conceição Teixeira de Moura, A.; Dornelas de Oliveira Martins, A.; Furtado Martins, E.M.; Olmi Silva, V.R.; Ribeiro da Silva, R.; Fagner da Cruz, W. In vitro resistance of lactic acid bacteria carried in kefir appetizer enriched with agroindustrial by-products. LWT 2021, 139, 110519. [Google Scholar] [CrossRef]
  8. Farag, M.; Jomaa, S.; El-Wahed, A.A.; El-Seedi, H.R. The many faces of kefir fermented dairy products: Quality characteristics, flavour chemistry, nutritional value, health benefits, and safety. Nutrients 2020, 12, 346. [Google Scholar] [CrossRef]
  9. Barukčić, I.; Gracin, L.; Jambrak, A.R.; Božanić, R. Comparison of chemical, rheological and sensory properties of kefir produced by kefir grains and commercial kefir starter. Mljekarstvo 2017, 67, 169–176. [Google Scholar] [CrossRef]
  10. Guangsen, T.; Xiang, L.; Jiahu, G. Microbial diversity and volatile metabolites of kefir prepared by different milk types. CyTA—J. Food 2021, 19, 399–407. [Google Scholar] [CrossRef]
  11. Dimitreli, G.; Gregoriou, E.A.; Kalantzidis, G.; Antoniou, K.D. Rheological properties of kefir as affected by heat treatment and whey protein addition. J. Texture Stud. 2013, 44, 418–423. [Google Scholar] [CrossRef]
  12. Cais-Sokolińska, D.; Wójtowski, J.; Pikul, J. Rheological, texture and sensory properties of kefir from mare’s milk and its mixtures with goat and sheep milk. Mljekarstvo 2016, 66, 272–281. [Google Scholar] [CrossRef]
  13. Sarkar, S. Biotechnological Innovations in kefir production: A Review. Br. Food J. 2008, 110, 283–295. [Google Scholar] [CrossRef]
  14. Travičić, V.; Šovljanski, O.; Tomić, A.; Perović, M.; Milošević, M.; Ćetković, N.; Antov, M. Augmenting functional and sensorial quality attributes of kefir through fortification with encapsulated blackberry juice. Foods 2023, 12, 4163. [Google Scholar] [CrossRef] [PubMed]
  15. Wang, H.; Wang, C.; Wang, M.; Guo, M. Chemical, physiochemical, and microstructural properties, and probiotic survivability of fermented goat milk using polymerized whey protein and starter culture kefir Mild 01. J. Food Sci. 2017, 82, 2650–2658. [Google Scholar] [CrossRef]
  16. Yiğit, A.; Bielska, P.; Cais-Sokolińska, D.; Samur, G. Whey proteins as a functional food: Health effects, functional properties, and applications in food. J. Am. Nutr. Assoc. 2023, 42, 758–768. [Google Scholar] [CrossRef] [PubMed]
  17. Minj, S.; Anand, S. Whey proteins and its derivatives: Bioactivity, functionality, and current applications. Dairy 2020, 1, 233–258. [Google Scholar] [CrossRef]
  18. Patel, S. Functional food relevance of whey protein: A review of recent findings and scopes ahead. J. Funct. Foods 2015, 19, 308–319. [Google Scholar] [CrossRef]
  19. Gantumur, M.A.; Sukhbaatar, N.; Jiang, Q.; Enkhtuya, E.; Hu, J.; Gao, C.; Jiang, Z.; Li, A. Effect of modified fermented whey protein fortification on the functional, physical, microstructural, and sensory properties of low-fat yogurt. Food Control 2024, 155, 110032. [Google Scholar] [CrossRef]
  20. Berber, M.; González-Quijano, G.K.; Alvarez, V.B. Whey protein concentrate as a substitute for non-fat dry milk in yogurt. J. Food Process Technol. 2015, 6, 530. [Google Scholar] [CrossRef]
  21. Sabokbar, N.; Khodaiyan, F. Characterization of pomegranate juice and whey based novel beverage fermented by kefir grains. J. Food Sci. Technol. 2015, 52, 3711–3718. [Google Scholar] [CrossRef] [PubMed]
  22. Codex Alimentarius Commission. CODEX Standard for Fermented Milk. Codex Stan 2003, 243–2003. Available online: https://www.fao.org/fao-who-codexalimentarius/en/ (accessed on 23 June 2022).
  23. Gawehn, K. D-(-)-Lactate. In Methods of Enzymatic Analysis; Bergmeyer, H.U., Ed.; VCH Publishers: Cambridge, UK, 1988; pp. 588–592. [Google Scholar]
  24. Noll, F. L-(+)-Lacate. In Methods of Enzymatic Analysis; Bergmeyer, H.U., Ed.; VCH Publishers: Cambridge, UK, 1988; pp. 582–588. [Google Scholar]
  25. Passerat, B.; Desmaison, A.M.; Pharmaceutiques, D.S.; de Conférences, M. Lactase Activity of Bifidobacterium bifidum. Nutr. Res. 1995, 15, 1287–1295. [Google Scholar] [CrossRef]
  26. Indyk, H.; Edwards, M.; Woollard, D.C. High performance liquid chromatographic analysis of lactose-hydrolysed milk. Food Chem. 1996, 57, 575–580. [Google Scholar] [CrossRef]
  27. Bylund, D.; Norström, S.; Essén, S.A.; Lundström, U.S. Analysis of low molecular mass organic acids in natural waters by ion exclusion chromatography tandem mass spectrometry. J. Chromatogr. 2007, 1176, 89–93. [Google Scholar] [CrossRef] [PubMed]
  28. Cais-Sokolińska, D.; Wójtowski, J.; Pikul, J.; Danków, R.; Majcher, M.; Teichert, J.; Bagnicka, E. Formation of volatile compounds in kefir made of goat and sheep milk with high polyunsaturated fatty acid content. J. Dairy Sci. 2015, 98, 6692–6705. [Google Scholar] [CrossRef]
  29. Mainville, I.; Montpetit, D.; Durand, N.; Farnworth, E.R. Deactivating the bacteria and yeast in kefir using heat treatment, irradiation and high pressure. Int. Dairy J. 2001, 11, 45–49. [Google Scholar] [CrossRef]
  30. Markiewicz, L.; Biedrzycka, E. Identification of Lactobacillus and Bifidobacterium species with PCR applied to quality control of fermented dairy beverages. Pol. J. Food Nutr. Sci. 2005, 14, 359–365. [Google Scholar]
  31. Gadaga, T.H.; Mutukumira, A.N.; Narvhus, J.A. Enumeration and identification of yeasts isolated from Zimbabwean traditional fermented milk. Int. Dairy J. 2000, 10, 459–466. [Google Scholar] [CrossRef]
  32. Simova, E.; Simov, Z.; Beshkova, D.; Frengova, G.; Dimitrov, Z.; Spasov, Z. Amino acid profiles of lactic acid bacteria, isolated from kefir grains and kefir starter made from them. Int. J. Food Microbiol. 2006, 107, 112–123. [Google Scholar] [CrossRef]
  33. Kim, D.H.; Chon, J.W.; Kim, H.; Kim, H.S.; Choi, D.; Hwang, D.G.; Seo, K.H. Detection and enumeration of Lactic Acid Bacteria, Acetic Acid Bacteria and Yeast in kefir grain and milk using quantitative Real-Time PCR. J. Food Saf. 2015, 35, 102–107. [Google Scholar] [CrossRef]
  34. Arslan, S. A Review: Chemical, microbiological and nutritional characteristics of kefir. CyTA—J. Food 2015, 13, 340–345. [Google Scholar] [CrossRef]
  35. Witthuhn, R.C.; Schoeman, T.; Britz, T.J. Isolation and characterization of the microbial population of different South African Kefir grains. Int. J. Dairy Technol. 2004, 57, 33–37. [Google Scholar] [CrossRef]
  36. Irigoyen, A.; Arana, I.; Castiella, M.; Torre, P.; Ibáñez, F.C. Microbiological, physicochemical, and sensory characteristics of kefir during storage. Food Chem. 2005, 90, 613–620. [Google Scholar] [CrossRef]
  37. Corbu, V.M.; Petrut, S.; Pelinescu, D. Environmental Stress Responses in Yeasts and Lactic Acid Bacteria Strains Isolated from Dairy Traditional Romanian Fermented Products. Rom. Biotechnol. Lett. 2021, 26, 2548–2559. [Google Scholar] [CrossRef]
  38. Ghaly, A.E.; Kamal, M.; Avery, A. Influence of temperature rise on kinetic parameters during batch propagation of Kluyveromyces Fragilis in cheese whey under ambient conditions. World J. Microbiol. Biotechnol. 2003, 19, 741–749. [Google Scholar] [CrossRef]
  39. Magalhães, K.T.; Pereira, G.V.D.M.; Campos, C.R.; Dragone, G.; Schwan, R.F. Brazilian Kefir: Structure, microbial communities and chemical composition. Braz. J. Microbiol. 2011, 42, 693–702. [Google Scholar] [CrossRef]
  40. Ziarno, M.; Hasalliu, R.; Cwalina, A. Effect of the addition of milk protein preparations on selected quality parameters and nutritional characteristics of kefir. Appl. Sci. 2021, 11, 966. [Google Scholar] [CrossRef]
  41. Kök-Taş, T.; Seydim, A.C.; Özer, B.; Guzel-Seydim, Z.B. Effects of different fermentation parameters on quality characteristics of kefir. J. Dairy Sci. 2013, 96, 780–789. [Google Scholar] [CrossRef]
  42. Ismaiel, A.A.; Ghaly, M.F.; El-Naggar, A.K. Some physicochemical analyses of kefir produced under different fermentation conditions. J. Sci. Ind. Res. 2011, 70, 365–372. [Google Scholar]
  43. Popescu, L.; Bulgaru, V.; Siminiuc, R. Effect of temperature, pH and amount of enzyme used in the lactose hydrolysis of milk. Food Nutr. Sci. 2021, 12, 1243–1254. [Google Scholar] [CrossRef]
  44. Putri, Y.D.; Setiani, N.A.; Warya, S. The Effect of temperature, incubation and storage time on lactic acid content, pH and viscosity of goat milk kefir. Curr. Res. Biosci. Biotechnol. 2020, 2, 101–104. [Google Scholar] [CrossRef]
  45. Tratnik, L.; Božanić, R.; Herceg, Z.; Drgalić, I. The quality of plain and supplemented kefir from goat’s and cow’s milk. Int. J. Dairy Technol. 2006, 59, 40–46. [Google Scholar] [CrossRef]
  46. Seiler, H. A Review: Yeasts in kefir and kumiss. Milchwissenschaft 2003, 58, 392–396. [Google Scholar]
  47. Jeong, D.; Kim, D.-H.; Chon, J.-W.; Kim, H.; Lee, S.-K.; Kim, H.-S.; Song, K.-Y.; Kang, I.-B.; Kim, Y.-J.; Park, J.-H.; et al. Evaluation and determination of lactase activity on various Lactic Acid Bacteria isolated from kefir by using HPLC. J. Milk Sci. Biotechnol. 2016, 34, 231–237. [Google Scholar] [CrossRef]
  48. Bielska, P.; Cais-Sokolińska, D.; Teichert, J.; Biegalski, J.; Kaczyński, Ł.K.; Chudy, S. Effect of honeydew honey addition on the water activity and water holding capacity of kefir in the context of its sensory acceptability. Sci. Rep. 2021, 11, 22956. [Google Scholar] [CrossRef] [PubMed]
  49. Bierzuńska, P.; Cais-Sokolińska, D.; Yiğit, A. Storage Stability of texture and sensory properties of yogurt with the addition of polymerized whey proteins. Foods 2019, 8, 548. [Google Scholar] [CrossRef]
  50. Bierzuńska, P.; Kaczyński, Ł.K.; Cais-Sokolińska, D.; Kulczyński, B. Texture profile of kefir and yogurt with modified configuration of proteins. Nauk. Przyr. Technol. 2017, 11, 10. [Google Scholar]
  51. Brodziak, A.; Król, J.; Barłowska, J.; Teter, A.; Florek, M. Changes in the physicochemical parameters of yoghurts with added whey protein in relation to the starter bacteria strains and storage time. Animals 2020, 10, 1350. [Google Scholar] [CrossRef]
  52. Buran, İ.; Akal, C.; Ozturkoglu-Budak, S.; Yetisemiyen, A. Rheological, sensorial and volatile profiles of synbiotic kefirs produced from cow and goat milk containing varied probiotics in combination with fructooligosaccharide. LWT 2021, 148, 111591. [Google Scholar] [CrossRef]
  53. İnce-Coşkun, A.E.; Özdestan-Ocak, Ö. Effect of whey protein isolate microparticle addition on some physical and chemical properties of kefir. Chem. Pap. 2022, 76, 3109–3118. [Google Scholar] [CrossRef]
  54. Gul, O.; Atalar, I.; Mortas, M.; Dervisoglu, M. Rheological, textural, colour and sensorial properties of kefir produced with buffalo milk using kefir grains and starter culture: A comparison with cows’ milk kefir. Int. J. Dairy Technol. 2018, 71, 73–80. [Google Scholar] [CrossRef]
  55. Setyawardani, T.; Sumarmono, J. Chemical and microbiological characteristics of goat milk kefir during storage under different temperatures. J. Indones. Trop. Anim. Agric. 2015, 40, 2460–6278. [Google Scholar] [CrossRef]
  56. Fox, P.F.; Uniacke-Lowe, T.; McSweeney, P.L.H.; O’Mahony, J.A. Water in milk and dairy products. In Dairy Chemistry and Biochemistry; Springer: Cham, Switzerland, 2015; pp. 299–320. [Google Scholar] [CrossRef]
Figure 1. Configurations for carrying out the fermentation process.
Fermentation 10 00495 g001
Table 1. Bacterial enumeration of probiotic kefir with whey protein addition.
Yeast (log cfu/mL)
Method 1Method 2Method 3
K_04.23 ± 0.57 aA3.70 ± 0.03 abA2.87 ± 0.38 bA
K_54.28 ± 0.47 aA3.62 ± 0.30 abA3.00 ± 0.32 bA
Bacteria (log cfu/mL)
Method 1Method 2Method 3
K_07.08 ± 0,65 aA6.92 ± 0.12 aA6.38 ± 0.56 aA
K_56.80 ± 1.01 aA7.00 ± 0.43 aA6.30 ± 0.41 aA
Probiotic bacteria (log cfu/mL)
Method 1Method 2Method 3
K_06.12 ± 0.02 aA4.86 ± 0.02 bA3.68 ± 0.02 cA
K_55.60 ± 0.17 aB5.52 ± 0.02 aB4.01 ± 0.01 bB
K_0, Kefir with no WPC addition (control); K_5, Kefir with 5% WPC addition. Values represent mean ± standard deviation. Different lowercase letters in the rows and different capital letters in the columns for each parameter indicate statistically significant differences at the level α = 0.05.
Table 2. Lactase enzymatic activity and changes in lactic acid and ethanol contents.
Lactase enzymatic activity (µkat/100 g)
Method 1Method 2Method 3
K_00.37± 0.06 aA0.70 ± 0.07 bA0.49 ± 0.05 abA
K_50.43 ± 0.14 aA0.68 ± 0.15 bA0.47 ± 0.04 abA
Changes in lactic acid content (g/L)
Method 1Method 2Method 3
K_08.10 ± 0,03 aA11.20 ± 0.40 bA11.98 ± 0.33 bA
K_59.08 ± 0.05 aA9.68 ± 0.23 aB11.61 ± 0.73 bA
Proportion of L(+) form in total content (%)
Method 1Method 2Method 3
K_081.60 ± 0.06 aA92.16 ± 0.06 bA52.30 ± 0.30 cA
K_585.43 ± 0.25 aB96.33 ± 0.29 bB58.86 ± 0.06 cB
Changes in ethanol content (g/L)
Method 1Method 2Method 3
K_00.74 ± 0.01 aA0.96 ± 0.01 bA0.37 ± 0.01 cA
K_50.61 ± 0.01 aB0.81 ± 0.02 bB0.32 ± 0.01 cB
K_0, Kefir with no WPC addition (control); K_5, Kefir with 5% WPC addition. Values represent mean ± standard deviation. Different lowercase letters in the rows and different capital letters in the columns for each parameter indicate statistically significant differences at the level α = 0.05.
Table 3. Texture parameters of probiotic kefir with whey protein addition.
DayK_0K_1K_3K_5
Firmness (g)026.50 ± 1.50 aA18.62 ± 4.46 bA18.43 ± 1.82 bA25.00 ± 3.95 aA
1417.17 ± 0.60 aB16.67 ± 0.58 aA18.31 ± 1.46 aA16.40 ± 0.72 aB
Consistency (g·s)0598.30 ± 12.76 aA335.70± 146.91 bA354.90 ± 31.89 bA506.00 ± 68.99 aA
14357.50 ± 11.34 aB351.70 ± 12.61 aA381.80 ± 30.71 aA336.50 ± 6.68 aB
Cohesiveness (g)050.64 ± 3.72 aA30.00 ± 10.68 bA31.24 ± 4.57 bA44.52 ± 9.82 abA
1412.98 ± 1.29 aB20.95 ± 4.80 abA34.74 ± 8.99 bA17.45 ±0.73 aB
Viscosity (g·s)0120.50 ± 38.70 aA52.49 ± 44.89 bA53.73 ± 18.90 bA105.60 ± 20.13 abA
145.69 ± 4.63 aB23.55 ± 11.10 abA76.63 ± 35.06 bA14.11 ± 2.07 aB
Apparent viscosity (mPa·s)03817 ± 51.32 aA5380 ± 222.70 bA7240 ± 79.37 cA7083 ± 125.00 cA
142087 ± 40.41 aB3120 ± 20.00 bB4127 ± 287.30 cB3677 ± 172.40 dB
K_0, Kefir with no WPC addition (control); K_1, Kefir with 1% WPC addition; K_3, Kefir with 3% WPC addition; K_5, Kefir with 5% WPC addition. Values represent mean ± standard deviation. Different lowercase letters in the rows and different capital letters in the columns for each parameter indicate statistically significant differences at the level α = 0.05.
Table 4. Color measurements of probiotic kefir with whey protein addition.
DayK_0K_1K_3K_5
WI081.85 ± 0.33 aA76.38 ± 0.05 bA74.03 ± 0.17 cA72.68 ± 0.52 dA
1478.66 ± 0.04 aB81.36 ± 0.09 bB74.95 ± 0.32 cB78.03 ± 0.11 dB
YI09.01 ± 0.60 aA10.15 ± 0.07 bA9.37 ± 0.68 abA10.04 ± 0.94 abA
149.82 ± 0.03 aA9.79 ± 0.08 aA10.31 ± 0.10 aA10.86 ± 0.18 aA
C05.52 ± 0.34 abA5.79 ± 0.04 aA5.15 ± 0.36 bA5.39 ± 0.45 abA
145.73 ± 0.01 aA5.96 ± 0.06 aA5.73 ± 0.03 aB6.29 ± 0.09 aB
K_0, Kefir with no WPC addition (control); K_1, Kefir with 1% WPC addition; K_3, Kefir with 3% WPC addition; K_5, Kefir with 5% WPC addition. Values represent mean ± standard deviation. Different lowercase letters in the rows and different capital letters in the columns for each parameter indicate statistically significant differences at the level α = 0.05.
Table 5. Water activity of probiotic kefir with whey protein addition.
DayK_0K_1K_3K_5
Water activity00.976 ± 0.005 aA0.981 ± 0.002 abA0.982 ± 0.001 bA0.982 ± 0.003 bA
140.979 ± 0.000 aA0.979 ± 0.000 aA0.980 ± 0.001 aA0.983 ± 0.001 aA
K_0, Kefir with no WPC addition (control); K_1, Kefir with 1% WPC addition; K_3, Kefir with 3% WPC addition; K_5, Kefir with 5% WPC addition. Values represent mean ± standard deviation. Different lowercase letters in the rows and different capital letters in the columns for each parameter indicate statistically significant differences at the level α = 0.05.
Disclaimer/Publisher’s Note: The statements, opinions and data contained in all publications are solely those of the individual author(s) and contributor(s) and not of MDPI and/or the editor(s). MDPI and/or the editor(s) disclaim responsibility for any injury to people or property resulting from any ideas, methods, instructions or products referred to in the content.

