Article

Screening, Characterization and Probiotic Properties of Selenium-Enriched Lactic Acid Bacteria

1
College of Food Science and Engineering, Northwest A&F University, Xianyang 712100, China
2
College of Biological Sciences and Engineering, Shaanxi Province Key Laboratory of Bio-Resources, QinLing-Bashan Mountains Bioresources Comprehensive Development C. I. C., Qinba State Key Laboratory of Biological Resources and Ecological Environment, Tea Planting and Processing Research Institute, Shaanxi University of Technology, Hanzhong 723000, China
3
College of Food Science and Technology, Northwest University, Xi’an 710069, China
*
Author to whom correspondence should be addressed.
Fermentation 2024, 10(1), 39; https://doi.org/10.3390/fermentation10010039
Submission received: 11 October 2023 / Revised: 29 November 2023 / Accepted: 6 December 2023 / Published: 3 January 2024
(This article belongs to the Section Probiotic Strains and Fermentation)

Abstract

:
Considerable progress has been achieved in the bioaccumulation and transformation of selenium (Se)-enriched lactic acid bacteria (LAB). However, research on the effects of Se on the structure and probiotic potential of LAB is relatively limited. In this study, six industrial LAB strains, including Lactobacillus plantarum 21,805, Lactobacillus paracasei 20,241, Lactobacillus fermentum 21,828, Lactobacillus casei 23,185, Lactobacillus acidophilus 6064, and Lactobacillus plantarum 6076, were cultured in De Man, Rogosa, and Sharpe (MRS) medium containing Se for three generations. High-Se LAB was screened based on bacterial biomass, viable bacterial count, and Se content. Their structural characteristics were analyzed using scanning electron microscopy (SEM), Fourier-transform infrared spectroscopy (FTIR), and X-ray diffraction (XRD). The results indicated that LAB growth was influenced by the Se environment, with high Se (20 μg/mL) inhibiting it. At a Se concentration of 10 μg/mL, LAB maintained integrity and exhibited a high Se enrichment ability, with a Se enrichment of 4.88 ± 0.39 mg/g. The intracellular Se existed in an amorphous or non-crystalline form. Furthermore, Se-enriched LAB exhibited enhanced probiotic properties, including tolerance to simulated gastrointestinal fluids, acid resistance, bile salt resistance, and hydrophobicity. Therefore, Se-enriched LAB are expected to develop new functional foods or dietary supplements for human and animal consumption.

1. Introduction

Se is recognized as an essential trace element for human health [1]. It plays a crucial role in numerous physiological functions, including but not limited to combating oxidative stress, regulating growth, reducing pregnancy complications, enhancing fertility, and antiviral activity [2]. The World Health Organization (WHO) has recommended a daily intake of 55 μg of Se for maintaining human health [3]. However, Se-deficient areas are widespread across the globe, and currently around 0.5–1.0 billion people are at risk of Se deficiency [4]. Inadequate Se intake, particularly below 20 µg/d in adults, has been linked to various health issues such as Keshan disease, Kashin–Beck disease, hypothyroidism, cardiovascular diseases, weakened immune systems, male infertility, memory loss, and an increased risk of various cancers [5].
Probiotics are composed of a diverse array of microorganisms, including bacteria such as Lactobacillus and Bifidobacterium, as well as yeast such as Saccharomyces boulardii [6,7]. These bacteria ferment carbohydrates, leading to the production of lactic acid, which is beneficial in maintaining a healthy balance in the gut microbiota by inhibiting the growth of harmful bacteria [8]. In the industrial setting, probiotics can be mass-produced in large bio-reactors to meet the cell requirements for functional food production [9]. The industrial application of probiotics has expanded to various fields, including food and beverage production, pharmaceuticals, and agriculture.
As a prominent group of common probiotics, LAB naturally exist in the human intestine and various food sources, with traditional fermented foods serving as a good source to obtain these bacteria, including yogurt, kimchi, sauerkraut, kefir, and sourdough bread [10]. LAB play a crucial role in maintaining the balance of intestinal microecology, immune regulation, anti-cancer, antibacterial, and antiviral activities [11,12]. They also contribute to improved digestion of lactose and micronutrients, reduction in antibiotic-associated diarrhea, and mitigation of the risk of vaginal infections [13].
In the context of bioconversion, Se-enriched LAB have demonstrated the capability to convert inorganic Se into organic selenides [14]. Research has indicated that Se-enriched LAB not only aid in meeting the Se requirements of populations with Se deficiency but also play a significant role in disease prevention, enhancement of immune function, and protection of gastrointestinal health [15].
In recent years, significant advancements have been achieved in research on the bioaccumulation and biotransformation capabilities of Se-enriched LAB. However, research focusing on the structure and probiotic potential of these Se-enriched LAB remains relatively limited [16]. This study investigated the effect of Se concentration on the growth and enrichment of LAB, and evaluated the probiotic characteristics of Se-enriched LAB. The aim is to provide a scientific basis for the development of Se-enriched LAB products by gaining a deeper understanding of the mechanisms of LAB Se enrichment and adaptation.

2. Materials and Methods

2.1. Strains and Reagents

L. plantarum 21,805, L. paracasei 20,241, L. fermentum 21,828, L. casei 23,185, L. acidophilus 6064, and L. plantarum 6076 were purchased from China Center of Industrial Culture Collection (CICC) (China).
Se2+ single-element standard solution (214021-3) was acquired from the National Nonferrous Metals and Electronic Materials Analysis and Testing Center (NMT) (Beijing, China). All other reagents were of analytical grade and were purchased from Beijing Aoboxing Biotechnology Co., Ltd. (Beijing, China).

2.2. Strain Activation and Expansion Culture

All strains were cultured in MRS medium at 37 °C for three generations, with each generation being of 24 h. During the culture period, the absorbance at 600 nm measured using (U-3900, Hitachi, Tokyo, Japan) was recorded every 2 h for 24 h, and the growth curve at 600 nm was plotted. Each experiment was repeated three times.

2.3. Se-Enriched Bacterial Cultivation

Each strain was individually cultured in MRS medium with Se concentrations of 0, 5, 10, 20, and 40 μg/mL at 37 °C for three generations, with each generation lasting 24 h. All experiments were conducted with cultures of passage 3. The absorbance at 600 nm was measured every 3 h, and the number of viable bacteria was determined using the plate coating method to calculate the colony-forming unit (CFU). At the end of the incubation, the bacterial solution cultured at each Se concentration was centrifuged at 5000 rpm for 15 min (H1850R, Xiangyi, Neijiang, China), washed three times with phosphate-buffered saline (PBS), and the precipitated bacterial biomass was freeze-dried.

2.4. Se Content Determination

The Se content in the freeze-dried biomass of each strain was determined using a hydride generation atomic fluorescence spectrometer (AFS230E, Haiguang, Beijing, China) following a previously described method [17]. Argon was utilized as the carrier gas, 5% HCl as the carrier flow, and a 2% NaBH4 solution as the reducing agent. The instrument conditions were set as follows: a negative high voltage of 300, a reading time of 15 s, a delay time of 3 s, and each sample was analyzed in triplicate.

2.5. Strain Identification by 16S rRNA Sequencing

Genomic DNA was extracted using Tiangen Bacterial Genomic DNA Extraction Kits (Tiangen, Beijing, China). The DNA was then amplified by PCR using the universal primer pair 27F (5′−AGAGTTTGATCCTCGCTCAG−3′) and 1492R (5′−GGTTACCTTGTTACGACTT−3′), targeting the bacterial 16S rRNA gene. The PCR reaction system (50 μL) comprised 2 × Taq PCR Master Mix (With Dye) 25 μL, template DNA 2 μL, upstream and downstream primers (10 μmol/L) 2 μL each, and ddH2O 19 μL. The PCR was initiated at 94 °C for 5 min, followed by 36 cycles at 92 °C for 30 s, 56 °C for 30 s, and 72 °C for 90 s, and concluded with a final extension step at 72 °C for 10 min. Subsequently, 2 μL of the PCR products was subjected to 1.0% agarose gel electrophoresis and visualized using a UV gel imaging system. The resulting PCR amplicons were sent to Sangon Bioengineering (Shanghai, China) Co., LTD for sequencing. Sequence similarity analysis was performed using the BLAST program of NCBI to identify closely related sequences and determine the taxonomic classification of the bacteria. Sequences with a similarity of 97% or higher were considered as potential new bacterial species, while those with less than 97% similarity were regarded as potential new species [18]. Pairwise distances were computed using MEGA 11.0 software to calculate genetic distances, and the neighbor-joining method was employed to construct phylogenetic trees based on the 16S rRNA gene sequences obtained from sequencing. Bootstrap analysis was performed 1000 times to assess the confidence intervals of the evolutionary tree topology.

2.6. Characterization Methods

2.6.1. SEM Analysis

The SEM assay was conducted in accordance with a previously described method [19]. Freeze-dried samples of LAB were gold-coated and examined for surface morphology using a scanning electron microscope (Verios 460, Thermo Fisher, Waltham, MA, USA) with an accelerating voltage of 10 kV.

2.6.2. FT-IR Analysis

The FT-IR assay was carried out following a previously described method [20]. A Fourier transform infrared spectrometer (NICOLET IS50, Thermo Scientific, Waltham, MA, USA) was employed for infrared spectrum analysis within the range of 4000–500 cm−1.

2.6.3. XRD Analysis

The lyophilized bacteria powder was compressed into a glass groove, and an X-ray diffractometer (D8 Advance, Bruker, Germany) was used with a scanning angle range of 2θ (5°–70°) at room temperature, an operating voltage of 40 kV, a current of 40 mA, and a copper target X-ray source (Cu Kα, λ = 0.15406 nm). The scanning speed was set at 12°/min [20].

2.7. Probiotic Properties Assessment

2.7.1. Evaluation of Tolerance to Artificial Gastric and Intestinal Fluids

In accordance with the approach outlined by Shu et al. [21], a 1 mL bacterial suspension of each strain was combined with 9 mL of artificial gastric fluid (comprising 0.2 g sodium chloride and 1 g pepsin dissolved in 100 mL HCl solution at pH 2.0) and incubated statically at 37 °C. The treatment solution was sampled at 0, 30, 60, 90, and 120 min intervals to assess the number of viable bacteria. Additionally, 1 mL of artificial gastric fluid containing bacteria was mixed with 9 mL of artificial intestinal fluid (comprising 0.68 g potassium dihydrogen phosphate and 1.0 g trypsin dissolved in 100 mL of distilled water, with pH adjusted to 7 using NaOH solution). The mixture was incubated at 37 °C for 150, 180, 210, and 240 min, and the viable bacterial count was determined to calculate the survival rate using the following formula:
Survival Rate (%) = (AS/A0) × 100%
where AS represents the survival count of the strain treated in simulated gastric or intestinal fluid, and A0 represents the initial survival count of the strain.

2.7.2. Assessment of Acid Tolerance

The acid tolerance of the strains was determined following the method of Taj et al. [22] with slight modifications. The pH was adjusted by adding 0.1 mol/L HCl. Each strain was inoculated in MRS medium (pH 2, 3, 7) and statically incubated at 37 °C for 5 h. The OD600 value was measured, and the acid tolerance was calculated using the following formula:
Acid Tolerance (%) = 1 − (An − Aa)/An× 100%
where An represents the value of OD600 at pH 7, and Aa represents the value of OD600 at pH 2 or pH 3.

2.7.3. Determination of Bile Salt Tolerance

The tolerance of each strain to bile salts was determined following Kaur’s method [23]. Each strain was inoculated at 1% in MRS medium with different concentrations of bile salts (0%, 0.3%, 0.5%). After incubation at 37 °C for 6 h, the OD600 value was measured. The bile salt tolerance of the strain was calculated using the following formula:
Bile Salt Tolerance (%) = 1 − (An − Ab)/An× 100%
where An represents the OD600 value at 0% bile salts concentration, and Ab represents the OD600 value at 0.3% or 0.5% bile salts concentration.

2.7.4. Evaluation of Surface Hydrophobicity

The surface hydrophobicity of the strains was measured using the microbial adhesion to hydrocarbons (MATH) method with minor modifications as per previous methods [24]. Each strain was cultured in MRS medium for 12 h, centrifuged at 5000 g for 10 min at 4 °C, and after washing three times with PBS, the strains were resuspended and the OD600 value was determined as the initial absorbance (A0). Then, 3 mL of suspension was mixed with 1 mL of xylene as the solvent, vigorously shaken for 15 min, left at room temperature for 1 h, and the lower aqueous phase was collected and measured at OD600 (A). The surface hydrophobicity of LAB was calculated using the microbial adhesion to hydrocarbons formula:
Hydrophobicity (%) = 1 − (A0 − A)/A0 × 100%
where A0 is the absorbance value of the initial bacterial suspension, and A is the absorbance value of the aqueous phase after xylene treatment.

2.8. Statistical Analysis

Each experiment was conducted in triplicate. The statistical data are presented as mean ± standard deviation (SD). One-way analyses of variance (ANOVA) with Tukey test were performed using SPSS 10.0 software (SPSS Inc., Chicago, IL, USA). Graphs were generated using GraphPad Prism software 6.01 (GraphPad Software Inc., La Jolla, CA, USA).

3. Results

3.1. Screening of Se-Enriched LAB

In this study, six LAB strains were purchased, and Se-enriched strains were obtained by culturing these LAB in MRS medium with different concentrations of sodium selenite for three generations. Figure 1 depicts the influence of Se concentrations on the growth of six LAB. Growth curves of LAB were obtained under Se concentrations ranging from 0 to 40 µg/mL, as shown in Figure 1A–F. It was observed that increasing Se concentrations had a retarding and inhibiting effect on LAB growth. At Se concentrations of 0–10μg/mL, the optical density (OD) value was relatively high. After 3 h of incubation, bacterial cultures entered the logarithmic growth phase and stabilized around 12 h. However, at Se concentrations of 20–40 μg/mL, the OD value decreased. During the initial 0–6 h, there was a lag in bacterial growth, but after 6 h, bacterial cultures entered the logarithmic growth phase, with the stabilization period extending to 16 h, and the bacterial growth was inhibited to varying degrees. Therefore, Se cultivation concentrations of 0, 5, and 10 µg/mL were selected during the Se enrichment process, and the fermentation time was extended to 18 h for the screening of Se-enriched strains based on biomass, viable bacterial count, and Se content.
Figure 1G illustrates the variation in biomass of the six strains at Se concentrations of 0, 5, and 10 µg/mL. It was observed that as the Se concentration increased, the biomass of the bacteria decreased. Under Se-free conditions, the strains exhibited the following biomass order: L. plantarum 6076 > L. lactis 23,185 > L. acidophilus 6064 > L. lactis 20,241 > L. fermentum 21,828 > L. plantarum 21,805. At a Se concentration of 10 µg/mL, the strains exhibited the following biomass order: L. plantarum 6076 > L. lactis 23,185 > L. lactis 20,241 > L. plantarum 21,805 > L. acidophilus 6064 > L. fermentum 21,828.
In Figure 1H, a strong positive correlation between bacterial Se content and Se concentration in the culture medium is demonstrated. These strains exhibited the ability to absorb selenite when cultured in MRS medium containing 5 and 10 µg/mL Se. Under the condition of 10 μg/mL Se, L. plantarum 6076 and L. lactis 23,185 exhibited higher Se accumulation, reaching 4.88 ± 0.39 mg/g and 3.68 ± 0.23 mg/g, respectively. Figure 1I revealed that as the Se concentration increased, the viable bacterial count of the strains decreased. L. plantarum 6076 displayed strong Se tolerance, with a viable bacterial count of 3.9 × 10¹⁰ and 2.8 × 10¹⁰ CFU/mL after 18 h of cultivation in 5 and 10 μg/mL Se, respectively. Based on biomass, viable cell count, and Se enrichment, L. plantarum 6076 exhibited a positive correlation and excelled in all three aspects, thus establishing it as the preferred strain for Se enrichment.

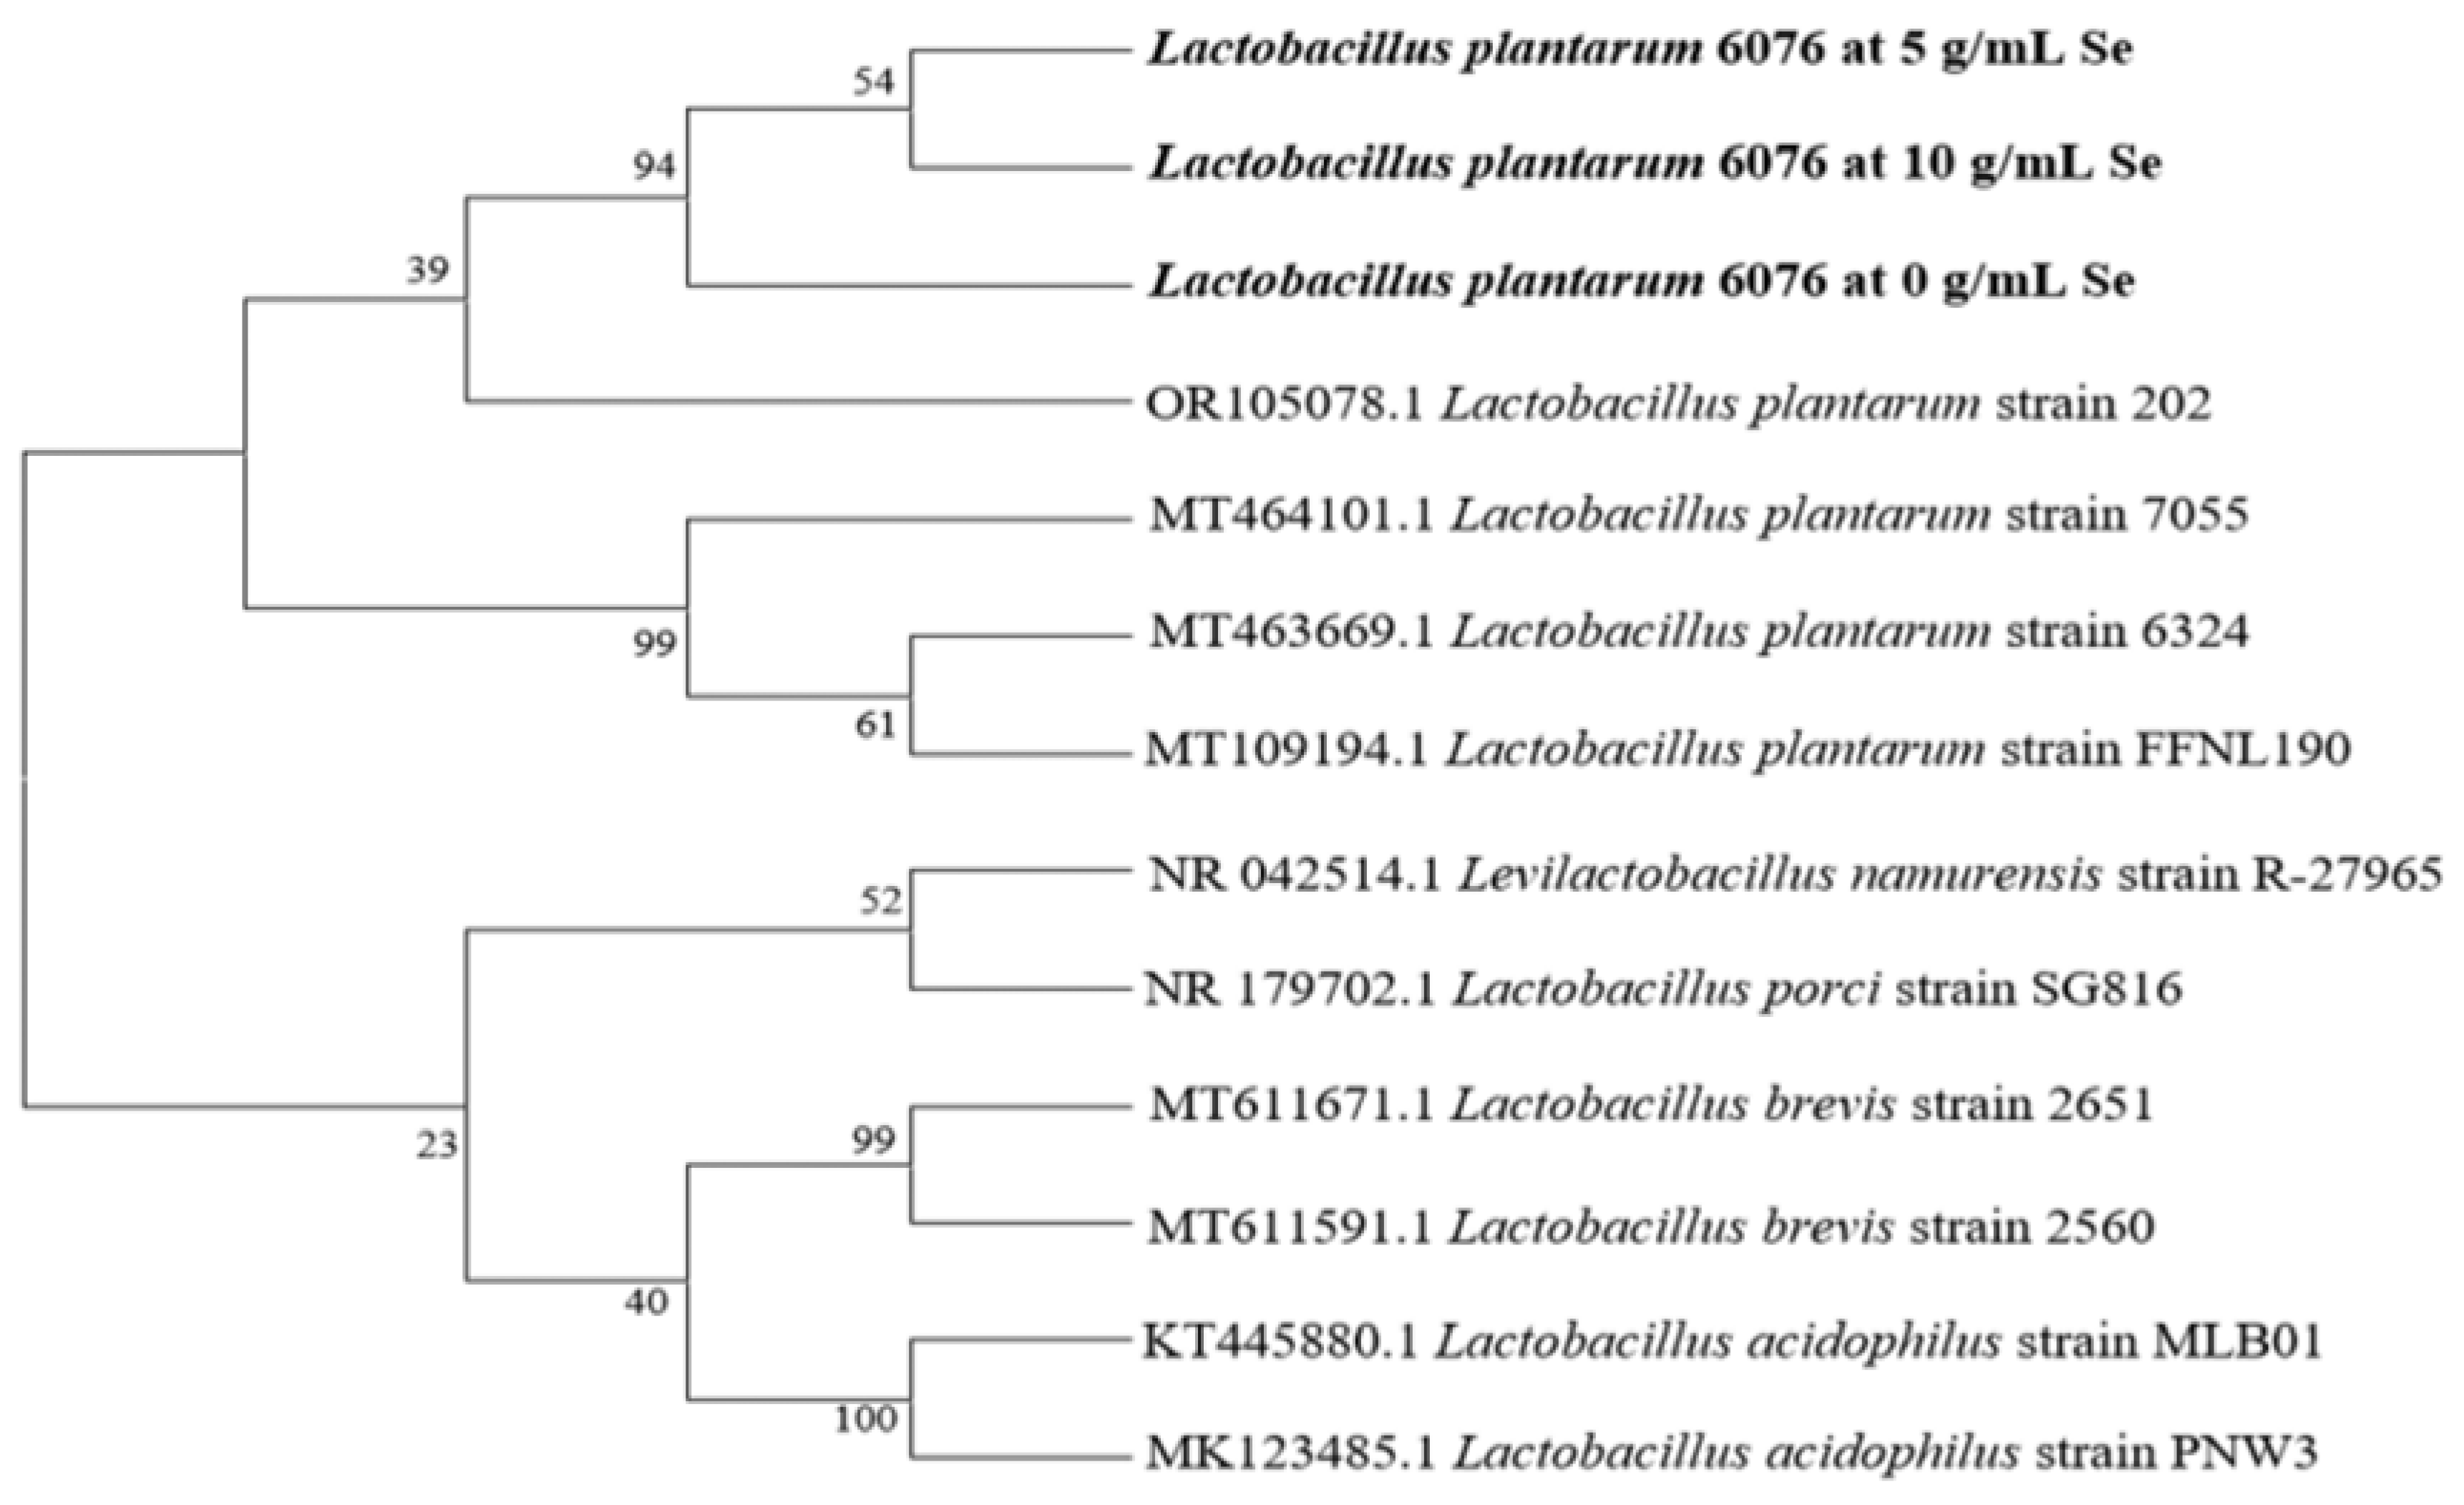
3.2. Phylogenetic Analysis of Se-Enriched L. plantarum

The identification of Se-enriched L. plantarum 6076 was conducted through analysis of 16S rRNA sequences. Phylogenetic clustering analysis, as depicted in Figure 2, revealed a 97% sequence homology between L. plantarum 6076 and L. plantarum 202 (OR105078.1). The gene homology of L. plantarum 6076 at 5 µg/mL Se and L. plantarum FNL190 (MT109194.1) was determined to be 99%. Moreover, L. plantarum at 10 µg/mL Se exhibited a 99.93% homology with L. plantarum 7055 (MT464101.1). Consequently, it was established that L. plantarum 6076 at 5, 10 µg/mL Se belonged to the L. plantarum species.

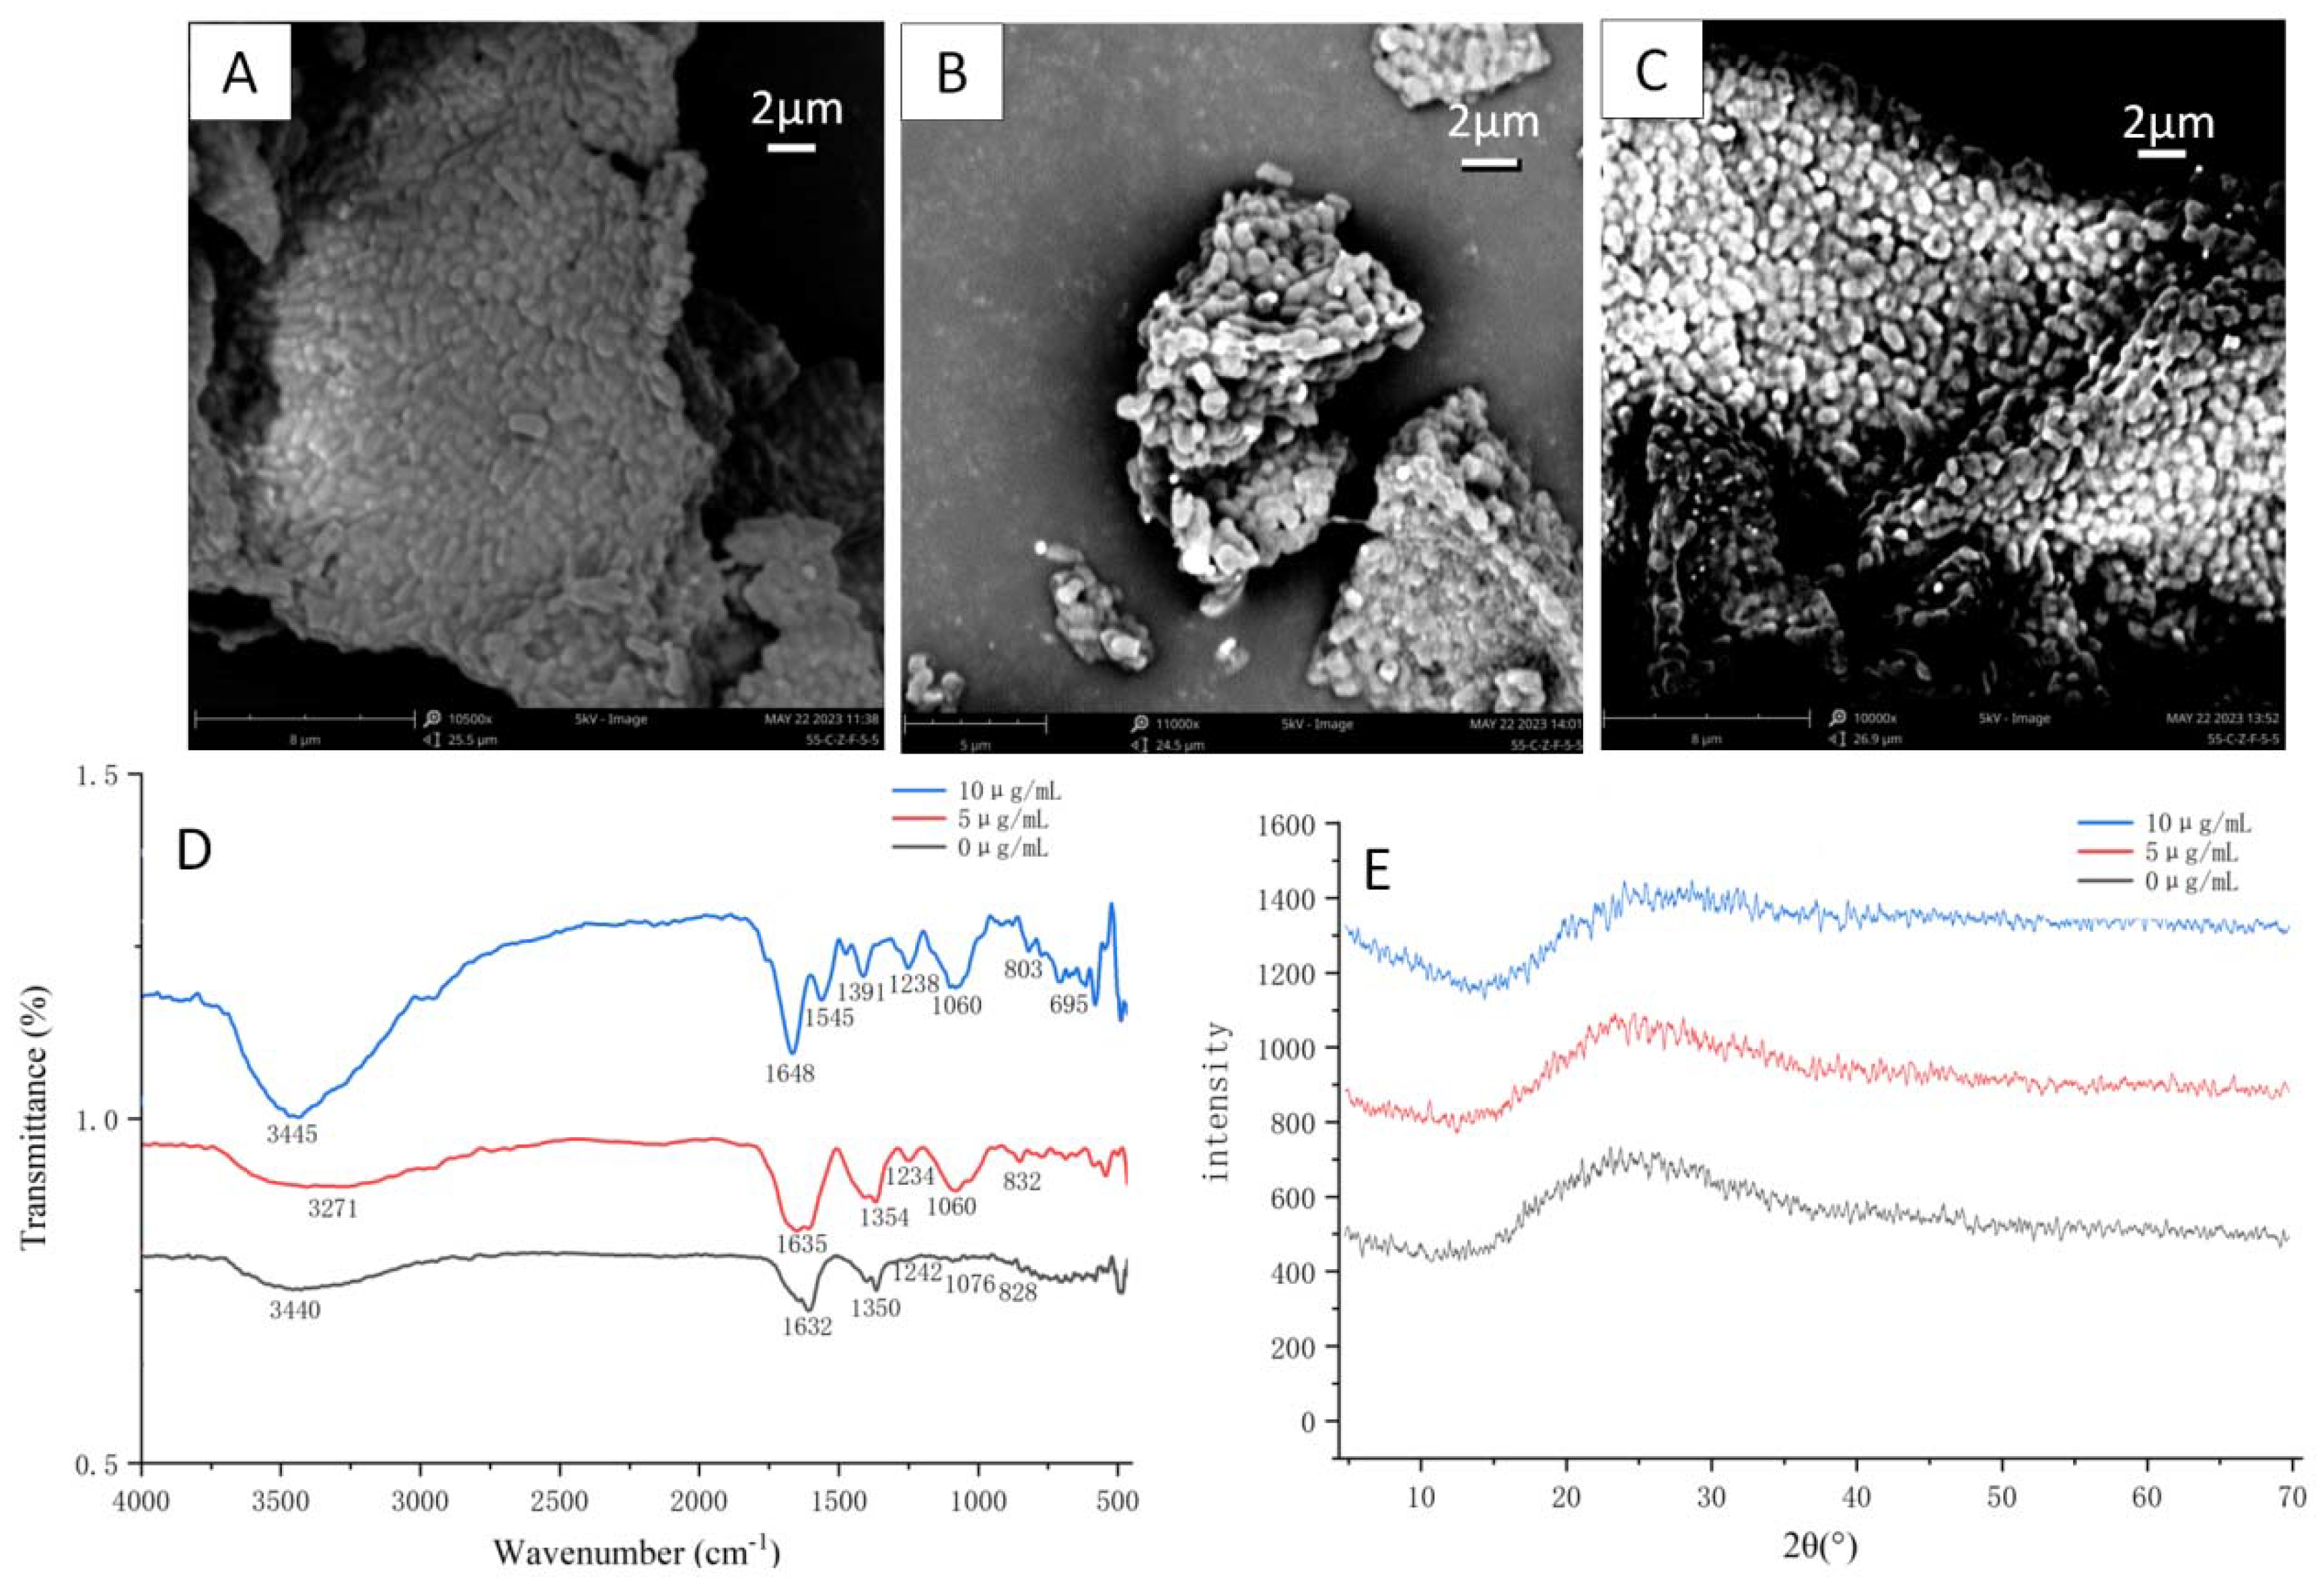
3.3. Structural Characterization of Se-Enriched L. plantarum

To investigate the impact of Se on L. plantarum 6076, SEM was employed to observe the morphology changes in L. plantarum 6076 cultured at different Se concentrations (Figure 3). Under 0 µg/mL Se, L. plantarum 6076 exhibited an intact cell morphology, appearing as short rods with a length of approximately 1–2 μm (Figure 3A). At the lower Se concentration (5 µg/mL), L. plantarum 6076 did not show significant changes in cell morphology, but SEM analysis revealed the presence of deposits around the strain wall, indicating potential alterations in the cell surface structure (Figure 3B). Interestingly, at the higher Se concentration (10 µg/mL), L. plantarum 6076 did not undergo significant changes in overall cell morphology. However, detailed SEM imaging of the strain surface revealed the presence of concavities and an increase in surface deposits, suggesting potential modifications in the cell surface topography and composition (Figure 3C).
To investigate the influence of Se on the functional groups of L. plantarum 6076, FT-IR was employed to assess the changes in the functional groups of L. plantarum 6076 at 0, 5, 10 µg/mL Se (Figure 3D). The overall waveform of the three samples exhibited similarities, with noticeable shifts in some peak positions. Absorption peaks were detected at 3271–3445 cm−1, 1350–1391 cm−1, 1234–1242 cm−1, 1060–1076 cm−1, 803–828 cm−1, which became more pronounced and intensified with increasing Se cultivation concentration. In contrast to L. plantarum 6076 at 0 and 5 µg/mL Se, L. plantarum 6076 at 10 µg/mL Se concentration displayed distinct absorption peaks at 1545 cm−1 and 695 cm−1. XRD analysis revealed consistent spectrum lines for L. plantarum 6076 at 0, 5, 10 µg/mL Se across the entire scanning angle range, with broad diffraction peaks observed at 2θ angles ranging from 15° to 35° (Figure 3E).

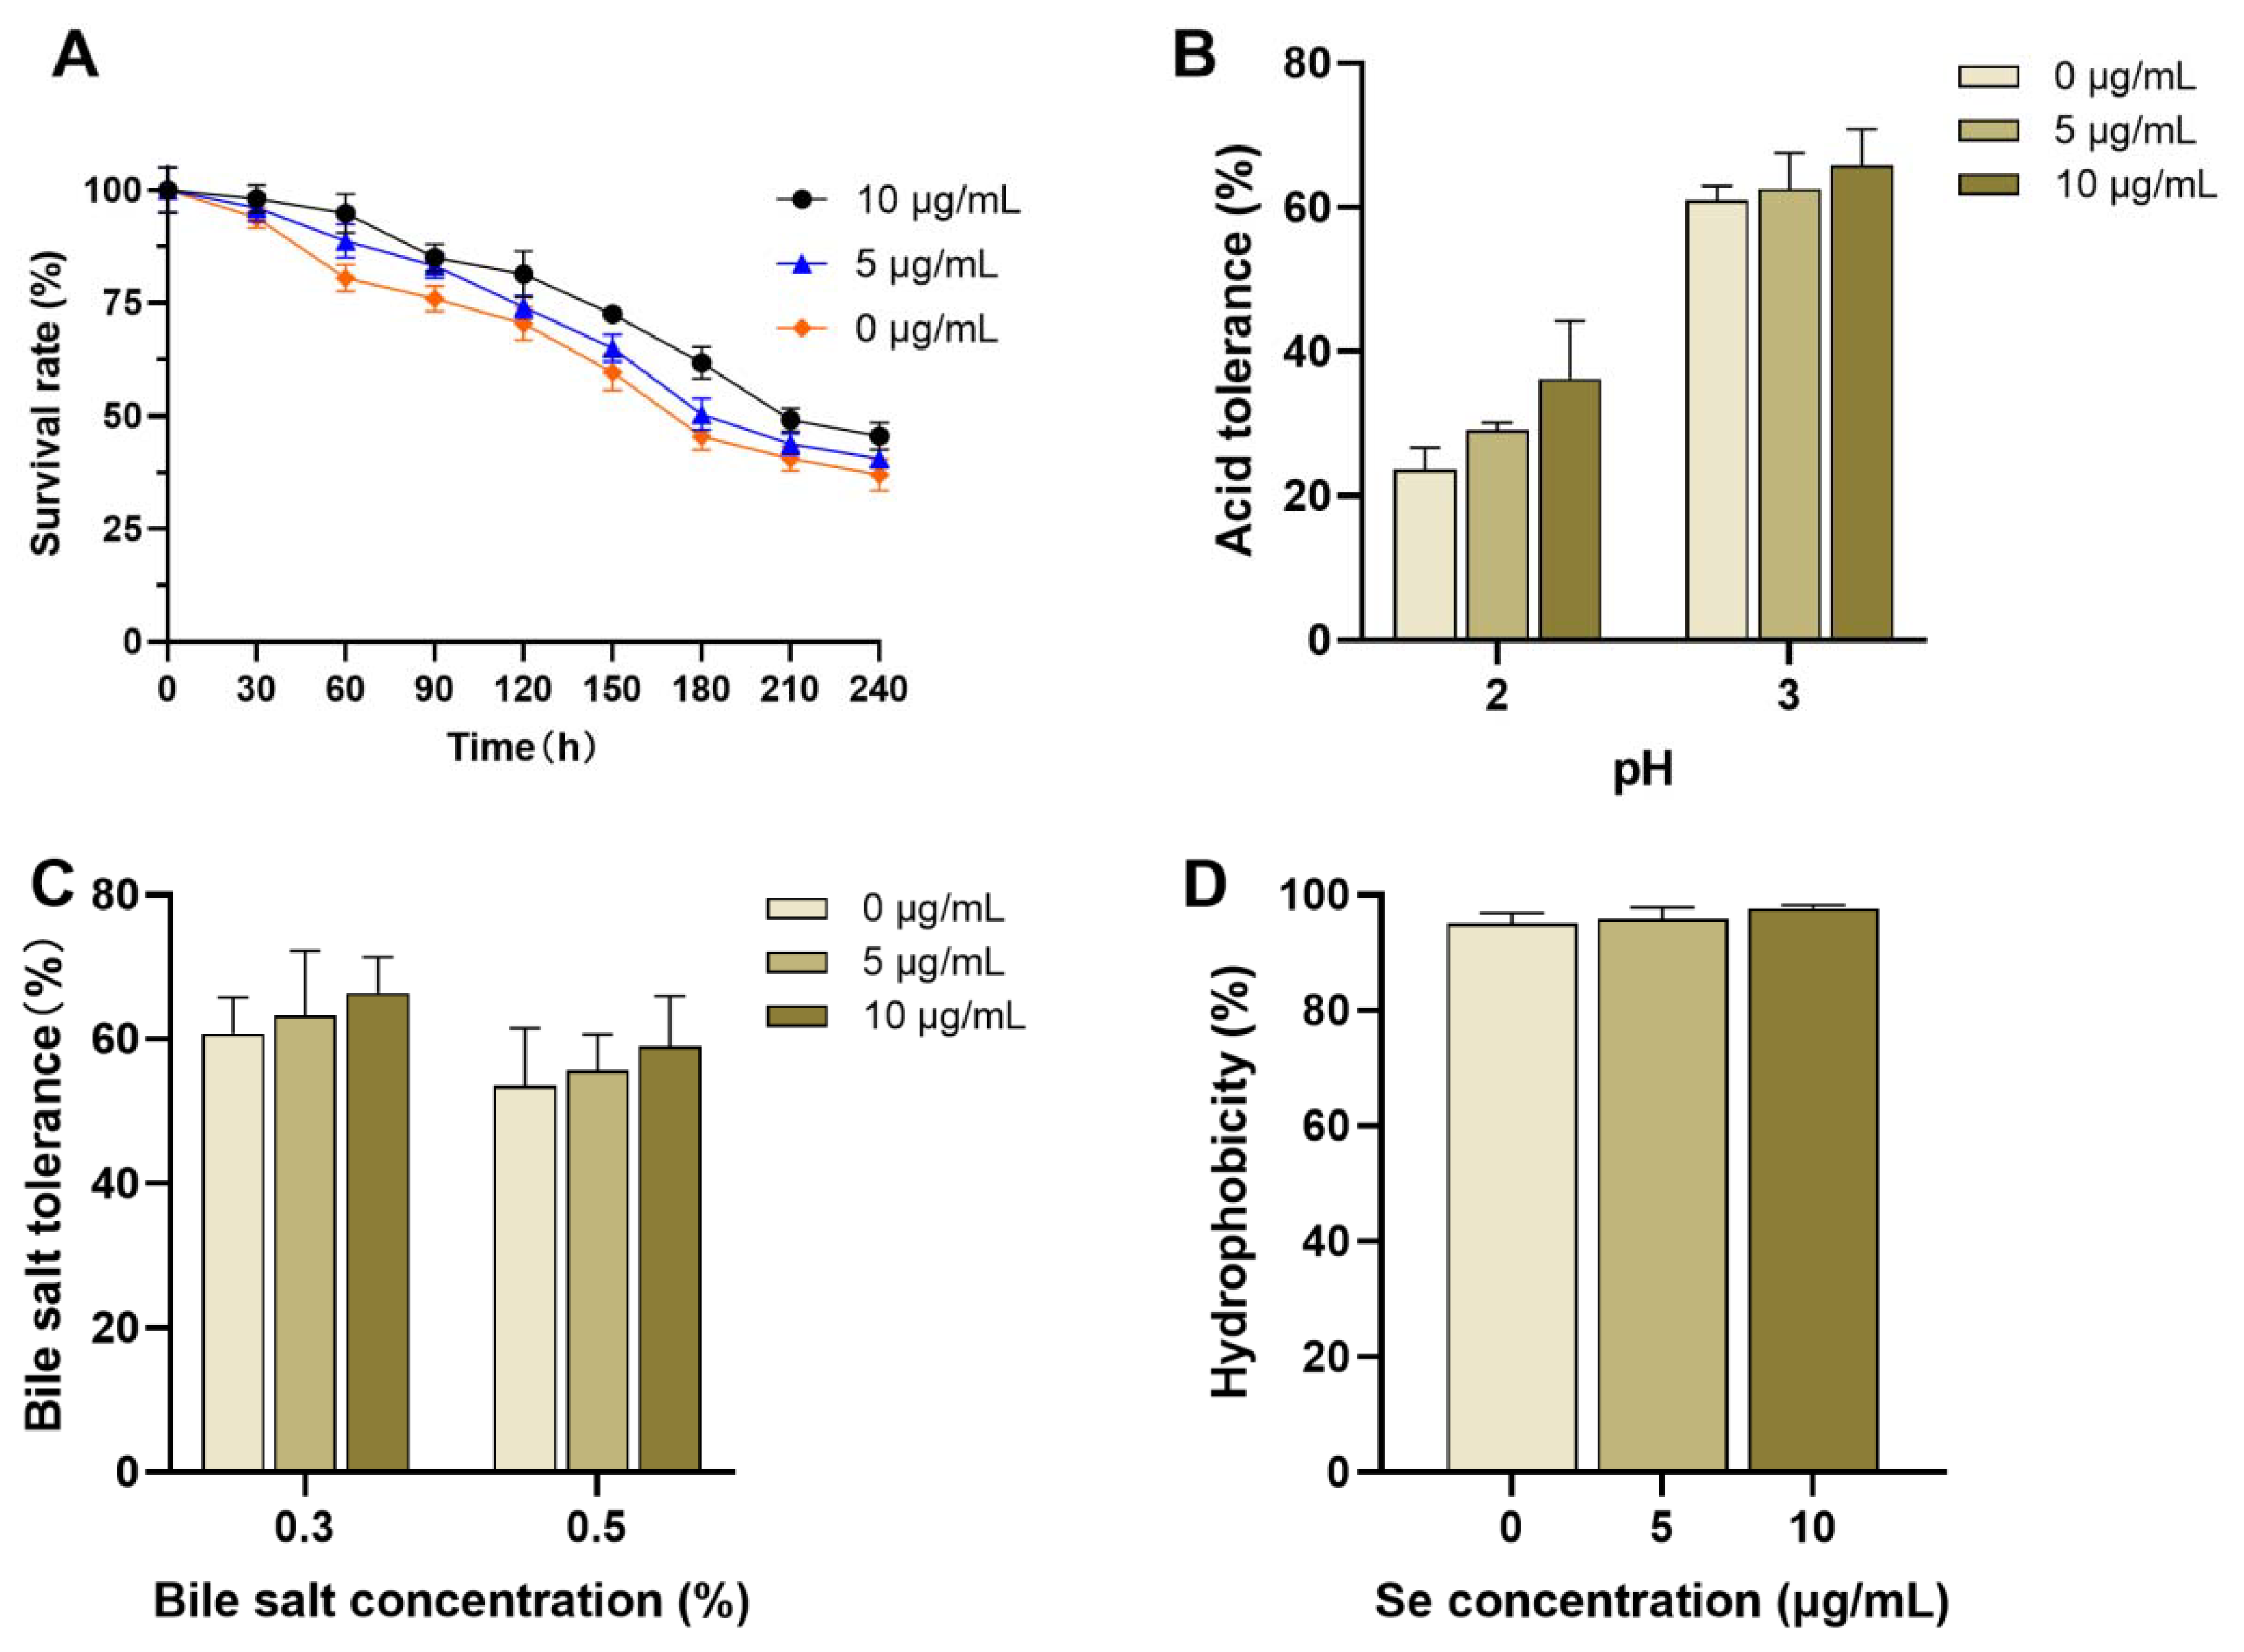
3.4. Probiotic Characteristics of Se-Enriched L. plantarum

The probiotic characteristics of Se-enriched L. plantarum 6076 were assessed as depicted in Figure 4. L. plantarum 6076 at 0, 5, 10 µg/mL Se was inoculated into a simulated gastrointestinal environment, and viable counts were measured to calculate survival rates and tolerance to simulated gastrointestinal conditions. After L. plantarum 6076 entered the gastrointestinal environment, the number of viable bacteria gradually declined over time with a relatively stable downward trend (Figure 4A). In the gastric juice, the survival rates for L. plantarum 6076 at 0, 5, 10 µg/mL Se were 81.32% ± 5.11, 74.04% ± 2.53 and 70.39% ± 3.7, respectively. In the intestinal fluid, the survival rates were 45.53% ± 3.17, 40.58% ± 1.82 and 37.04% ± 3.25, respectively.
The acid tolerance of Se-enriched L. plantarum was evaluated by subjecting the strains to incubation under strong acidic conditions at pH 2 and pH 3 for 5 h (Figure 4B). As acidity increased, the survival rates of strains notably decreased. At a pH of 3, all strains displayed elevated survival rates, with L. plantarum 6076 exhibiting the highest rate at 10 µg/mL Se concentration, reaching 65.82% ± 4.18, followed by L. plantarum 6076 at 5 µg/mL Se with 62.55% ± 4.36. However, at a pH of 2, the survival rates significantly decreased for all strains. L. plantarum 6076 at Se concentrations of 0, 5, and 10 µg/mL had survival rates of 23.73% ± 3.25, 29.15% ± 1.41, and 36.23% ± 6.15, respectively. Remarkably, the Se-enriched L. plantarum 6076 demonstrated greater tolerance compared to L. plantarum 6076 under these acidic conditions. Moreover, an increase in Se concentration correlated with an improved acid tolerance of Se-enriched L. plantarum.
Bile tolerance is one of the fundamental criteria for evaluating probiotics. Se-enriched L. plantarum exhibited varying degrees of tolerance at bile salt concentrations of 0.3% and 0.5% (Figure 4C). At a 0.3% bile concentration, L. plantarum 6076 at 10 µg/mL Se displayed the highest bile tolerance, with a survival rate of 66.37% ± 3.83, followed by L. plantarum 6076 at 5 µg/mL Se with a survival rate of 63.24% ± 7.66. At 0.5% bile concentration, the survival rate of L. plantarum 6076 at 10 µg/mL Se was 58.96% ± 5.45, while L. plantarum 6076 at 5 and 0 µg/mL Se had survival rates of 55.64% ± 4.38 and 53.55% ± 6.27, respectively. The ability of bacteria to adhere to different hydrocarbons serves as an important indicator of their hydrophobicity. As illustrated in Figure 4D, L. plantarum 6076 at 0, 5, 10 µg/mL Se exhibited strong hydrophobicity, with average adhesion values of 97.66% ± 0.53, 95.89% ± 1.99, and 95.04% ± 2.83, respectively.

4. Discussion

This study investigated the effect of Se concentration on the growth and enrichment of LAB, and evaluated the changes in the probiotic characteristics of Se-enriched LAB. The research revealed that high Se concentrations (20–40 μg/mL) have an inhibitory effect on LAB growth, while at a concentration of 10 μg/mL, LAB maintained their integrity and demonstrated Se enrichment capability. Furthermore, LAB exhibit enhanced probiotic properties, suggesting that Se-enriched LAB may offer superior health benefits compared to traditional LAB strains and could be utilized in the development of new probiotic products with enhanced functionality.
The tolerance of LAB to different Se concentrations varies depending on the strain used [25]. Thus, the study observed the influence of different Se concentrations (0, 5, 10, 20, 40 μg/mL) on the growth of six LAB strains. The findings indicated that the LAB were able to grow normally at Se concentrations of 5 and 10 μg/mL, while their growth was inhibited at higher Se concentrations of 20–40 μg/mL. Similar patterns of Se tolerance have also been observed in studies of L. reuteri, L. animalis, and L. casei, with L. casei demonstrating higher Se tolerance compared to other LAB [24,26,27].
Environmental changes can induce genetic mutations in organisms, providing a pathway for biological evolution and the emergence of new species [28]. In Se-rich environments, microorganisms may undergo adaptive genetic variations to cope with environmental changes [29]. Consequently, an assessment of the similarity in 16S rRNA sequences between Se-enriched L. plantarum 6076 and L. plantarum 6076 was conducted. The findings indicated that the genes of Se-enriched L. plantarum did not exhibit significant changes, suggesting that the adaptation of L. plantarum 6076 to Se-rich conditions did not lead to significant genetic variation at the gene level. This observation implies that the Se enrichment capacity of L. plantarum 6076 in Se-rich environments is achieved through its existing metabolic pathways and genomic characteristics, rather than through new genetic mutations or genetic recombination.
In high-Se environments, microorganisms may experience toxicity, leading to the conversion of inorganic Se into Se nanoparticles by bacteria, which possess the ability to bind Se with extracellular polysaccharides [30]. In this study, we observed slight depressions on the surface morphology of plant lactobacilli as the Se concentration increased, and sedimentation around the cell wall, possibly due to the aggregation of Se nanoparticles or binding with polysaccharides produced by lactic acid. The process of Se transformation may cause changes in microbial morphology and biosynthesis [31], allowing for Se to enter the microbial body and be bound with Se proteins [32], Se nucleic acids [33], and Se polysaccharides [34]. Our FTIR spectra revealed changes in the chemical bonds by shifts in the position or intensity of characteristic peaks. These changes may be due to biosynthesis or metabolic alterations induced by high-Se-concentration environments [35]. This indicates that plant lactobacilli have the capability to uptake Se and bind it with intracellular proteins, polysaccharides, and nucleic acids, thereby affecting the corresponding chemical bonds. Therefore, a Se environment may cause modifications in the cellular structure and chemical composition of microorganisms, which is important for comprehending the adaptability of plant lactobacilli in Se-rich environments and their applications.
Probiotics enriched with nano Se have been demonstrated to enhance immune responses, such as alleviating inflammation, boosting antioxidant function, exerting therapeutic effects on tumors, exhibiting anticancer activity, and regulating the gut microbiota [36]. The findings of this investigation suggest that Se enrichment enhances the probiotic properties of L. plantarum. Similarly, in comparison to L. brevis, Se-rich L. brevis displays heightened capacities for scavenging free radicals and reducing agents [37].

5. Conclusions

In this study, we screened and characterized dominant Se-enriched LAB and evaluated their probiotic properties. High Se concentrations (20–40 μg/mL) had an inhibitory effect on the growth of the LAB strain. However, LAB exhibited a high Se enrichment ability at a Se concentration of 10 μg/mL, with Se accumulating in an amorphous or non-crystalline form. Furthermore, Se enrichment enhanced the probiotic properties of LAB. Therefore, Se-enriched LAB have the potential to be developed as a functional food or dietary supplement for human and animal consumption.

Author Contributions

Methodology, software, validation, L.Z., Z.C., X.Z. and B.Z.; formal analysis, investigation, resources, data curation, A.L. and W.Z.; writing—original draft preparation, L.Z.; writing—review and editing, funding acquisition, T.Y.; visualization, supervision, project administration, Y.Y. All authors have read and agreed to the published version of the manuscript.

Funding

This research was funded by [Science and Technology Department of Shaanxi Province] grant number [2022NY-041], [“Co-construction of City and School” scientific research project of State Key Laboratory of Qinba Biological Resources and Ecological Environment (Cultivation)] grant number [SXC-2112], and [Collaborative Innovation Center project of Shaanxi Education Department] grant number [21JY007].

Institutional Review Board Statement

Not applicable.

Informed Consent Statement

Not applicable.

Data Availability Statement

The data are available from the authors on reasonable request.

Acknowledgments

We would like to express our gratitude to the team members of the Health Food Manufacturing and Safety Laboratory for their assistance, and Science and Technology Department of Shaanxi Province [2023-JC-YB-404].

Conflicts of Interest

The authors confirm that they have no conflict of interest with respect to the work described in this manuscript.

References

  1. Pecoraro, B.M.; Leal, D.F.; Frias-De-Diego, A.; Browning, M.; Odle, J.; Crisci, E. The health benefits of selenium in food animals: A review. J. Anim. Sci. Biotechnol. 2022, 13, 58. [Google Scholar] [CrossRef] [PubMed]
  2. Rayman, M.P. The importance of selenium to human health. Lancet 2000, 356, 233–241. [Google Scholar] [CrossRef] [PubMed]
  3. Wang, B.; Zhao, N.; Li, J.; Xu, R.; Wang, T.; Guo, L.; Ma, M.; Fan, M.; Wei, X. Selenium-enriched Lactobacillus plantarum improves the antioxidant activity and flavor properties of fermented Pleurotus eryngii. Food Chem. 2021, 345, 128770. [Google Scholar] [CrossRef] [PubMed]
  4. Chao, W.; Rao, S.; Chen, Q.; Zhang, W.; Liao, Y.; Ye, J.; Cheng, S.; Yang, X.; Xu, F. Advances in Research on the Involvement of Selenium in Regulating Plant Ecosystems. Plants 2022, 11, 2712. [Google Scholar] [CrossRef] [PubMed]
  5. Zhang, H.; Qiu, H.; Wang, S.; Zhang, Y. Association of habitually low intake of dietary selenium with new-onset stroke: A retrospective cohort study (2004–2015 China Health and Nutrition Survey). Front. Public Health 2022, 10, 1115908. [Google Scholar] [CrossRef]
  6. Zhang, Z.; Lv, J.; Pan, L.; Zhang, Y. Roles and applications of probiotic Lactobacillus strains. Appl. Microbiol. Biotechnol. 2018, 102, 8135–8143. [Google Scholar] [CrossRef]
  7. Abid, R.; Waseem, H.; Ali, J.; Ghazanfar, S.; Muhammad Ali, G.; Elasbali, A.M.; Alharethi, S.H. Probiotic Yeast Saccharomyces: Back to Nature to Improve Human Health. J. Fungi 2022, 8, 444. [Google Scholar] [CrossRef]
  8. Staniszewski, A.; Kordowska-Wiater, M. Probiotic and Potentially Probiotic Yeasts-Characteristics and Food Application. Foods 2021, 10, 1306. [Google Scholar] [CrossRef]
  9. Fenster, K.; Freeburg, B.; Hollard, C.; Wong, C.; Rønhave Laursen, R.; Ouwehand, A.C. The Production and Delivery of Probiotics: A Review of a Practical Approach. Microorganisms 2019, 7, 83. [Google Scholar] [CrossRef]
  10. De Filippis, F.; Pasolli, E.; Ercolini, D. The food-gut axis: Lactic acid bacteria and their link to food, the gut microbiome and human health. FEMS Microbiol. Rev. 2020, 44, 454–489. [Google Scholar] [CrossRef]
  11. Ma, C.; Guo, H.; Chang, H.; Huang, S.; Jiang, S.; Huo, D.; Zhang, J.; Zhu, X. The effects of exopolysaccharides and exopolysaccharide-producing Lactobacillus on the intestinal microbiome of zebrafish (Danio rerio). BMC Microbiol. 2020, 20, 300. [Google Scholar] [CrossRef]
  12. Morita, Y.; Jounai, K.; Miyake, M.; Inaba, M.; Kanauchi, O. Effect of Heat-Killed Lactobacillus paracasei KW3110 Ingestion on Ocular Disorders Caused by Visual Display Terminal (VDT) Loads: A Randomized, Double-Blind, Placebo-Controlled Parallel-Group Study. Nutrients 2018, 10, 1058. [Google Scholar] [CrossRef]
  13. Wan, B.; Wei, L.J.; Tan, T.M.; Qin, L.; Wang, H. Inhibitory effect and mechanism of Lactobacillus crispatus on cervical precancerous cells Ect1/E6E7 and screening of early warning factors. Infect. Agents Cancer 2023, 18, 5. [Google Scholar] [CrossRef] [PubMed]
  14. Pophaly, S.D.; Poonam; Singh, P.; Kumar, H.; Tomar, S.K.; Singh, R. Selenium enrichment of lactic acid bacteria and bifidobacteria: A functional food perspective. Trends Food Sci. Technol. 2014, 39, 135–145. [Google Scholar] [CrossRef]
  15. Yang, J.; Wang, J.; Yang, K.; Liu, M.; Qi, Y.; Zhang, T.; Fan, M.; Wei, X. Antibacterial activity of selenium-enriched lactic acid bacteria against common food-borne pathogens in vitro. J. Dairy Sci. 2018, 101, 1930–1942. [Google Scholar] [CrossRef] [PubMed]
  16. Mörschbächer, A.P.; Dullius, A.; Dullius, C.H.; Bandt, C.R.; Kuhn, D.; Brietzke, D.T.; José Malmann Kuffel, F.; Etgeton, H.P.; Altmayer, T.; Gonçalves, T.E.; et al. Assessment of selenium bioaccumulation in lactic acid bacteria. J. Dairy Sci. 2018, 101, 10626–10635. [Google Scholar] [CrossRef] [PubMed]
  17. Wang, M.; Ali, F.; Wang, M.; Dinh, Q.T.; Zhou, F.; Bañuelos, G.S.; Liang, D. Understanding boosting selenium accumulation in Wheat (Triticum aestivum L.) following foliar selenium application at different stages, forms, and doses. Environ. Sci. Pollut. Res. 2020, 27, 717–728. [Google Scholar] [CrossRef] [PubMed]
  18. Drancourt, M.; Berger, P.; Raoult, D. Systematic 16S rRNA gene sequencing of atypical clinical isolates identified 27 new bacterial species associated with humans. J. Clin. Microbiol. 2004, 42, 2197–2202. [Google Scholar] [CrossRef] [PubMed]
  19. El-Sayed, E.S.R.; Abdelhakim, H.K.; Ahmed, A.S. Solid-state fermentation for enhanced production of selenium nanoparticles by gamma-irradiated Monascus purpureus and their biological evaluation and photocatalytic activities. Bioprocess. Biosyst. Eng. 2020, 43, 797–809. [Google Scholar] [CrossRef]
  20. Zan, L.; Wang, C. Mediated by tea polypeptides: A green synthesis approach for selenium nanoparticles exhibiting potent antioxidant and antibacterial properties. Int. J. Food Prop. 2023, 26, 1797–1814. [Google Scholar] [CrossRef]
  21. Shu, G.; Mei, S.; Chen, L.; Zhang, B.; Guo, M.; Cui, X.; Chen, H. Screening, identification, and application of selenium-enriched Lactobacillus in goat milk powder and tablet. J. Food Process. Preserv. 2020, 44, e14470. [Google Scholar] [CrossRef]
  22. Taj, R.; Masud, T.; Sohail, A.; Sammi, S.; Naz, R.; Sharma Khanal, B.K.; Nawaz, M.A. In vitro screening of EPS-producing Streptococcus thermophilus strains for their probiotic potential from Dahi. Food Sci. Nutr. 2022, 10, 2347–2359. [Google Scholar] [CrossRef]
  23. Kaur, A.; Chopra, K.; Kaur, I.P.; Rishi, P. Salmonella strain specificity determines post-typhoid central nervous system complications: Intervention by Lactiplantibacillus plantarum at gut-brain axis. Front. Microbiol. 2020, 11, 1568. [Google Scholar] [CrossRef]
  24. Krausova, G.; Kana, A.; Hyrslova, I.; Mrvikova, I.; Kavkova, M. Development of selenized lactic acid bacteria and their selenium bioaccummulation capacity. Fermentation 2020, 6, 91. [Google Scholar] [CrossRef]
  25. Hyrslova, I.; Kana, A.; Kantorova, V.; Krausova, G.; Mrvikova, I.; Doskocil, I. Selenium accumulation and biotransformation in Streptococcus, Lactococcus, and Enterococcus strains. J. Funct. Foods 2022, 92, 105056. [Google Scholar] [CrossRef]
  26. Sun, Y.; Wang, H.; Zhou, L.; Chang, M.; Yue, T.; Yuan, Y.; Shi, Y. Distribution characteristics of organic selenium in Se-enriched Lactobacillus (Lactobacillus paracasei). LWT 2022, 165, 113699. [Google Scholar] [CrossRef]
  27. Martínez, F.G.; Moreno-Martin, G.; Pescuma, M.; Madrid-Albarrán, Y.; Mozzi, F. Biotransformation of Selenium by Lactic Acid Bacteria: Formation of Seleno-Nanoparticles and Seleno-Amino Acids. Front. Bioeng. Biotechnol. 2020, 8, 506. [Google Scholar] [CrossRef]
  28. Carja, O.; Liberman, U.; Feldman, M.W. Evolution in changing environments: Modifiers of mutation, recombination, and migration. Proc. Natl. Acad. Sci. USA 2014, 111, 17935–17940. [Google Scholar] [CrossRef]
  29. Bera, S.; De Rosa, V.; Rachidi, W.; Diamond, A.M. Does a role for selenium in DNA damage repair explain apparent controversies in its use in chemoprevention? Mutagenesis 2013, 28, 127–134. [Google Scholar] [CrossRef]
  30. Pan, D.; Liu, J.; Zeng, X.; Liu, L.; Li, H.; Guo, Y. Immunomodulatory activity of selenium exopolysaccharide produced by Lactococcus lactis subsp. Lactis. Food Agric. Immunol. 2015, 26, 248–259. [Google Scholar] [CrossRef]
  31. Filipovic, M.R.; Zivanovic, J.; Alvarez, B.; Banerjee, R. Chemical Biology of H2S Signaling through Persulfidation. Chem. Rev. 2018, 118, 1253–1337. [Google Scholar] [CrossRef]
  32. Xu, D.; Yang, L.; Wang, Y.; Wang, G.; Rensing, C.; Zheng, S. Proteins enriched in charged amino acids control the formation and stabilization of selenium nanoparticles in Comamonas testosteroni S44. Sci. Rep. 2018, 8, 4766. [Google Scholar] [CrossRef]
  33. Farrell, K.M.; Brister, M.M.; Pittelkow, M.; Sølling, T.I.; Crespo-Hernández, C.E. Heavy-Atom-Substituted Nucleobases in Photodynamic Applications: Substitution of Sulfur with Selenium in 6-Thioguanine Induces a Remarkable Increase in the Rate of Triplet Decay in 6-Selenoguanine. J. Am. Chem. Soc. 2018, 140, 11214–11218. [Google Scholar] [CrossRef]
  34. Yao, M.; Deng, Y.; Zhao, Z.; Yang, D.; Wan, G.; Xu, X. Selenium Nanoparticles Based on Morinda officinalis Polysaccharides: Characterization, Anti-Cancer Activities, and Immune-Enhancing Activities Evaluation In Vitro. Molecules 2023, 28, 2426. [Google Scholar] [CrossRef] [PubMed]
  35. Nie, X.; Yang, X.; He, J.; Liu, P.; Shi, H.; Wang, T.; Zhang, D. Bioconversion of inorganic selenium to less toxic selenium forms by microbes: A review. Front. Bioeng. Biotechnol. 2023, 11, 1167123. [Google Scholar] [CrossRef] [PubMed]
  36. Liu, R.; Sun, W.; Sun, T.; Zhang, W.; Nan, Y.; Zhang, Z.; Xiang, K.; Yang, H.; Wang, F.; Ge, J. Nano selenium-enriched probiotic Lactobacillus enhances alum adjuvanticity and promotes antigen-specific systemic and mucosal immunity. Front. Immunol. 2023, 14, 1116223. [Google Scholar] [CrossRef] [PubMed]
  37. Shakibaie, M.; Mohammadi-Khorsand, T.; Adeli-Sardou, M.; Jafari, M.; Amirpour-Rostami, S.; Ameri, A.; Forootanfar, H. Probiotic and antioxidant properties of selenium-enriched Lactobacillus brevis LSe isolated from an Iranian traditional dairy product. J. Trace Elem. Med. Biol. 2017, 40, 1–9. [Google Scholar] [CrossRef]
Figure 1. Effect of Se concentrations on the growth of lactic acid bacteria. (AF) Growth curves of strains at 0, 5, 10, 20, 40 µg/mL Se; (G) biomass at 0, 5, 10 µg/mL Se; (H) Se content at 0, 5, 10 µg/mL Se; (I) viable bacterial count at 0, 5, 10 µg/mL Se.
Fermentation 10 00039 g001
Figure 2. Phylogenetic tree of L. plantarum 6076 at 0, 5, 10 µg/mL Se. The bold represents the tested strains.
Fermentation 10 00039 g002
Figure 3. Structural characterization of L. plantarum 6076 at 0, 5, 10 µg/mL Se. (A) SEM images of L. plantarum 6076 at 0 µg/mL Se. (B) SEM image of L. plantarum 6076 at 5 µg/mL Se. (C) SEM image of L. plantarum 6076 at 10 µg/mL Se. (D) FT−IR spectra of L. plantarum 6076 at 0, 5, 10 µg/mL Se. (E) XRD spectra of L. plantarum 6076 at 0, 5, 10 µg/mL Se.
Fermentation 10 00039 g003
Figure 4. Probiotic attributes of L. plantarum 6076 at 0, 5, 10 µg/mL Se. (A) Viability in simulated gastrointestinal fluid (tolerance to simulated gastric fluid for 0–120 min; tolerance to simulated intestinal fluid for 120–240 min). (B) Acid resistance. (C) Bile salt tolerance. (D) Hydrophobicity.
Fermentation 10 00039 g004
Disclaimer/Publisher’s Note: The statements, opinions and data contained in all publications are solely those of the individual author(s) and contributor(s) and not of MDPI and/or the editor(s). MDPI and/or the editor(s) disclaim responsibility for any injury to people or property resulting from any ideas, methods, instructions or products referred to in the content.

