1. Introduction
Biological denitrification is carried out by heterotrophic bacteria able to biologically oxidize soluble carbonaceous organics using nitrate instead of oxygen as the terminal electron acceptor. In more detail, it is a sequential anoxic process reducing nitrate (NO
3−) to intermediate nitrite (NO
2−), nitric oxide (NO), nitrous oxide (N
2O), and finally, to N
2 [
1]. Dissolved oxygen (DO) concentration, pH, carbon-to-nitrogen ratio (C/N), and the type of carbon source have an important impact on denitrification efficiency [
2], which in turn depends on the operation of the activated sludge (AS) unit and on the quality of the treated water. When a poor carbon source is employed, denitrification is less efficient, with NO
2− accumulation potentially leading to process inhibition [
3]. Low denitrification efficiency is detrimental not only to the quality of the effluent wastewater but also to the magnitude and variability of harmful N
2O emissions [
2].
Efficient nitrate reduction cannot be guaranteed when municipal wastewaters are characterized by low C/N ratios or when the majority of the organic matter content has already been consumed during the aerobic stage [
4,
5]. Hence, an external carbon source is usually used to achieve the proper C/N ratio: methanol, acetate, and hydroalcoholic solutions are the most commonly used carbon sources due to their effectiveness and availability [
6], but they are expensive, contributing to a significant portion of the total operational costs of wastewater treatment plants (WWTPs) [
7].
Still, a wide variety of carbon sources can be used by heterotrophic bacteria, resulting in different denitrification kinetics and driving the development of different microbial communities in AS systems [
8].
Literature broadly reports that VFAs (volatile fatty acids), including formic, acetic, propionic, butyric, and valeric acid, are an effective carbon source for denitrification [
8,
9,
10,
11,
12]. VFAs are traditionally produced using non-renewable petrochemical sources, causing serious risks for either health or the environment [
13], but they can also be biologically produced from waste streams, including waste sludge, through acidogenic fermentation [
14,
15,
16]. Aimed at the implementation of circular valorisation pathways at WWTPs by recovering the chemical energy contained in wastewaters, the VFA-rich liquid resulting from anaerobic fermentation of waste sludge could be reused on site as a carbon source in denitrification, being a valid alternative to conventional external carbon sources [
17,
18]. Internal reuse of VFAs from sludge fermentation in the same WWTP is particularly interesting, as VFA recovery for external reuse might be challenging from technical and regulatory perspectives [
14].
Several authors confirmed that the specific denitrification rate (SDNR) using fermented liquid (FL) is comparable or higher with respect to the synthetic mixtures traditionally used as carbon sources [
6,
10,
19,
20,
21], as shown in
Table 1. Both parallel [
7,
22] and sequential consumption [
19] of single VFAs within a mixture of them are reported in the literature, thus highlighting the importance of specific process conditions in addition to the hypothesized metabolic pathways. In addition, wide ranges of single VFA concentrations in the FL mixture used are reported by authors as, among the cited works, acetate varies in the range 15% to 35%, propionate in the range 15% to 30%, butyrate and iso-butyrate in the range 8% to 45%, valerate and iso-valerate in the range 5% to 20%, and caproate and iso-caproate in the range 0% to 45% [
6,
11,
21].
In general, regarding single VFA consumption, the considerable variability of the uptake rate of specific VFAs has to be ascribed to the significantly variable experimental conditions adopted in different studies (such as continuous vs batch study, COD/N ratio, temperature, substrate concentration), as well as to biomass origin (operating conditions of the AS unit) and adaptation [
11]. In addition, a complete understanding of the utilization hierarchy of different VFAs by heterotrophic bacteria in the denitrification process is still missing but would be essential to properly optimize the integration of sludge fermentation with wastewater denitrification processes. For instance, according to Elefsiniotis and Wareham [
19] and Sapmaz et al. [
23], acetic acid is used more easily since its degradation, following the β-oxidation mechanism, produces acetyl-CoA directly. Conversely, C
3–C
6 VFAs follow more complicated metabolic pathways, requiring sequential β-oxidation processes and leading to a lower denitrification rate or subsequent consumption with respect to acetate when using a mixed VFA substrate. On the other hand, other authors [
24,
25] reported that propionate and butyrate might promote faster denitrification in comparison to acetate due to their higher electron equivalent content.
At present, research and application examples of dosing FL from waste sludge fermentation to enhance denitrification at full-scale WWTPs are, to the best of our knowledge, not reported by final users. In this study, a hybrid approach linking lab-scale testing and full-scale application is proposed. The objectives of this work were: (1) To assess, at the laboratory and at the full scale, the impact of the FL generated from the acidogenic fermentation of waste sludge as an external carbon source for wastewater denitrification; (2) to evaluate the SDNR and utilization hierarchy of different short-chain fatty acids and VFAs mixture in comparison with two commercial hydroalcoholic solutions; (3) to fine-tune a manometric technique to measure denitrification kinetics, as an effective tool for the assessment of activated sludge activity and for the fast and reliable monitoring of the quality and efficiency of different carbon sources; (4) to evaluate, thorough mass balances, the effect of FL dosage at the full-scale WWTP on nitrogen removal. The novelty of this work lies in the proposal of a simple and effective procedure to monitor the evolution of the denitrification rate in full-scale WWTPs as well as for the comparison of the denitrification potential of different carbon sources, including locally produced fermented liquids. Furthermore, more than 65% of the consulted literature regarding denitrification with VFAs was indeed published before 2010, indicating that more recent insights might be valuable for this topic.
Table 1.
SDNR for different C sources, adapted from Elefsiniotis et al. [
11].
Table 1.
SDNR for different C sources, adapted from Elefsiniotis et al. [
11].
| Organic C Source | SDNR Range
[mg N-NO3 gVSS−1 h−1)] | Reference |
|---|
| Methanol | 6.1–12.0 | [6,10,12,21,26] |
| Acetate | 0.7–25.1 | [6,7,10,12,21,26,27,28,29] |
| Propionate | 0.3–15.1 | [7,10,12] |
| Butyrate | 7.7–21.6 | [10,12] |
| Valerate | 7.1–20.3 | [10,12] |
| Acetate and propionate | 0.6 | [7] |
| Mixed synthetic VFA | 15.0–31.4 | [9] |
| FL | 0.5–16.8 | [6,11,21,30,31,32,33] |
2. Materials and Methods
2.1. Substrates Collection and Fermentation Unit
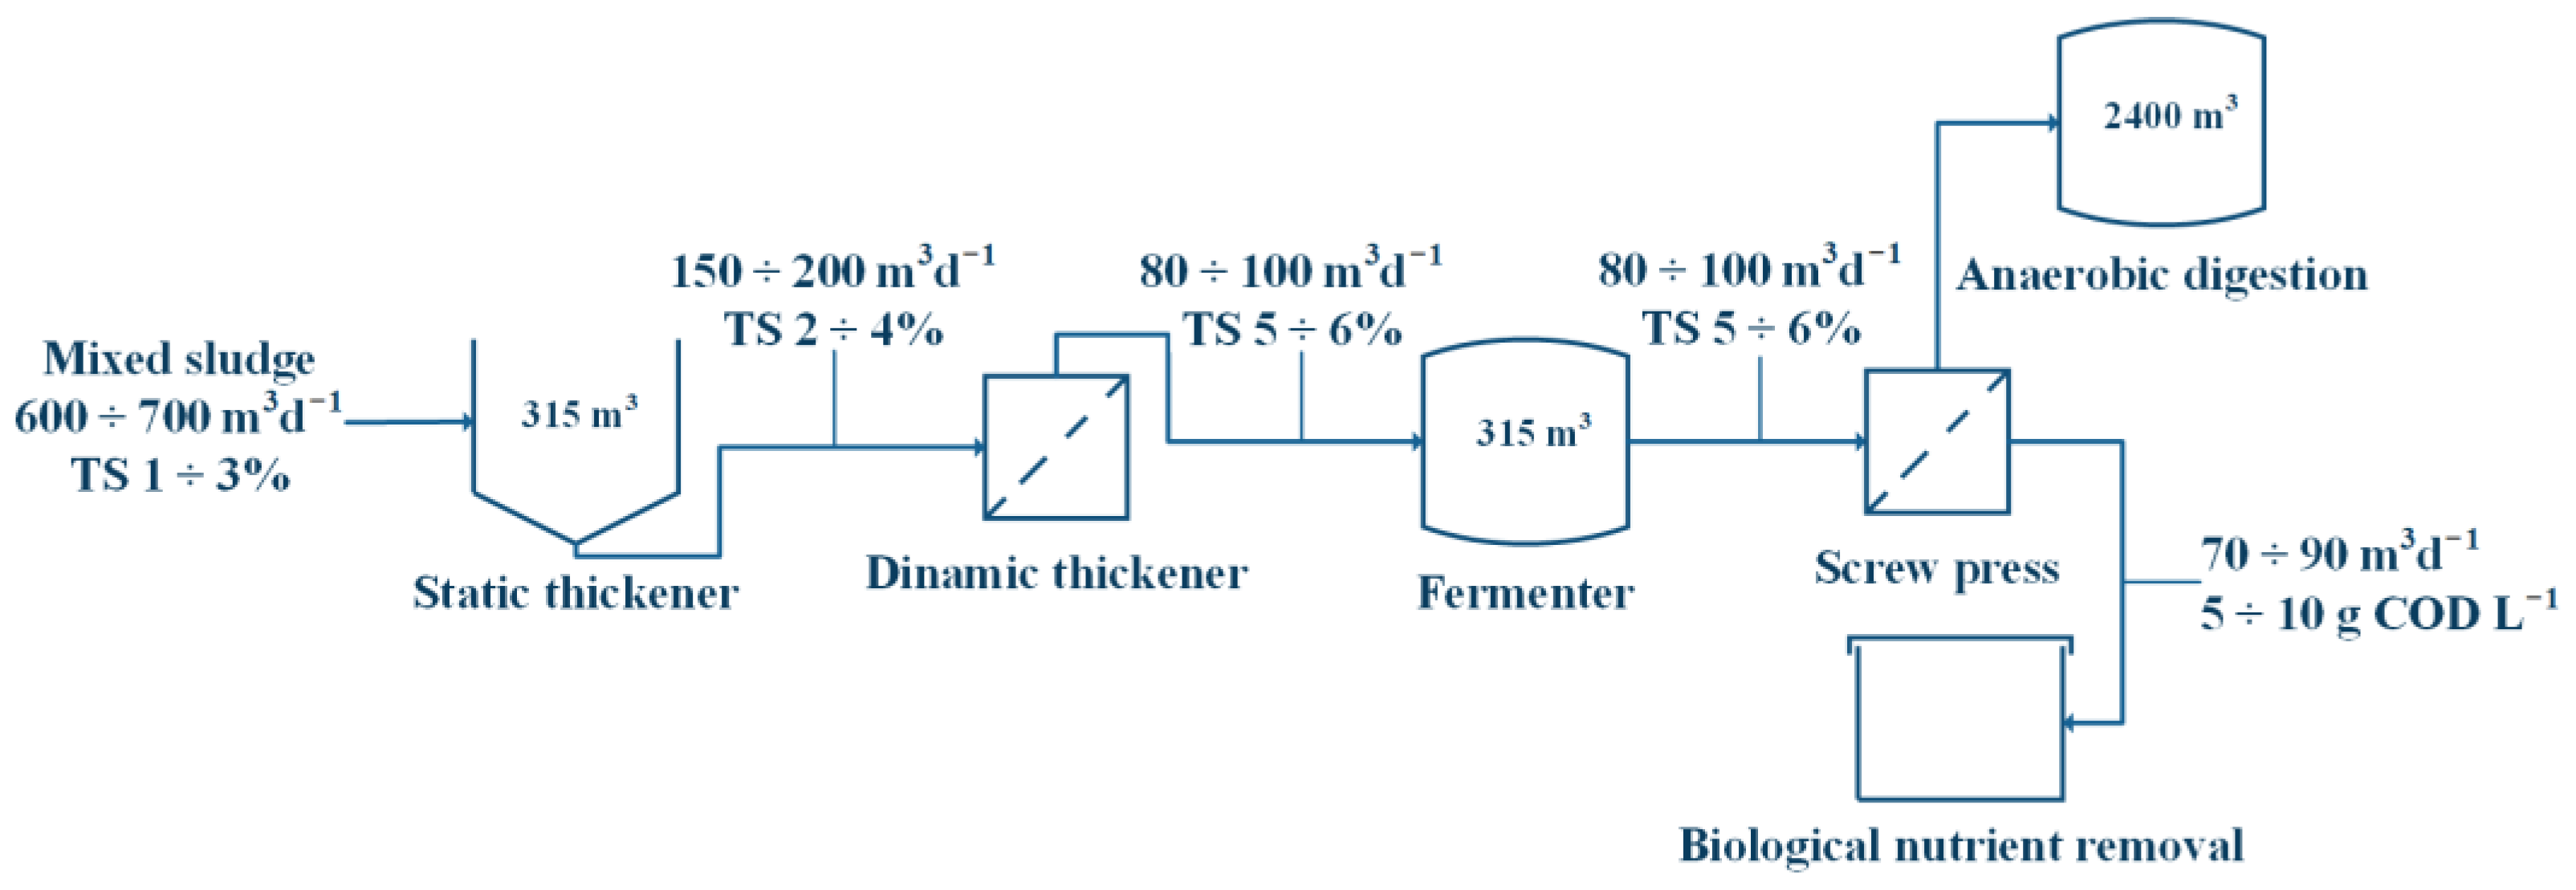
The inoculum used for testing the SDNR was sampled from the biological oxidation tank of the municipal WWTP of Sesto San Giovanni (Milan area, Italy 45°31′20″ N 9°15′23″ E) serving an area of 100,000 population equivalent. The FL used as a carbon source was sampled at the fermentation unit of the same WWTP. This section is fed on mixed (primary and biological) waste sludge and consists of a rotary screw thickener, a mesophilic fermenter (organic loading rate of 10–15 kg TSS m
−3 d
−1, a hydraulic retention time of 2.5–10 d, an operative temperature of 18–25 °C), and a dewatering screw press. The dewatering unit separates the FL enriched in VFAs from the residual unfermented particulate solids that are further sent to anaerobic digestion. The overall scheme is reported in
Figure 1. The average acidification yield obtained for the full-scale fermenter was 0.19 ± 0.02 g VFA-COD g
−1 VS
in. Regarding the FL characteristics, they are dependent on the operative conditions (such as HRT, temperature, and OLR). The C/N/P ratio of the FL, where C is expressed as VFA-COD, N is expressed as N-NH
4+ and P is total soluble phosphorus, resulted in average relative ratios equal to 100/6.4/0.4.
2.2. Batch Denitrification Tests Procedure
The denitrification potential of each carbon source was tested in batches in duplicate, as described in [
34,
35]. Control batches without substrate addition were always included to measure the endogenous SDNR. All tests were carried out at 20 ± 0.5 °C with constant magnetic mixing. Glass bottles with lateral openings sealed with rubber septas were used. A working volume in the range 0.9–1 L was adopted using bottles of 1.14–1.15 L. NaOH pellets were located in the headspace for CO
2 removal. Sludge inoculum was diluted with tap water to a biomass concentration of 2 g VSS L
−1 in the final mixture, where biomass is expressed as volatile suspended solids (VSS). The synthetic VFA stock solutions were prepared at a concentration of 100 g COD L
−1. Acetate and propionate solutions were prepared starting from the sodium salts, while for butyrate and valerate, butyric acid and valeric acid were used, and the obtained stock solution was stabilized with concentrated NaOH (3M). Sodium nitrate salt was used for the preparation of a stock solution at a concentration of 20 g N-NO
3 L
−1. A manometric procedure was used to quantify the SDNR. Before the start of the test, each bottle was sealed, and the headspace was flushed with N
2 through the perforable rubber septa. Gas flushing plays a key role in removing residual oxygen from the gas phase. Indeed, oxygen would be initially used for aerobic processes, leading to pronounced lag phases before the onset of denitrification and resulting in a negative pressure from oxygen uptake. Once properly deoxygenated, bottles were placed in the thermostat to let them equilibrate to the operative temperature before starting the test: This precaution is crucial to avoid the recording of negative/positive pressure at the beginning of the test due to temperature-induced pressure changes. Finally, the required amount of stock solutions of organic carbon and nitrate was added through the rubber septa by a syringe. The headspace pressure was continuously measured through a manometric device (Oxitop
® Measuring Head, WTW); pressure data were then converted using the ideal gas law to determine the molar cumulative amount of nitrogen gas produced in time. The molar cumulative amount was converted into molar nitrate denitrified over time and then into a cumulative mass of nitrate denitrified. At the end of each test, nitrate concentration was measured on the sludge suspension to verify nitrogen balances.
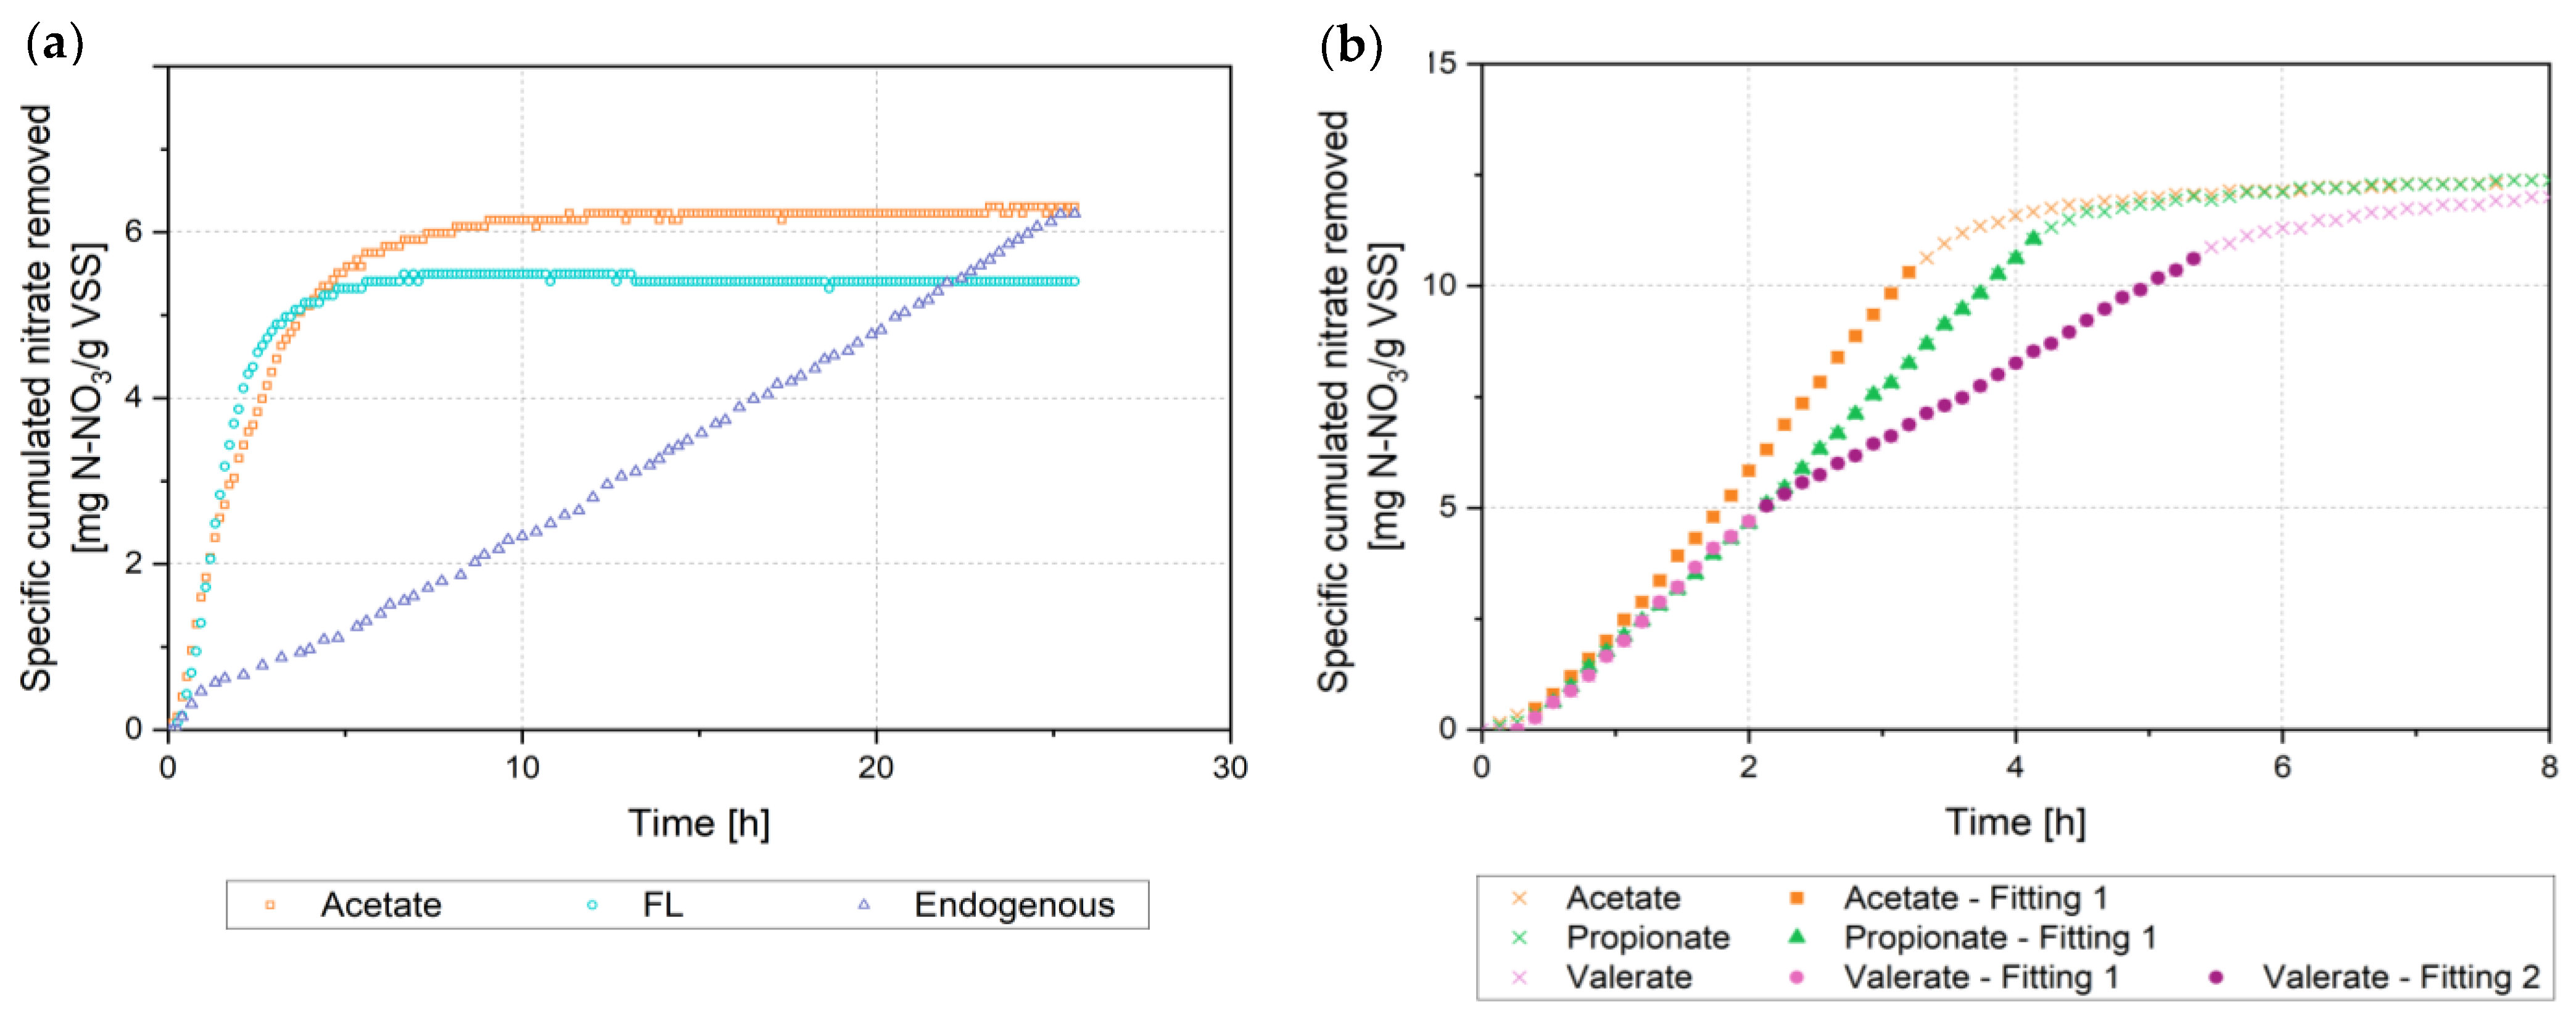
In
Figure 2, typical trends for different carbon sources are reported. The SDNR was assessed by regression of the cumulated curve of specific nitrate removed by manually selecting the appropriate linear section, as shown in
Figure 2b, before any inflection of the curve (indicating external carbon or nitrite full depletion). The accuracy of the estimation was evaluated through R
2 determination, which was always maintained at >95%. Net SDNRs were calculated by subtracting the contribution of the endogenous SDNR. In some cases, two SDNRs (later referred to as “SDNR
max” and “SDNR2nd”) were observed while testing specific carbon sources (e.g., valerate in
Figure 2b).
2.3. Experiment Setting
For all trials (i.e., a set of tests performed using the same sample of inoculum but different experimental conditions), acetate was always tested as a reference carbon source, and the observed SDNR was used to normalize those obtained on more complex organics by computing the ratio between the SDNR measured with the tested carbon source and the SDNR measured with acetate (later referred to as SDNRrel).
Preliminary trials (labelled P1, P2, P3, and P4) using single synthetic VFAs as carbon sources were performed to evaluate the influence of experimental conditions (i.e., COD/N ratio and initial nitrate concentration) on SNDR measures. Each single VFA was tested at different initial nitrate concentrations (30 and 70 mg N-NO
3 L
−1) and at two different COD/N ratios (2.5 and 6). These ranges were determined to be close to those of the WWTP operational conditions and to obtain a significant number of experimental points for the subsequent elaborations. Based on these results, since negligible effects of both nitrate initial concentration and COD/N were observed in SDNR estimates, the remaining trials (T1 to T11) were conducted using COD/N ratios in the range 1.8–10 and nitrate concentrations in the range 25–150 mg N-NO
3 L
−1. Accordingly, tests were operated under COD or nitrate-limiting conditions and set to guarantee an adequate number of pressure data points for a reliable assessment of the SDNR. The selection of the limiting substrate depends on the main purpose of the trial; if the anoxic biomass yield, Y
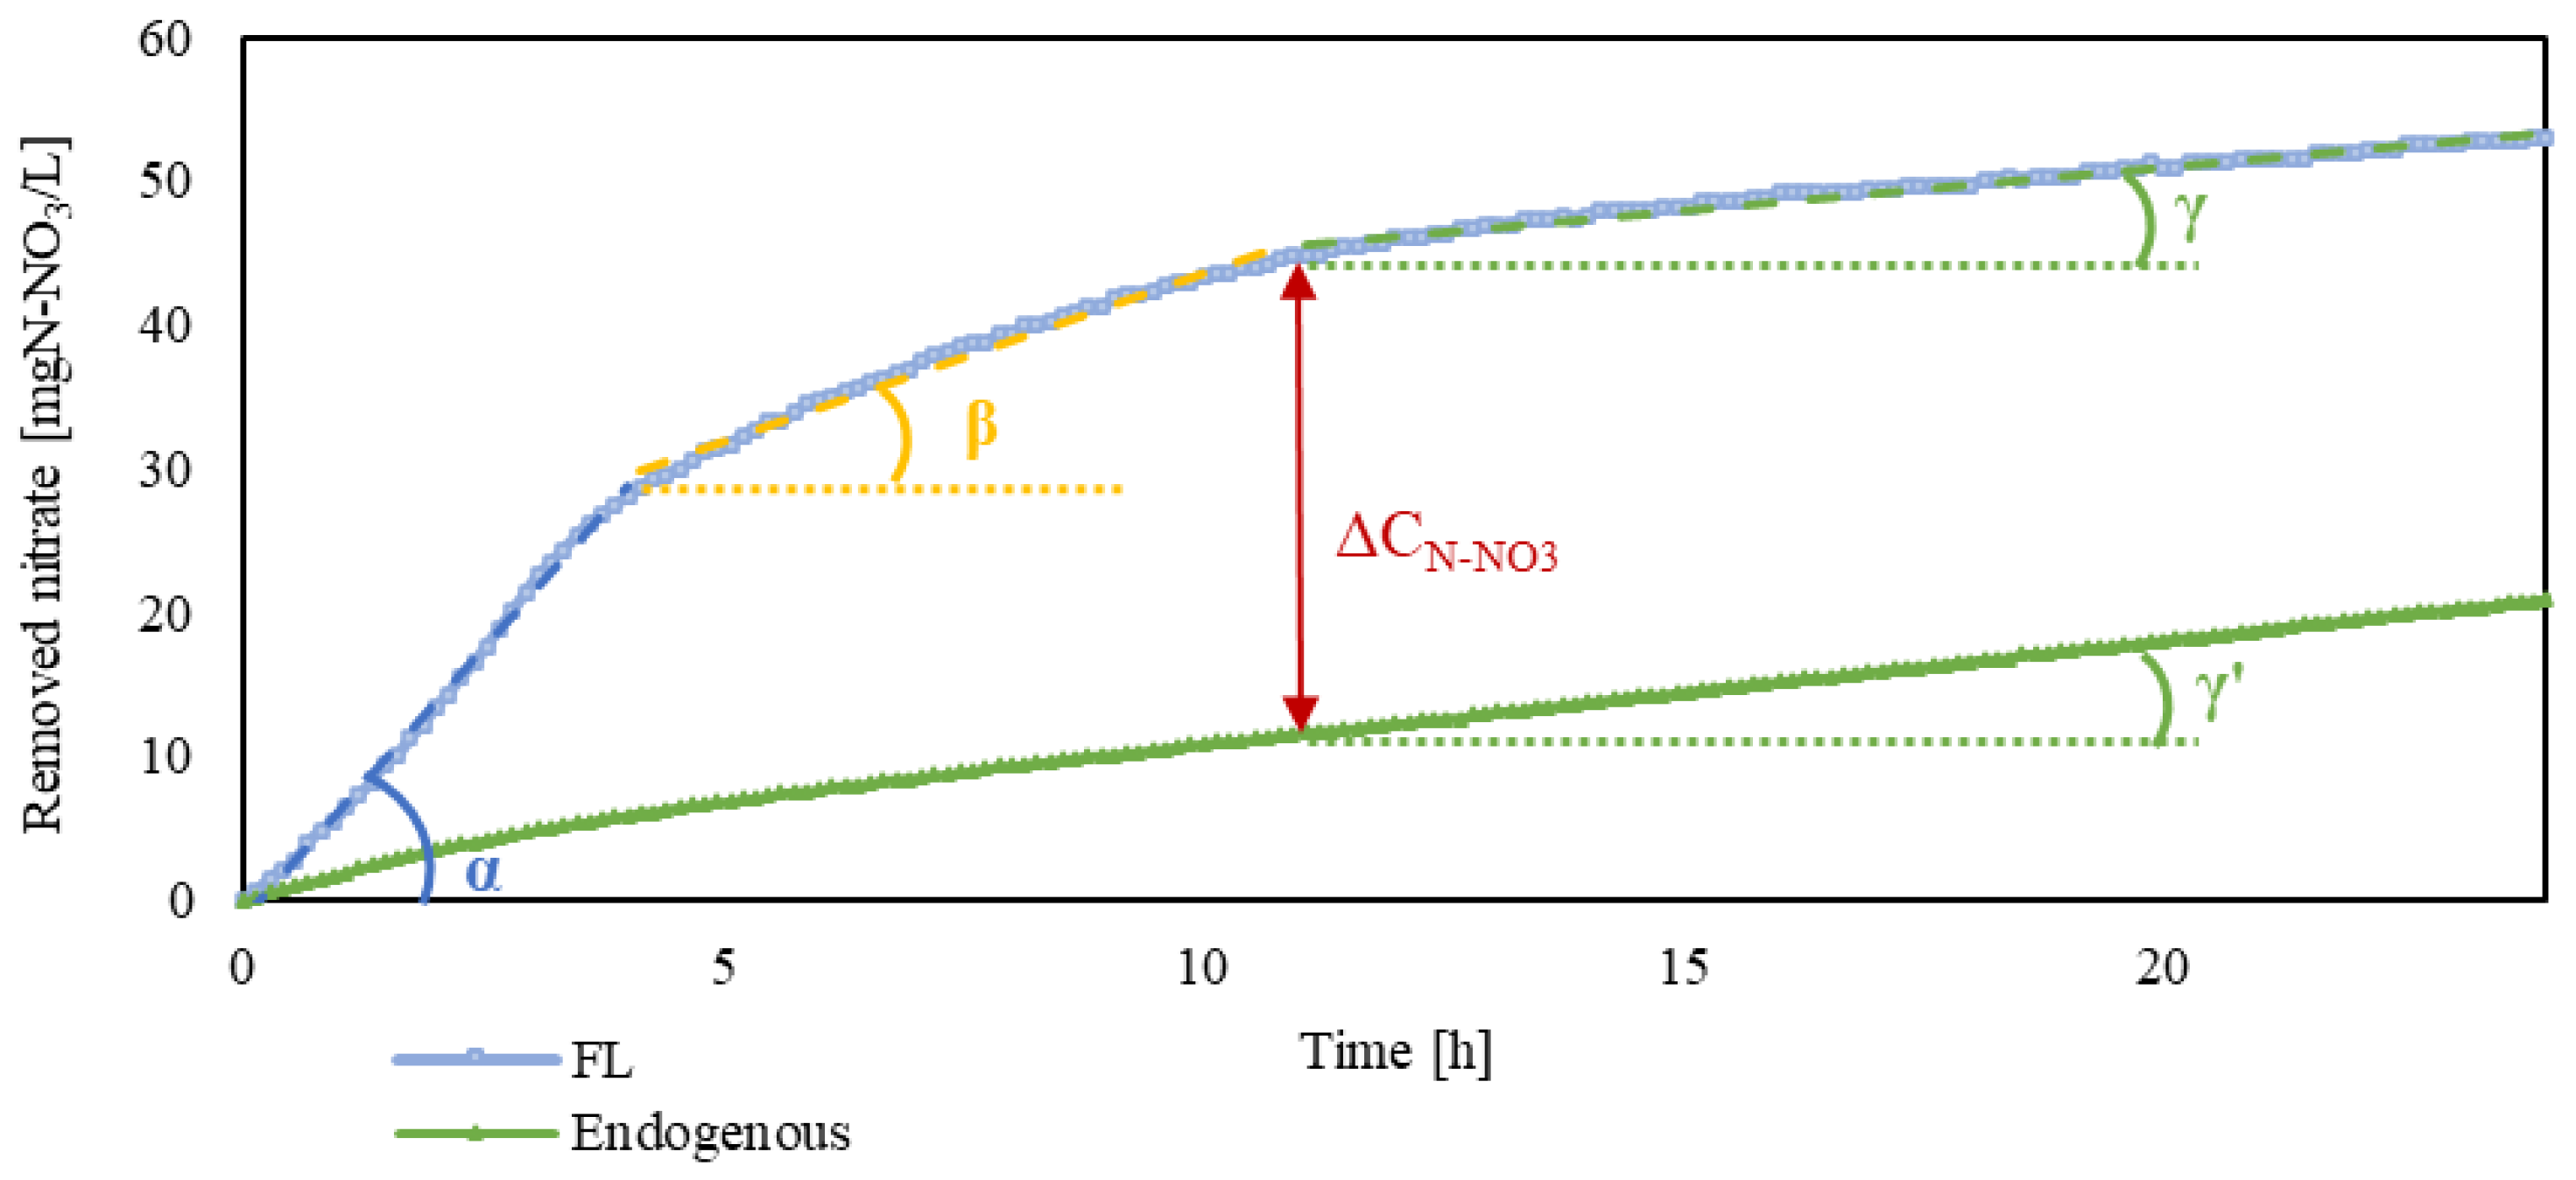
H, of the carbon source is the target, carbon limitation (low COD/N) is applied, and the yield is computed from the amount of nitrogen denitrified with the reference substrate only. A graphical explanation is reported in
Figure 3, exemplifying a test with carbon limitation. The two letters α and β represent the slopes obtained from the linear regression of the data points of exogenous denitrification, while γ is the slope of endogenous denitrification after the consumption of the carbonaceous substrate. The endogenous test is also reported in green, where the slope of the linear regression, γ′, is indeed equal to the one of the exogenous test, γ, after the carbonaceous substrate consumption. The difference between the cumulated exogenous nitrate removed and the endogenous one, Δ
CN-NO3 (in mg N L
−1), is indicated by the red line, and it is used to compute Y
H according to Equation (1).
where 2.86 mg COD mg
−1 N-NO
3 is the stoichiometric COD equivalent for nitrate and C
C,0 is the initial concentration of the carbonaceous substrate (in mg COD L
−1).
Conversely, nitrogen limitation (high COD/N ratio) conditions allow for the validation of the nitrogen mass balance without the need to measure the final nitrate concentration. As for the SDNR, it is computed similarly in both conditions (COD and N limitation).
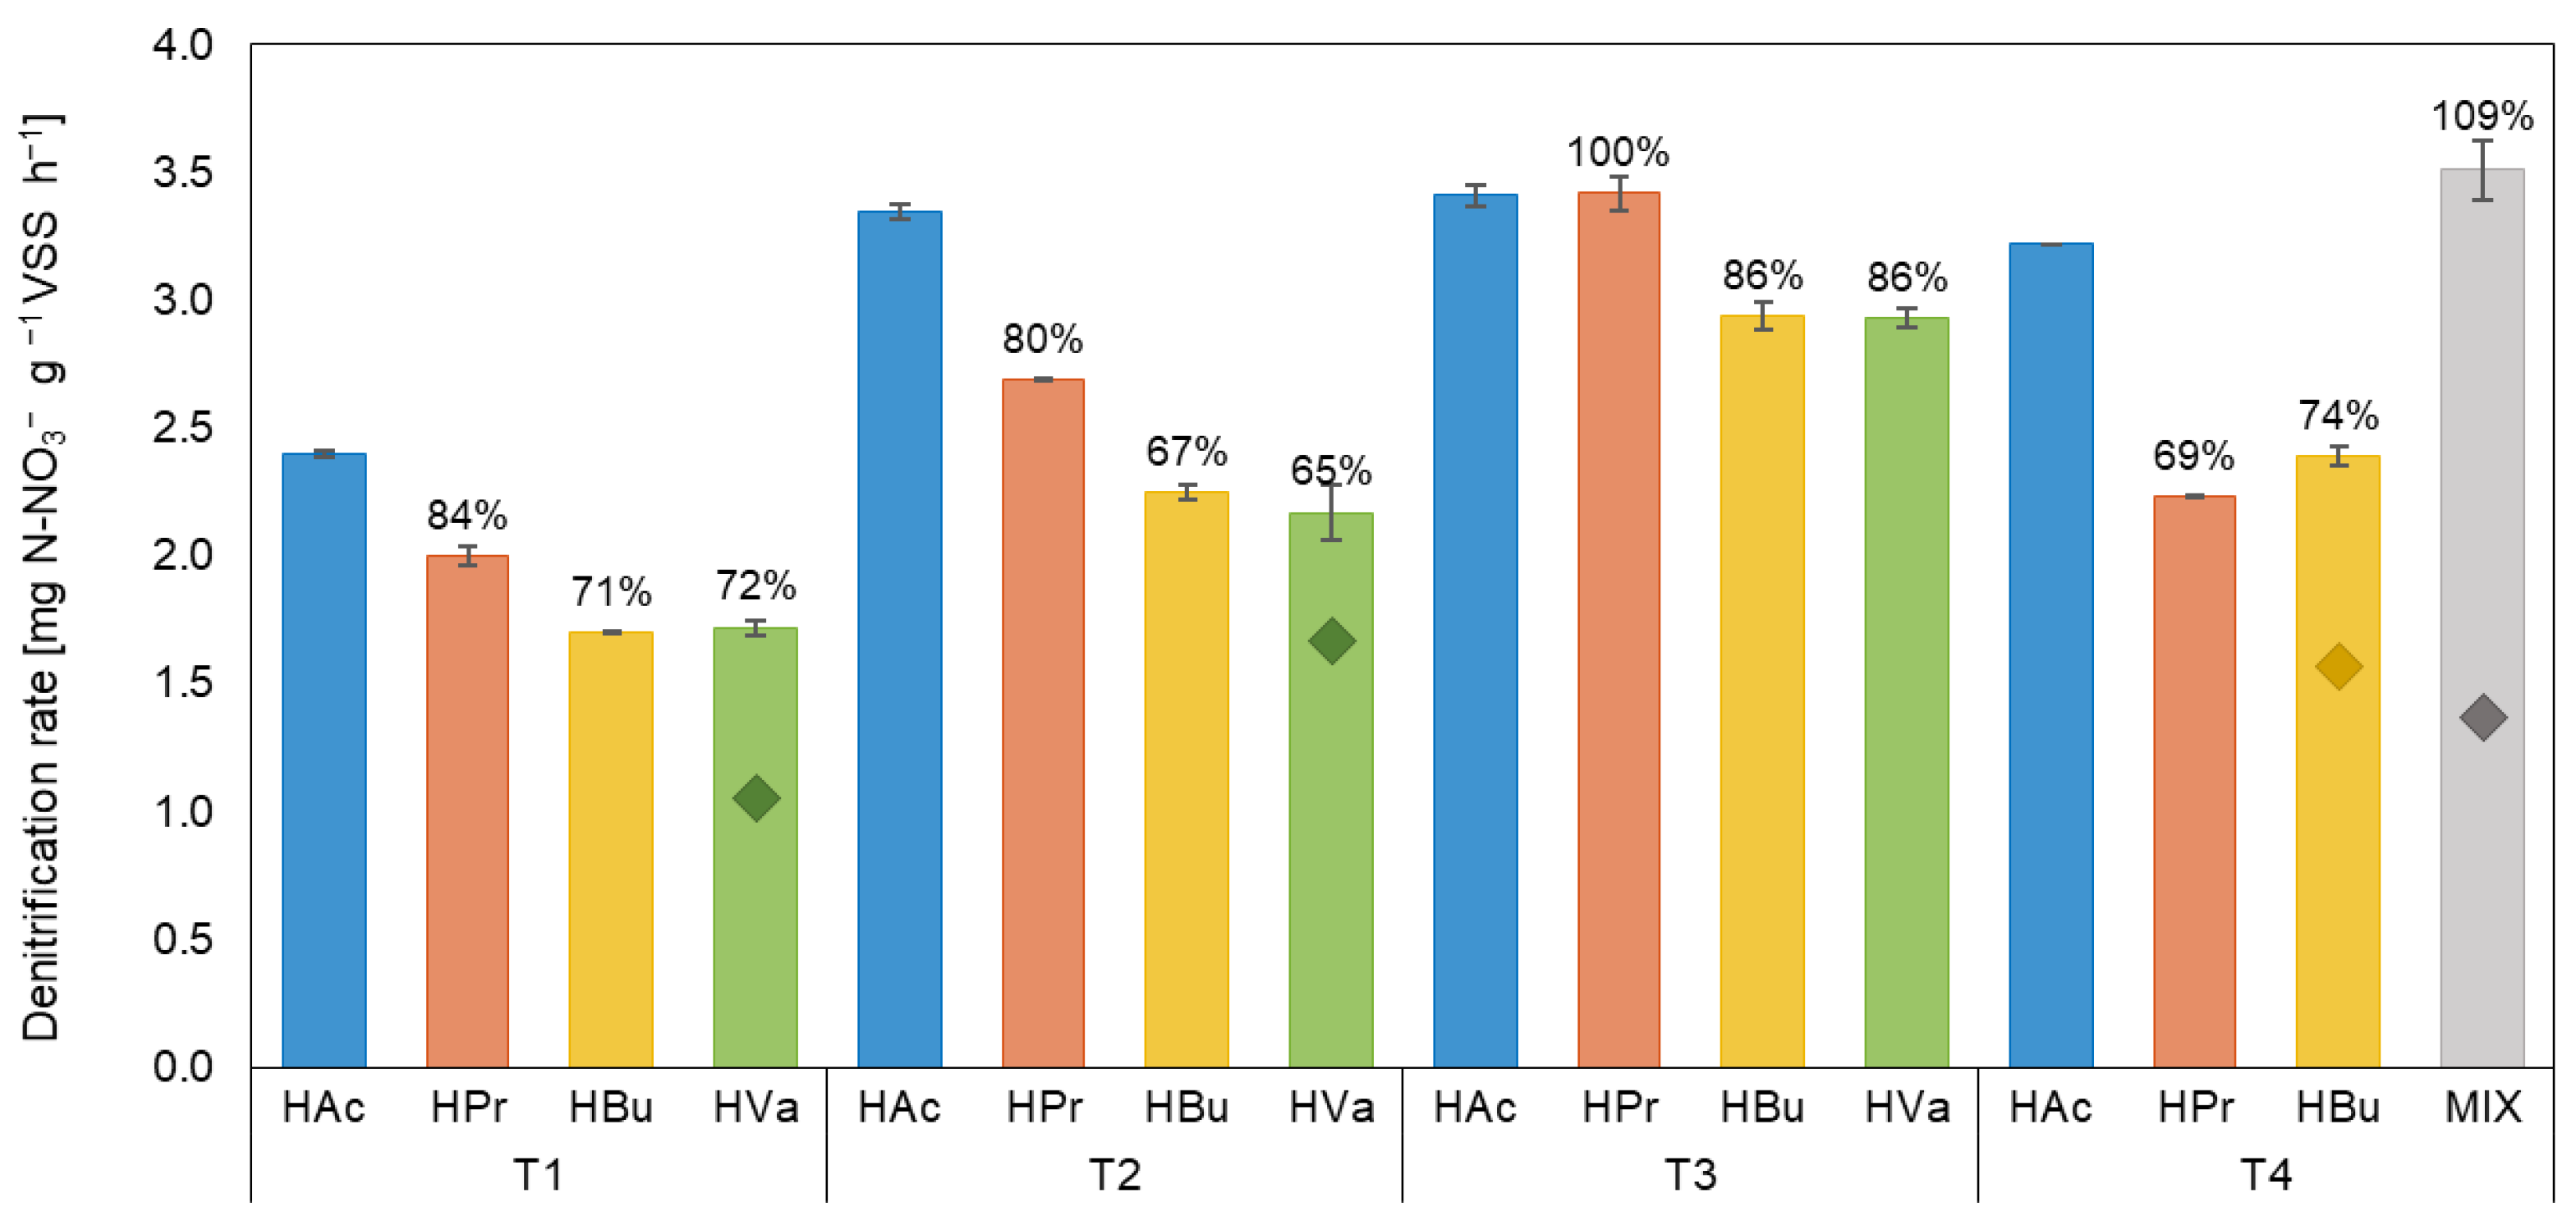
In trials T1 to T4, synthetic acetate (HAc), propionate (HPr), butyrate (HBu), and valerate (HVa) were separately tested. In addition, a synthetic VFA mixture (labelled as MIX) was tested in trial T4. The mixture was composed of HAc, HPr, and HBu in concentrations (COD basis) of 38%, 38%, and 24%, respectively. Trial T3 was performed by adding the carbon source and nitrate at the end of trial T2, therefore using an acclimated biomass to verify acclimation effects.
When the FL was used as a carbon source (trials T5 to T9), the soluble COD and VFA concentrations were determined on each FL sample right before the beginning of the experiment. Finally, two commercial hydroalcoholic solutions, methanol-based and acetic acid-based (labelled CSM and CSA, respectively), were tested in trials T10 and T11. Specifically, SCA samples were selected since their performances at the full-scale WWTP were worse than those observed in standard supplies.
2.4. Full-Scale WWTP Balances
The Sesto San Giovanni WWTP is provided with two different biological treatment lines: one is featured with a biofiltration section (Biofor® by SUEZ Water Technologies) including pre-denitrification, nitrification, and post-denitrification sections; the second one, treating 25–30% of the overall flow rate (7000 m3 d−1), includes a conventional suspended growth AS unit with pre-denitrification.
The VFA-rich FL from the acidogenic fermentation is dosed in the anoxic tanks of the AS unit, where it is used as an external carbon source to ensure a more complete denitrification. When the FL is not available, commercial hydroalcoholic solutions are used instead.
To assess the influence of VFA dosage on the AS performance, a nitrogen mass balance, as reported in [
1], was performed over the AS section comparing phases with and without FL dosage, and a T-test was applied at a significant level of 5% on the two data series to evaluate the statistical significance of observed differences (SPSS Statistics v. 28 software).
2.5. Analytical Methods
Suspended solid content (TSS and VSS) was determined according to Standard Methods 2540 (APHA et al., 2005 [
36]). The pH was directly measured in samples by means of a portable multiprobe meter (Hach-Lange, HQ40D DANI Master GC (Dani instruments spa, Italy)). The VFAs (acetic, propionic, isobutyric, butyric, isovaleric, and valeric) concentrations were determined according to Standard Methods 5560 [
36] using a gas chromatograph (DANI Master GC) coupled with a flame ionization detector. Nitrate and soluble chemical oxygen demand (sCOD) were measured using spectrophotometric test kits (Hach-Lange) on 0.45 μm filtered samples.
3. Results and Discussion
3.1. SDNRs on Single VFAs
Table 2 details the results obtained in preliminary denitrification tests carried out with single VFAs under different initial COD/N ratios. Net and relative (with respect to acetate) SDNR values are reported.
Since test conditions had a negligible effect on SDNR estimates, the following trials from T1 to T11 were set at variable COD/N ratios, carefully selected to investigate carbon or nitrogen-limiting conditions and to simultaneously optimize test duration and the number of pressure data points acquired for subsequent linear regression and SDNR estimation.
Figure 4 reports SDNR values obtained with synthetic VFAs in trials from T1 to T4; when applicable, the second SDNR is also shown.
Results suggest that these acids are effective in promoting denitrification when used either individually or in mixed solutions. Acetic acid is typically the one showing the highest rate in single acid tests, while a decreasing trend of the SDNR with the complexity of the C-source is observed in the majority of the trials, consistent with most of the data from the literature [
19,
30], even though it is also suggested that HBu can be consumed more easily than HPr [
25,
37]. The preference for different single VFA consumptions is likely dependent on the microbial community [
24].
Moreover, when dosing more complex carbon sources (HBu, HVa, and VFAs mix), a correspondingly more complex dynamic in the shape of the cumulative N
2 production curve was observed, showing an initial faster N
2 production followed by a slower denitrification phase with a quite sudden transition from the fast to the slow phase (in trials 1, 2, 4, and 5). The second lower rate varies from 39% (T4-MIX) to 77% (T2-HVa) of the maximum rate obtained in the same test. This evidence could be explained by the production of intermediate organic or nitrogenous products (such as N
2O or NO
2−) that are later consumed at a slower rate. Since for less complex VFAs, such as acetate and propionate, this behaviour is not observed, it is more likely that the organic intermediates are responsible for the presence of two SDNR values, as observed by Li et al. [
25]. Nevertheless, the build-up of intermediate nitrogenous products cannot be excluded, as it is suggested in literature [
6] that different organic sources might lead to different dynamics in nitrite accumulation [
38]. Regarding this aspect, the main drawback of the manometric procedure is the impractical sampling during the trial for reaction intermediate identification. On the other hand, having undisturbed trials is of great importance for a better SDNR estimation, with continuous evaluation of the overpressure by the online monitoring system.
Trial T3 was carried out using the biomass sampled directly from the batches of trial T2, which was thus acclimated and adapted to complex VFA utilisation from the previous trial. By comparing the SDNR from T2 and T3, the effect of acclimation can be estimated. All relative rates increased substantially (from 80% to 100%, from 67% to 86%, and from 65% to 86% for HPr, HBu, and HVa, respectively). Conversely, the acetate SDNR remained constant (3.35 ± 0.06 mg N g
−1 VSS h
−1) and 3.41 ± 0.08 mg N g
−1 VSS h
−1 in T2 and T3, respectively. This highlights how adaptation to acetic acid is negligible while, for more complex acids, acclimation and adaptation play a significant role in improving the ability of bacteria to use C
3–C
6 VFAs as carbon sources. The synthetic mix tested in T4 showed a maximum relative rate equal to 109%, thus displaying faster kinetics than the sole acetate. These results suggest the simultaneous consumption of the single VFAs in the mixture, leading to an additional effect on the SDNR. This observation is consistent with data from the literature [
6,
11,
21,
22], even though Elefsiniotis and Wareham [
19] reported only consequent consumption of the more complex acids.
3.2. SDNRs on Fermented Liquid Samples and Commercial Carbonaceous Solutions
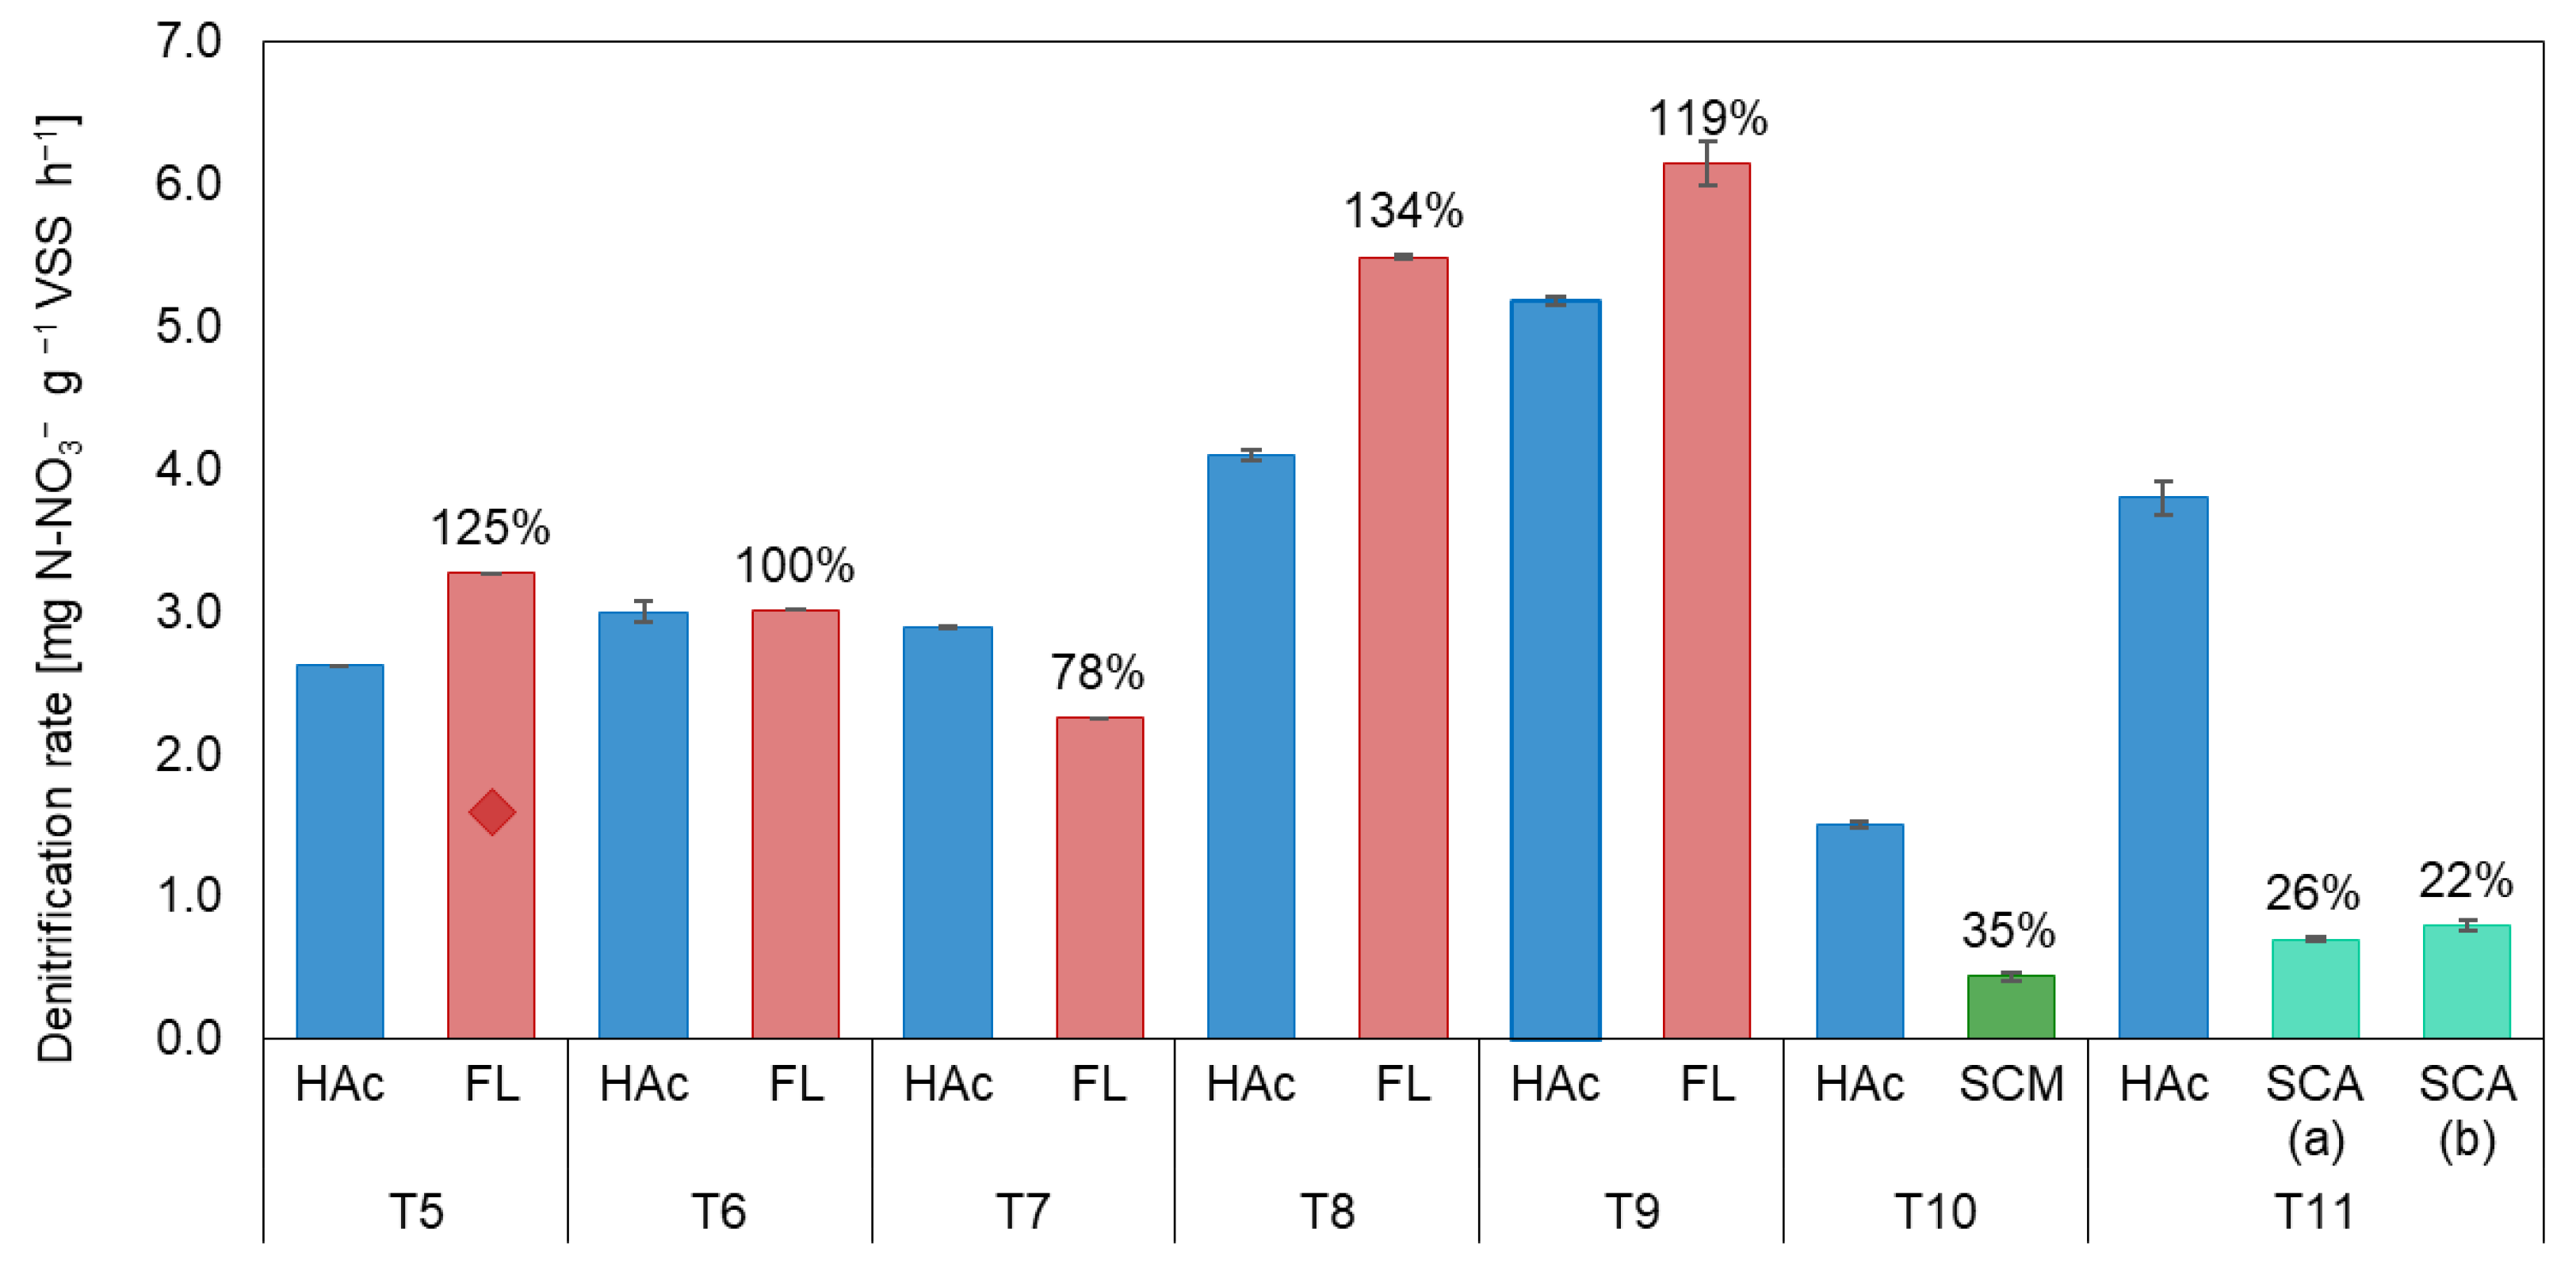
Figure 5 shows SDNR values obtained with the FL and commercial hydroalcoholic solutions (trials from T5 to T11). In addition,
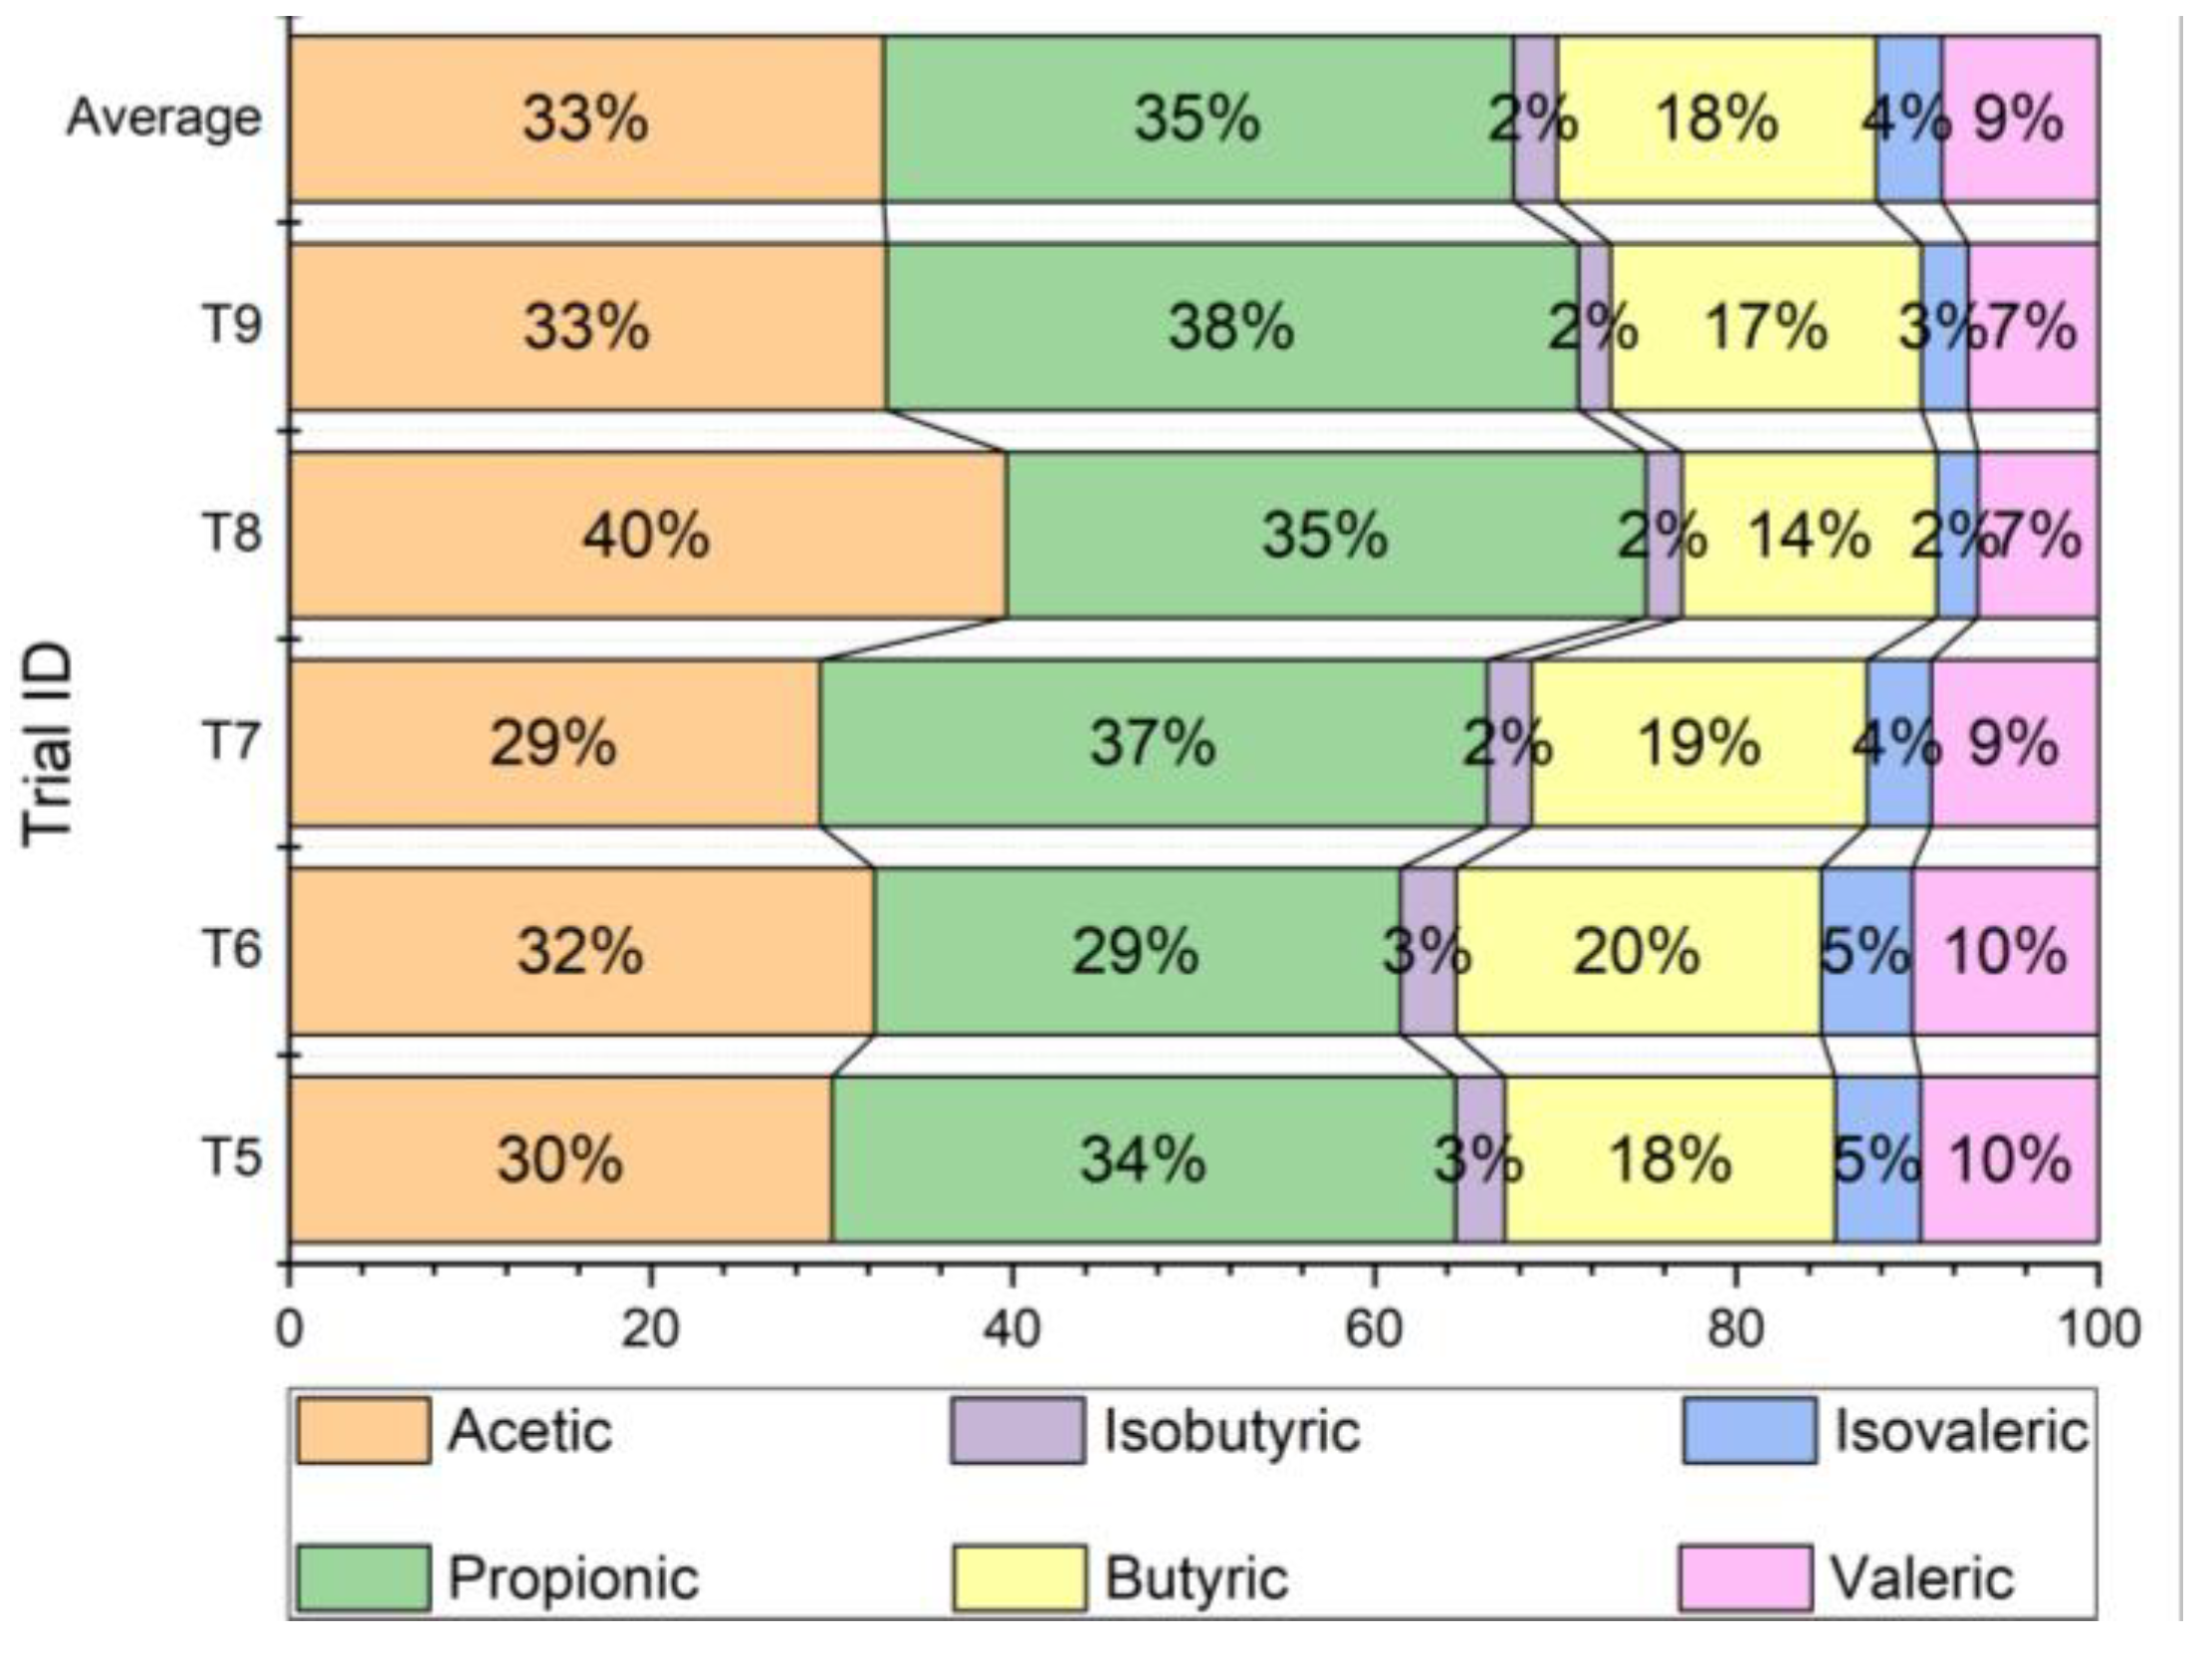
Figure 6 reports the VFA percentage distribution of the FL used in trials T5–T9, as well as the average composition of FL samples collected at the WWTP.
Consistently with what was observed in trial T4-MIX, results obtained with the FL also indicate a parallel consumption of VFAs; the relative maximum rate varied in the range 78% ÷ 134% with an average value of 111% (±22%) with only one trial, out of five, with a relative maximum rate lower than 100%. That trial was also characterised by the lowest COD/N ratio tested (T7-FL), equal to 1.8, which may have affected the accuracy of the SDNR calculation over a limited data set. Indeed, as reported above, preliminary trials (P1–P4) have shown a negligible effect of initial nitrate concentration and COD/N ratio on the SDNR magnitude. Nevertheless, a higher initial nitrate concentration means a longer denitrification reaction, thus a higher number of experimental data points that lead to a better estimation of the SDNR.
Moreover, it is interesting to link the SDNR with the VFA composition of the FL, reported in
Figure 6. The test showing the best relative SDNR (T8-FL) is characterised by the highest acetate concentration in the mix and the lowest concentrations of butyric and valeric acids. Conversely, the lowest SDNR was obtained (T7-FL) for the FL with the lowest acetate concentration (29%). This aspect adds to the hypothesis, reported above, regarding possible other reasons to explain the low SDNR obtained in test T7-FL.
The values of SDNR obtained in this study are in the range of data observed by other authors and reported in
Table 1. Some authors [
7,
11,
20,
27,
29,
32] observed lower SDNR, while other studies [
10,
21,
31,
33] reported greater rates (up to 30 mg N g
−1 VSS h
−1). On the other hand, it should be noted that the highest SDNR observed by Yatong (1996) [
10] was obtained in semi-continuous conditions with acclimated biomass and considering simultaneous nitrate and nitrite reduction. Acclimatization has a significant effect on the SDNR magnitude (as also highlighted in this study comparing trials T3 and T2, where acclimation occurred). In general, the great variations in operation procedures reported in the literature are likely responsible for the wide range of SDNRs observed.
Finally, commercial hydroalcoholic solutions (SCM and SCA) used in the post-denitrification process at the WWTP showed lower SDNR compared to those obtained with VFAs. Relative rates resulted in 35% for SCM and 26% and 22% for two different SCA samples. It is clear how the FL produced in the WWTP can significantly improve denitrification performances and reduce operational costs.
3.3. Denitrification Tests as a Tool for BNR Monitoring
Denitrification tests on acetate were also performed to track the time evolution of the denitrification activity in the AS tanks of the WWTP. During the monitoring period (from December 2019 to September 2021), a high variability is observed, with values ranging from 1.3 to 4 mg N g
−1 VSS h
−1. This evidence suggests that the active fraction of denitrifying bacteria has been changing significantly during the experimental period. These variations, as the testing conditions were kept the same, can be attributed to either a change in the AS operation parameters, especially in the sludge retention time and/or to differences in the AS loading rate. As for the sludge retention time, it was always kept in the range 20–25 days. As for the loading rate, the lowest SDNR values were measured during periods characterized by heavy rainfalls, likely causing an overload of organic particles that are mobilised from the sewage systems. These particles would contribute to the VSS in the AS, leading to a transient reduction in the biomass active fraction and therefore to a reduction in the SDNR. The assessment, via a simple method, of the SDNR can be a useful monitoring tool in plant operation, providing informative data to be used in the calibration/validation of biological models [
39].
For instance, besides SDNRs, batch denitrification tests can also return stoichiometric data when tests are performed under COD-limiting conditions (see
Section 2.3). In tests P1–P4, the anoxic growth yield (Y
H) of synthetic VFAs was found in the range 0.50–0.70 mg VSS mg
−1 COD, being on average 0.63 ± 0.09, consistent with data from the literature [
27,
34]. Regarding FL, from trials performed in COD-limiting conditions, Y
H resulted, on average, 0.72 ± 0.06, suggesting that FL supports a slightly larger growth yield.
3.4. Consistency with Mass Balances at the Full Scale
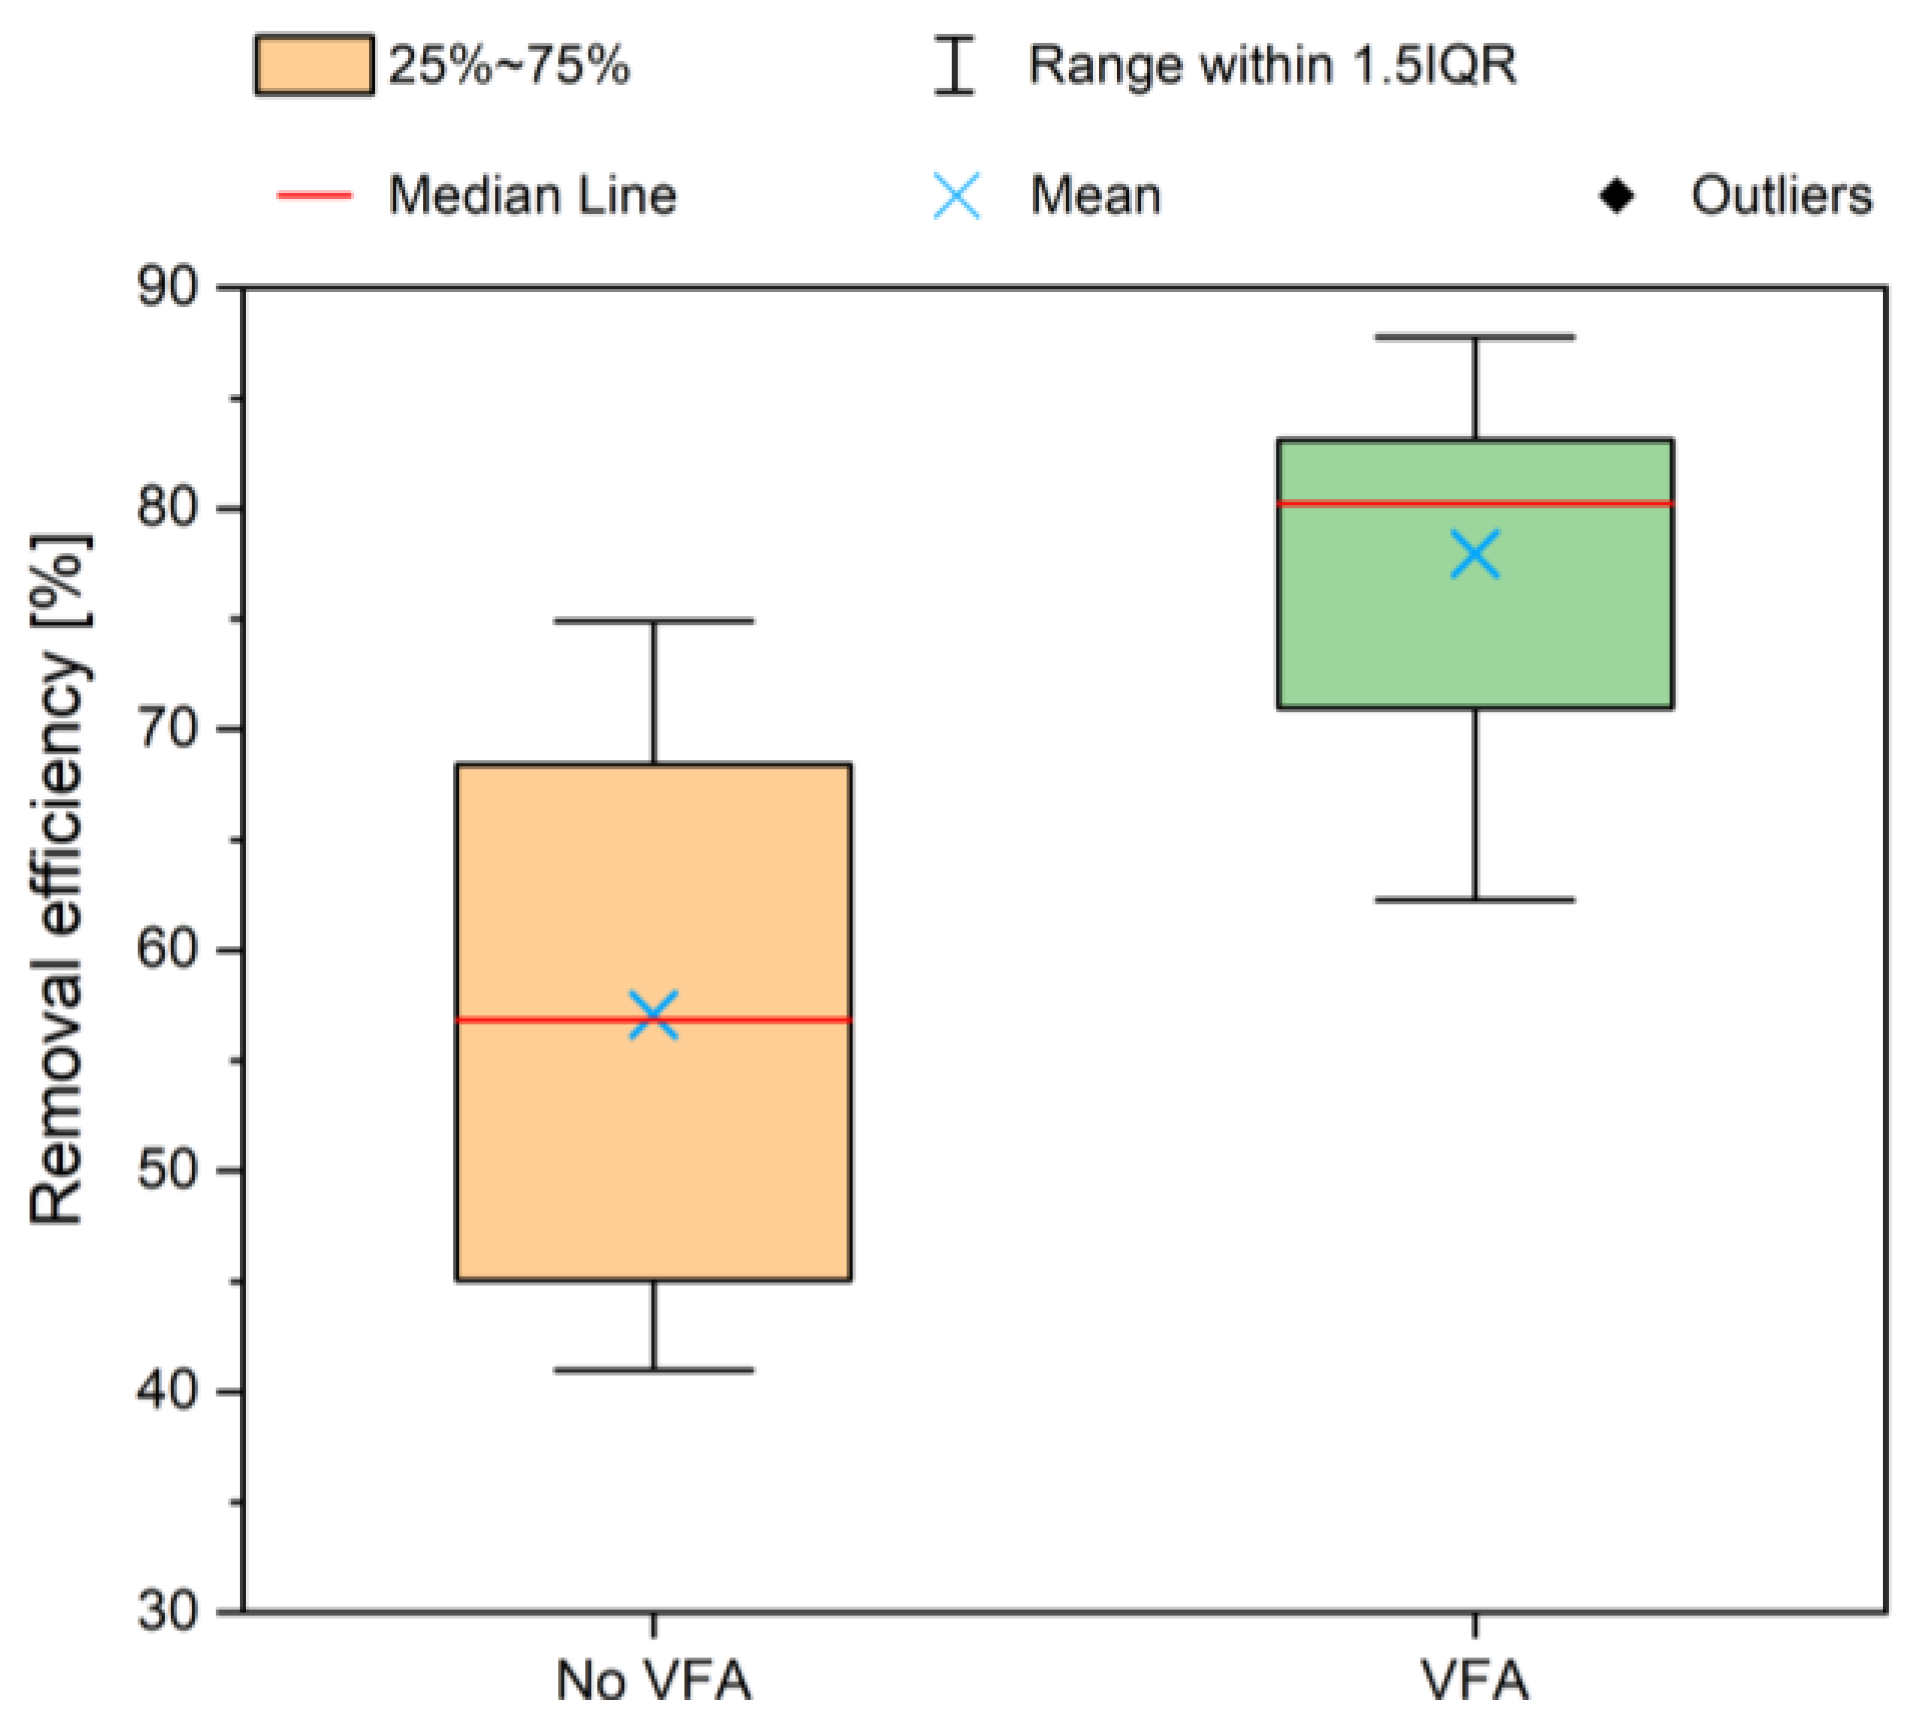
The results shown in the boxplot (
Figure 7) provide an interesting overview of the effect of the FL dosage on the AS treatment line of the WWTP. The average nitrogen removal efficiency was 57% without and 78% with the VFA dosage. VFA dosage seems to have a positive and significant impact on removal efficiency. Indeed, comparing the two data sets, by the
t-test, a
p-value of 0.002 was obtained, thus confirming that the nitrogen removal at the WWTP scale is, on average, significantly greater when VFAs are dosed. VFA dosage is therefore able to enhance denitrification at a full-scale AS application.
Furthermore, the variability of the N removal efficiency is lower in the presence of VFAs, with the interquartile range equal to 12.7%, while it is 26.7% without dosage. The lower variability is very important for plant management, as VFA dosage gives more uniform and predictable results, favouring a more efficient and stable denitrification process and consequently facilitating plant operation.
Considering a daily flow of 7000 m3 d−1, which is treated on average by the AS located at the full-scale WWTP, and a nitrogen inlet concentration equal to 24.4 mg N L−1 (average for the years 2020–2022), the daily inlet is on average equal to 171 kg N d−1. During the period of continuous VFA dosage, the daily COD mass flow due to the FL dosage was 460 kg COD d−1 on average. The COD/N ratio for the AS, considering only VFAs dosage, is therefore equal to 2.69 g COD g−1 N, which points out that the dosed VFAs significantly contributed to the overall denitrification potential.
Furthermore, the improved denitrification efficiency is usually related to the reduction in greenhouse gas emissions as the production of N
2O is reduced [
2].
4. Conclusions
Denitrification tests highlighted the effectiveness of VFAs in promoting denitrification. Greater SDNRs were usually observed for the mixed VFA substrates, indicating a parallel consumption of different acids and an additive effect. This was also observed for VFAs from sludge fermentation. Mass balances performed at the same WWTP highlighted the improved removal efficiencies obtained in the activated sludge treatment due to FL dosage. The evaluation of VFA dosage effects in full-scale WWTP is of great significance, and very few applications have been reported in the literature so far.
Moreover, manometric batch tests proved to be an efficient tool for the monitoring of heterotrophic biomass activity under anoxic conditions, as is the case with conventional respirometry under aerobic conditions. Indeed, it was demonstrated how the AS biomass can differ in terms of specific denitrification activity within a WWTP and within a short time span. Similarly, these same assays can be applied to compare the effectiveness of different carbon sources, including single organics, fermented liquid, and commercially available hydroalcoholic solutions.
Further insights into this topic would include the identification of intermediate compounds produced during the denitrification of C4–C5 volatile acids, the study of kinetic aspects as indirect carbon sources for denitrification, investigating the influence of the microbial community on the VFA utilization hierarchy, and techno-economic and life cycle assessment evaluations when selecting different carbon sources to foster the denitrification capacity in WWTPs.


